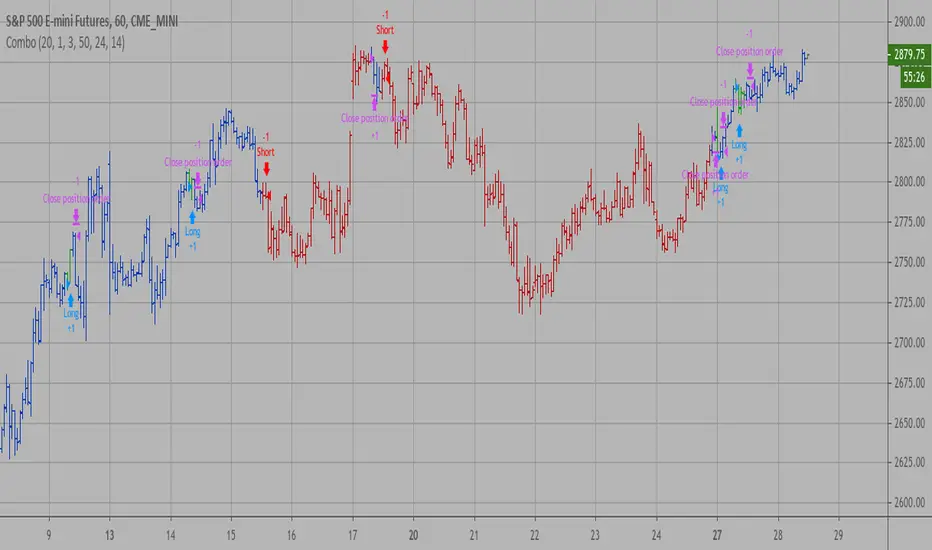
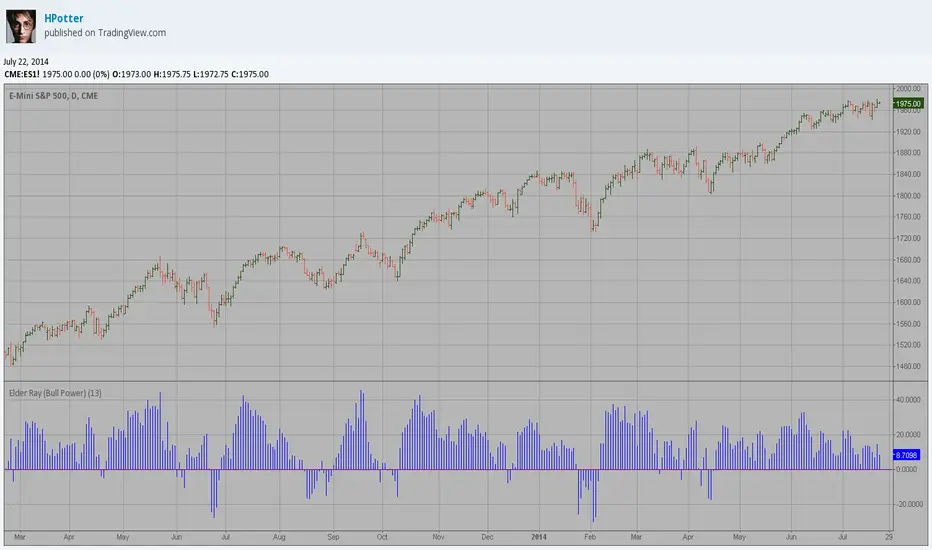
Combo Backtest 123 Reversal & Elder Ray (Bear Power) This is combo strategies for get a cumulative signal.
First strategy
This System was created from the Book "How I Tripled My Money In The
Futures Market" by Ulf Jensen, Page 183. This is reverse type of strategies.
The strategy buys at market, if close price is higher than the previous close
during 2 days and the meaning of 9-days Stochastic Slow Oscillator is lower than 50.
The strategy sells at market, if close price is lower than the previous close price
during 2 days and the meaning of 9-days Stochastic Fast Oscillator is higher than 50.
Second strategy
Developed by Dr Alexander Elder, the Elder-ray indicator measures buying
and selling pressure in the market. The Elder-ray is often used as part
of the Triple Screen trading system but may also be used on its own.
Dr Elder uses a 13-day exponential moving average (EMA) to indicate the
market consensus of value. Bear Power measures the ability of sellers to
drive prices below the consensus of value. Bear Power reflects the ability
of sellers to drive prices below the average consensus of value.
Bull Power is calculated by subtracting the 13-day EMA from the day's High.
Bear power subtracts the 13-day EMA from the day's Low.
You can use in the xPrice any series: Open, High, Low, Close, HL2, HLC3, OHLC4 and ect...
WARNING:
- For purpose educate only
- This script to change bars colors.
Wyszukaj w skryptach "细算江西救护车家长倒赚了四万三+-医疗花费13万(家长视频)++医保报"
Combo Strategy 123 Reversal & Elder Ray (Bear Power) This is combo strategies for get a cumulative signal.
First strategy
This System was created from the Book "How I Tripled My Money In The
Futures Market" by Ulf Jensen, Page 183. This is reverse type of strategies.
The strategy buys at market, if close price is higher than the previous close
during 2 days and the meaning of 9-days Stochastic Slow Oscillator is lower than 50.
The strategy sells at market, if close price is lower than the previous close price
during 2 days and the meaning of 9-days Stochastic Fast Oscillator is higher than 50.
Second strategy
Developed by Dr Alexander Elder, the Elder-ray indicator measures buying
and selling pressure in the market. The Elder-ray is often used as part
of the Triple Screen trading system but may also be used on its own.
Dr Elder uses a 13-day exponential moving average (EMA) to indicate the
market consensus of value. Bear Power measures the ability of sellers to
drive prices below the consensus of value. Bear Power reflects the ability
of sellers to drive prices below the average consensus of value.
Bull Power is calculated by subtracting the 13-day EMA from the day's High.
Bear power subtracts the 13-day EMA from the day's Low.
You can use in the xPrice any series: Open, High, Low, Close, HL2, HLC3, OHLC4 and ect...
WARNING:
- For purpose educate only
- This script to change bars colors.

[fikira] Fibonacci MA / EMA's (Fibma / Fibema)I've made SMA/EMA's NOT based on the principle of the 2(1+1), 3(2+1),
5(3+2), 8(5+3), 13(8+5), 21(13+8), 34(21+13), 55(34+21), ... numbers,
but based on these following Fibonacci numbers:
0,236
0,382
0,500
0,618
0,764
1
Ending up with 2 series of Fibma / Fibema:
"Tiny Fibma / Fibema":
24, 38, 50, 62, 76, 100
"Big Fibma / Fibema":
236, 382, 500, 618, 764, 1000
IMHO it is striking how these lines often act as Resistance/Support,
although (except the 50, 100 & 500) they are not typical MA/EMA's.
They perform very well on every Timeframe as well!
Week:
3 Days:
1 Day:
4h:
1h:
Even on the 15 minutes:
Or 5':
Things to watch for:
Price compared to the Tiny or Big Fibma / Fibema (below or above)
Price compared to important Fibma / Fibema (for example below or
above MA 236, MA 764, MA 1000, ...)
Crossing of Fibma / Fibema 24/76, 236/764 and 38/62, 382/618
(bullish crossover = Lime coloured "cloud", bearish crossunder = Red coloured "cloud"),
...
I've made a change in barcolor if the close crosses the "Big Fibma / Fibema 500"
If price closes above MA/EMA 500, the first bar is yellow coloured,
if price stays above this level, candles are coloured lime/orange (= very bullish)
If price closes under MA/EMA 500, the first bar is purple,
if price stays under this level, candles are standard coloured (= very bearish)
Strategy will follow,
Thanks!

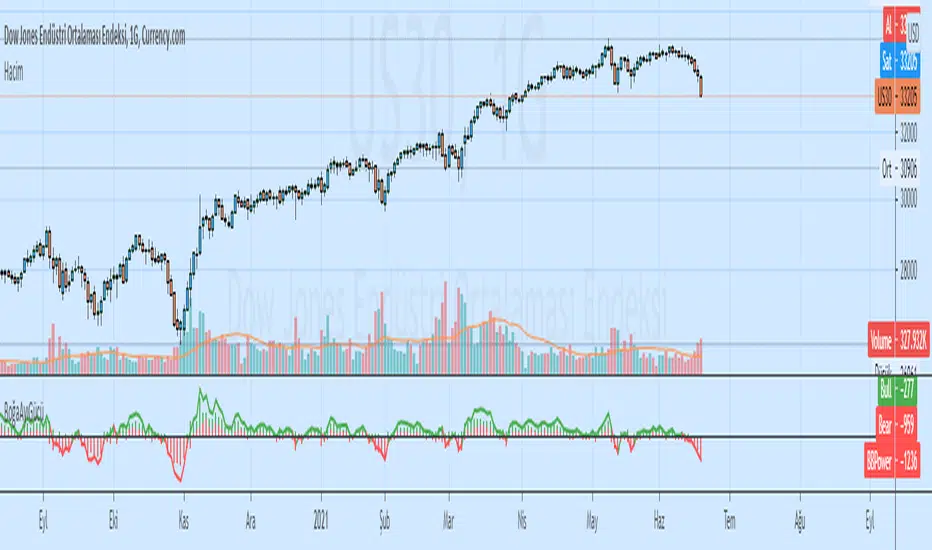
Elder Ray Bull and Bear Power OscillatorsElder Ray Bull and Bear Power Oscillators
Tradingview Screener Bull Bear Power(BBPOWER)
OVERVIEW
The Bull and Bear Power oscillators developed by Dr Alexander Elder attempt to measure the power of buyers (bulls) and sellers (bears) to push prices above and below the consensus of value. The primary principles on which Elder based the oscillator are:
The highest price displays the maximum buyer’s power within the day.
The lowest price displays the maximum seller’s power within the day.
The moving average can be construed as a price agreement between buyers and sellers for a given time period.
The Bulls/Bears power balance is important since changes in this balance can signal the early stages of a potential trend reversal.
CALCULATION
Elder uses a 13-day exponential moving average (EMA) to indicate the consensus market value.
Bull Power is calculated by subtracting the 13-day EMA from the day’s high.
Bear Power is derived by subtracting the 13-day EMA from the day’s low.
TRADING WITH THE ELDER RAY BULL AND BEAR POWER OSCILLATORS
BULL POWER
Where a currency uptrend is sustained to the point that maximum prices move above the EMA the Bull Power histogram will be greater than zero. As price maximums accelerate to greater levels (above the EMA) during the rising trend histogram bars will increase in height above the zero line showing the increased buying strength during the period.
BEAR POWER
Where a currency downtrend is sustained to the point that minimum prices move below the EMA the Bear Power histogram will be less than zero. As price minimums accelerate to lower levels (below the EMA) during the falling trend histogram bars will increase in height below the zero line showing increased selling strength during the period.
TRADING SIGNALS
It is important for traders to use the Elder Ray oscillators in conjunction with the EMA overlay over the price chart (typically as per period being analysed) to give additional context to the signals. Sell signals are given if Bull Power is above zero and there is a bearish divergence in the Bull Power histogram or if the Bull Power histogram is above zero and falling.
Buy signals are given if Bear Power is below zero and there is a bullish divergence in the Bear Power histogram or if the Bear Power histogram is below zero and rising. It is extremely important for traders to only trade in the above scenarios if the direction of the trend indicated by the slope of the EMA on the price chart is in the direction of their trade when the signal is given (or shortly after).
Colored Columns for Elder's Force Index EMAThe Elder's Force Index is an oscillator that takes into account the change of the price combined with the volume:
EFI = (close of the current day - close of the previous day) * volume of the current day
If measure the force of the price change.
If you calculate the exponential moving average of the last two days to smooth the signal EMA(EFI,2), you have a nice buy/sell indicator in the context of the "Elder Triple Screen Method":
- If you are in a long term uptrend (for example ema(13) going up), you have a buy signal if EFI(2)<0, because then you have a short term downtrend in a long term uptrend. Put a "stop buy" a bit higher in case the long term uptrend continues.
- If you are in a long term downtrend (for example ema(13) going down), you have a sell signal if EFI(2)>0, because then you have a short term uptrend in a long term downtrend. Put a "stop sell" a bit lower in case the long term downtrend continues.
This graph shows you colored columns for the EMA(EFI,2), which is more visible than the one-color indicator provided by default by TV.
You can also display the EFI itself on top of the columns. (optional, I personaly do not use it)
PS: ema(13) is to make the explanation simple. Personaly, I use MACD histogram on a weekly view to define if I am on a long term uptrend or downtrend.

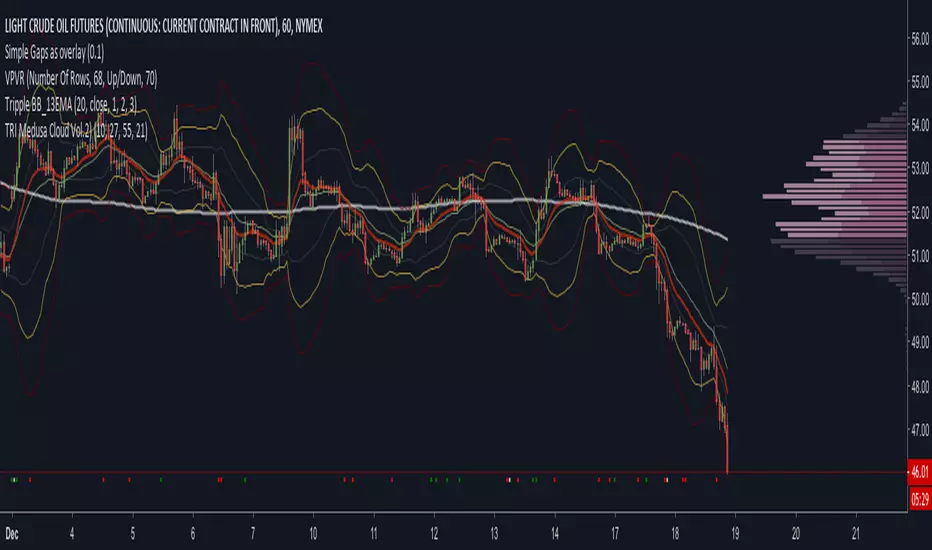
Tripple BB_13EMAHere is a script to use 3 types of Bollinger Bands.
It is like three resistances or ranges in wich the Chart generally likes to move. A 1, 2 and 3 Width BB. The Chart moves 90% between the yellow one.
As support for my study i use the 13 EMA. is the Chart over the 13 EMA and under the Yellow (2) BB the trend is bullish. Is t under the 13 EMA and over the Yellow BB the trend used to be bearish.
The opener the BB are the more Volatilaty and the more likely the Chart will not bounce against the Bands. It will more get stick to the yellow or red one (if it is between them it is a trend too) and will follow up or downwards.
Check it out
Fibonacci TrendlinesCOINBASE:ETHUSD
This indicator is bested with the 4 hour time frame.
This indicator shows 4 EMA trendlines based on the Fibonacci Sequence (8, 13, 21, 55). If the 8, 13, 21 trendlines crosses above the 55 and the volume is high, this is an indication for a long position. If the 8, 13, 21 crosses below the 55 (volume doesn't matter), this is an indication to exit the long position or an indication for a short position.

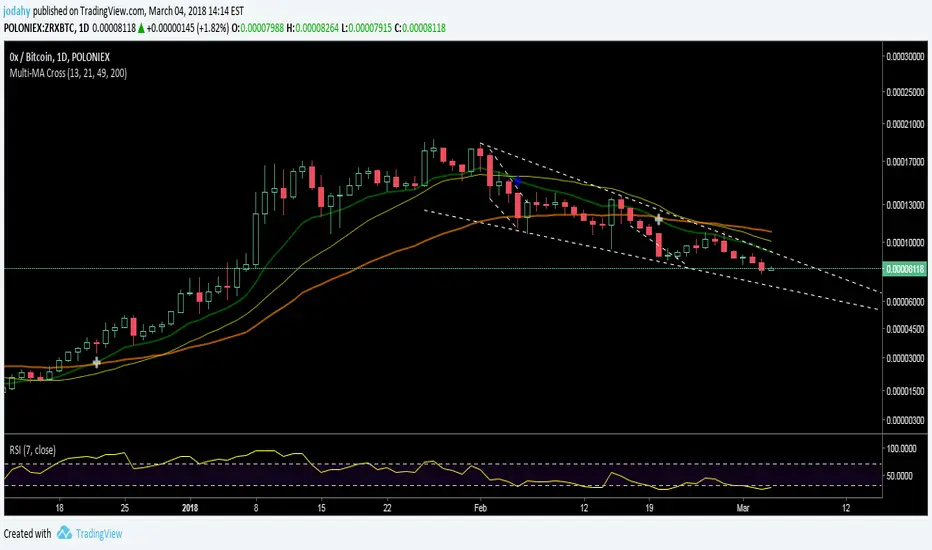
Multi-MA CrossingDesigned/back-tested for daily BTC/USD closing price.
Your mileage may vary for other assets/time frames.
By default includes 13 EMA, 21 SMA, 49 EMA, 200 EMA.
Crosses of 13 / 49 EMA are for buy/sell signals.
13 EMA / 21 SMA cross-unders are for sell signals near local tops.
EMA periods are editable.
See text in the Pine Editor for additional notes on the indicators.
Combine with oscillators for more rapid identification of reversals.
Feel free to comment, would be happy to discuss.
Good luck! -JDH

Multi-MA CrossingDesigned/back-tested for daily BTC/USD closing price.
Your mileage may vary for other assets/time frames.
By default includes 13 EMA, 21 SMA, 49 EMA, 200 EMA.
Crosses of 13 / 49 EMA are for buy/sell signals.
13 EMA / 21 SMA cross-unders are for sell signals near local tops.
EMA periods are editable.
See text in the Pine Editor for additional notes on the indicators.
Combine with oscillators for more rapid identification of reversals.
Good luck! -JDH
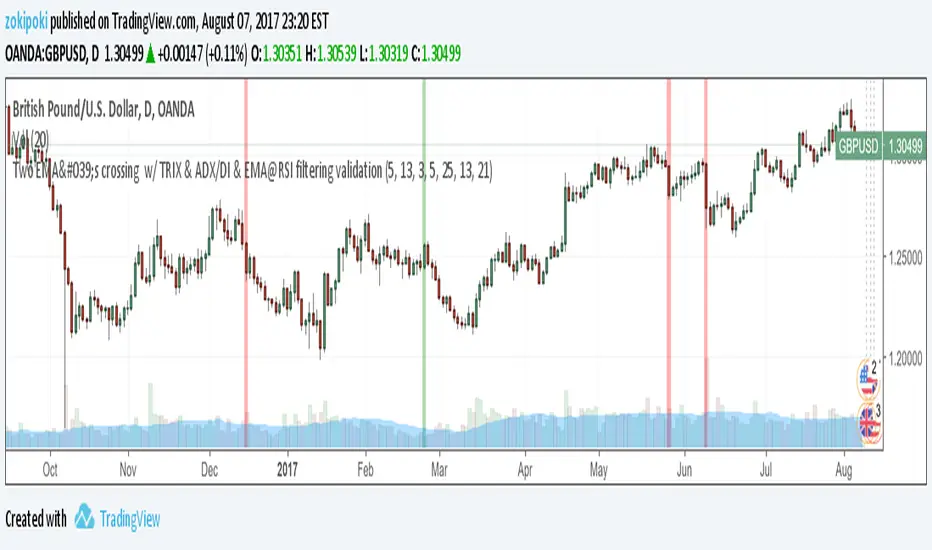
Two EMA's crossing w/ TRIX & ADX/DI & EMA@RSI filteringThe initial idea for the "X-candle" script is from @nmike, and the requirement was to mark the bar with positive or negative as EMA(5) and EMA(13) cross. Later, it was requested to filter the above with Trix(3) so it just crosses the "zero" line and goes in either positive or negative territory - confirming the EMA's crossing.
In addition, one of my ideas was to integrate 2 more rules, and the final looked something like this ...
The script marks the candle vertical background with green or red when all 4 rules are satisfied:
1. Between the current and previous bar has to be a cross of the EMA lines (by default: EMA 5 and EMA 13)
2. The current bar is the first or second bar crossing the zero TRIX line ... going in either Positive or Negative range, confirming the first rule
3. ADX is above threshold 25 & DI is also valid (higher than the opposite DI) ... confirming trend direction and strength
4. EMA(21) on top of RSI(13), one of my favorites, so it has to be valid also
At the end the script did extensive filtering, and it does filter some good ones also. Needs more work, less filtering, more tolerance, and new rules. All of the above indicator parameters can be modified easily, so anybody can play with. If you find some better indicator parameters that will provide a more efficient filtering, please let us know and drop me a note.
Thanks!
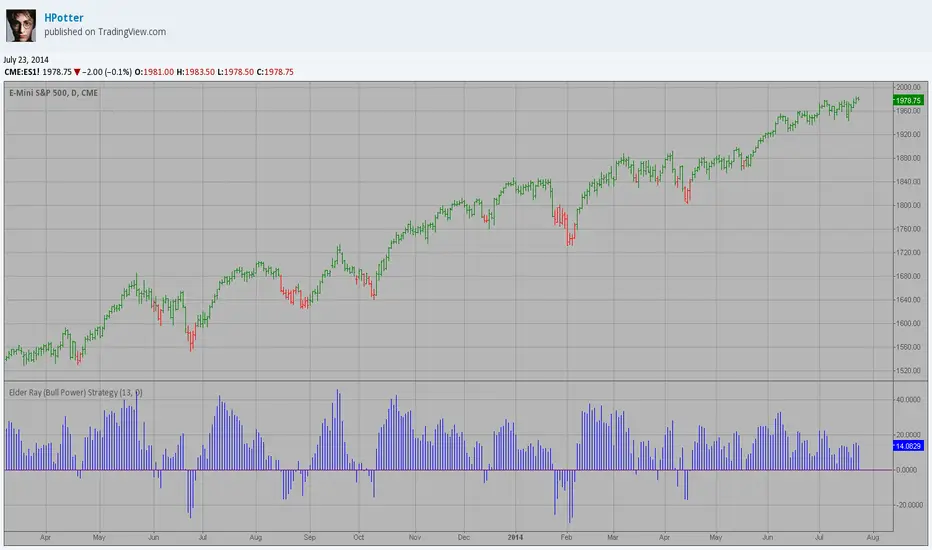
Elder Ray (Bull Power) Strategy Backtest Developed by Dr Alexander Elder, the Elder-ray indicator measures buying
and selling pressure in the market. The Elder-ray is often used as part
of the Triple Screen trading system but may also be used on its own.
Dr Elder uses a 13-day exponential moving average (EMA) to indicate the
market consensus of value. Bull Power measures the ability of buyers to
drive prices above the consensus of value. Bear Power reflects the ability
of sellers to drive prices below the average consensus of value.
Bull Power is calculated by subtracting the 13-day EMA from the day's High.
Bear power subtracts the 13-day EMA from the day's Low.
You can use in the xPrice any series: Open, High, Low, Close, HL2, HLC3, OHLC4 and ect...
You can change long to short in the Input Settings
Please, use it only for learning or paper trading. Do not for real trading.

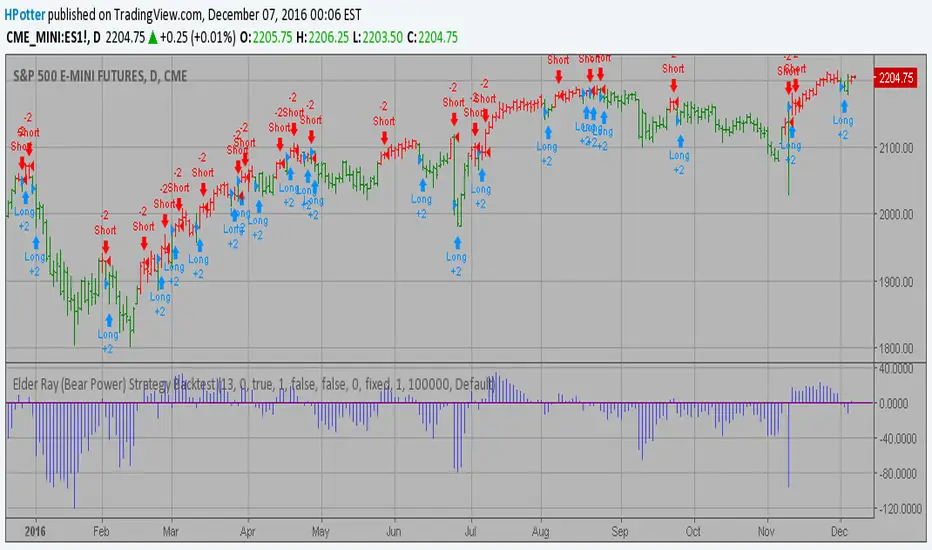
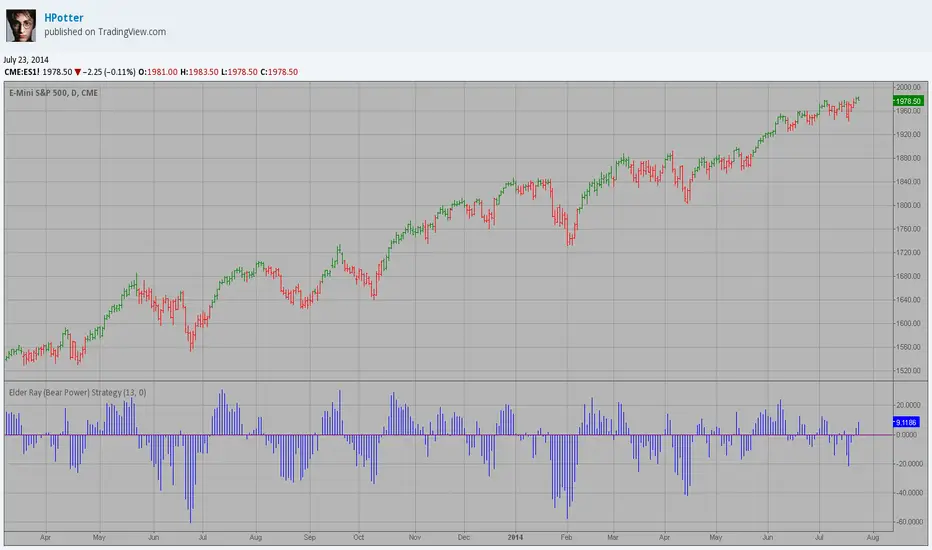
Elder Ray (Bear Power) Strategy Backtest Developed by Dr Alexander Elder, the Elder-ray indicator measures buying
and selling pressure in the market. The Elder-ray is often used as part
of the Triple Screen trading system but may also be used on its own.
Dr Elder uses a 13-day exponential moving average (EMA) to indicate the
market consensus of value. Bear Power measures the ability of sellers to
drive prices below the consensus of value. Bear Power reflects the ability
of sellers to drive prices below the average consensus of value.
Bull Power is calculated by subtracting the 13-day EMA from the day's High.
Bear power subtracts the 13-day EMA from the day's Low.
You can use in the xPrice any series: Open, High, Low, Close, HL2, HLC3, OHLC4 and ect...
You can change long to short in the Input Settings
Please, use it only for learning or paper trading. Do not for real trading.
Week of the Year indicatorSimple time indicator showing weeks of the year. Acts to help you define the greater perspective of time on your charts. You can overlay it on the entire chart or use it small and consolidated like I prefer it.
Easiest to configure colors in the script itself and then leave transparency values untouched:
q1w1 = the first week of the first quarter of the year (1st week of january, indicating a new year)
q1= 1-13
q2= 14-26
q3= 27-39
q4=40-53
Hope this helps you, like it helps me.
Best regards,
IMPORTANT NOTE:
Because the scripts asks for the week of the year it doesn't exactly indicate the first day of the quarter of the year. Instead it indicates the year like this: 52 / 4 = 13 W p/Q. Or in other words: 13 weeks per quarter of the year (roughly). Every 5.6 years there's a 53rd week, which will not cause any trouble as long as TV allows the use of the 53rd week, which I think it does.

Elder Ray (Bear Power) Strategy Developed by Dr Alexander Elder, the Elder-ray indicator measures buying
and selling pressure in the market. The Elder-ray is often used as part
of the Triple Screen trading system but may also be used on its own.
Dr Elder uses a 13-day exponential moving average (EMA) to indicate the
market consensus of value. Bear Power measures the ability of sellers to
drive prices below the consensus of value. Bear Power reflects the ability
of sellers to drive prices below the average consensus of value.
Bull Power is calculated by subtracting the 13-day EMA from the day's High.
Bear power subtracts the 13-day EMA from the day's Low.
You can use in the xPrice any series: Open, High, Low, Close, HL2, HLC3, OHLC4 and ect...
Elder Ray (Bull Power) Strategy Developed by Dr Alexander Elder, the Elder-ray indicator measures buying
and selling pressure in the market. The Elder-ray is often used as part
of the Triple Screen trading system but may also be used on its own.
Dr Elder uses a 13-day exponential moving average (EMA) to indicate the
market consensus of value. Bull Power measures the ability of buyers to
drive prices above the consensus of value. Bear Power reflects the ability
of sellers to drive prices below the average consensus of value.
Bull Power is calculated by subtracting the 13-day EMA from the day's High.
Bear power subtracts the 13-day EMA from the day's Low.
You can use in the xPrice any series: Open, High, Low, Close, HL2, HLC3, OHLC4 and ect...
Elder Ray (Bear Power) Developed by Dr Alexander Elder, the Elder-ray indicator measures buying
and selling pressure in the market. The Elder-ray is often used as part
of the Triple Screen trading system but may also be used on its own.
Dr Elder uses a 13-day exponential moving average (EMA) to indicate the
market consensus of value. Bear Power measures the ability of sellers to
drive prices below the consensus of value. Bear Power reflects the ability
of sellers to drive prices below the average consensus of value.
Bull Power is calculated by subtracting the 13-day EMA from the day's High.
Bear power subtracts the 13-day EMA from the day's Low.
You can use in the xPrice any series: Open, High, Low, Close, HL2, HLC3, OHLC4 and ect...

Elder Ray (Bull Power) Developed by Dr Alexander Elder, the Elder-ray indicator measures buying
and selling pressure in the market. The Elder-ray is often used as part
of the Triple Screen trading system but may also be used on its own.
Dr Elder uses a 13-day exponential moving average (EMA) to indicate the
market consensus of value. Bull Power measures the ability of buyers to
drive prices above the consensus of value. Bear Power reflects the ability
of sellers to drive prices below the average consensus of value.
Bull Power is calculated by subtracting the 13-day EMA from the day's High.
Bear power subtracts the 13-day EMA from the day's Low.
You can use in the xPrice any series: Open, High, Low, Close, HL2, HLC3, OHLC4 and ect...
Multiple EMAMultiple EMA Indicator
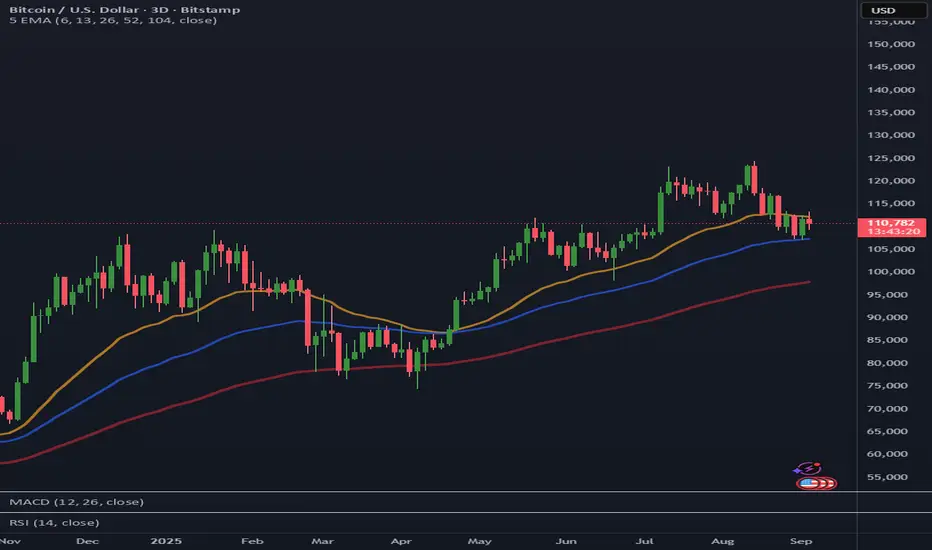
This script overlays five customizable Exponential Moving Averages (EMAs) on your chart with color styling and transparency matching TradingView’s palette (≈65% opacity).
🔹 Features
Five EMAs with fully customizable lengths (default: 6, 13, 26, 52, 104)
Thicker line weights for longer-term EMAs (26, 52, 104) to emphasize trend bias
Short-term EMAs (6, 13) hidden by default but toggleable in settings
Custom color codes with opacity applied (35% transparency) for a smoother look
Adjustable price source input (close, open, hl2, etc.)
🔹 Best For
Swing traders and trend followers
Traders seeking a clear, color-coded, and visually optimized EMA setup
Retail Sentiment Indicator - Multi-Asset CFD & Fear/Greed IndexRetail Sentiment Indicator - Multi-Asset CFD & Fear/Greed Index
Overview
The Retail Sentiment Indicator provides real-time sentiment data for major financial instruments including stocks, forex, commodities, and cryptocurrencies. This indicator displays retail trader positioning and market sentiment using CFD data and fear/greed indices.
Methodology and Scale Calculation
This indicator operates on a **-50 to +50 scale** with zero representing perfect market equilibrium.
Scale Interpretation:
- **Zero (0)**: Market balance - exactly 50% of investors buying, 50% selling
- **Positive values**: Majority buying pressure
- Example: If 63% of investors are buying, the indicator shows +13 (63 - 50 = +13)
- **Negative values**: Majority selling pressure
- Example: If 92% of investors are selling, the indicator shows -42 (50 - 92 = -42)
BTC Fear & Greed Index Scaling:
The original `BTC FEAR&GREED` index is natively scaled from 0-100 by its creator. In our indicator, this data has been rescaled to also fit the -50 to +50 range for consistency with other sentiment data sources.
This unified scaling approach allows for direct comparison across all instruments and data sources within the indicator.
-Important Data Source Selection-
Bitcoin (BTC) Data Sources
When viewing Bitcoin charts, the indicator offers **two different data sources**:
1. **Default Auto-Mode**: `BTCUSD Retail CFD` - Retail CFD traders sentiment data (automatically loaded).
2. **Manual Selection**: `BTC FEAR&GREED` - Fear & Greed Index from website: alternative dot me
**To access BTC Fear & Greed Index**: Input settings -> disable checkbox "Auto-load Sentiment Data" -> manually select "BTC FEAR&GREED" from the dropdown menu.
US Stock Market Data Sources
For US stocks and indices (S&P 500, NASDAQ, Dow Jones), there are **two data source options**:
1. **Default Auto-Mode**: Individual retail CFD sentiment data for each instrument
2. **Manual Selection**: `SNN FEAR&GREED` - SNN's Fear & Greed Index covering the overall US market sentiment. SNN was used as the name to avoid any potential trademark infringement.
**To access SNN Fear & Greed Index**: When viewing US market charts, disable in input settings checkbox "Auto-load Sentiment Data" and manually select "SNN FEAR&GREED" from the dropdown menu.
This distinction allows traders to choose between **instrument-specific retail sentiment** (auto-mode) or **broader market sentiment indices** (manual selection).
Features
- **Auto-Detection**: Automatically loads sentiment data based on the current chart symbol
- **Manual Selection**: Choose from 40+ supported instruments when auto-detection is unavailable
- **Multiple Data Sources**: Combines retail CFD sentiment with Fear & Greed indices
- **Visual Zones**: Clear greed/fear zones with color-coded backgrounds
- **Real-time Updates**: Live sentiment data from merged data sources
Supported Instruments
Major Indices
- S&P 500, NASDAQ, Dow Jones 30, DAX
Forex Pairs
- Major pairs: EURUSD, GBPUSD, USDJPY, USDCHF, USDCAD
- Cross pairs: EURJPY, GBPJPY, AUDUSD, NZDUSD, and 20+ others
Commodities
- Precious metals: Gold (XAUUSD), Silver (XAGUSD)
- Energy: WTI Oil
- Agricultural: Wheat, Coffee
- Industrial: Copper
Cryptocurrencies
- Bitcoin (BTC) sentiment data
- BTC & SNN Fear & Greed indices
How to Use
1. **Auto Mode** (Default): Enable "Auto-load Sentiment Data" to automatically display sentiment for the current chart symbol
2. **Manual Mode**: Disable auto-load and select from the dropdown menu for specific instruments
3. **Interpretation**:
- Values above 0 (green) indicate retail greed/bullish sentiment
- Values below 0 (red) indicate retail fear/bearish sentiment
- Fear & Greed indices use 0-100 scale (50 is neutral)
Data Sources
This indicator uses curated sentiment data from retail CFD providers and established fear/greed indices. Data is updated regularly and sourced from reputable financial data providers.
Trading Strategy & Market Philosophy
Contrarian Trading Approach
The primary purpose of this indicator is based on the fundamental market principle that **the majority of retail investors are often wrong**, and markets typically move opposite to the positions held by the majority of market participants.
Key Strategy Guidelines:
- **Contrarian Signal**: When the majority of users are positioned on one side of the market, there is statistically greater market advantage in taking positions in the opposite direction
- **Trend Exhaustion Signal**: An interesting observed phenomenon occurs when, during a long-lasting trend where the majority of investors have consistently been on the wrong side, the Sentiment indicator suddenly shows that the majority has flipped and opened positions in the direction of that long-running trend. This is often a signal of fuel exhaustion for further movement in that direction
Interpretation Examples
- High greed readings (majority bullish) → Consider bearish opportunities
- High fear readings (majority bearish) → Consider bullish opportunities
- Sudden sentiment flip during established trends → Potential trend reversal signal
Technical Notes
- Built with PineScript v6
- Dynamic symbol detection with fallback options
- Optimized for performance with minimal resource usage
- Color-coded visualization with customizable zones
Data Sources & Expansion
Acknowledgments
We extend our gratitude to **TradingView** for enabling the use of custom data feeds based on GitHub repositories, making this comprehensive sentiment analysis possible.
Data Expansion Opportunities
As the operator of this indicator, I am **open to suggestions for new data sources** that could be integrated and published. If you have ideas for additional instruments or sentiment data:
How to Submit Suggestions:
1. Send a **private message** with your proposal
2. Include: **instrument/data type**, **source**, and **brief description**
3. If technically feasible, we will work to import and publish the data
Data Infrastructure Status
Current Data Upload Process:
Please note that sentiment data uploads may occasionally experience minor interruptions. However, this should not pose significant issues as sentiment data typically changes gradually rather than rapidly.
Infrastructure Development:
We are actively working on establishing permanent cloud-based infrastructure to ensure continuous, automated data collection and upload processes. This will provide more reliable and consistent data availability in the future.
Disclaimer
This indicator is for educational and informational purposes only. Sentiment data should be used as part of a comprehensive trading strategy and not as the sole basis for trading decisions. Past performance does not guarantee future results. The contrarian approach described is a market theory and may not always produce profitable results.

Session Open Candle MarkerThe "Session Open Candle Marker" is a Pine Script indicator designed for forex and futures traders using Smart Money Concepts (SMC) and RP Profits-inspired strategies. It marks the 15-minute opening range candles for the Asia, London, and NY sessions, where institutional "big players" often gather liquidity. Each session’s range is drawn as a rectangle with a customizable midpoint line, ideal for spotting breakouts, retests, and liquidity sweeps.
Features
Session Open Ranges: Plots rectangles for the 15m open candles of Asia (03:00 EEST), London (10:00 EEST), and NY (15:00 EEST), corresponding to 01:00, 08:00, and 13:00 GMT+1.
Customizable Visualization:
Toggle each session (Asia, London, NY) on/off.
Independent high/low label toggles for each session.
Adjustable rectangle color, midpoint line color, style (solid/dashed/dotted), and width.
Customizable rectangle duration (default: 96 bars, ~24 hours on 15m).
Timezone Flexibility: Default times are set for EEST (UTC+3). Adjust session inputs for your chart’s timezone (e.g., GMT+1: Asia 01:00, London 08:00, NY 13:00; UTC: Asia 00:00, London 07:00, NY 12:00).
Clean Design: Rectangles and labels update dynamically, with proper cleanup to avoid clutter.
Usage:
Setup: Add to a 15m chart (e.g., EURUSD, ES1!). Check your chart’s timezone (Chart Settings > Symbol > Timezone) and adjust session times if needed.
Settings:
Toggle sessions and labels to focus on desired ranges (e.g., London and NY for high volatility).
Customize colors, midpoint line style/width, and rectangle duration.
Trading:
Breakouts/Retests: Trade breakouts above/below the rectangle high/low, with retests back to the range or midpoint (aligned with RP Profits scalping).
Liquidity Sweeps: Watch for price sweeping session highs/lows, reversing for entries (SMC concept).

Constance Brown Composite Index EnhancedWhat This Indicator Does
Implements Constance Brown's copyrighted Composite Index formula (1996) from her Master's thesis - a breakthrough oscillator that solves the critical problem where RSI fails to show divergences in long-horizon trends, providing early warning signals for major market reversals.
The Problem It Solves
Traditional RSI frequently fails to display divergence signals in Global Equity Indexes and long-term charts, leaving asset managers without warning of major price reversals. Brown's research showed RSI failed to provide divergence signals 42 times across major markets - failures that would have been "extremely costly for asset managers."
Key Components
Composite Line: RSI Momentum (9-period) + Smoothed RSI Average - the core breakthrough formula
Fast/Slow Moving Averages: Trend direction confirmation (13/33 periods default)
Bollinger Bands: Volatility envelope around the composite signal
Enhanced Divergence Detection: Significantly improved trend reversal timing vs standard RSI
Research-Proven Performance
Based on Brown's extensive study across 6 major markets (1919-2015):
42 divergence signals triggered where RSI showed none
33 signals passed with meaningful reversals (78% success rate)
Only 5 failures - exceptional performance in monthly/2-month timeframes
Tested on: German DAX, French CAC 40, Shanghai Composite, Dow Jones, US/Japanese Government Bonds
New Customization Features
Moving Average Types: Choose SMA or EMA for fast/slow lines
Optional Fills: Toggle composite and Bollinger band fills on/off
All Periods Adjustable: RSI length, momentum, smoothing periods
Visual Styling: Customize colors and line widths in Style tab
Default Settings (Original Formula)
RSI Length: 14
RSI Momentum: 9 periods
RSI MA Length: 3
SMA Length: 3
Fast SMA: 13, Slow SMA: 33
Bollinger STD: 2.0
Applications
Long-term investing: Monthly/2-month charts for major trend changes
Elliott Wave analysis: Maximum displacement at 3rd-of-3rd waves, divergence at 5th waves
Multi-timeframe: Pairs well with MACD, works across all timeframes
Global markets: Proven effective on equities, bonds, currencies, commodities
Perfect for serious traders and asset managers seeking the proven mathematical edge that traditional RSI cannot provide.

RTH Levels: VWAP + PDH/PDL + ONH/ONL + IBAlgo Index — Levels Pro (ONH/ONL • PDH/PDL • VWAP±Bands • IB • Gaps)
Purpose. A session-aware, non-repainting levels tool for intraday decision-making. Designed for futures and indices, with clean visuals, alerts, and a one-click Minimal Mode for screenshot-ready charts.
What it plots
• PDH/PDL (RTH-only) – Prior Regular Trading Hours high/low, computed intraday and frozen at the RTH close (no 24h mix-ups, no repainting).
• ONH/ONL – Prior Overnight high/low, held throughout RTH.
• RTH VWAP with ±σ bands – Volume-weighted variance, reset each RTH.
• Initial Balance (IB) – First N minutes of RTH, plus 1.5× / 2.0× extensions after IB completes.
• Today’s RTH Open & Prior RTH Close – With gap detection and “gap filled” alert.
• Killzone shading – NY Open (09:30–10:30 ET) and Lunch (11:15–13:30 ET).
• Values panel (top-right) – Each level with live distance in points & ticks.
• Right-edge level tags – With anti-overlap (stagger + vertical jitter).
• Price-scale tags – Native trackprice markers that always “stick” to the axis.
⸻
New in v6.4
• Minimal Mode: one click for a clean look (thinner lines, VWAP bands/IB extensions hidden, on-chart right-edge labels off; price-scale tags remain).
• Theme presets: Dark Hi-Contrast / Light Minimal / Futures Classic / Muted Dark.
• Anti-overlap controls: horizontal staggering, vertical jitter, and baseline offset to keep tags readable even when levels cluster.
⸻
Quick start (2 minutes)
1. Add to chart → keep defaults.
2. Sessions (ET):
• RTH Session default: 09:30–16:00 (US equities cash hours).
• Overnight Session default: 18:00–09:29.
Adjust for your market if you use different “day” hours (e.g., many use 08:20–13:30 ET for COMEX Gold).
3. Theme & Minimal Mode: pick a Theme Preset; enable Minimal Mode for screenshots.
4. Visibility: toggle PD/ON/VWAP/IB/References/Panel to taste.
5. Right-edge labels: turn Show Right-Edge Labels on. If they crowd, tune:
• Anti-overlap: min separation (ticks)
• Horizontal offset per tag (bars)
• Vertical jitter per step (ticks)
• Right-edge baseline offset (bars)
6. Alerts: open Add alert → Condition: and pick the events you want.
⸻
How levels are computed (no repainting)
• PDH/PDL: Intraday H/L are accumulated only while in RTH and saved at RTH close for “yesterday’s” values.
• ONH/ONL: Accumulated across the defined Overnight window and then held during RTH.
• RTH VWAP & ±σ: Volume-weighted mean and standard deviation, reset at the RTH open.
• IB: First N minutes of RTH (default 60). Extensions (1.5×/2.0×) appear after IB completes.
• Gaps: Today’s RTH open vs prior RTH close; “Gap Filled” triggers when price trades back to prior close.
⸻
Practical playbooks (how to trade around the levels)
1) PDH/PDL interactions
• Rejection: Price taps PDH/PDL then closes back inside → mean-reversion toward VWAP/IB.
• Acceptance: Close/hold beyond PDH/PDL with momentum → continuation to next HTF/IB target.
• Alert: PD Touch/Break.
2) ONH/ONL “taken”
• Often one ON extreme is taken during RTH. ONH Taken / ONL Taken → check if it’s a clean break or sweep & reclaim.
• Sweep + reclaim near VWAP can fuel rotations through the ON range.
3) VWAP ±σ framework
• Balanced: First tag of ±1σ often reverts toward VWAP.
• Trend: Persistent trade beyond ±1σ + IB break → target ±2σ/±3σ.
• Alerts: VWAP Cross and VWAP Reject (cross then immediate fail back).
4) IB breaks
• After IB completes, a clean IB break commonly targets 1.5× and sometimes 2.0×.
• Quick return inside IB = possible fade back to the opposite IB edge/VWAP.
• Alerts: IB Break Up / Down.
5) Gaps
• Gap-and-go: Opening drive away from prior close + VWAP support → trend until IB completion.
• Gap-fill: Weak open and VWAP overhead/underfoot → trade toward prior close; manage on Gap Filled alert.
Pro tip: Stack confluences (e.g., ONL sweep + VWAP reclaim + IB hold) and respect your execution rules (e.g., require a 5-minute close in direction, or your order-flow confirmation).
⸻
Inputs you’ll actually touch
• Sessions (ET): Session Timezone, RTH Session, Overnight Session.
• Visibility: toggles for PD/ON/VWAP/IB/Ref/Panel.
• VWAP bands: set σ multipliers (±1/±2/±3).
• IB: duration (minutes) and extension multipliers (1.5× / 2.0×).
• Style & Theme: Theme Preset, Main Line Width, Trackprice, Minimal Mode, and anti-overlap controls.
⸻
Alerts included
• PD Touch/Break — High ≥ PDH or Low ≤ PDL
• ONH Taken / ONL Taken — First in-RTH take of ONH/ONL
• VWAP Cross — Close crosses VWAP
• VWAP Reject — Cross then immediate fail back
• IB Break Up / Down — Break of IB High/Low after IB completes
• Gap Filled — Price trades back to prior RTH close
Setup: Add alert → Condition: Algo Index — Levels Pro → choose event → message → Notify on app/email.
⸻
Panel guide
The top-right panel shows each level plus live distance from last price:
LevelValue (Δpoints | Δticks)
Coloring: green if level is below current price, red if above.
⸻
Styling & screenshot tips
• Use Theme Preset that matches your chart.
• For dark charts, “Dark Hi-Contrast” with Main Line Width = 3 works well.
• Enable Trackprice for crisp axis tags that always stick to the right edge.
• Turn on Minimal Mode for cleaner screenshots (no VWAP bands or IB extensions, on-chart tags off; price-scale tags remain).
• If tags crowd, increase min separation (ticks) to 30–60 and horizontal offset to 3–5; add vertical jitter (4–12 ticks) and/or push tags farther right with baseline offset (bars).
⸻
Behavior & limitations
• Levels are computed incrementally; tables refresh on the last bar for efficiency.
• Right-edge labels are placed at bar_index + offset and do not track extra right-margin scrolling (TradingView limitation). The price-scale tags (from trackprice) do track the axis.
• “RTH” is what you define in inputs. If your market uses different day hours, change the session strings so PDH/PDL reflect your definition of “yesterday’s session.”
⸻
FAQ
Q: My PDH/PDL don’t match the daily chart.
A: By design this uses RTH-only highs/lows, not 24h daily bars. Adjust sessions if you want a different definition.
Q: Right-edge tags overlap or don’t sit at the far right.
A: Increase min separation / horizontal offset / vertical jitter and/or push tags farther with baseline offset. If you want markers that always hug the axis, rely on Trackprice.
Q: Can I change killzones?
A: Yes—edit the session strings in settings or request a version with user inputs for custom windows.
⸻
Disclaimer
Educational use only. This is not financial advice. Always apply your own risk management and confirmation rules.
⸻
Enjoy it? Please ⭐ the script and share screenshots using Minimal Mode + a Theme Preset that fits your style.
