Range Deviations PRO | Trade SymmetryRange Deviations PRO — Extended Session Levels
An enhanced version of the original Range Deviations by @joshuuu, retaining the full core logic while adding a key upgrade:
🔹 All session ranges, midlines, and deviation levels now extend into the next trading session, giving seamless multi-session context.
Supports Asia, CBDR, Flout, ONS, and Custom Sessions — with options for half/full standard deviations, equilibrium, and range boxes exactly as in the original.
Extending these levels helps identify:
• Liquidity sweeps
• Trap moves / false breaks
• Daily high/low projections
• Premium–discount behavior across sessions
Ideal for traders using ICT concepts who want clearer continuation of session structure into the next day.
Credit: Original logic by @joshuuu — enhancements by TradeSymmetry.
Disclaimer: Educational use only. Not financial advice.
Wyszukaj w skryptach "纳斯达克期货cfd"

Auto Trend Channels OXEThis indicator automatically detects and draws trend channels based on swing highs and lows.
How it works:
It identifies pivot points (swing highs/lows) using your chosen lookback period, then connects consecutive pivots to form channels:
Descending channels connect lower highs (resistance line), with a parallel support line projected from the lowest low between those highs
Ascending channels connect higher lows (support line), with a parallel resistance line projected from the highest high between those lows
Key features:
Channels extend forward so you can see where price might interact with them
Broken channels automatically switch to dashed lines and show "✗" labels
Fill shading helps visualize the channel zone
Info table shows current pivot counts
Trading application:
You'd use this for identifying trend direction and potential reversal zones. Price bouncing off channel boundaries = continuation. Price breaking through = potential trend change or acceleration. The "break detection" highlighting makes it easy to spot when a channel has been invalidated.
The pivot length setting is your main control - higher values find longer-term, more significant channels; lower values catch shorter-term moves.

Session, Weekly, Daily LevelsScroll down for hungarian description!
Magyar leíráshoz görgess lejjebb!
Overview
This script provides a unified market structure mapping tool that automatically identifies and visualizes key intraday, daily, and weekly reference levels. It helps traders contextualize price action throughout the trading week by marking true session opens, previous day highs/lows, weekly highs/lows, and weekday opens, all with accurate historical anchoring and correct timezone handling.
What This Script Does
1. Intraday Session Opens (Tokyo, London, New York)
- Detects the exact candle where each session opens.
- Draws horizontal rays with labels.
- Automatically clears lines at the start of each new day.
- Uses a custom local-to-exchange timezone conversion system.
2. Weekly Levels
- Last week high and low (precise bar anchoring, not HTF aggregation)
- Current week open (also Monday open)
- Auto-reset on new week
- Levels are always drawn from the true candle where they formed.
3. Previous Day High & Low
- Continuously tracks intraday highs and lows.
- On a new day, stores yesterday’s values and anchors rays to the exact bars.
- Levels remain visible for the full current day and reset the next day.
4. Weekday Opens (Tue–Fri)
- Captures the exact opening price of Tuesday–Friday.
- Monday open = Week open, so it is not shown separately.
- Auto-reset on new week.
Timezone Logic (Original Feature)
The script converts:
local session times → exchange timezone → chart timestamps
It works correctly regardless of chart timezone or instrument exchange location.
Line Drawing Logic
- Finds the exact bar_index where each level forms.
- Draws rays extending to the right.
- Labels are placed ahead of price.
- Safe updating prevents “bar index too far” errors.
How to Use
- Identify daily/weekly structure.
- Track bias relative to session opens.
- Observe reactions around weekday opens.
- Compare price action to last week's range.
Originality
- Custom timezone conversion engine.
- True historical bar anchoring.
- Fully automated weekly/daily structural resets.
- Independent styling for each level type.
- Not a mashup; all components follow one unified logic.
Limitations
- Does not predict trend or direction.
- Structural tool only.
Summary
A precise and reliable market structure tool that unifies weekly, daily, and intraday reference levels with full timezone automation and true-candle anchoring.
MAGYAR LEÍRÁS
--------------
Áttekintés
Ez az indikátor egy összetett piaci szerkezet-feltérképező eszköz, amely automatikusan megjeleníti a legfontosabb intraday, napi és heti referenciaértékeket. A célja, hogy a kereskedő tisztán lássa a piac aktuális környezetét: hol nyíltak a főbb devizapiaci szekciók, hogyan alakult a tegnapi tartomány, hol volt a múlt heti csúcs/mélypont, és hogyan nyitottak az egyes hétköznapok.
Mit tud a script?
1. Szekciónyitások (Tokyo, London, New York)
- Megkeresi a pontos gyertyát, amely a szekciónyitáskori árat tartalmazza.
- Vízszintes vonalat és címkét rajzol.
- Minden nap elején automatikusan törli a korábbi nap szintjeit.
- Egyedi időzóna-konverziós rendszerrel működik (helyi idő → tőzsdei idő → chart idő).
2. Heti szintek
- Múlt heti maximum és minimum (pontos gyertyapontra horgonyozva)
- Aktuális heti nyitóár (egyben a hétfői nyitó is)
- Új hét kezdetekor automatikusan frissül.
- A múlt heti high/low nem fix időpontra, hanem a valódi gyertyára kerül.
3. Előző napi High és Low
- Folyamatosan követi a napi maximumot és minimumot.
- Napváltáskor elmenti és pontos gyertyáról indítja a ray-t.
- A szintek a teljes nap folyamán megmaradnak, majd a következő nap törlődnek.
4. Hétköznapok nyitóárai (Kedd–Péntek)
- A kedd, szerda, csütörtök és péntek nyitóárát rögzíti és megjeleníti.
- A hétfői nyitó a Week Open, ezért külön nem jelenik meg.
- Heti váltáskor automatikusan törlődnek.
Időzóna-kezelés (egyedi megoldás)
A script a felhasználó helyi idejét átszámítja az instrumentum tőzsdei időzónájára, majd a chartra vetíti.
Ez biztosítja, hogy minden szekciónyitás helyesen jelenik meg, bármely chart vagy instrumentum esetén.
Vonalrajzolási logika
- A szintek a valódi bar_index alapján kerülnek rögzítésre.
- Jobbra nyúló ray-eket rajzol.
- A címkék mindig a jobb oldalon, előre helyezve jelennek meg.
- Biztonságos frissítési rendszer akadályozza meg a hibákat (pl. “bar index too far”).
Használat
- Napi/heti szerkezet meghatározása.
- Bias követése a session openekhez viszonyítva.
- Reakciók figyelése a hétköznapok nyitóárai körül.
- Összevetés a múlt heti tartománnyal.
Eredetiség
- Egyedi időzóna-kezelő motor.
- Igazi gyertyapont-alapú horgonyzás.
- Automatikus napi/heti reset.
- Minden szint külön stílusban konfigurálható.
- Nem mashup; egységes rendszer.
Összegzés
Professzionális, pontos eszköz a piaci szerkezet feltérképezésére, amely egyesíti a heti, napi és intraday szinteket, teljes időzóna-automatizálással és gyertyapontra horgonyzott kijelölésekkel.

Multi-TF Candle Gap DetectorHigh timeframe gap detector, these work well to identify key levels to trade from

10% and 23.6% support bandsWhen a share is in momentum and showing lot of strength that relative strength it takes breather at 10% band from new 52 week high and and tends to consolidate at 23.6% from new 52 week high. This forms a higher low and gives opportunity to get in the rally. The volume bars should be taken into consideration as low volume and dry up at the bottom indicate reversal is coming. The stoploss for all entry is 1% below recent base low and entry pont is crossing of weekly high with greater than 20 days volume average.

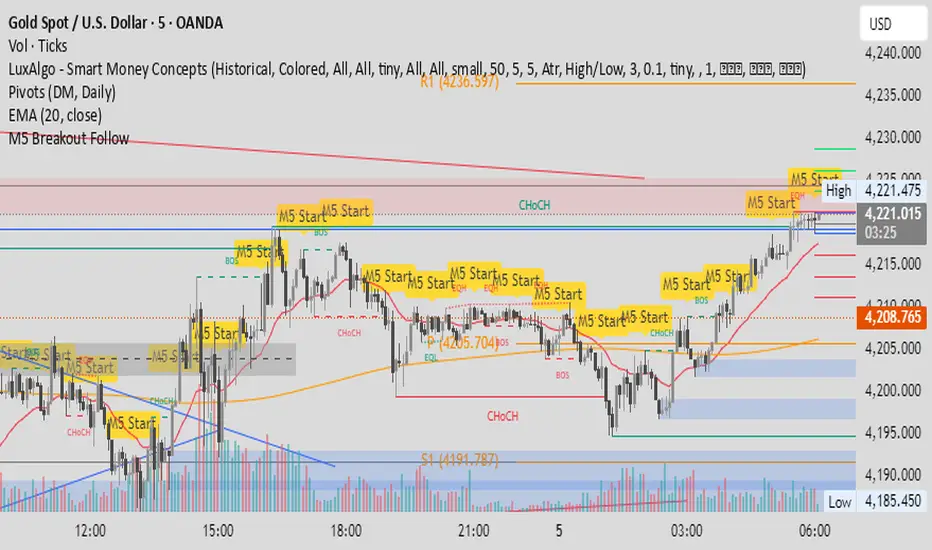
M5 Candle Follow Breakout - Teknik Gold Fanatic V2 This technique is entirely the property of Prof Sastra Gold Fanatic.
This technique uses a strategy of following breakouts from the first M5 of each hour.


Range Lattice## RangeLattice
RangeLattice constructs a higher-timeframe scaffolding on any intraday chart, locking in structural highs/lows, mid/quarter grids, VWAP confluence, and live acceptance/break analytics. It provides a non-repainting overlay that turns range management into a disciplined process.
HOW IT WORKS
Structure Harvesting – Using request.security() , the script samples highs/lows from a user-selected timeframe (default 240 minutes) over a configurable lookback to establish the dominant range.
Grid Construction – Midpoint and quarter levels are derived mathematically, mirroring how institutional traders map distribution/accumulation zones.
Acceptance Detection – Consecutive closes inside the range flip an acceptance flag and darken the cloud, signaling balanced auction conditions.
Break Confirmation – Multi-bar closes outside the structure raise break labels and alerts, filtering the countless fake-outs that plague breakout traders.
VWAP Fan Overlay – Session VWAP plus ATR-based bands provide a live measure of flow centering relative to the lattice.
HOW TO USE IT
Range Plays : Fade taps of the outer rails only when acceptance is active and VWAP sits inside the grid—this is where mean-reversion works best.
Breakout Plays : Wait for confirmed break labels before entering expansion trades; the dashboard's Width/ATR metric tells you if the expansion has enough fuel.
Market Prep : Carry the same lattice from pre-market into regular trading hours by keeping the structure timeframe fixed; alerts keep you notified even when managing multiple tickers.
VISUAL FEATURES
Range Tap and Mid Pivot markers provide a tape-reading breadcrumb trail for journaling.
Cloud fill opacity tightens when acceptance persists, visually signaling balance compressions ready to break.
Dashboard displays absolute width, ATR-normalized width, and current state (Balanced vs Transitional) so you can glance across charts quickly.
Acceptance Flag toggle: Keep the repeated acceptance squares hidden until you need to audit balance.
PARAMETERS
Structure Timeframe (default: 240): Choose the timeframe whose ranges matter most (4H for indices, Daily for stocks).
Structure Lookback (default: 60): Bars sampled on the structure timeframe.
Acceptance Bars (default: 8): How many consecutive bars inside the range confirm balance.
Break Confirmation Bars (default: 3): Bars required outside the range to validate a breakout.
ATR Reference (default: 14): ATR period for width normalization.
Show Midpoint Grid (default: enabled): Display the midpoint and quarter levels.
Show Adaptive VWAP Fan (default: enabled): Toggle the VWAP channel for assets where volume distribution matters most.
Show Acceptance Flags (default: disabled): Turn the acceptance markers on/off for maximum visual control.
Show Range Dashboard (default: enabled): Disable if screen space is limited, re-enable during prep sessions.
ALERTS
The indicator includes five alert conditions:
Range High Tap: Price interacted with the RangeLattice high
Range Low Tap: Price interacted with the RangeLattice low
Range Mid Tap: Price interacted with the RangeLattice mid
Range Break Up: Confirmed upside breakout
Range Break Down: Confirmed downside breakout
Where it works best
This indicator works best on liquid instruments with clear structural levels. On very low timeframes (1-minute and below), the structure may update too frequently to be useful. The acceptance/break confirmation system requires patience—faster traders may find the multi-bar confirmation too slow for scalping. The VWAP fan is session-based and resets daily, which may not suit all trading styles.

CharisTrend Indicatorthis trading indicator uses the following parameters EMA LOW (25 34 89 110 355 and 480) SMA(14 and 28) and Supertrend(14 3) for trading analysis and BUY/SELL Signals when the trade aligns.

Daily Range Zones: PDH/PDL with SL/TPThis indicator automatically plots the previous day's High and Low levels and projects dynamic Stop Loss (SL) and Take Profit (TP) zones based on the daily range percentage.
It is designed for traders focusing on daily range breakouts or mean reversion strategies around the Previous Day High (PDH) and Previous Day Low (PDL).
Key Features:
Level 0 & 1: Visualizes the exact High and Low of the reference timeframe (Daily).
Inner Zone (Orange): Calculated inside the range. Acts as a buffer for Stop Loss placement or entry zones for mean reversion.
Outer Zone (Purple): Calculated outside the range (extension). Acts as a primary Take Profit target for breakout trades.
Settings:
Fully customizable percentages for inner and outer zones.
Option to toggle between current day or previous day data.
Works on any timeframe (intraday charts recommended).

Shezab AlgoLabs EMA Trend UtilityOverview
This tool is a clean and practical EMA trend utility built to help traders quickly understand market direction, trend regime, and momentum shifts. It plots a fast EMA and slow EMA using a branded color theme and highlights transitions between bullish and bearish conditions. The script also includes optional visual crossover markers to make regime changes easier to spot.
How it works
The relationship between the fast and slow EMA is used to classify the trend environment:
When the fast EMA is above the slow EMA, the market is considered in a bullish phase.
When the fast EMA is below the slow EMA, the market is considered in a bearish phase.
The script also provides optional:
Colored bars reflecting trend direction
Crossover labels to highlight momentum shifts
Background cloud to visually emphasize trending or neutral conditions
Optional alerts for crossover events
These visual features help traders recognize potential trend transitions without implying a complete trading system.
How to use it
This tool is designed as a supplemental decision aid. Traders can combine it with their preferred structure analysis, volume tools, oscillators, or confirmation methods. The crossover markers and alerts highlight shifts in trend behavior but are informational rather than mechanical buy/sell signals. Users should apply their own risk-management and entry criteria.
Originality
This script goes beyond a standard EMA by combining multiple elements into a single, cohesive trend-clarification tool:
• regime coloring
• optional cloud regions
• crossover markers
• visual dynamic styling using a unified aesthetic palette
It is not a mashup of existing scripts; all components are integrated specifically to support traders who prefer a simple-yet-clear visual framework for understanding trend behavior.

Price Action Signals Filtered +EMA🚀 Price Action Signals Filtered + EMA (Dual Confirmation)
💡 Indicator Overview
This indicator is a powerful tool designed to identify potential trend reversals or continuations using Price Action Pivot signals, but it filters them with an Exponential Moving Average (EMA) to ensure dual confirmation.
The indicator's purpose is to generate signals only when a Price Action confirmation aligns with a confirmed market trend (above or below the EMA), thereby reducing noise and increasing signal reliability.
✨ Key Features and Logic
1. Price Action (Pivot) Detection
The indicator automatically detects local low (Pivot Low) and local high (Pivot High) points.
Pivot Low: A potential market bottom.
Pivot High: A potential market top.
2. Price Action Confirmation
After a Pivot is detected, the indicator waits for subsequent confirmation from the closing prices of the candles:
Bullish Confirmation: After a Pivot Low, the indicator requires N consecutive candles (where N is defined in the settings) to close above the previous candle's close. This indicates buying pressure.
**Bearish Confirmation: After a Pivot High, the indicator requires N consecutive candles to close below the previous candle's close. This indicates selling pressure.
3. Trend Filter (EMA) - Dual Confirmation! 🎯
This is the critical component. A confirmed Price Action signal must align with the trend defined by the Exponential Moving Average (EMA):
Bullish Signal (Buy): Generated ONLY if the Bullish Price Action Confirmation occurs while the price (Close) is ABOVE the EMA (default 20 periods).
Bearish Signal (Sell): Generated ONLY if the Bearish Price Action Confirmation occurs while the price (Close) is BELOW the EMA.
This serves as a dual confirmation, ensuring the signal is captured in the direction of the broader market trend.
📈 How to Use
Look for the Signal: Wait for the shape (triangle, circle, or arrow) to appear on the chart.
Verify Confirmation: Know that the signal has already passed through the dual filter: Price Action and EMA.
Bullish signals appear below the bar when the price is ABOVE the EMA.
Bearish signals appear above the bar when the price is BELOW the EMA.
Risk Management: Always use this indicator in combination with your risk management strategy and technical analysis.
📝 Additional Notes
The indicator uses barstate.isconfirmed to accurately plot signals on the candle close.
The EMA line is also plotted on the chart for visual trend verification.
This indicator is a tool only and does not constitute financial advice. Always perform your own analysis and research.

XAUUSD Liquidity Sweep + Engulfing (4H/2H/15m)Key Features in This Script:
4H Bias (Trend): We use RSI on 4H to determine if the market is in a bullish or bearish trend.
2H Setup: When price sweeps below previous lows or above previous highs (liquidity sweep), we confirm it with RSI and an engulfing candle.
15m Entry: After the liquidity sweep is confirmed on the 15m chart, we check for a bullish engulfing (for buys) or bearish engulfing (for sells) with RSI confirmation.
How to Use It:
Add the Script: Copy-paste the code above into TradingView’s Pine Editor.
Apply it to the 15-minute chart for XAUUSD (Gold).
Alerts: Set up alerts when a Buy or Sell signal appears based on the conditions.
Alerts Example:
When a liquidity sweep and RSI flip happens with an engulfing candle, TradingView will notify you, helping you enter at the right time.
🚀 Next Steps:
Try it out and let me know how the alerts and signals are working for you.
If you'd like to add custom stop-loss or take-profit calculations, or include Fibonacci levels, let me know!

Sima-Smart Money Concepts + RSI CandlestickThis indicator displays the RSI in a candlestick format and marks its support and resistance levels, as well as oversold and overbought zones based on Smart Money concepts.
In fact, this indicator is a combination of a candlestick-style RSI and a Smart Money indicator.

LiqVision Institutional Suite v6.2 – Hybrid ModeLiqVision Institutional Suite v6.2 — Hybrid Mode (Lightning Edition)
Een ultra-geoptimaliseerde Smart Money-indicator gebaseerd op institutionele principes: Liquidity, Market Structure, Order Blocks, FVG’s en Model 1/2 setups.
Dit script combineert meerdere professionele SMC-concepten in één engine:
🔷 Functionaliteiten
1. Liquidity Engine
Automatische detectie van EQH, EQL en Liquidity Sweeps
Dynamische lijnprojectie met smart cleanup
Slimme sweep-detectie voor high-probability entries
2. Market Structure Engine
BOS & CHOCH detectie
Trend continuatie- en reversalsignalen
Swing-based pivot logic
3. Order Block Engine
Automatische OB-detectie met displacement filtering
Bullish & Bearish macro Order Blocks
HTF glow overlay (nieuw in v6.2)
4. FVG Engine
Major Fair Value Gap detection
Up/Down imbalance visual engine
HTF-based color restoration (v6.2 fix)
5. Model 1 & Model 2 Signal Engine
Trend continuation entries (Model 1)
Reversal setups gebaseerd op HTF liquidity & displacement (Model 2)
Auto-tapping logic geïntegreerd met OB/FVG
6. Hybrid Mode Rendering
Slimme shading afhankelijk van timeframe:
LTF → Hide OB/FVG
MTF → White overlays
HTF → Premium glow visuals
🔷 Alerts
Volledige alert-ondersteuning voor:
Model 1 Buy/Sell
Model 2 Buy/Sell
Liquidity Sweep
BOS Up/Down
CHOCH Up/Down
OB Tap
FVG Tap
Any alert() function call
Geschikt voor Telegram, Discord, bots en externe signal pipelines.
🔷 Gebruik
Voeg de indicator toe
Kies timeframe (1m–4h aanbevolen)
Activeer alerts via “Any alert() function call”
Volg Model 1/2 entries voor optimaal resultaat
⚡ DISCLAIMER
Dit script is uitsluitend bedoeld voor educatieve doeleinden. Geen financieel advies. Resultaten uit het verleden geven geen garantie voor de toekomst.

Sima-Smart Money Concepts + RSI Candlestick [LuxAlgo]This indicator displays the RSI in a candlestick format and marks its support and resistance levels, as well as oversold and overbought zones based on Smart Money concepts.
In fact, this indicator is a combination of a candlestick-style RSI and a Smart Money indicator.

Watermark | Bar Time | Average Daily RangeMulti Info Panel & Watermark
Multi Info Panel & Watermark is a utility indicator that displays several pieces of chart information in a single, customizable panel. It is designed to support intraday and swing analysis by making key data—such as symbol details, date, and average daily range—easy to see at a glance, as well as providing simple tools for notes and backtesting.
Features
Watermark / Custom Note
Optional text overlay that can be used as a watermark or personal note.
Can display a strategy name, reminder, or any other user-defined label on the chart.
Ticker Info
Shows information about the currently active symbol on the chart (for example, symbol name and other basic details depending on the inputs).
Helps keep track of which market or pair is being analyzed, especially when using multiple charts.
Current Date
Displays the current date directly on the chart.
Useful for screenshots, journaling, and documenting analysis.
Average Daily Range (ADR)
Calculates the average daily range of the active symbol over a user-defined number of recent days.
Helps visualize how much price typically moves in a day, which can support position sizing, target setting, or volatility awareness within your own trading approach.
Open Bar Time Marker
Marks the open time of a selected bar (for example, a session open or a specific reference bar).
Primarily intended as a visual aid for manual backtesting and reviewing historical price action.
Usage
Use the watermark and ticker info to keep your charts labeled and organized.
Refer to the ADR readout to understand typical daily volatility of the instrument you are studying.
Use the date and open bar time marker when creating screenshots, trade journals, or when replaying historical sessions for review.
This script does not generate trading signals and does not guarantee any performance or results. It is provided solely as an informational and visualization tool. Always combine it with your own analysis, risk management, and decision-making. Nothing in this indicator or description should be considered financial advice.

Baba-pro EMA Break Sniper This indicator is designed to provide high-precision entries based on the interaction between EMAs, momentum, and clean price breaks.
Instead of relying on traditional EMA crossovers — which are often too slow — this tool focuses on direct EMA breakouts, allowing you to catch moves before most traders even react.

Pivot Hourly x EMA RibbonHourly Fibonacci Pivot + EMA is an intraday analysis tool that combines hourly Fibonacci-based pivot levels with exponential moving averages (EMAs). It is designed to help traders visualize potential intraday support/resistance zones and short-term trend direction on any timeframe.
The indicator calculates pivot levels from hourly price data and then projects Fibonacci extensions and retracements around a central pivot. These levels can be used to see where price has previously reacted and where future reactions may occur. The EMAs provide an additional layer of context by highlighting the prevailing short-term trend and momentum.
Key features:
Hourly Fibonacci pivot levels (support and resistance zones derived from hourly ranges)
Multiple Fibonacci bands to show potential reaction areas above and below the central pivot
One or more configurable EMAs to show short-term trend direction and dynamic support/resistance
Works on all symbols and intraday timeframes supported by TradingView
Typical use:
Monitor how price behaves when approaching or rejecting Fibonacci pivot levels
Look for confluence between pivot zones and EMA direction or EMA bounces
Use the levels as potential areas of interest for trade planning, stop placement, or partial profit zones within your own trading system
Also have "C" Label it's mean Candle for example C1 is First Candle of the source timeframe, if the source timeframe set to 4 Hour it will be the first 4h candle, the C2 is the second 4h candle of the day.
This script is intended purely as a technical analysis tool and does not generate buy/sell signals or guarantee any particular outcome. It is not financial advice. Always combine it with your own analysis, risk management, and trading plan before making any trading decisions.

Research-Backed Intraday MTF MAsResearch-Backed Intraday Multi-Timeframe Moving Averages
A precision-tuned intraday trading indicator that displays four key moving averages across two critical timeframes:
📊 What It Shows:
- 1-Hour MAs: 75-period SMA & EMA (institutional flow patterns)
- 10-Minute MAs: 200-period SMA & EMA (intraday trend structure)
🎯 Designed For:
- Day traders seeking multi-timeframe confluence
- Identifying strong trending vs. choppy market conditions
- Support/resistance level identification
- Momentum and trend alignment signals
✨ Key Features:
- Optimized periods based on market structure analysis
- Fully customizable colors, transparency, and line widths
- Toggle each MA on/off independently
- Clean, non-cluttered chart display
- Efficient tuple-based data requests
💡 Trading Signals:
- Price above all 4 MAs = Strong bullish alignment
- Price below all 4 MAs = Strong bearish alignment
- Mixed signals = Range-bound conditions, reduce risk
Perfect for scalpers, day traders, and swing traders who want institutional-grade moving averages without the noise.

SuperTrend Fusion — Trend + Momentum + Volatility FilterSuperTrend Fusion — Trend + Momentum + Volatility Filter
SuperTrend Fusion — ATP is an original, multi-factor trend-filtering tool that enhances the classic SuperTrend by combining three market dimensions in one unified model:
1. Trend direction (SuperTrend)
Provides the base trend structure using ATR-based volatility bands.
2. Momentum confirmation (Average Force – adapted)
An adapted version of an open-source “Average Force” concept published on TradingView by racer8.
This component measures where closing price sits relative to recent highs/lows, smoothed to capture directional pressure.
3. Market condition filtering (Choppiness Index)
Filters out sideways, non-trending zones where SuperTrend alone typically produces false flips.
Together, these components create a cleaner, more selective system that focuses on higher-quality SuperTrend reversals, avoiding the most common whipsaws that occur during low-momentum or high-choppiness periods.
🔍 How it Works
A long signal occurs when:
- SuperTrend flips from downtrend to uptrend
- Momentum (AF) is positive (optional filter)
- The market is trending and not excessively choppy (optional filter)
A short signal triggers under the symmetrical conditions.
Filtered signals are visually marked with subtle “X” markers so traders can understand when a raw SuperTrend flip was rejected by the filters.
The indicator also includes:
Enhanced styling for better visibility
Colored bars during valid signals
Optional background highlight during choppy periods
🎯 What This Indicator Is Designed For
This tool aims to:
- Improve the quality of SuperTrend entries
- Remove many low-probability signals
- Help traders visually identify when the market has the momentum and structure required for cleaner trend continuation
It is not intended to predict markets or guarantee accuracy; rather, it provides structure and clarity for decision-making based on technical rules.
⚙️ Inputs
- ATR Length & Factor (SuperTrend)
- Average Force Period & Smoothing
- Choppiness Length & Threshold
- Option to enable/disable each filter individually
📘 Credits
This script includes an adapted version of an open-source “Average Force” function originally published on TradingView by its author, racer8.
SuperTrend and Choppiness Index components are derived from classical, public-domain formulas.
📌 Important Notes
This indicator is not a strategy and does not guarantee performance.
Signals are based on historical calculations only and do not use lookahead.
Past performance does not guarantee future results.
Always test different assets and timeframes before using in live conditions.
👍 Recommended Usage
For a clean experience:
- Use on standard candlestick charts
- Avoid non-standard chart types (Renko, Heikin Ashi, Kagi, Range)
- Combine with your own risk management and trade planning

EMA Low + Supertrend (Alerts)this strategy uses the EMA LOW(25 89 110 355 and 480) and the Supertrend. the supertrend gives you the BUY/SELL When the market flip
