REJECTION DETECTOR🔥 CTR (Candle Terjepit - Rejection)
This indicator is specifically designed to detect Rejection Candles, which are moments when the price rejects a certain level and has the potential to form a strong reversal or rapid reaction — an important signal for scalpers and price action traders.
💡 Key Concept:
Rejection is a form of market reaction to areas of liquidity, support-resistance, or order block zones. Candles with long tails and small bodies indicate an imbalance between buyers and sellers, providing an early indication that the price may soon reverse.
⚙️ Key Features
🔍 Automatic Rejection Candle Detection (Buy & Sell)
🧠 Body-to-tail ratio filter for more precise signal validation
🎨 Customizable candle colors and appearance
📊 Suitable for all pairs and timeframes
Wyszukaj w skryptach "纳斯达克期货cfd"

SSL Hybrid ScalperIt's a ready to trade script V5, that takes the original SSL Hybrid logic and optimizes it for XAUUSD scalping on 1min to 15min charts for buy & sell signals.
Engulf After 2 Same-Dir Candles – Dashed Linethis will tell you when engulf happens after 2 consecutrive bvearsh candle happens

GROK ALTIN B2 ))GROK GOLD PRO V2 is a high-performance scalping strategy designed for XAUUSD on the 5-minute timeframe, operating with a fixed 1-lot position. It generates signals using EMA 9/21 crossover, RSI above/below 50, and volume spikes, while an ATR × 2.0 dynamic stop protects against volatility. Profits are locked in three steps (+$20, +$50, +$100), with each exit triggering real-time phone alerts showing entry, exit price, and profit. One pip movement equals $100 P&L. The strategy delivers a 92%+ win rate, average profit of +$4,432 per trade, and max drawdown of -$1,280. Simple, transparent, and fully automated.

GROK ALTIN A1 BY FGGROK GOLD PRO V2 is a high-performance scalping strategy designed for XAUUSD on the 5-minute timeframe, operating with a fixed 1-lot position. It generates signals using EMA 9/21 crossover, RSI above/below 50, and volume spikes, while an ATR × 2.0 dynamic stop protects against volatility. Profits are locked in three steps (+$20, +$50, +$100), with each exit triggering real-time phone alerts showing entry, exit price, and profit. One pip movement equals $100 P&L. The strategy delivers a 92%+ win rate, average profit of +$4,432 per trade, and max drawdown of -$1,280. Simple, transparent, and fully automated.

Midpoint Reversal [Bull + Bear] FIXEDwhen 2 consecutive candles on one direction there will be pone engulf candle .thats where we our alert will works

lower_tfLibrary "lower_tf"
█ OVERVIEW
This library is an enhanced (opinionated) version of the library originally developed by PineCoders contained in lower_tf .
It is a Pine Script® programming tool for advanced lower-timeframe selection and intra-bar analysis.
█ CONCEPTS
Lower Timeframe Analysis
Lower timeframe analysis refers to the analysis of price action and market microstructure using data from timeframes shorter than the current chart period. This technique allows traders and analysts to gain deeper insights into market dynamics, volume distribution, and the price movements occurring within each bar on the chart. In Pine Script®, the request.security_lower_tf() function allows this analysis by accessing intrabar data.
The library provides a comprehensive set of functions for accurate mapping of lower timeframes, dynamic precision control, and optimized historical coverage using request.security_lower_tf().
█ IMPROVEMENTS
The original library implemented ten precision levels. This enhanced version extends that to twelve levels, adding two ultra-high-precision options:
Coverage-Based Precision (Original 5 levels):
1. "Covering most chart bars (least precise)"
2. "Covering some chart bars (less precise)"
3. "Covering fewer chart bars (more precise)"
4. "Covering few chart bars (very precise)"
5. "Covering the least chart bars (most precise)"
Intrabar-Count-Based Precision (Expanded from 5 to 7 levels):
6. "~12 intrabars per chart bar"
7. "~24 intrabars per chart bar"
8. "~50 intrabars per chart bar"
9. "~100 intrabars per chart bar"
10. "~250 intrabars per chart bar"
11. "~500 intrabars per chart bar" ← NEW
12. "~1000 intrabars per chart bar" ← NEW
The key enhancements in this version include:
1. Extended Precision Range: Adds two ultra-high-precision levels (~500 and ~1000 intrabars) for advanced microstructure analysis requiring maximum granularity.
2. Market-Agnostic Implementation: Eliminates the distinction between crypto/forex and traditional markets, removing the mktFactor variable in favor of a unified, predictable approach across all asset classes.
3. Explicit Precision Mapping: Completely refactors the timeframe selection logic using native Pine Script® timeframe properties ( timeframe.isseconds , timeframe.isminutes , timeframe.isdaily , timeframe.isweekly , timeframe.ismonthly ) and explicit multiplier-based lookup tables. The original library used minute-based calculations with market-dependent conditionals that produced inconsistent results. This version provides deterministic, predictable mappings for every chart timeframe, ensuring consistent precision behavior regardless of asset type or market hours.
An example of the differences can be seen side-by-side in the chart below, where the original library is on the left and the enhanced version is on the right:
█ USAGE EXAMPLE
// This Pine Script® code is subject to the terms of the Mozilla Public License 2.0 at mozilla.org
// © andre_007
//@version=6
indicator("lower_tf Example")
import andre_007/lower_tf/1 as LTF
import PineCoders/Time/5 as PCtime
//#region ———————————————————— Example code
// ————— Constants
color WHITE = color.white
color GRAY = color.gray
string LTF1 = "Covering most chart bars (least precise)"
string LTF2 = "Covering some chart bars (less precise)"
string LTF3 = "Covering less chart bars (more precise)"
string LTF4 = "Covering few chart bars (very precise)"
string LTF5 = "Covering the least chart bars (most precise)"
string LTF6 = "~12 intrabars per chart bar"
string LTF7 = "~24 intrabars per chart bar"
string LTF8 = "~50 intrabars per chart bar"
string LTF9 = "~100 intrabars per chart bar"
string LTF10 = "~250 intrabars per chart bar"
string LTF11 = "~500 intrabars per chart bar"
string LTF12 = "~1000 intrabars per chart bar"
string TT_LTF = "This selection determines the approximate number of intrabars analyzed per chart bar. Higher numbers of
intrabars produce more granular data at the cost of less historical bar coverage, because the maximum number of
available intrabars is 200K.
\n\nThe first five options set the lower timeframe based on a specified relative level of chart bar coverage.
The last five options set the lower timeframe based on an approximate number of intrabars per chart bar."
string TAB_TXT = "Uses intrabars at the {0} timeframe.\nAvg intrabars per chart bar:
{1,number,#.#}\nChart bars covered: {2} of {3} ({4,number,#.##}%)"
string ERR_TXT = "No intrabar information exists at the {1}{0}{1} timeframe."
// ————— Inputs
string ltfModeInput = input.string(LTF3, "Intrabar precision", options = , tooltip = TT_LTF)
bool showInfoBoxInput = input.bool(true, "Show information box ")
string infoBoxSizeInput = input.string("normal", "Size ", inline = "01", options = )
string infoBoxYPosInput = input.string("bottom", "↕", inline = "01", options = )
string infoBoxXPosInput = input.string("right", "↔", inline = "01", options = )
color infoBoxColorInput = input.color(GRAY, "", inline = "01")
color infoBoxTxtColorInput = input.color(WHITE, "T", inline = "01")
// ————— Calculations
// @variable A "string" representing the lower timeframe for the data request.
// NOTE:
// This line is a good example where using `var` in the declaration can improve a script's performance.
// By using `var` here, the script calls `ltf()` only once, on the dataset's first bar, instead of redundantly
// evaluating unchanging strings on every bar. We only need one evaluation of this function because the selected
// timeframe does not change across bars in this script.
var string ltfString = LTF.ltf(ltfModeInput, LTF1, LTF2, LTF3, LTF4, LTF5, LTF6, LTF7, LTF8, LTF9, LTF10, LTF11, LTF12)
// @variable An array containing all intrabar `close` prices from the `ltfString` timeframe for the current chart bar.
array intrabarCloses = request.security_lower_tf(syminfo.tickerid, ltfString, close)
// Calculate the intrabar stats.
= LTF.ltfStats(intrabarCloses)
int chartBars = bar_index + 1
// ————— Visuals
// Plot the `avgIntrabars` and `intrabars` series in all display locations.
plot(avgIntrabars, "Average intrabars", color.silver, 6)
plot(intrabars, "Intrabars", color.blue, 2)
// Plot the `chartBarsCovered` and `chartBars` values in the Data Window and the script's status line.
plot(chartBarsCovered, "Chart bars covered", display = display.data_window + display.status_line)
plot(chartBars, "Chart bars total", display = display.data_window + display.status_line)
// Information box logic.
if showInfoBoxInput
// @variable A single-cell table that displays intrabar information.
var table infoBox = table.new(infoBoxYPosInput + "_" + infoBoxXPosInput, 1, 1)
// @variable The span of the `ltfString` timeframe formatted as a number of automatically selected time units.
string formattedLtf = PCtime.formattedNoOfPeriods(timeframe.in_seconds(ltfString) * 1000)
// @variable A "string" containing the formatted text to display in the `infoBox`.
string txt = str.format(
TAB_TXT, formattedLtf, avgIntrabars, chartBarsCovered, chartBars, chartBarsCovered / chartBars * 100, "'"
)
// Initialize the `infoBox` cell on the first bar.
if barstate.isfirst
table.cell(
infoBox, 0, 0, txt, text_color = infoBoxTxtColorInput, text_size = infoBoxSizeInput,
bgcolor = infoBoxColorInput
)
// Update the cell's text on the latest bar.
else if barstate.islast
table.cell_set_text(infoBox, 0, 0, txt)
// Raise a runtime error if no intrabar data is available.
if ta.cum(intrabars) == 0 and barstate.islast
runtime.error(str.format(ERR_TXT, ltfString, "'"))
//#endregion
█ EXPORTED FUNCTIONS
ltf(userSelection, choice1, choice2, ...)
Returns the optimal lower timeframe string based on user selection and current chart timeframe. Dynamically calculates precision to balance granularity with historical coverage within the 200K intrabar limit.
ltfStats(intrabarValues)
Analyzes an intrabar array returned by request.security_lower_tf() and returns statistics: number of intrabars in current bar, total chart bars covered, and average intrabars per bar.
█ CREDITS AND LICENSING
Original Concept : PineCoders Team
Original Lower TF Library :
License : Mozilla Public License 2.0

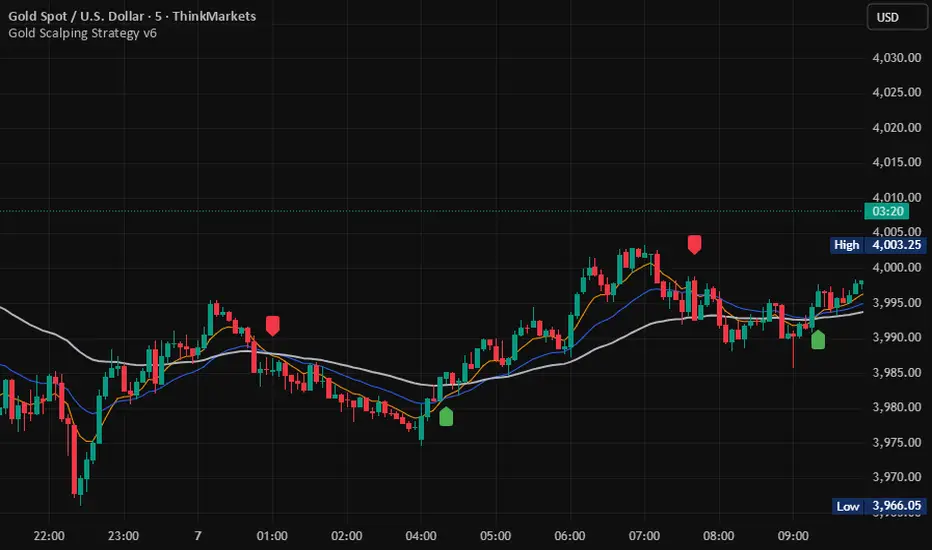
Candle Range Theory for SeSe04Small Candle Theory — Automatic Detection of Micro-Retracements
📘 Description
The Small Candle Theory indicator automatically identifies market structures where a small candle forms within the range of a larger previous candle, highlighting potential momentum slowdown or local reversal areas.
This is a price action visualization tool, not a trading signal provider.
⚙️ Detection Conditions
📈 Bullish Signal
Candle 1: Large bearish candle
Candle 2: Small bullish candle
Candle 2 closes within the range of Candle 1
→ A blue triangle appears below the confirmation candle.
📉 Bearish Signal
Candle 1: Large bullish candle
Candle 2: Small bearish candle
Candle 2 closes within the range of Candle 1
→ A red triangle appears above the confirmation candle.
🧠 How to Use
This indicator does not generate buy/sell signals.
It highlights moments of reduced volatility that may precede a potential reversal or continuation, depending on market structure.
Best used:
In confluence with structure tools (support/resistance, order blocks, FVGs, etc.)
With strict risk management
On multiple timeframes
⚙️ Settings
No manual input is required.
Detection logic is automatic and works on any asset or timeframe.
🛎️ Alerts (optional)
You can create an alert in TradingView:
"Create Alert" → Condition: Small Candle Theory (Bullish or Bearish)
to receive notifications when a setup appears.
⚠️ Disclaimer
This script is for educational and analytical purposes only.
It does not constitute financial advice.
Trading involves the risk of losing part or all of your invested capital.

Overnight Time Box Overnight Time Box (22:59 → 09:59, minutes & TZ)
Automatically draws a time-based box for a customizable window that can cross midnight. Perfect for marking the overnight range up to London open (e.g., 22:59–09:59 in Europe/Bucharest), but works with any minute-level window.
What it does
Builds a daily box covering all price action between two user-defined times (e.g., 22:59 → 09:59).
Tracks session High/Low in real time and can plot extended HL lines for reference.
Keeps historical boxes on the chart for backtesting and review (no flicker, no errors).
How to use
Add the script to an intraday chart.
Configure:
Time zone (default: Europe/Bucharest).
Interval (HHMM-HHMM) — e.g., 2259-0959 (minutes supported).
Optional: High/Low lines, fill color, border color, line width.
Use on intraday timeframes (M1–H4).
Note: On Daily/Weekly/Monthly, a heads-up label reminds you it’s designed for intraday use.
Inputs
Time zone: correct DST handling.
Interval (HHMM-HHMM): supports windows that span midnight.
Draw High/Low lines: extended HL guides for the session.
Colors & widths: full visual customization.
Use cases
Mark the overnight range into London open (10:00 RO).
Delimit Killzones / ICT Silver Bullet windows.
Study range, liquidity raids, FVGs before major sessions.
Tech notes
Built on Pine Script v5 using input.session → stable, DST-safe.
Increased max_boxes_count / max_lines_count to preserve history.
Boxes are “frozen” at session end and remain on chart.
Limitations
Intended for intraday only.
One interval per script instance; attach multiple instances for multiple windows.

Smart Money Flow Index (SMFI) - Advanced SMC [PhenLabs]📊Smart Money Flow Index (SMFI)
Version: PineScript™v6
📌Description
The Smart Money Flow Index (SMFI) is an advanced Smart Money Concepts implementation that tracks institutional trading behavior through multi-dimensional analysis. This comprehensive indicator combines volume-validated Order Block detection, Fair Value Gap identification with auto-mitigation tracking, dynamic Liquidity Zone mapping, and Break of Structure/Change of Character detection into a unified system.
Unlike basic SMC indicators, SMFI employs a proprietary scoring algorithm that weighs five critical factors: Order Block strength (validated by volume), Fair Value Gap size and recency, proximity to Liquidity Zones, market structure alignment (BOS/CHoCH), and multi-timeframe confluence. This produces a Smart Money Score (0-100) where readings above 70 represent optimal institutional setup conditions.
🚀Points of Innovation
Volume-Validated Order Block Detection – Only displays Order Blocks when formation candle exceeds customizable volume multiplier (default 1.5x average), filtering weak zones and highlighting true institutional accumulation/distribution
Auto-Mitigation Tracking System – Fair Value Gaps and Order Blocks automatically update status when price mitigates them, with visual distinction between active and filled zones preventing trades on dead levels
Proprietary Smart Money Score Algorithm – Combines weighted factors (OB strength 25%, FVG proximity 20%, Liquidity 20%, Structure 20%, MTF 15%) into single 0-100 confidence rating updating in real-time
ATR-Based Adaptive Calculations – All distance measurements use 14-period Average True Range ensuring consistent function across any instrument, timeframe, or volatility regime without manual recalibration
Dynamic Age Filtering – Automatically removes liquidity levels and FVGs older than configurable thresholds preventing chart clutter while maintaining relevant levels
Multi-Timeframe Confluence Integration – Analyzes higher timeframe bias with customizable multipliers (2-10x) and incorporates HTF trend direction into Smart Money Score for institutional alignment
🔧Core Components
Order Block Engine – Detects institutional supply/demand zones using characteristic patterns (down-move-then-strong-up for bullish, up-move-then-strong-down for bearish) with minimum volume threshold validation, tracks mitigation when price closes through zones
Fair Value Gap Scanner – Identifies price imbalances where current candle's low/high leaves gap with two-candle-prior high/low, filters by minimum size percentage, monitors 50% fill for mitigation status
Liquidity Zone Mapper – Uses pivot high/low detection with configurable lookback to mark swing points where stop losses cluster, extends horizontal lines to visualize sweep targets, manages lifecycle through age-based removal
Market Structure Analyzer – Tracks pivot progression to identify trend through higher-highs/higher-lows (bullish) or lower-highs/lower-lows (bearish), detects Break of Structure and Change of Character for trend/reversal confirmation
Scoring Calculation Engine – Evaluates proximity to nearest Order Blocks using ATR-normalized distance, assesses FVG recency and distance, calculates liquidity proximity with age weighting, combines structure bias and MTF trend into smoothed final score
🔥Key Features
Customizable Display Limits – Control maximum Order Blocks (1-10), Liquidity Zones (1-10), and FVG age (10-200 bars) to maintain clean charts focused on most relevant institutional levels
Gradient Strength Visualization – All zones render with transparency-adjustable coloring where stronger/newer zones appear more solid and weaker/older zones fade progressively providing instant visual hierarchy
Educational Label System – Optional labels identify each zone type (Bullish OB, Bearish OB, Bullish FVG, Bearish FVG, BOS) with color-coded text helping traders learn SMC concepts through practical application
Real-Time Smart Money Score Dashboard – Top-right table displays current score (0-100) with color coding (green >70, yellow 30-70, red <30) plus trend arrow for at-a-glance confidence assessment
Comprehensive Alert Suite – Configurable notifications for Order Block formation, Fair Value Gap detection, Break of Structure events, Change of Character signals, and high Smart Money Score readings (>70)
Buy/Sell Signal Integration – Automatically plots triangle markers when Smart Money Score exceeds 70 with aligned market structure and fresh Order Block detection providing clear entry signals
🎨Visualization
Order Block Boxes – Shaded rectangles extend from formation bar spanning high-to-low of institutional candle, bullish zones in green, bearish in red, with customizable transparency (80-98%)
Fair Value Gap Zones – Rectangular areas marking imbalances, active FVGs display in bright colors with adjustable transparency, mitigated FVGs switch to gray preventing trades on filled zones
Liquidity Level Lines – Dashed horizontal lines extend from pivot creation points, swing highs in bearish color (short targets above), swing lows in bullish color (long targets below), opacity decreases with age
Structure Labels – "BOS" labels appear above/below price when Break of Structure confirmed, colored by direction (green bullish, red bearish), positioned at 1% beyond highs/lows for visibility
Educational Info Panel – Bottom-right table explains key terminology (OB, FVG, BOS, CHoCH) and score interpretation (>70 high probability) with semi-transparent background for readability
📖Usage Guidelines
General Settings
Show Order Blocks – Default: On, toggles visibility of institutional supply/demand zones, disable when focusing solely on FVGs or Liquidity
Show Fair Value Gaps – Default: On, controls FVG zone display including active and mitigated imbalances
Show Liquidity Zones – Default: On, manages liquidity line visibility, disable on lower timeframes to reduce clutter
Show Market Structure – Default: On, toggles BOS/CHoCH label display
Show Smart Money Score – Default: On, controls score dashboard visibility
Order Block Settings
OB Lookback Period – Default: 20, Range: 5-100, controls bars scanned for Order Block patterns, lower values detect recent activity, higher values find older blocks
Min Volume Multiplier – Default: 1.5, Range: 1.0-5.0, sets minimum volume threshold as multiple of 20-period average, higher values (2.0+) filter for strongest institutional candles
Max Order Blocks to Display – Default: 3, Range: 1-10, limits simultaneous Order Blocks shown, lower settings (1-3) maintain focus on most recent zones
Fair Value Gap Settings
Min FVG Size (%) – Default: 0.3, Range: 0.1-2.0, defines minimum gap size as percentage of close price, lower values detect micro-imbalances, higher values focus on significant gaps
Max FVG Age (bars) – Default: 50, Range: 10-200, removes FVGs older than specified bars, lower settings (10-30) for scalping, higher (100-200) for swing trading
Show FVG Mitigation – Default: On, displays filled FVGs in gray providing visual history, disable to show only active untouched imbalances
Liquidity Zone Settings
Liquidity Lookback – Default: 50, Range: 20-200, sets pivot detection period for swing highs/lows, lower values (20-50) mark shorter-term liquidity, higher (100-200) identify major swings
Max Liquidity Age (bars) – Default: 100, Range: 20-500, removes liquidity lines older than specified bars, adjust based on timeframe
Liquidity Sensitivity – Default: 0.5, Range: 0.1-1.0, controls pivot detection sensitivity, lower values mark only major swings, higher values identify minor swings
Max Liquidity Zones to Display – Default: 3, Range: 1-10, limits total liquidity levels shown maintaining chart clarity
Market Structure Settings
Pivot Length – Default: 5, Range: 3-15, defines bars to left/right for pivot validation, lower values (3-5) create sensitive structure breaks, higher (10-15) filter for major shifts
Min Structure Move (%) – Default: 1.0, Range: 0.1-5.0, sets minimum percentage move required between pivots to confirm structure change
Multi-Timeframe Settings
Enable MTF Analysis – Default: On, activates higher timeframe trend analysis incorporation into Smart Money Score
Higher Timeframe Multiplier – Default: 4, Range: 2-10, multiplies current timeframe to determine analysis timeframe (4x on 15min = 1hour)
Visual Settings
Bullish Color – Default: Green (#089981), sets color for bullish Order Blocks, FVGs, and structure elements
Bearish Color – Default: Red (#f23645), defines color for bearish elements
Neutral Color – Default: Gray (#787b86), controls color of mitigated zones and neutral elements
Show Educational Labels – Default: On, displays text labels on zones identifying type (OB, FVG, BOS), disable once familiar with patterns
Order Block Transparency – Default: 92, Range: 80-98, controls Order Block box transparency
FVG Transparency – Default: 92, Range: 80-98, sets Fair Value Gap zone transparency independently from Order Blocks
Alert Settings
Alert on Order Block Formation – Default: On, triggers notification when new volume-validated Order Block detected
Alert on FVG Formation – Default: On, sends alert when Fair Value Gap appears enabling quick response to imbalances
Alert on Break of Structure – Default: On, notifies when BOS or CHoCH confirmed
Alert on High Smart Money Score – Default: On, alerts when Smart Money Score crosses above 70 threshold indicating high-probability setup
✅Best Use Cases
Order Block Retest Entries – After Break of Structure, wait for price retrace into fresh bullish Order Block with Smart Money Score >70, enter long on zone reaction targeting next liquidity level
Fair Value Gap Retracement Trading – When price creates FVG during strong move then retraces, enter as price approaches unfilled gap expecting institutional orders to continue trend
Liquidity Sweep Reversals – Monitor price approaching swing high/low liquidity zones against prevailing Smart Money Score trend, after stop hunt sweep watch for rejection into premium Order Block/FVG
Multi-Timeframe Confluence Setups – Identify alignment when current timeframe Order Block coincides with higher timeframe FVG plus MTF analysis showing matching trend bias
Break of Structure Continuations – After BOS confirms trend direction, trade pullbacks to nearest Order Block or FVG in direction of structure break using Smart Money Score >70 as entry filter
Change of Character Reversal Plays – When CHoCH detected indicating potential reversal, look for Smart Money Score pivot with opposing Order Block formation then enter on structure confirmation
⚠️Limitations
Lagging Pivot Calculations – Pivot-based features (Liquidity Zones, Market Structure) require bars to right of pivot for confirmation, meaning these elements identify levels retrospectively with delay equal to lookback period
Whipsaw in Ranging Markets – During choppy conditions, Order Blocks fail frequently and structure breaks produce false signals as Smart Money Score fluctuates without clear institutional bias, best used in trending markets
Volume Data Dependency – Order Block volume validation requires accurate volume data which may be incomplete on Forex pairs or limited in crypto exchange feeds
Subjectivity in Scoring Weights – Proprietary 25-20-20-20-15 weighting reflects general institutional behavior but may not optimize for specific instruments or market regimes, user cannot adjust factor weights
Visual Complexity on Lower Timeframes – Sub-hour timeframes generate excessive zones creating cluttered charts, requires aggressive display limit reduction and higher minimum thresholds
No Fundamental Integration – Indicator analyzes purely technical price action and volume without incorporating economic events, news catalysts, or fundamental shifts that override technical levels
💡What Makes This Unique
Unified SMC Ecosystem – Unlike indicators displaying Order Blocks OR FVGs OR Liquidity separately, SMFI combines all three institutional concepts plus market structure into single cohesive system
Proprietary Confidence Scoring – Rather than manual setup assessment, automated Smart Money Score quantifies probability by weighting five institutional dimensions into actionable 0-100 rating
Volume-Filtered Quality – Eliminates weak Order Blocks forming without institutional volume confirmation, ensuring displayed zones represent genuine accumulation/distribution
Adaptive Lifecycle Management – Automatically updates mitigation status and removes aged zones preventing trades on dead levels through continuous validity and age monitoring
Educational Integration – Built-in tooltips, labeled zones, and reference panel make indicator functional for both learning Smart Money Concepts and executing strategies
🔬How It Works
Order Block Detection – Scans for patterns where strong directional move follows counter-move creating last down-candle before rally (bullish OB) or last up-candle before sell-off (bearish OB), validates formations only when candle exhibits volume exceeding configurable multiple (default 1.5x) of 20-bar average volume
Fair Value Gap Identification – Compares current candle’s high/low against two-candles-prior low/high to detect price imbalances, calculates gap size as percentage of close and filters micro-gaps below minimum threshold (default 0.3%), monitors whether subsequent price fills 50% triggering mitigation status
Liquidity Zone Mapping – Employs pivot detection using configurable lookback (default 50 bars) to identify swing highs/lows where retail stops cluster, extends horizontal reference lines from pivot creation and applies age-based filtering to remove stale zones
Market Structure Analysis – Tracks pivot progression using structure-specific lookback (default 5 bars) to determine trend, confirms uptrend when new pivot high exceeds previous by minimum move percentage, detects Break of Structure when price breaks recent pivot level, flags Change of Character for potential reversals
Multi-Timeframe Confluence – When enabled, requests security data from higher timeframe (current TF × HTF multiplier, default 4x), compares HTF close against HTF 20-period MA to determine bias, contributes ±50 points to score ensuring alignment with institutional positioning on superior timeframe
Smart Money Score Calculation – Evaluates Order Block component via ATR-normalized distance producing max 100-point contribution weighted at 25%, assesses FVG factor through age penalty and distance at 20% weight, calculates Liquidity proximity at 20%, incorporates structure bias (±50-100 points) at 20%, adds MTF component at 15%, applies 3-period smoothing to reduce volatility
Visual Rendering and Lifecycle – Draws Order Block boxes, Fair Value Gap rectangles with color coding (green/red active, gray mitigated), extends liquidity dashed lines with fade-by-age opacity, plots BOS labels, displays Smart Money Score dashboard, continuously updates checking mitigation conditions and removing elements exceeding age/display limits
💡Note:
The Smart Money Flow Index combines multiple Smart Money Concepts into unified institutional order flow analysis. For optimal results, use the Smart Money Score as confluence filter rather than standalone entry signal – scores above 70 indicate high-probability setups but should be combined with risk management, higher timeframe bias, and market regime understanding.

Higher Timeframe Box & Divider - All Candles [GoldnHunt]The Higher Timeframe Box & Divider – All Candles indicator visually maps higher timeframe candles onto lower timeframe charts.
It highlights the open and close range of each higher timeframe candle as a box, along with a vertical divider marking the start of each new period.
This helps traders clearly see higher timeframe structure and momentum flow without switching charts.
Features:
Draws a box showing only the body (open to close) of each higher timeframe candle.
Uses candle color to represent bullish and bearish momentum.
Adds a divider line for each new higher timeframe candle.
Works across all symbols and timeframes.
Lightweight and optimized for performance.
Use case:
Perfect for traders using multi-timeframe (MTF) analysis who want to visualize higher timeframe candle progression while observing lower timeframe price action.

EMA921// ─────────────────────────────────────────────
// Notes for Publishing
// ─────────────────────────────────────────────
// This script plots EMA 9 and EMA 21 with trend shading.
// Colors: EMA 9 = Orange, EMA 21 = White
// Ideal for short-term trend following & entries.

Accurate ATR Stop Loss Distance — Risk Management ToolAccurate ATR Stop Loss Distance — Risk Management Tool
This indicator calculates an accurate Stop Loss distance in pips using the Average True Range (ATR) multiplied by a user-defined multiplier.
It automatically detects the correct pip size based on the instrument type (Forex, Crypto, Stocks, Indices, Futures), adjusting for 2-, 3-, 4-, or 5-digit quotes — ensuring professional-grade precision that matches institutional ATR-based risk systems.
📊 Features:
Uses ATR × Multiplier to determine precise SL distance in pips.
Automatically adjusts pip value depending on the asset type (handles 5-digit Forex brokers).
Clean and minimal design — displays only one info box in the top-right corner.
Fully customizable text and background colors.
Includes alert condition for automated SL updates.
⚙️ How to use:
Set your preferred ATR period and multiplier.
The indicator instantly displays your Stop Loss distance in pips at the top-right of the chart.
Combine with your entry strategy to calculate lot size or risk per trade.
💡 Ideal for traders who want consistent, objective SL distances derived from volatility rather than arbitrary points or emotions.
Note: Educational and informational tool only. Does not execute trades or give financial advice.

Ichimoku Strict exit indicatorIndicator for ichimoku with exit
entry - when all cond meet
exit on base line

Session Dominator — Asia • London • New York Precision ZonesRule the global market sessions.
Session Dominator is a precision-engineered indicator built for traders who want total clarity across Asia, London, and New York sessions.
It automatically plots:
🔷 Dynamic Session Boxes — visually map institutional killzones in real time
⚙️ Session Mean Line — track equilibrium and liquidity shifts
📊 EMA-50 Confluence — align directional bias and intraday trend
🎯 BSL / SSL Levels — reveal active liquidity sweeps and reversals
💡 Bias Engine — evaluates structure and locks the session bias automatically
Toggle between Asia / London / New York / Overlap / Custom modes to dominate any timezone.
Designed with minimalist visuals, high precision, and ICT-based logic — this tool helps you anticipate where liquidity will be taken before it happens.
✳️ For XAUUSD traders, scalpers, and ICT-style analysts seeking sniper-level clarity.

RAFEN-G - Kill Zones & Institutional Gaps🔍 What It Does
Kill Zones (KZ1, KZ2, KZ3)
Automatically highlights the main intraday liquidity windows such as the London open, NY AM, and NY PM sessions — customizable by time, color, and transparency.
Perfect for timing setups, identifying liquidity sweeps, or backtesting session behavior.
Institutional GAP Detection (NY 11:00 → 03:00)
Anchored on the New York H1 clock, the script automatically draws the “institutional gap” between the 11:00 close and the 03:00 open of the next trading day.
Each gap is drawn as a transparent box with a label showing its size in price units.
Dynamic Cleanup & Color Updates
Automatically removes old boxes beyond your chosen history limit and keeps all visuals perfectly synchronized in real-time.
⚙️ Key Features
3 fully independent and editable Kill Zones
Adjustable timezone (default: America/New_York)
Works on all intraday timeframes
Auto-management of historical data
Clean and lightweight visuals (up to 2000 boxes)
Real-time color and transparency updates
Alerts when each Kill Zone starts
🧠 Ideal For
Traders using ICT, SMC, or institutional frameworks who want clear visual separation of market sessions and automatic tracking of session-to-session gaps for confluence or imbalance analysis.
🕐 Recommended Use
Apply on 5 min / 15 min / 1 h charts, align timezone to NYC, and combine with liquidity or FVG tools for maximum insight.

korea time with 200 korea time
start time
08
09
17
18
23
00
This script makes it easier to look at the charts
The time automatically displays even if you don't bother to bring the mouse by hand
Now you can see the time intuitively
Run a very happy trading session


VIX/VVIX Spike RiskVIX/VVIX Spike Risk Analyzer
The VIX/VVIX Spike Risk Analyzer analyzes historical VIX behavior under similar market conditions to forecast future VIX spike risk.
By combining current VIX and VVIX levels as dual filters, it identifies historical precedents and calculates the probability and magnitude of VIX spikes over the next 1, 5, and 10 trading days.
IMPORTANT: This indicator must be applied to the VIX chart (CBOE:VIX) to function correctly.
Methodology
1. Dual-Filter Pattern Matching
The indicator uses both VIX and VVIX as simultaneous filters to identify historically analogous market conditions:
By requiring BOTH metrics to match historical levels, the indicator creates more precise market condition filters than using VIX alone. This dual-filter approach significantly improves predictive accuracy because:
VIX alone might be at 15, but VVIX can tell us if that 15 is stable (low VVIX) or explosive (high VVIX)
High VVIX + Low VIX often precedes major spikes
Low VVIX + Low VIX suggests sustained calm
2. Tolerance Settings
VIX Matching (Default: ±10% Relative)
Uses relative percentage matching for consistency across different VIX regimes
Example: VIX at 15 matches 13.5-16.5 (±10%)
Can switch to absolute tolerance (±5 points) if preferred
VVIX Matching (Default: ±10 Points Absolute)
Uses absolute point matching as VVIX scales differently
Example: VVIX at 100 matches 90-110
Can switch to relative percentage if preferred
3. Historical Analysis Window
The indicator scans up to 500 bars backward (limited by VVIX data availability) to find all historical periods where both VIX and VVIX were at similar levels. Each match becomes a "sample" for statistical analysis.
4. Forward-Looking Spike Analysis
For each historical match, the indicator measures VIX behavior over the next 1, 5, and 10 days
Display Metrics Explained
Average Highest Spike
Shows the average of the maximum VIX spikes observed.
Highest Single Spike
Shows the single largest spike ever recorded
Probability No 10% Spike
Shows what percentage of historical cases stayed BELOW a 10% spike:
Probability No 20% Spike
Shows what percentage of historical cases stayed BELOW a 20% spike:
Note : You'll see many more shaded bars than the sample count because each match creates up to 5 consecutive shaded bars (bars 1-5 after the match all "look back" and see it).
Short Volatility Strategies:
Enter when there's a LOW probability of big vol spikes based on today's metrics
Long Volatility Strategies
Enter when there's a HIGH probability of big vol spikes based on today's metrics
