Institutional Volume Footprint ProOVERVIEW
The Institutional Volume Footprint Pro is a comprehensive volume analysis indicator designed to identify institutional trading activity and significant volume patterns. Based on the proven Pocket Pivot Volume methodology by Chris Kacher and Gil Morales, this indicator has been enhanced with multiple additional volume analysis techniques to provide traders with a complete picture of smart money movements.
KEY FEATURES
1. Pocket Pivot Volume (PPV) Detection
- Identifies bullish volume patterns where current volume exceeds the highest down-day volume of the past 10 days
- Blue volume bars with "PPV" labels mark potential institutional accumulation
- Customizable lookback period (5-20 days)
2. Pivot Negative Volume (PNV) Detection
- Spots bearish volume patterns where selling volume exceeds recent up-day volumes
- Orange bars with "PNV" labels indicate potential institutional distribution
- Early warning system for trend reversals
3. Advanced Institutional Patterns
- Accumulation Detection (Aqua): High volume with narrow price range - classic stealth accumulation
- Churning/Distribution (Yellow): Heavy volume with minimal price progress - potential topping pattern
- Volume Dry-up (Purple): Extremely low volume periods that often precede significant moves
- Volume Climax (Fuchsia): Extreme volume spikes signaling potential exhaustion
4. Real-time Analytics Dashboard
- Relative Volume: Current volume compared to 10-day average
- Volume vs MA: Multiple of current volume to selected moving average
- Price Range Analysis: Narrow/Normal/Wide range classification
5. Accumulation/Distribution Trend
- Background coloring shows overall money flow direction
- Green tint: Net accumulation phase
- Red tint: Net distribution phase
HOW TO USE
Entry Signals:
- PPV (Blue): Consider long positions when price breaks above resistance with PPV confirmation
- Accumulation (Aqua): Watch for breakouts following multiple accumulation days
- Volume Dry-up (Purple): Prepare for potential explosive moves
Exit/Warning Signals:
- PNV (Orange): Consider taking profits or tightening stops
- Churning (Yellow): Distribution may be occurring despite stable prices
- Volume Climax (Fuchsia): Potential reversal point - extreme caution advised
CUSTOMIZATION OPTIONS
Analysis Parameters:
- PPV Lookback Period (5-20 days)
- Volume MA Length & Type (SMA/EMA/WMA)
- Relative Volume Threshold
- Climax Volume Multiplier
Visual Controls:
- Toggle Info Table display
- Enable/disable individual label types (PPV, PNV, ACC)
- Show/hide volume moving averages
- Control A/D trend background
- Customize threshold lines
BUILT-IN ALERTS
- Pocket Pivot Volume detected
- Pivot Negative Volume detected
- Institutional Accumulation pattern
- Volume Climax warning
- Volume Dry-up alert
PRO TIPS
1. Combine with Price Action: Volume confirms price - look for PPV at breakouts and PNV at breakdowns
2. Multiple Timeframes: Check daily and weekly charts for confluence
3. Relative Volume Matters: Patterns are stronger when relative volume > 1.5x
4. Watch for Divergences: Price up with decreasing volume = weakness
COLOR LEGEND
- Blue: Pocket Pivot Volume (Bullish)
- Orange: Pivot Negative Volume (Bearish)
- Aqua: Institutional Accumulation
- Yellow: Churning/Distribution
- Purple: Volume Dry-up
- Fuchsia: Volume Climax
- Green: Above-average up volume
- Red: Above-average down volume
- Gray: Below-average volume
EDUCATIONAL BACKGROUND
This indicator implements concepts from:
- "Trade Like an O'Neil Disciple" by Gil Morales & Chris Kacher
- William O'Neil's volume analysis principles
- Richard Wyckoff's accumulation/distribution methodology
Happy Trading! May the volume be with you!
Wyszukaj w skryptach "纳斯达克指数期货cfd"

magic wand STSM"Magic Wand STSM" Strategy: Trend-Following with Dynamic Risk Management
Overview:
The "Magic Wand STSM" (Supertrend & SMA Momentum) is an automated trading strategy designed to identify and capitalize on sustained trends in the market. It combines a multi-timeframe Supertrend for trend direction and potential reversal signals, along with a 200-period Simple Moving Average (SMA) for overall market bias. A key feature of this strategy is its dynamic position sizing based on a user-defined risk percentage per trade, and a built-in daily and monthly profit/loss tracking system to manage overall exposure and prevent overtrading.
How it Works (Underlying Concepts):
Multi-Timeframe Trend Confirmation (Supertrend):
The strategy uses two Supertrend indicators: one on the current chart timeframe and another on a higher timeframe (e.g., if your chart is 5-minute, the higher timeframe Supertrend might be 15-minute).
Trend Identification: The Supertrend's direction output is crucial. A negative direction indicates a bearish trend (price below Supertrend), while a positive direction indicates a bullish trend (price above Supertrend).
Confirmation: A core principle is that trades are only considered when the Supertrend on both the current and the higher timeframe align in the same direction. This helps to filter out noise and focus on stronger, more confirmed trends. For example, for a long trade, both Supertrends must be indicating a bearish trend (price below Supertrend line, implying an uptrend context where price is expected to stay above/rebound from Supertrend). Similarly, for short trades, both must be indicating a bullish trend (price above Supertrend line, implying a downtrend context where price is expected to stay below/retest Supertrend).
Trend "Readiness": The strategy specifically looks for situations where the Supertrend has been stable for a few bars (checking barssince the last direction change).
Long-Term Market Bias (200 SMA):
A 200-period Simple Moving Average is plotted on the chart.
Filter: For long trades, the price must be above the 200 SMA, confirming an overall bullish bias. For short trades, the price must be below the 200 SMA, confirming an overall bearish bias. This acts as a macro filter, ensuring trades are taken in alignment with the broader market direction.
"Lowest/Highest Value" Pullback Entries:
The strategy employs custom functions (LowestValueAndBar, HighestValueAndBar) to identify specific price action within the recent trend:
For Long Entries: It looks for a "buy ready" condition where the price has found a recent lowest point within a specific number of bars since the Supertrend turned bearish (indicating an uptrend). This suggests a potential pullback or consolidation before continuation. The entry trigger is a close above the open of this identified lowest bar, and also above the current bar's open.
For Short Entries: It looks for a "sell ready" condition where the price has found a recent highest point within a specific number of bars since the Supertrend turned bullish (indicating a downtrend). This suggests a potential rally or consolidation before continuation downwards. The entry trigger is a close below the open of this identified highest bar, and also below the current bar's open.
Candle Confirmation: The strategy also incorporates a check on the candle type at the "lowest/highest value" bar (e.g., closevalue_b < openvalue_b for buy signals, meaning a bearish candle at the low, suggesting a potential reversal before a buy).
Risk Management and Position Sizing:
Dynamic Lot Sizing: The lotsvalue function calculates the appropriate position size based on your Your Equity input, the Risk to Reward ratio, and your risk percentage for your balance % input. This ensures that the capital risked per trade remains consistent as a percentage of your equity, regardless of the instrument's volatility or price. The stop loss distance is directly used in this calculation.
Fixed Risk Reward: All trades are entered with a predefined Risk to Reward ratio (default 2.0). This means for every unit of risk (stop loss distance), the target profit is rr times that distance.
Daily and Monthly Performance Monitoring:
The strategy tracks todaysWins, todaysLosses, and res (daily net result) in real-time.
A "daily profit target" is implemented (day_profit): If the daily net result is very favorable (e.g., res >= 4 with todaysLosses >= 2 or todaysWins + todaysLosses >= 8), the strategy may temporarily halt trading for the remainder of the session to "lock in" profits and prevent overtrading during volatile periods.
A "monthly stop-out" (monthly_trade) is implemented: If the lres (overall net result from all closed trades) falls below a certain threshold (e.g., -12), the strategy will stop trading for a set period (one week in this case) to protect capital during prolonged drawdowns.
Trade Execution:
Entry Triggers: Trades are entered when all buy/sell conditions (Supertrend alignment, SMA filter, "buy/sell situation" candle confirmation, and risk management checks) are met, and there are no open positions.
Stop Loss and Take Profit:
Stop Loss: The stop loss is dynamically placed at the upTrendValue for long trades and downTrendValue for short trades. These values are derived from the Supertrend indicator, which naturally adjusts to market volatility.
Take Profit: The take profit is calculated based on the entry price, the stop loss, and the Risk to Reward ratio (rr).
Position Locks: lock_long and lock_short variables prevent immediate re-entry into the same direction once a trade is initiated, or after a trend reversal based on Supertrend changes.
Visual Elements:
The 200 SMA is plotted in yellow.
Entry, Stop Loss, and Take Profit lines are plotted in white, red, and green respectively when a trade is active, with shaded areas between them to visually represent risk and reward.
Diamond shapes are plotted at the bottom of the chart (green for potential buy signals, red for potential sell signals) to visually indicate when the buy_sit or sell_sit conditions are met, along with other key filters.
A comprehensive trade statistics table is displayed on the chart, showing daily wins/losses, daily profit, total deals, and overall profit/loss.
A background color indicates the active trading session.
Ideal Usage:
This strategy is best applied to instruments with clear trends and sufficient liquidity. Users should carefully adjust the Your Equity, Risk to Reward, and risk percentage inputs to align with their individual risk tolerance and capital. Experimentation with different ATR Length and Factor values for the Supertrend might be beneficial depending on the asset and timeframe.

BVB dominance bars
Hello everyone, this is my first indicator. these candles shows you who's in control. I like to think its some what close to heikin ashi candles as it shows you the Trend but doesn't average it out. also shows you when there is indecision. please read the instructions on how it works. its not a stand alone strategy. but adds value to your own strategy.
📖 How It Works
The BvB Dominance Bars indicator is a visual tool that colors candles based on market control—whether bulls or bears are in charge. It uses a custom metric comparing the price's relationship to a smoothed moving average (EMA), then normalizes that difference over time to express relative bullish or bearish pressure.
Here’s the breakdown:
Bulls vs Bears Logic:
A short-term EMA (default: 14-period) is used to establish a midpoint reference.
Bull Pressure is calculated as how far the high is above this EMA.
Bear Pressure is how far the low is below this EMA.
These are normalized over a lookback period (default: 120 bars) to produce percentile scores (0–100) for both bulls and bears.
Dominance & Color Coding:
The indicator compares normalized bull and bear scores.
Candles are color-coded based on:
Bright Lime: Strong Bull Dominance (with high confidence)
Soft Lime/Yellow: Moderate Bull Control
Bright Red: Strong Bear Dominance
Soft Red/Yellow: Moderate Bear Control
Gray: Neutral/Low conviction
Optional Live Label:
A small floating label shows who has control: “Bull Control,” “Bear Control,” or “Neutral.”
🧠 How to Use It (Example Strategy)
The BvB Dominance Bars indicator is not a standalone buy/sell signal but a market sentiment overlay. It’s most effective when combined with your own strategy, like price action or trend-following tools.
Here’s an example use case:
🧪 Reversal Confirmation Strategy
Objective: Catch high-probability reversals during key kill zones or supply/demand levels.
Setup:
Mark your key support/resistance zones using your standard method (e.g., FVGs, liquidity sweeps, or ICT PD arrays).
Wait for price to reach one of these zones.
Watch candle colors from the BvB Dominance Bars:
If you expect a bullish reversal, wait for a transition from red/gray candles to lime green or bright lime (bullish dominance taking over).
If you expect a bearish reversal, look for a change from green/gray to red or bright red.
Entry Filter:
Only enter if the dominant color holds for 2+ candles.
Avoid trades when candles are gray or yellow (indecision/neutral).
Exit Option:
Exit if dominance shifts against you (e.g., from lime to red), or use structure-based stops.
⚙️ Settings You Can Adjust:
BvB Period: Controls how fast EMA responds.
Bars Back: Determines how long the normalization looks back.
Thresholds: Influence how strong the dominance must be to change candle color.
✅ Best Used When:
You already have a bias and just want a confirmation of sentiment.
You're trading intraday and want a feel for shifting momentum without relying on noisy indicators.
You want a clean, color-coded overlay to help filter out fakeouts and indecision.

Jesus Vix Spike ComboThis script will:
Show you vix spikes with your 4 different settings.
Draw a white line at the start of each vix.
Draw a dotted green line for 3 spikes in 6 minutes.
Draw a dotted pink line for 3 spikes in 16 minutes.
Draw a green line extending right if it takes out a past low in the last 200 bars plus a spike.
It will also:
Place a white dot on the 5th candle if the price rises past the vix starting point,
a white omega sign on the 6th candle if price rises past the vix starting point,
and a large white dot on the 7th candle past the vix starting point if the price is higher.
It will also:
Show higher time frame EMAs and other emas.
Has some alerts added also.
I have only been using this on the 1 minute chart with $OANDA:SPX500USD.
Ill write about the strategy I use for this soon. But basically you wait for a drop and for some prominent lows to be taken out, then a vix, then your white dot, omega then the large white dot to enter, expect a 100% expansion from the vix low. More aggressive entry's would be the first white dot or 3 green candles in a row. Backtest to see.
Thanks for checking it out. Let me know if it can be better.
The original script is from Xxattaxx and Christ Moody I believe, thank you for sharing all your hard work.

ICT TIME ELEMENTS [KaninFX]## Overview
The ICT Time Elements indicator is a comprehensive trading tool designed to visualize the most critical market sessions and timeframes according to Inner Circle Trader (ICT) methodology. This indicator helps traders identify high-probability trading opportunities by highlighting key market sessions, killzones, and liquidity periods throughout the trading day.
## Key Features
### 🕐 Complete ICT Time Framework
- **Asian Range**: 8:00 PM - 12:00 AM (NY Time) - Evening consolidation period
- **London Killzone**: 2:00 AM - 5:00 AM (NY Time) - European market opening liquidity
- **NY Killzone**: 7:00 AM - 10:00 AM (NY Time) - US market opening with high volatility
- **Silver Bullet Sessions**:
- London Silver Bullet: 3:00 AM - 4:00 AM
- AM Silver Bullet: 10:00 AM - 11:00 AM
- PM Silver Bullet: 2:00 PM - 3:00 PM
- **Lunch Hours**: 5:00 AM - 7:00 AM & 12:00 PM - 1:00 PM (Lower volatility periods)
- **News Embargo**: 8:30 AM - 9:30 AM (High impact news release window)
- **20-Minute Macros**: :50 to :10 minutes of each hour (Short-term reversal periods)
- **True Day Close**: 4:00 PM - 4:30 PM (Official market close)
### 🎨 Visual Customization
- **Multiple Themes**: Dark, Light, and Custom color schemes
- **Adjustable Opacity**: Control zone transparency (0-100%)
- **Font Customization**: Tiny, Small, Normal, Large text sizes
- **Custom Colors**: Personalize each zone with your preferred colors
- **Professional Display**: Clean histogram visualization with zone labels
### 🌍 Multi-Timezone Support
Built-in support for major trading centers:
- America/New_York (Default)
- America/Chicago
- America/Los_Angeles
- Europe/London
- Asia/Tokyo
- Asia/Shanghai
- Australia/Sydney
### 📊 Smart Information Display
- **Real-time Zone Detection**: Automatically identifies current active session
- **Zone Labels**: Clear labeling at the center of each time period
- **Current Zone Indicator**: Arrow pointer showing the active session
- **Comprehensive Info Table**: Quick reference for all time zones and their schedules
- **Flexible Table Positioning**: Place info table in any corner of your chart
### ⚡ Performance Optimized
- **Memory Management**: Automatic cleanup of old labels to maintain performance
- **Efficient Processing**: Optimized time calculations for smooth operation
- **Resource Control**: Limited label generation to prevent system overload
## How It Works
The indicator continuously monitors the current time against predefined ICT session schedules. When price action enters a recognized time zone, the indicator:
1. **Highlights the Period**: Colors the histogram bar according to the active session
2. **Labels the Zone**: Places descriptive text identifying the current market condition
3. **Updates Info Table**: Shows current session status and complete schedule
4. **Tracks Macro Periods**: Identifies 20-minute reversal windows within major sessions
### Special Features
- **Macro Detection**: Automatically identifies when current time falls within a 20-minute macro period
- **Session Overlap Handling**: Properly manages overlapping time zones with priority logic
- **Dynamic Color Adjustment**: Theme-aware color selection for optimal visibility
## Best Use Cases
### For ICT Traders
- Identify optimal entry times during killzone sessions
- Recognize silver bullet opportunities for quick scalps
- Avoid trading during lunch hour consolidations
- Prepare for news embargo volatility
### For Session Traders
- Track major market session transitions
- Plan trading strategy around high-liquidity periods
- Understand global market flow and timing
### For Swing Traders
- Identify macro trend continuation points
- Time position entries during optimal sessions
- Understand market structure changes across sessions
## Installation & Setup
1. Add the indicator to your TradingView chart
2. Select your preferred timezone from the dropdown
3. Choose theme (Dark/Light) or customize colors
4. Adjust font size and table position to your preference
5. Enable/disable features as needed for your trading style
## Pro Tips
- **Combine with Price Action**: Use time zones alongside support/resistance levels
- **Focus on Killzones**: Highest probability setups occur during London and NY killzones
- **Watch Silver Bullets**: These 1-hour windows often provide excellent reversal opportunities
- **Respect Lunch Hours**: Lower volatility periods - consider smaller position sizes
- **News Embargo Awareness**: Prepare for potential whipsaws during 8:30-9:30 AM
## Conclusion
The ICT Time Elements indicator transforms complex ICT timing concepts into an easy-to-read visual tool. Whether you're a beginner learning ICT methodology or an experienced trader looking to optimize your timing, this indicator provides the essential market session awareness needed for successful trading.
*Compatible with all TradingView plans and timeframes. Works best on 1-minute to 1-hour charts for optimal session visualization.*

True Range eXpansion🕯️ TRX — True Range eXpansion
Clean Candle Bodies · Volatility Bands · Adaptive Range Envelope System
Not your grandfather’s candles. Not your brokerage’s bands.
----------------------------------------------------
TRX begins with a simple concept: visualize the true range of every candle, without the noise of flickering wicks.
From there, it grows into a fully adaptive price visualization framework.
What started as a candle-only visualizer evolved into a modular, user-controlled price engine.
From wickless candle clarity to dynamic volatility envelopes, TRX adapts to you.
There are plenty of band and channel indicators out there — Bollinger, Keltner, Donchian, Envelope, the whole crew.
But none of them are built on the true candle range, adaptive ATR shaping, and full user control like TRX.
This isn’t just another indicator — it’s a new framework.
Most bands and channels are based on close price and statistical deviation — useful, but limited.
TRX uses the full true range of each candle as its foundation, then applies customizable smoothing and directional ATR scaling to form a dynamic, volatility-reactive envelope.
The result? Bands that breathe with the market — not lag behind it.
----------------------------------------------------
🔧 Core Features:
🕯️ True Range Candles — Each candle is plotted from low to high, body-only, colored by open/close.
📈 Adjustable High/Low Moving Averages — Select your smoothing style: SMA, EMA, WMA, RMA, or HMA.
🌬️ ATR-Based Expansion — Bands dynamically breathe based on market volatility.
🔀 Per-Band Multipliers — Fine-tune expansion individually for the upper and lower bands.
⚖️ Basis Line — Optional centerline between bands for structure tracking and equilibrium zones.
🎛️ Full Visual Control — Width, transparency, color, on/off toggles for each element.
----------------------------------------------------
🧠 Default Use Case:
With the included default settings, TRX behaves like an evolved Bollinger Band system — based on True Range candle structure, not just close price and standard deviation.
----------------------------------------------------
🔄 How to Zero Out the Bands (for Minimalist Use):
Want just candles? A clean MA? Single band? You got it.
➤ Use TRX like a clean moving average:
• Set ATR Multiplier to 0
• Set both Band ATR Adjustments to 0
• Leave the Basis Line ON or OFF — your call
➤ Show only candles (no bands at all):
• Turn off "Show High/Low MAs"
• Turn off Basis Line
➤ Single-line ceiling or floor tracking:
• Set one band’s Transparency to 100
• Use the remaining band as a price envelope or support/resistance guide
----------------------------------------------------
🧬 Notes:
TRX can be made:
• Spiky or silky (via smoothing & ATR)
• Wide or tight (via multipliers)
• Subtle or aggressive (via color/transparency)
• Clean as a compass or dirty as a chaos meter
Built by accident. Tuned with intention.
Released to the world as one of the most adaptable and expressive visual overlays ever made.
Created by Sherlock_MacGyver

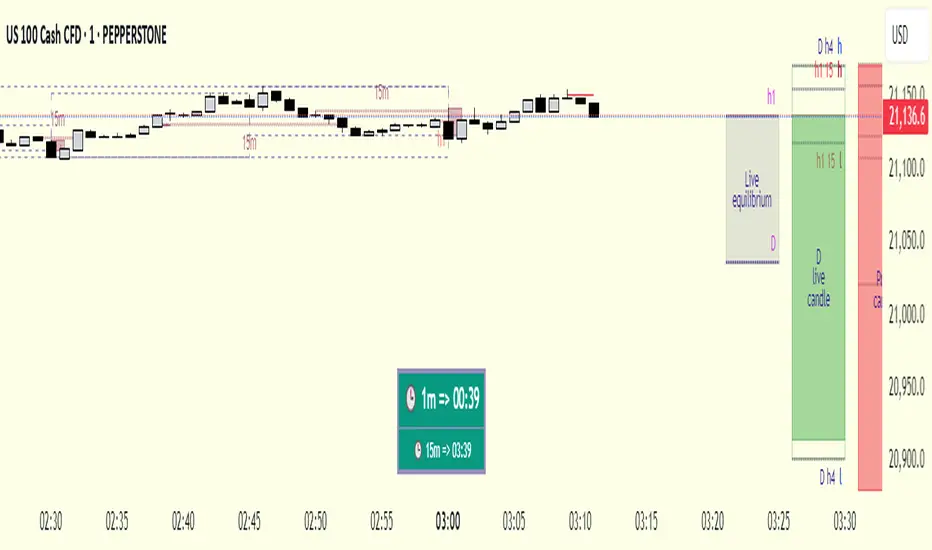
cd_respect2_EQ_Cx🔹 Overview:
Many traders form a bias or look for trade setups by analyzing the high (H) and low (L) of previous higher timeframe candles. For example: a close above the previous daily high, a failure to close after breaking the high, or approaching the level without making a new high. As we’ve been taught to focus on these key levels, I wanted to draw attention to what's happening at the mid-levels (Equilibrium) of the current and higher timeframe candles.
We’ve all heard the phrase “Strong price reacts from equilibrium,” yet most of us wait at the extremes.
While working on equilibrium levels of both higher timeframes and the current timeframe, I noticed that when a current candle closes above/below the previous HTF candle's high/low, price often respects the part of the candle that caused the break — which I refer to as the Last Block. When respected, price tends to continue with momentum; when lost, a pullback or reversal often follows.
________________________________________
🔹 About the Indicator:
This tool analyzes four different higher timeframes and shows:
• Current candle equilibrium levels
• Previous candle equilibrium levels (2 display options):
1. On Box – classic display
2. On Candle – equilibrium is linked to the last candle that includes the level, making those candles more meaningful or "strengthened"
• Alerts (standard) and on-screen warnings when price approaches previous equilibrium levels
• High/Low levels of previous HTF candles
• High/Low levels of live HTF candles
• Last Block: the upper or lower part of the candle that caused the breakout when price closes above/below the previous HTF high/low
• Countdown timer until the close of selected HTFs
________________________________________
🔹 Menus & Usage:
🔸 Show/Hide Tab:
• Toggle Previous Equilibrium display (On Candle / On Box)
• Toggle Live Equilibrium levels, color selection, and left extension
• Toggle Current Candle Equilibrium and colors
• Alert on Chart: flashing on-screen visual alert
• Approach Limit: sets how close price must be to trigger alert
• Remaining Time (RT): toggle countdown display for selected timeframes
________________________________________
🔸 HTF H/L Levels Tab:
• Show previous and live HTF candle highs/lows
• Customize colors, starting points, and left extension options
________________________________________
🔸 Timeframes & Options Tab:
• Select which timeframes to display
• Choose level colors
• Enable price alerts
• Control visibility in the time chart
• Toggle Last Block display (close-to-high/low)
________________________________________
🔸 Look Back HTF Candles Tab:
• Delete filled levels: removes invalidated zones; only unmitigated remain
• Back Control: set how many candles to look back per timeframe (unlimited if not set)
________________________________________
🔸 HTF Boxes Tab:
• Display HTF candles in boxes
• Set colors (single color or per timeframe)
• Adjust font sizes across the chart
________________________________________
🔹 Usage & Last Blocks:
The core idea behind both equilibrium levels and last blocks is:
Price should “gain” and respect them to validate continuation.
Viewing multiple timeframes together strengthens bias.
Each level is treated as part of the candle it's associated with — defining the “area to be gained.”
“Did price respect the level because of that candle, or did the candle gain significance because it aligned with the level? That’s open for debate.”
(In my opinion, the candle gains significance because it aligns with the level.)
When respected, these levels/blocks act as support; when lost, they act as resistance.
In suitable timeframes, reclaiming previous equilibrium levels may be interpreted as CHoCH / CISD / IDM depending on the context.
________________________________________
🔹 Usage Example – Last Blocks:
I personally trade on 1-minute and use Daily / H4 / H1 / 15m as selected timeframes.
For example, if price reclaims the previous 15m level, I view it as a Change of Character. I then expect the next candle to show respect in that direction.
Choose timeframes based on your trading style.
Sometimes, HTF levels (past and live) cluster tightly — these areas are key watch zones for me.
That’s the reason I decided to share this indicator.
________________________________________
🔹 Chart Examples:
🔸 Example 1:
Price closes above both the 12:45 15m candle and the 12:00 H1 equilibrium levels.
Last Block forms. After retracing, price mitigates the block and respects live equilibrium levels (H4/H1/15m).
🔸 Example 2:
Explained on chart – Levels that pushed price down in the bearish trend later acted as support.
🔸 Example 3 – CHoCH/CISD/IDM Alternative:
Explained on chart – Replacing structural signals with equilibrium levels.
I see this pattern often — very effective.
🔸 Example 4:
Many levels are clustered in a narrow range; price shows respect across the board.
________________________________________
🔹 Final Note:
Hope you like the tool. I’d love to hear your thoughts and suggestions.
"Keep in mind, strong price reverses from equilibrium."
Happy trading!
Trailing Stop Loss [TradingFinder] 4 Machine Learning Methods🔵 Introduction
The trailing stop indicator dynamically adjusts stop-loss (SL) levels to lock in profits as price moves favorably. It uses pivot levels and ATR to set optimal SL points, balancing risk and reward.
Trade confirmation filters, a key feature, ensure entries align with market conditions, reducing false signals. In 2023 a study showed filtered entries improve win rates by 15% in forex. This enhances trade precision.
SL settings, ranging from very tight to very wide, adapt to volatility via ATR calculations. These settings anchor SL to previous pivot levels, ensuring alignment with market structure. This caters to diverse trading styles, from scalping to swing trading.
The indicator colors the profit zone between the entry point (EP) and SL, using light green for buy trades and light red for sell trades. This visual cue highlights profit potential. It’s ideal for traders seeking dynamic risk management.
A table displays real-time trade details, including EP, SL, and profit/loss (PNL). Backtests show trailing stops cut losses by 20% in trending markets. This transparency aids decision-making.
🔵 How to Use
🟣 SL Levels
The trailing stop indicator sets SL based on pivot levels and ATR, offering four options: very tight, tight, wide, or very wide. Very tight SLs suit scalpers, while wide SLs fit swing traders. Select the base level to match your strategy.
If price hits the SL, the trade closes, and the indicator evaluates the next trade using the selected filter. This ensures disciplined trade management. The cycle restarts with a new confirmed entry.
Very tight SLs, set near recent pivots, trigger exits early to minimize risk but limit profits in volatile markets. Wide SLs, shown as farther lines, allow more price movement but increase exposure to losses. Adjust based on ATR and conditions, noting SL breaches open new positions.
🟣 Visualization
The indicator’s visual cues, like colored profit zones, simplify monitoring, with light green showing the profit area from EP to trailed SL. Dashed lines mark entry points, while solid lines track the trailed SL, triggering new positions when breached.
When price moves into profit, the area between EP and SL is colored—light green for longs, light red for shorts. This highlights the profit zone visually. The SL trails price, locking in gains as the trade progresses.
🟣 Filters
Upon trade entry, the indicator requires confirmation via filters like SMA 2x or ADX to validate momentum. Filters reduce false entries, though no guarantee exists for improved outcomes. Monitor price action post-entry for trade validity.
Filters like Momentum or ADX assess trend strength before entry. For example, ADX above 25 confirms strong trends. Choose “none” for unfiltered entries.
🟣 Bullish Alert
For a bullish trade, the indicator opens a long position with a green SL Line (after optional filters), trailing the SL below price. Set alerts to On in the settings for notifications, or Off to monitor manually.
🟣 Bearish Alert
In a bearish trade, the indicator opens a short position with a red SL Line post-confirmation, trailing the SL above price. With alerts On in the settings, it notifies the potential reversal.
🟣 Panel
A table displays all trades’ details, including Win Rates, PNL, and trade status. This real-time data aids in tracking performance. Check the table to assess trade outcomes instantly.
Review the table regularly to evaluate trade performance and adjust settings. Consistent monitoring ensures alignment with market dynamics. This maximizes the indicator’s effectiveness.
🔵 Settings
Length (Default: 10) : Sets the pivot period for calculating SL levels, balancing sensitivity and reliability.
Base Level : Options (“Very tight,” “Tight,” “Wide,” “Very wide”) adjust SL distance via ATR.
Show EP Checkbox : Toggles visibility of the entry point on the chart.
Show PNL : Displays profit/loss data for active and closed trades.
Filter : Options (“none,” “SMA 2x,” “Momentum,” “ADX”) validate trade entries.
🔵 Conclusion
The trailing stop indicator, a dynamic risk management tool, adjusts SLs using pivot levels and ATR. Its confirmation filters reduce false entries, boosting precision. Backtests show 20% loss reduction in trending markets.
Customizable SL settings and visual profit zones enhance usability across trading styles. The real-time table provides clear trade insights, streamlining analysis. It’s ideal for forex, stocks, or crypto.
While filters like ADX improve entry accuracy, no setup guarantees success in all conditions. Contextual analysis, like trend strength, is key. This indicator empowers disciplined, data-driven trading.

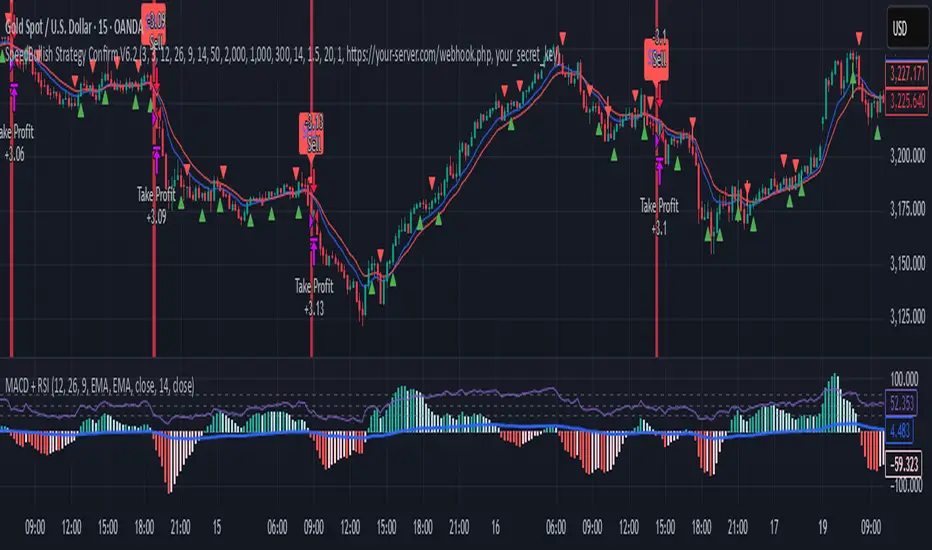
SpeedBullish Strategy Confirm V6.2SpeedBullish Strategy Confirm V6.2
SpeedBullish V6.2 is an advanced price-action + indicator-based strategy designed to confirm trend strength and signal entries with high precision. This version builds on the W/M pattern structure and adds dynamic filtering with EMA, MACD Histogram, RSI, ATR, and Volume.
✅ Signal Conditions
🔹 Buy Signal:
Price above EMA10 or EMA15
MACD Histogram crosses above 0
RSI > 50
(Optional) Higher low via Pivot Low
(Optional) ATR > ATR SMA * Multiplier
(Optional) Volume > SMA * Multiplier
🔻 Sell Signal:
Price below EMA10 or EMA15
MACD Histogram crosses below 0
RSI < 50
(Optional) Lower high via Pivot High
(Optional) Confirmed high volatility and volume
⚙️ Strategy Features
MACD Histogram for momentum shift detection
RSI filtering for momentum confirmation
EMA10/15 for trend direction
ATR-based volatility filter
Volume confirmation filter
Dynamic TP/SL + Trailing Stop
Webhook Integration for MT5 auto-trade
Visual signal markers + background highlight
🔔 Alerts
Alerts are sent in JSON format via alert() with the current symbol, action (buy/sell), and price. Webhook endpoint and secret key are configurable.
📈 How to Use
Attach the strategy to any symbol and timeframe
Customize filters and confirmations to fit your market conditions
Enable webhook alerts for integration with your MT5 Expert Advisor or trading bot
Backtest and optimize before live deployment
Engulfing DetectorThis script detects classic candlestick reversal patterns known as Engulfing formations:
Bullish Engulfing: A green candle fully engulfs the previous red candle.
Bearish Engulfing: A red candle fully engulfs the previous green candle.
🔎 Features:
Works on any time frame or instrument.
Optional filter to ignore overly large or irregular candles.
Visual signals on the chart (BE/SE labels).
Built-in alerts for automation or notification.
✅ Recommended usage:
For intraday trading, this indicator performs best on the 5-minute chart of the Nasdaq (NQ) between 9:45 AM and 1:00 PM ET (15:45–19:00 CET).
💡 Suggested trading approach:
Optimized for scalping with short-term trades and small take-profits around +0.10%.

Quarter ICT Theo TradeQuarter ICT | Theo Trade
The "Multi-Level Yearly Divisions" indicator is a visual tool designed for TradingView charts. Its primary purpose is to help traders and analysts visualize and analyze price action within a structured, hierarchical breakdown of the year. It divides each year into progressively smaller, equal time segments, allowing for detailed observation of how markets behave during specific portions of the year, quarters, and even finer sub-divisions.
Yearly Detection: It first identifies the start of each new year on the chart.
Four Levels of Division:
Level 0: Marks the beginning of the year with a distinct line.
Level 1 (Quarters): Divides the entire year into four equal parts (quarters).
Level 2: Each quarter is then further divided into four equal smaller segments.
Level 3: Each of these Level 2 segments is again divided into four equal parts.
Level 4: Finally, each Level 3 segment is divided into four more equal parts.

Swing High/Low by %REnglish Description
Swing High/Low by %R
This indicator identifies potential swing high and swing low points by combining William %R overbought/oversold turning points with classic swing price structures.
Swing High: Detected when William %R turns down from overbought territory and the price forms a local high (higher than both neighboring bars).
Swing Low: Detected when William %R turns up from oversold territory and the price forms a local low (lower than both neighboring bars).
This tool is designed to help traders spot possible market reversals and better time their entries and exits.
Customizable parameters:
Williams %R period
Overbought & Oversold thresholds
The indicator plots clear signals above/below price bars for easy visualization.
For educational purposes. Please use with proper risk management!
คำอธิบายภาษาไทย
Swing High/Low by %R
อินดิเคเตอร์นี้ใช้ระบุจุด Swing High และ Swing Low ที่มีโอกาสเป็นจุดกลับตัวของตลาด โดยอาศัยสัญญาณจาก William %R ที่พลิกกลับตัวบริเวณ overbought/oversold ร่วมกับโครงสร้างราคาแบบ swing
Swing High: เกิดเมื่อ William %R พลิกกลับลงจากเขต Overbought และราคาแท่งกลางสูงกว่าทั้งสองแท่งข้างเคียง
Swing Low: เกิดเมื่อ William %R พลิกกลับขึ้นจากเขต Oversold และราคาแท่งกลางต่ำกว่าทั้งสองแท่งข้างเคียง
ช่วยให้เทรดเดอร์สามารถมองเห็นโอกาสในการกลับตัวของราคา และใช้ประกอบการวางแผนจังหวะเข้าหรือออกจากตลาดได้อย่างแม่นยำมากขึ้น
ตั้งค่าได้:
ระยะเวลา Williams %R
ค่าขอบเขต Overbought & Oversold
อินดิเคเตอร์จะแสดงสัญลักษณ์อย่างชัดเจนบนกราฟเพื่อความสะดวกในการใช้งาน
ควรใช้ร่วมกับการบริหารความเสี่ยง

5:30 AM IST Close + Offset Lines + TablesDescription:
This script captures the 5:30 AM IST close price and plots it on the chart along with dynamic offset levels above and below (±5, ±20, ±40, ±60, ±80 points). It also displays these levels in neatly organized tables at the top-right and bottom-right corners for quick reference.
🔹 Timezone: Asia/Kolkata (IST)
🔹 Useful for: Intraday traders who reference early morning levels
🔹 Visual aids:
Orange line for 5:30 AM close
Green lines for points above
Red lines for points below
Tables summarizing all levels
This tool helps identify key early-morning reference zones that can act as support/resistance or breakout targets.

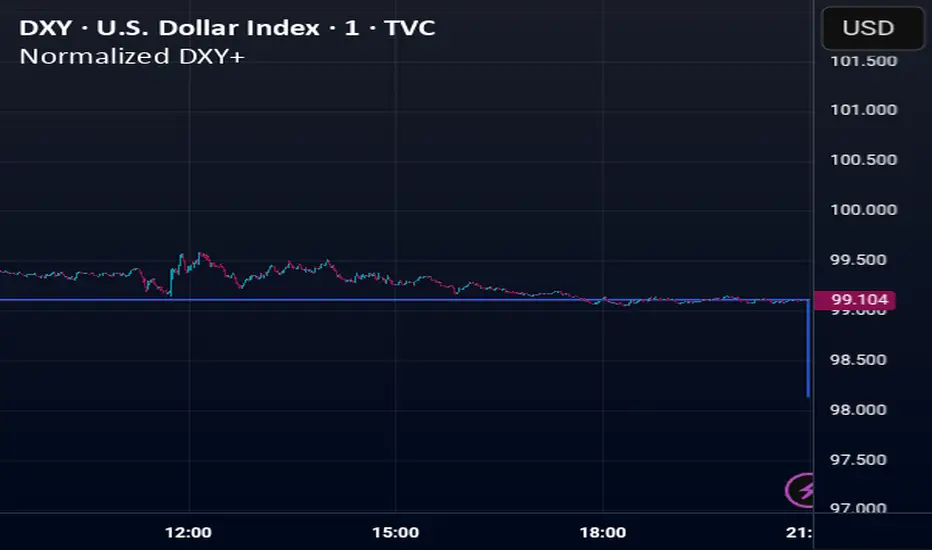
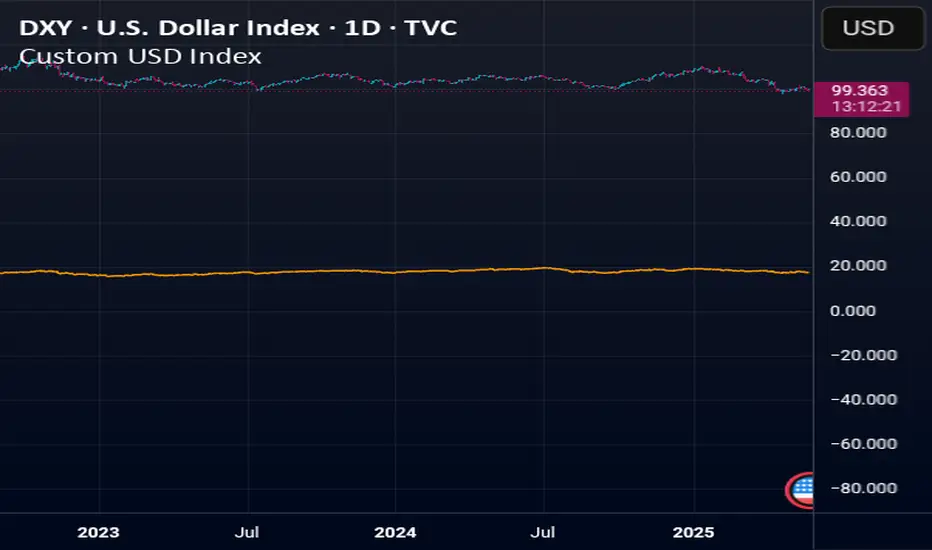
Normalized DXY+Custom USD Index (DXY+) – Normalized Dollar Strength with Bitcoin, Gold, and Yuan.
This custom USD strength index replicates the structure of the official U.S. Dollar Index (DXY), while expanding it to include modern financial assets such as Bitcoin (BTC), Ethereum (ETH), gold (XAU), and the Chinese yuan (CNY).
Weights for the core fiat currencies (EUR, JPY, GBP, CAD, SEK, CHF) follow the official ICE DXY methodology. Additional components are weighted proportionally based on their estimated global economic influence.
The index is normalized from its initial valid data point, meaning it starts at 100 on the first day all asset inputs are available. From that point forward, it tracks the relative strength of the U.S. dollar against this expanded basket.
This provides a more comprehensive and modernized view of the dollar's strength—not only against traditional fiat currencies, but also in the context of rising decentralized assets and non-Western trade power.
HGDA Hany Ghazy Digital Analytics area zone'sIndicator Name: HGDA Hany Ghazy Digital Analytics area zones
Description:
This indicator plots several key price zones based on the highest high and lowest low over a user-defined lookback period.
The plotted zones represent dynamic support and resistance levels calculated using specific ratios of the price range (High - Low), as follows:
- Zone 1 (Light Red): Represents an upper resistance zone.
- Zone 2 (Medium Green): Represents a medium support zone.
- Zone 3 (Dark Red): Represents a lower resistance zone.
- Zone 4 (Dark Green): Represents a strong support zone.
Additionally, the indicator plots a yellow "Zero" line representing the midpoint price of the selected period, serving as a balance point for price action.
This indicator is ideal for identifying the overall market trend, as prices typically move from the upper resistance zones (light red) downwards to the end of the wave in the lower zones (dark green). This helps traders better understand wave nature and direction.
Usage:
- The colored zones assist in identifying potential reversal or continuation areas.
- These zones can be used to plan entries, exits, and risk management.
- Default lookback period is 20 bars, adjustable in the settings to suit the timeframe.
Notes:
- This indicator relies on historical price data and does not guarantee market predictions.
- It is recommended to combine it with other indicators and analytical tools for improved trading decisions.
---
Developed by Hany Ghazy Digital Analytics (HGDA).

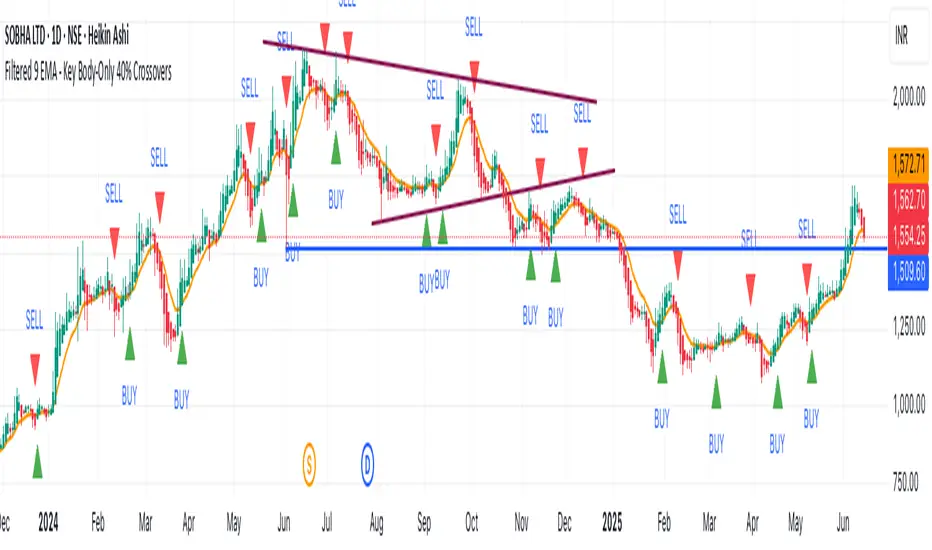
9 EMA 75% HA Crossover + EMA ReversalThis script identifies potential trend reversal points using Heikin-Ashi candles and the 9-period Exponential Moving Average (EMA). A signal is generated only when:
The 9 EMA reverses direction after a consistent trend (up or down).
The EMA crosses into at least 75% of the Heikin-Ashi candle body.
The highlighted candle must align with the reversal:
Green candle for bullish reversal
Red candle for bearish reversal
This setup helps filter out weak signals by combining price structure, trend behavior, and candle color confirmation.
Dual Stochastic Enhanced (with Presets giua64)Script Title: Dual Stochastic Enhanced (with Presets giua64)
Overview:
This indicator enhances the traditional Dual Stochastic strategy, aiming to provide more filtered and potentially reliable trading signals. By integrating dynamic overbought/oversold levels via Bollinger Bands on the slow stochastic, a trend filter based on a moving average, momentum confirmation via RSI, and user-friendly selectable presets, "Dual Stochastic Enhanced" seeks to offer a more robust approach to identifying potential entry points.
Key Features:
Dual Stochastics: Utilizes a slow stochastic (configurable, e.g., 14 periods) as a context filter and a fast stochastic (configurable, e.g., 5 periods) as a signal trigger.
Bollinger Bands on Slow Stochastic: Instead of fixed overbought/oversold levels (80/20), Bollinger Bands are applied to the %K line of the slow stochastic. This creates dynamic zones that adapt to the stochastic's own volatility.
Trend Filter: A moving average (configurable type and length, e.g., EMA 100 as seen in the example chart for general context) on the price helps filter signals, allowing only trades aligned with the prevailing trend.
RSI Confirmation: An RSI oscillator (configurable length, e.g., 14 periods) is used to confirm momentum. Signals require the RSI to cross certain thresholds to validate the strength of the move.
User Presets: Includes presets for "Scalping," "Intraday," and "Swing trading," which quickly set all key parameters to suit different styles and timeframes. A "Custom" option is also available for full manual configuration.
Clear Visual Signals: Long (green) and Short (red) arrows appear on the chart when all entry conditions are met.
Active Zone Highlighting: The background of the indicator panel changes color (green or red) when "active zone" conditions (a combination of stochastics, trend, and RSI) are favorable.
Information Panel: A table in the top-right corner of the indicator panel displays the current status of the selected preset, trend filter, RSI value, and stochastic levels.
Signal Logic:
A LONG signal is generated when:
The fast stochastic %K crosses above its %D line.
The slow stochastic %K line is below its lower Bollinger Band (dynamic oversold condition).
The fast stochastic %K line is also in a low area (e.g., <25) to confirm the trigger is not premature.
The closing price is above the trend moving average (uptrend).
The RSI is above its long confirmation level (e.g., >40), indicating sufficient bullish momentum.
A SHORT signal is generated when:
The fast stochastic %K crosses below its %D line.
The slow stochastic %K line is above its upper Bollinger Band (dynamic overbought condition).
The fast stochastic %K line is also in a high area (e.g., >75).
The closing price is below the trend moving average (downtrend).
The RSI is below its short confirmation level (e.g., <60), indicating sufficient bearish momentum.
How to Use:
Select a Preset suitable for your trading style and the timeframe you are analyzing (e.g., Scalping for M1-M15, Intraday for M5-H1, Swing for H4-D1).
Alternatively, choose "Custom" and manually adjust all parameters (stochastic lengths, smoothing, Bollinger Bands, Moving Average, RSI, confirmation thresholds).
Observe the Information Panel for a quick understanding of the current conditions.
Evaluate the arrow signals, always considering the broader market context, price action, and any other confluences (supports/resistances, chart patterns).
The background highlighting can help quickly identify periods where conditions are aligned for potential trades.
Disclaimer:
This script is provided for educational and informational purposes only. Trading involves significant risk, and past performance is not indicative of future results. Always thoroughly test any strategy or indicator on historical data and on a demo account before risking real capital. The author assumes no responsibility for any losses incurred from the use of this script.
Author: giua64

MathSpecialFunctionsConvolve1DLibrary "MathSpecialFunctionsConvolve1D"
Convolution is one of the most important mathematical operations used in signal processing. This simple mathematical operation pops up in many scientific and industrial applications, from its use in a billion-layer large CNN to simple image denoising.
___
Reference:
www.algorithm-archive.org
numpy.org
lloydrochester.com
www.geeksforgeeks.org
f(signal, filter)
Convolve
Parameters:
signal (array) : List with signal data.
filter (array) : List with weights to apply to the signal data.
Returns: Discrete, linear convolution of `signal` and `filter`.

Custom USD IndexThis is a modernized, expanded version of the U.S. Dollar Index (DXY), designed to provide a more accurate representation of the dollar’s global strength in today’s diversified economy.
Unlike the traditional DXY, which excludes major players like China and entirely omits real-world stores of value, this custom index (DXY+) includes:
Fiat Currencies (78.3% total weight):
EUR, JPY, GBP, CAD, AUD, CHF, and CNY — equally weighted to reflect the global currency landscape.
Gold (17.5%):
Gold (XAUUSD) is included as a traditional reserve asset and inflation hedge, acknowledging its continued monetary relevance.
Cryptocurrencies (2.8% total weight):
Bitcoin (BTC) and Ethereum (ETH) represent the emerging digital monetary layer.
The index rises when the U.S. dollar strengthens relative to this blended basket, and falls when the dollar weakens against it. This is ideal for traders, economists, and macro analysts seeking a more inclusive and up-to-date measure of dollar performance.
Adaptive Multi-TF Indicator Table with Presets giua64📌 Script Name:
Adaptive Multi-Timeframe Indicator Table with Presets — giua64
📄 Description:
This script displays an adaptive multi-timeframe dashboard that summarizes the signals of three key technical indicators:
Moving Averages (MAs), Relative Strength Index (RSI), and MACD.
It provides a fast and visually intuitive overview of market conditions across five timeframes (5m, 15m, 30m, 1h, 4h), helping traders quickly identify potential directional biases (e.g., bullish, bearish, or neutral) based on either predefined presets or fully manual settings.
🧰 Preset Configurations:
You can choose between four trading styles, each with optimized indicator parameters:
Scalping
• MAs: 5 / 10 (Fast), 20 / 50 (Slow)
• RSI: 7 periods | Overbought: 70 | Oversold: 30
• MACD: 5 / 13 | Signal: 3
Intraday
• MAs: 9 / 21 (Fast), 50 / 100 (Slow)
• RSI: 14 periods | Overbought: 60 | Oversold: 40
• MACD: 12 / 26 | Signal: 9
Swing
• MAs: 10 / 20 (Fast), 50 / 200 (Slow)
• RSI: 14 periods | Overbought: 65 | Oversold: 35
• MACD: 12 / 26 | Signal: 9
Manual
• Full custom control over all indicator settings.
🛠️ All settings can be customized manually from the options panel, including the exact MA periods, RSI thresholds, and MACD structure.
🧠 How It Works:
For each timeframe, the script evaluates:
MA crossover status (two levels):
The first symbol refers to the crossover of the fast MAs
The second symbol refers to the crossover of the slow MAs
🟢 = Bullish crossover
🔴 = Bearish crossover
➖ = Flat or no clear signal
RSI Direction:
↑ = RSI above upper threshold (potential overbought)
↓ = RSI below lower threshold (potential oversold)
→ = RSI in neutral range
MACD Line vs Signal Line:
↑ = MACD line is above signal line (bullish)
↓ = MACD line is below signal line (bearish)
→ = Flat or neutral signal
Each signal is assigned a numerical score. These are aggregated per timeframe to compute a combined score that reflects the directional bias for that specific time window.
🧠 Adaptive Logic by Asset:
This script is designed to be universally compatible across all asset types — including forex, crypto, stocks, indices, and commodities.
Thanks to its multi-timeframe nature and flexible indicator presets, the script automatically adjusts its behavior based on the asset selected, ensuring relevant analysis without requiring manual recalibration.
🧾 Summary Table Output:
At the bottom of the dashboard, a combined sentiment is displayed for:
3TF → 5m, 15m, 30m
4TF → Adds 1h
5TF → Adds 4h
Each row shows:
Signal → LONG / SHORT / NEUTRAL
Confidence (%) → Based on score aggregation and signal consistency
📌 Customization Options:
Table Position: Left, Right, or Center
Text Size: Small, Normal, or Large
Full Manual Configuration: All MA, RSI, and MACD parameters can be adjusted as needed
⚠️ Disclaimer:
This script is for educational and analytical purposes only.
It does not constitute financial advice or guarantee any trading results.
Always do your own research and apply responsible risk management.

Day of Week and HTF Period SeparatorDay of Week & HTF Period Separator
A minimalist Pine Script indicator that adds clear, time-based separators and labels to intraday charts for better structure and analysis.
Key Features
• Day Labels
• Displays abbreviated weekday names (MON, TUE, WED, etc.) at a user-defined hour
• Custom text color and position
• Limits display to the most recent 28 days for a clean view
• Time Separators
• Daily: Vertical line at 00:00 each trading day
• 4-Hour: Lines at 00:00, 04:00, 08:00, 12:00, 16:00, 20:00
• Hourly: Divisions at every hour for detailed timing
• Customization
• Individual color picker for each separator type
• Choose line style: Solid, Dashed or Dotted
• Enable or disable any separator or label independently
• Smart limits to avoid clutter on extended history
• Smart Behavior
• Active only on intraday timeframes
• Projects upcoming separators into the future for planning
• Automatically caps historical plotting for performance
• Lines extend across full visible price range
Perfect for traders who need distinct session breaks, precise time-based zoning and an organized chart layout.
Inputs
• Show Day Labels (true/false)
• Label Hour (0–23)
• Day Label Color
• Show Daily Separators (true/false)
• Show 4H Separators (true/false)
• Show 1H Separators (true/false)
• Daily Line Color, Style
• 4H Line Color, Style
• Hourly Line Color, Style
• Max Days to Display
Enhance your intraday analysis with clean, customizable time markers. 👁

Wick Spike 50% Detector (15m & 1h)This script identifies candles with significant upper or lower wicks (spikes) based on a percentage of the total candle range. It helps spot potential reversals, exhaustion moves, or liquidity grabs — especially useful in volatile markets.
📍 Key Features:
15-Minute Timeframe:
Red Triangle Above: Candle range ≥ 0.35% and upper wick ≥ 50% of the range.
Green Triangle Below: Candle range ≥ 0.30% and lower wick ≥ 50% of the range.
1-Hour Timeframe:
Red Circle Above: Candle range ≥ 0.50% and upper wick ≥ 50%.
Green Circle Below: Candle range ≥ 0.50% and lower wick ≥ 50%.
📢 Alerts:
Alerts trigger when the 50% spike condition is met — within the last 60 seconds before candle close — ensuring timely notifications.
🎯 Designed to assist traders in identifying spike-driven opportunities and refining entry/exit strategies.

Mimas buy and sellBollinger Bands: Calculated using a simple moving average (basis) and standard deviation (dev).
EMAs: Two exponential moving averages (EMA 5 and EMA 20) are plotted to identify short-term and long-term trends.
Price Action Patterns: The script detects higher highs and higher lows for bullish conditions, and lower highs and lower lows for bearish conditions.
Trend Strength: An exponential moving average of the price change is used to gauge the strength of the trend.
Trade Signals: Buy and sell signals are plotted on the chart when specific conditions are met, combining price action patterns, trend strength, Bollinger Bands, and EMA crossovers.
Take-Profit Levels: Dynamic take-profit levels are calculated based on recent swing highs and lows, adjusted by a user-defined multiplier. These levels are displayed on the chart using plot to draw horizontal lines.
