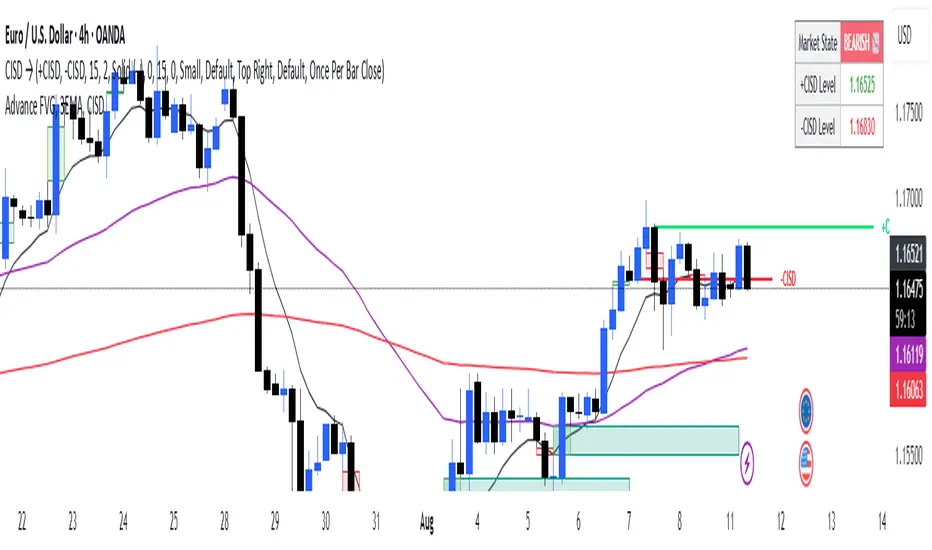
Advance FVG with 3 EMAThis is a very powerful script and is an advanced version of Fair Value Gaps with powerful EMAs.
Wyszukaj w skryptach "纳斯达克指数期货cfd"
Multi-Tool Nasdaq US100 IndikatorA combination of several tools such as moving averages (EMA 50, 100, 200), Fibonacci retracements, pivot points, RSI (Relative Strength Index), order blocks, fair value gaps, supply and demand zones, and a simple volume profile.
The indicator is designed to enable high profitability by combining various established technical analysis approaches into one tool, facilitating decision-making regarding entry and exit points.
The script can be integrated and used directly in TradingView by creating a new indicator script and pasting the code there.

EZSignals SuperTrend EMAA technical indicator, even with high accuracy, must be rigorously backtested to assess its stability across various market conditions. Its effectiveness depends not only on the algorithm itself but also on how it is integrated into the overall trading system. Proper usage, combined with risk management and a solid understanding of market context, is essential to convert theoretical accuracy into practical trading advantage.

Terminal de Estrategias PRO (MTF + Order Blocks)this is a new test for the implementation of functions on my app web for signals


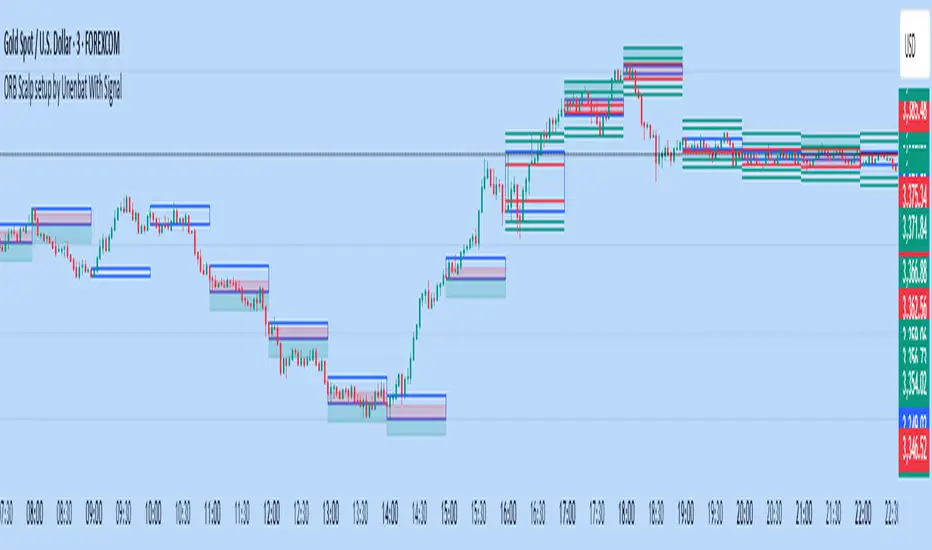
ORB Scalp setup by Unenbat With Signal**ORB Scalp Setup by Unenbat with Signal**
This indicator visualizes a custom Opening Range Breakout (ORB) strategy using a 6-minute range split across the end of one hour and the start of the next. It identifies two key trade setups using 1-hour candles:
* **Reverse Signals:** Triggered when the second 1H candle breaks the previous high/low but closes back inside, signaling a reversal.
* **Continuation Signals:** Triggered when the second 1H candle breaks and closes beyond the previous candle’s range, confirming trend continuation.
SL/TP zones are plotted accordingly, with optional fill coloring. No trades are displayed during "inside bars" or "manipulation" candles.
KAP RSI 14 & 2 (fixe)What does this indicator do?
It calculates two different RSIs:
The classic RSI with a 14-period (RSI 14) — measures the strength of price moves over 14 bars.
A faster RSI with a 2-period (RSI 2) — very sensitive, useful to spot short-term extreme conditions.
It displays these two RSI values in a fixed table at the top right corner of the chart, so the dashboard stays visible even when you scroll or zoom.
Each RSI value is colored:
Red when the RSI is at extreme levels (RSI 14 above 75 or below 30, RSI 2 above 95 or below 5), signaling overbought or oversold conditions.
Green when RSI is in a normal range.
Why is it useful?
It lets you quickly see the market’s condition with two RSI timeframes without searching the chart.
You monitor both medium-term trend strength (RSI 14) and short-term extreme signals (RSI 2).
The fixed dashboard makes it easy to keep an eye on these values at all times.
Customization options
You can choose which corner of the screen to place the dashboard (top-left, top-right, bottom-left, bottom-right).
The background is semi-transparent so it doesn’t cover the chart details.

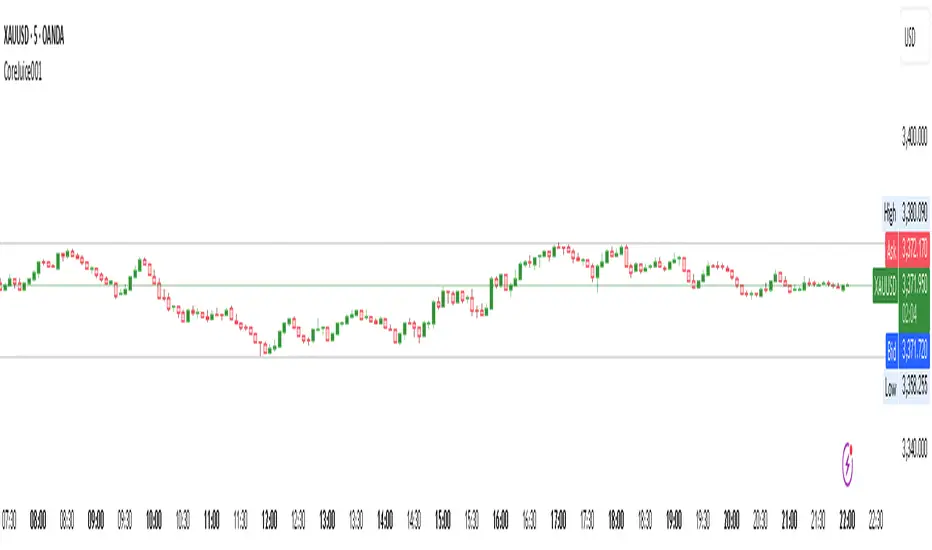
CoreJuice001Library "CoreJuice001"
DrawingData
Fields:
kzone1Boxes (array)
kzone2Boxes (array)
kzone3Boxes (array)
kzone4Boxes (array)
kzone5Boxes (array)
kzone6Boxes (array)
kzone1Labels (array)
kzone2Labels (array)
kzone3Labels (array)
kzone4Labels (array)
kzone5Labels (array)
kzone6Labels (array)
kzone1TrendLines (array)
kzone2TrendLines (array)
kzone3TrendLines (array)
kzone4TrendLines (array)
kzone5TrendLines (array)
kzone6TrendLines (array)
kzone1PriceLabels (array)
kzone2PriceLabels (array)
kzone3PriceLabels (array)
kzone4PriceLabels (array)
kzone5PriceLabels (array)
kzone6PriceLabels (array)
AuthLibLibrary "AuthLib"
DrawingData
Fields:
kzone1Boxes (array)
kzone2Boxes (array)
kzone3Boxes (array)
kzone4Boxes (array)
kzone5Boxes (array)
kzone6Boxes (array)
kzone1Labels (array)
kzone2Labels (array)
kzone3Labels (array)
kzone4Labels (array)
kzone5Labels (array)
kzone6Labels (array)
kzone1TrendLines (array)
kzone2TrendLines (array)
kzone3TrendLines (array)
kzone4TrendLines (array)
kzone5TrendLines (array)
kzone6TrendLines (array)
kzone1PriceLabels (array)
kzone2PriceLabels (array)
kzone3PriceLabels (array)
kzone4PriceLabels (array)
kzone5PriceLabels (array)
kzone6PriceLabels (array)
SMA50 Multi-Timeframe Simple🔹 SMA50 Multi-Timeframe Simple – Multi-Timeframe Moving Average Indicator
This indicator displays the 50-period Simple Moving Averages (SMA) calculated across multiple timeframes, providing a clear view of the trend across various market horizons.
✅ Included Timeframes:
5 minutes 🟠
15 minutes 🟡
30 minutes 🔵
1 hour 🟢
4 hours 🔵
1 day 🔴
1 week 🟣
1 month ⚫️

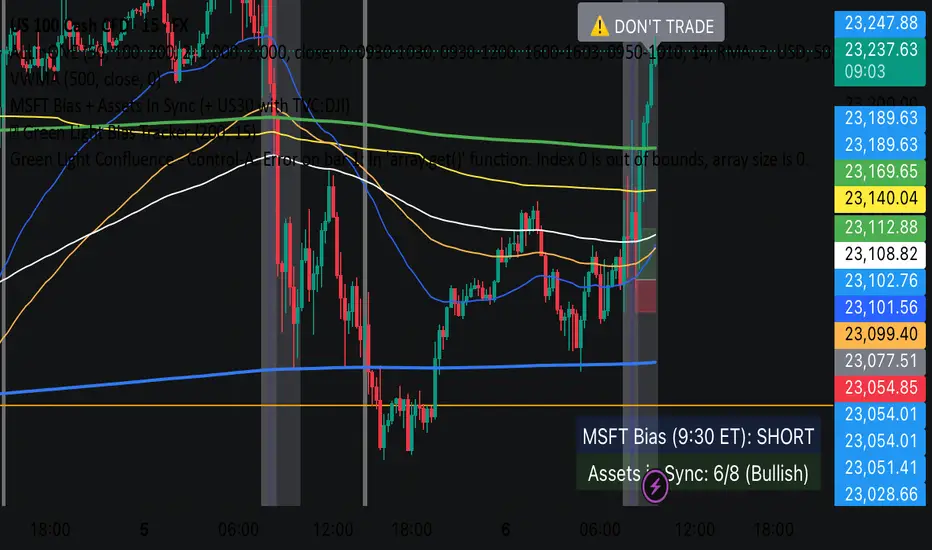
Green Light Confluence - Control-AIt scans the top 15 U.S. stocks in real time — including names like NASDAQ:AAPL , NASDAQ:AMZN , NASDAQ:NVDA , NASDAQ:GOOGL , NASDAQ:TSLA , and NASDAQ:MSFT — and identifies whether the majority are trending above or below their 200 EMA on the 1-minute chart.
Correlation HeatMap [TradingFinder] Sessions Data Science Stats🔵 Introduction
n financial markets, correlation describes the statistical relationship between the price movements of two assets and how they interact over time. It plays a key role in both trading and investing by helping analyze asset behavior, manage portfolio risk, and understand intermarket dynamics. The Correlation Heatmap is a visual tool that shows how the correlation between multiple assets and a central reference asset (the Main Symbol) changes over time.
It supports four market types forex, stocks, crypto, and a custom mode making it adaptable to different trading environments. The heatmap uses a color-coded grid where warmer tones represent stronger negative correlations and cooler tones indicate stronger positive ones. This intuitive color system allows traders to quickly identify when assets move together or diverge, offering real-time insights that go beyond traditional correlation tables.
🟣 How to Interpret the Heatmap Visually ?
Each cell represents the correlation between the main symbol and one compared asset at a specific time.
Warm colors (e.g. red, orange) suggest strong negative correlation as one asset rises, the other tends to fall.
Cool colors (e.g. blue, green) suggest strong positive correlation both assets tend to move in the same direction.
Lighter shades indicate weaker correlations, while darker shades indicate stronger correlations.
The heatmap updates over time, allowing users to detect changes in correlation during market events or trading sessions.
One of the standout features of this indicator is its ability to overlay global market sessions such as Tokyo, London, New York, or major equity opens directly onto the heatmap timeline. This alignment lets traders observe how correlation structures respond to real-world session changes. For example, they can spot when assets shift from being inversely correlated to moving together as a new session opens, potentially signaling new momentum or macro flow. The customizable symbol setup (including up to 20 compared assets) makes it ideal not only for forex and crypto traders but also for multi-asset and sector-based stock analysis.
🟣 Use Cases and Advantages
Analyze sector rotation in equities by tracking correlation to major indices like SPX or DJI.
Monitor altcoin behavior relative to Bitcoin to find early entry opportunities in crypto markets.
Detect changes in currency alignment with DXY across trading sessions in forex.
Identify correlation breakdowns during market volatility, signaling possible new trends.
Use correlation shifts as confirmation for trade setups or to hedge multi-asset exposure
🔵 How to Use
Correlation is one of the core concepts in financial analysis and allows traders to understand how assets behave in relation to one another. The Correlation Heatmap extends this idea by going beyond a simple number or static matrix. Instead, it presents a dynamic visual map of how correlations shift over time.
In this indicator, a Main Symbol is selected as the reference point for analysis. In standard modes such as forex, stocks, or crypto, the symbol currently shown on the main chart is automatically used as the main symbol. This allows users to begin correlation analysis right away without adjusting any settings.
The horizontal axis of the heatmap shows time, while the vertical axis lists the selected assets. Each cell on the heatmap shows the correlation between that asset and the main symbol at a given moment.
This approach is especially useful for intermarket analysis. In forex, for example, tracking how currency pairs like OANDA:EURUSD EURUSD, FX:GBPUSD GBPUSD, and PEPPERSTONE:AUDUSD AUDUSD correlate with TVC:DXY DXY can give insight into broader capital flow.
If these pairs start showing increasing positive correlation with DXY say, shifting from blue to light green it could signal the start of a new phase or reversal. Conversely, if negative correlation fades gradually, it may suggest weakening relationships and more independent or volatile movement.
In the crypto market, watching how altcoins correlate with Bitcoin can help identify ideal entry points in secondary assets. In the stock market, analyzing how companies within the same sector move in relation to a major index like SP:SPX SPX or DJ:DJI DJI is also a highly effective technique for both technical and fundamental analysts.
This indicator not only visualizes correlation but also displays major market sessions. When enabled, this feature helps traders observe how correlation behavior changes at the start of each session, whether it's Tokyo, London, New York, or the opening of stock exchanges. Many key shifts, breakouts, or reversals tend to happen around these times, and the heatmap makes them easy to spot.
Another important feature is the market selection mode. Users can switch between forex, crypto, stocks, or custom markets and see correlation behavior specific to each one. In custom mode, users can manually select any combination of symbols for more advanced or personalized analysis. This makes the heatmap valuable not only for forex traders but also for stock traders, crypto analysts, and multi-asset strategists.
Finally, the heatmap's color-coded design helps users make sense of the data quickly. Warm colors such as red and orange reflect stronger negative correlations, while cool colors like blue and green represent stronger positive relationships. This simplicity and clarity make the tool accessible to both beginners and experienced traders.
🔵 Settings
Correlation Period: Allows you to set how many historical bars are used for calculating correlation. A higher number means a smoother, slower-moving heatmap, while a lower number makes it more responsive to recent changes.
Select Market: Lets you choose between Forex, Stock, Crypto, or Custom. In the first three options, the chart’s active symbol is automatically used as the Main Symbol. In Custom mode, you can manually define the Main Symbol and up to 20 Compared Symbols.
Show Open Session: Enables the display of major trading sessions such as Tokyo, London, New York, or equity market opening hours directly on the timeline. This helps you connect correlation shifts with real-world market activity.
Market Mode: Lets you select whether the displayed sessions relate to the forex or stock market.
🔵 Conclusion
The Correlation Heatmap is a robust and flexible tool for analyzing the relationship between assets across different markets. By tracking how correlations change in real time, traders can better identify alignment or divergence between symbols and gain valuable insights into market structure.
Support for multiple asset classes, session overlays, and intuitive visual cues make this one of the most effective tools for intermarket analysis.
Whether you’re looking to manage portfolio risk, validate entry points, or simply understand capital flow across markets, this heatmap provides a clear and actionable perspective that you can rely on.

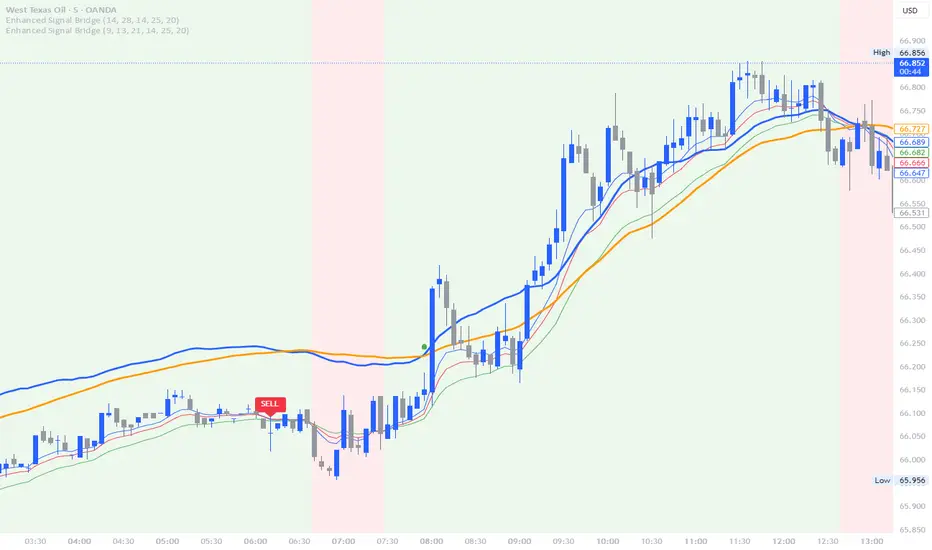
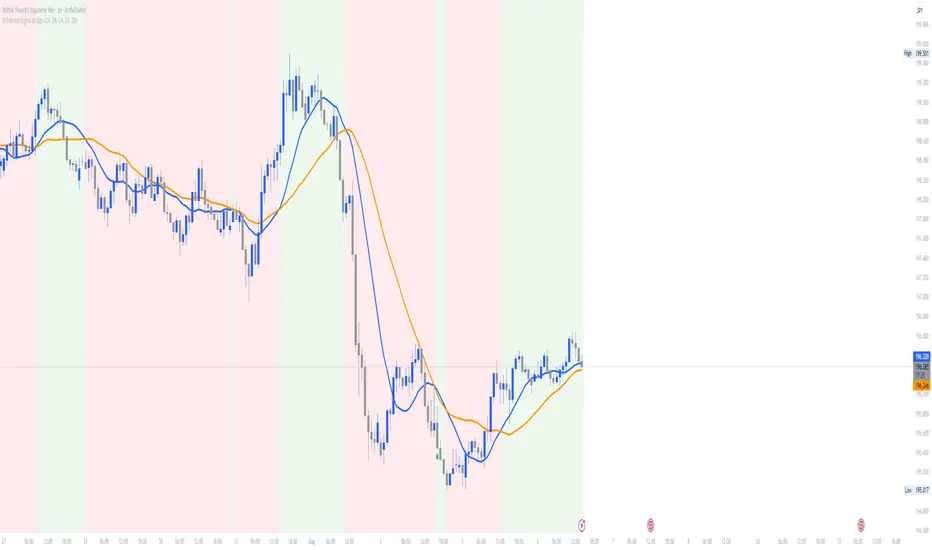
Enhanced Signal Bridge V1For the trading Careers members only base script for any pair on any time frame ( please double check as still a new script)
TSD Quantum [Moeinudin Montazerfaraj] 🔸 "TSD" stands for **Trend 1-2-3 and Supply & Demand**, which is the foundation of the trading style this indicator is built upon.
🔹 TSD Quantum is a specialized indicator designed exclusively for day traders who trade EURUSD, XAUUSD (Gold), and DAX40 on the 1H, 15M, and 5M timeframes using a Supply & Demand-based strategy.
This indicator is **not suitable for other symbols** and has been tailored specifically for these three assets to ensure high precision and effectiveness.
---
### 🔍 Key Features:
✅ **Trading Checklist Panel**
A built-in checklist helps you track every rule in your trading plan. If even one condition is left unchecked, the system highlights it in red and marks the trade as "Not Allowed." This feature enhances trading discipline.
✅ **Spread & ATR Control Panel**
Supports both auto-calculated and fixed values for spread and ATR. This is especially helpful when placing stop-losses quickly and accurately.
✅ **Inside & Outside Candle Detection**
A dedicated panel highlights whether the last candle is inside or outside. Hovering your mouse over the chart elements automatically colorizes the candles:
🔵 Blue = Outside candle
🔴 Red = Inside candle
Also displays the high/low of the latest outside bar.
✅ **Weekly Trade Stats Panel**
Custom-built for the mentioned three assets. You can enter your trades using either fixed risk or floating risk models.
✅ **Performance Metrics**
Helps you build and adjust a floating risk model—so you don’t have to enter every trade with the same lot size. Improves risk management across multiple trades.
✅ **Base Candles Display**
Grey and white base candles are marked based on supply and demand zones.
✅ **EOT Candles**
Candles with a green dot underneath indicate valid EOT opportunities for potential move-outs.
✅ **RC (Rejection Candle) Detection**
RC candles are automatically detected to alert you of potential traps or weaknesses during Supply/Demand formations.
---
### ⚠️ Disclaimer
This indicator does **not** issue buy/sell signals and **cannot guarantee profit or prevent loss**. It is a **tool for discretionary trading**, not an automated expert advisor.
All decisions must be made by the trader based on their own strategy and risk tolerance.
This is the **latest tested version** of TSD Quantum. All features have been validated and function as intended. Future updates will be provided if needed.
---
🙏 Thank you for reviewing this script. We hope it becomes a valuable addition to your day trading toolkit!

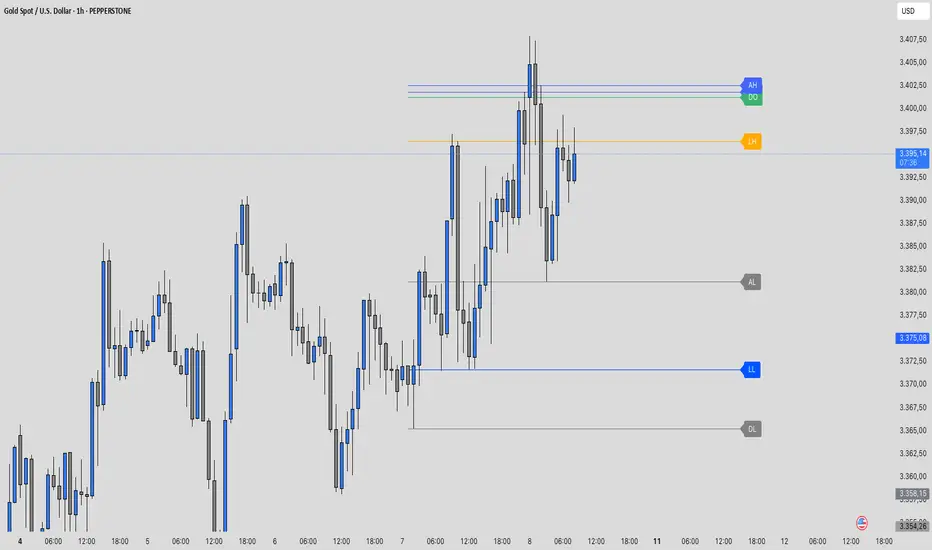
Traderei Sessions v.1This Indicator shows the daily open, the last 24h daily highs & lows and the last highs & lows of the asia session.
you can increase the lenght of the line manually !
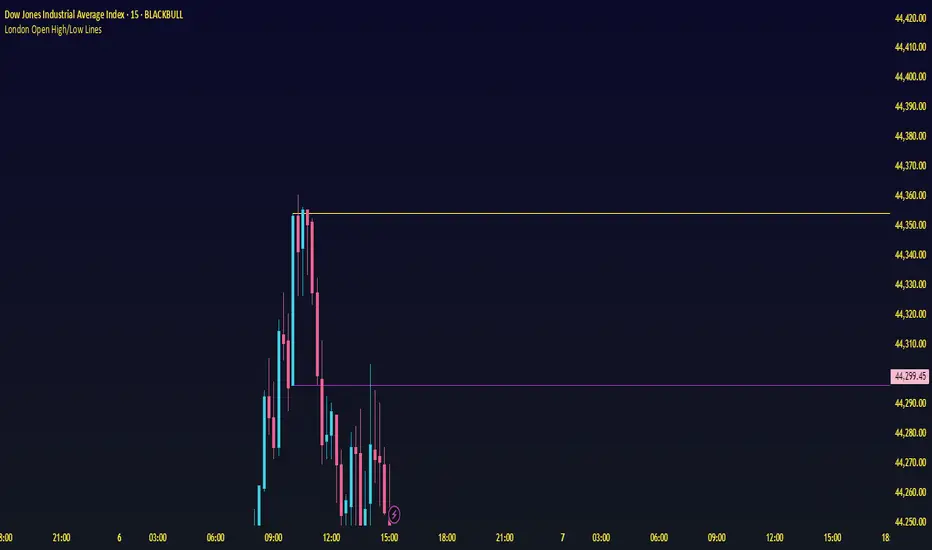
ORB M15 EarThRiseRAcest indicator trasează automat liniile de high și low pentru candela de 15 minute de la London Open, cu posibilitatea de a schimba culoarea și grosimea liniilor din setări. Ideal pentru strategii de tip opening range breakout. Compatibil cu orice instrument și funcționează pe timeframe de 15 minute.
Holy Grail Signal op EMA + ADXHolygrail + adx indicator with buy signals so you can buy at the yellow arrow

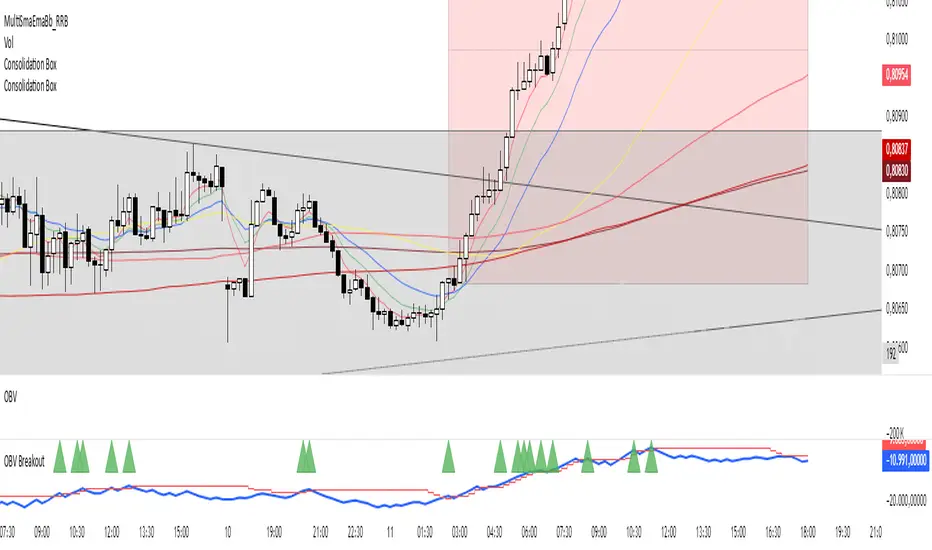
Consolidation Box1. Overview & Purpose
The "Faithful Box" is a powerful TradingView indicator designed to automatically identify and visualize high-quality price consolidation zones, often known as 'trading ranges' or 'boxes'.
This tool is a direct Pine Script translation of a specific, robust Python-based analysis strategy. Its primary goal is not just to find any sideways movement, but to qualify it based on a strict set of rules, ensuring that only meaningful and tradable consolidation patterns are highlighted on the chart.
2. Core Logic: How It Works
The indicator's intelligence is based on several key rules translated from the original Python script:
Box Definition (Based on Closing Prices): The most crucial rule is how the box is defined. Unlike many tools that use candle wicks (highs and lows), this indicator establishes the Ceiling (Resistance) and the Floor (Support) of the box using the highest Close price and the lowest Close price over the specified analysis period. This provides a more stable and representative view of the true consolidation zone, ignoring outlier price spikes.
Quality Filters: A consolidation is only considered valid and drawn on the chart if it meets two strict criteria:
Minimum Touches: The price must "test" the ceiling and floor a minimum number of times. A "touch" is counted with a tolerance — the High of a candle only needs to get close to the ceiling, and the Low close to the floor. This simulates how price interacts with support and resistance zones in the real world.
Maximum Height: The consolidation range cannot be excessively wide or volatile. The box will only be drawn if its total height, as a percentage of its price, is below a user-defined limit.
3. Visual Features on the Chart
When a valid consolidation pattern is detected, the indicator draws a semi-transparent box over the analysis period. The most powerful visual feature is its dynamic coloring, which functions as a built-in alert system:
🟥 Red Box: The box turns red when the price enters the upper "Action Zone" (e.g., the top 30% of the range). This visually signals that the price is near a key resistance level, alerting the trader to a potential reversal or breakout opportunity.
🟩 Green Box: The box turns green when the price enters the lower "Action Zone" (e.g., the bottom 30% of the range). This highlights that the price is testing a key support level.
⬜ Gray Box: The box remains a neutral gray when the price is trading in the middle of the range, which can often be considered a "no-trade" or "wait-and-see" zone.
4. Configuration (Indicator Inputs)
You have full control over the indicator's sensitivity through its inputs:
Analysis Period (days): Defines the lookback window (in trading days) to search for a consolidation pattern. Common values are 42 (approx. 2 months) or 63 (approx. 3 months).
Maximum Box Height (%): Filters out consolidations that are too volatile or wide. A lower percentage will find tighter, more compressed consolidations.
Minimum Ceiling/Floor Touches: Defines the "strength" of the support and resistance levels. Requiring more touches will result in fewer detected patterns, but likely of higher quality.
Touch Tolerance (%): Defines how close the High/Low needs to get to the edge of the box to be counted as a touch. A value of 2% means a touch is registered if the price comes within 2% of the box's total height from the edge.
Action Zone (%): Customizes the size of the red (resistance) and green (support) zones. A value of 30% means the top 30% of the box will be the red zone, and the bottom 30% will be the green zone.
Desempenho 4ªs (MA)This Pine Script v5 indicator calculates the performance from Wednesday to Wednesday at 10:30 AM for the charted instrument. Every Wednesday at that time, it records the closing price and computes the percentage change, assigning a signal: +1 for increases above 1 %, -1 for declines below -1 %, and 0 for intermediate movements. It plots a five-period simple moving average on the main chart, color-coded green, red, or gray based on the weekly signal. Vertical dotted lines mark each weekly separation, and two blue horizontal lines denote the ±1 % thresholds for the current week. A label displays the performance percentage and signal.

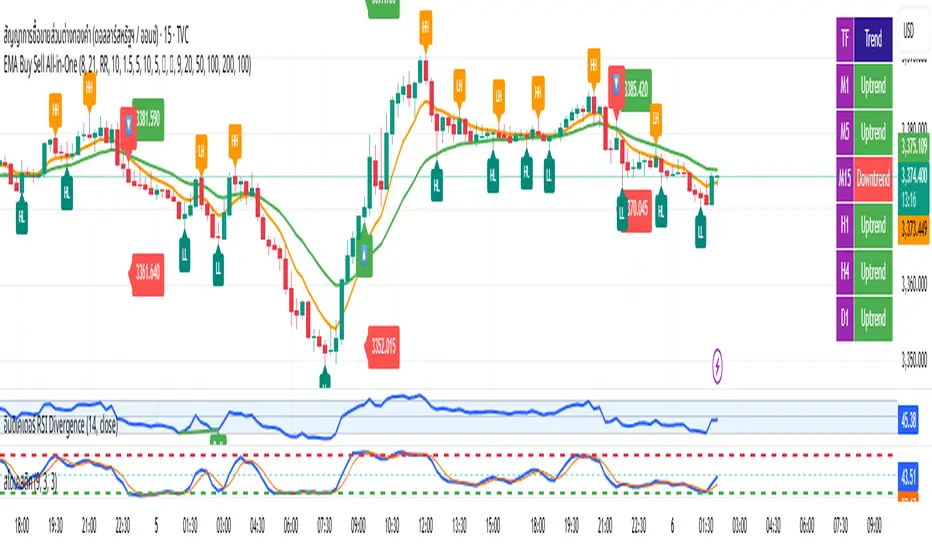
EMA Buy Sell All-in-One✨ Description (แนะนำให้ใช้ตอนกด Publish):
This all-in-one indicator combines several powerful trading tools into one script:
• EMA Cross Entry System: Customizable fast/slow EMA cross for buy/sell signals
• Dynamic SL/TP System: Choose between swing-based or custom SL/TP; auto-calculated RR support
• HH, HL, LH, LL Labels: Market structure points marked directly on chart (toggle ON/OFF)
• Multi-Timeframe Trend Table: Visual overview of EMA trends across D1 → M1 timeframes
• H1 Trend Change Icons: Alerts when the hourly trend flips direction
➤ Clean and responsive display
➤ Fully customizable via input panel
➤ Great for intraday or swing traders following trend + structure alignment
Feel free to fork or modify. Made for those who want clarity and confluence in one view.
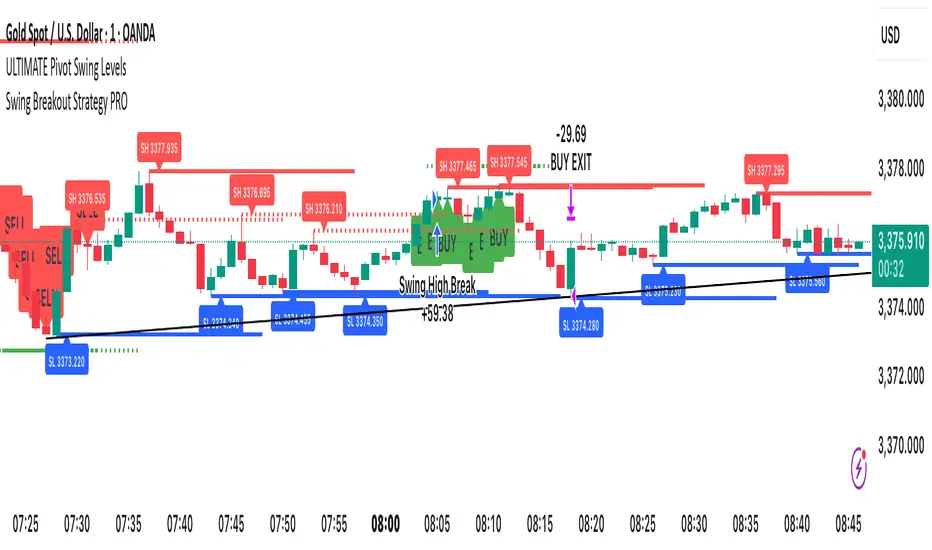
Swing Breakout Strategy PRO“Swing Strategy Pro”
A powerful trading tool designed for price action & swing traders. This indicator automatically detects swing highs and lows and generates precise Buy & Sell signals based on breakout confirmations.
✅ How It Works:
• Buy signal: When swing high breaks with confirmation candle
• Sell signal: When swing low breaks with confirmation candle
• Target = Distance between recent swing high & low
• Stop Loss = Opposite swing level
📌 Perfect for Breakout Trading, Swing Entries, and Trend Continuation strategies.
🎯 Fully automated with visual alerts & clean chart design.