EMA 50/200/100 [NevoxCore]⯁ OVERVIEW
EMA 50/200/100 is a clean EMA trio for trend mapping.
It highlights the classic 50/200 bias, keeps a constant EMA-100 anchor in white, plots cross dots, and can mark the first pullback back to a target EMA within an ATR tolerance.
Solid bias bar coloring (Nevox pink/orange or classic green/red) and compact visuals make it fast and reliable with no repainting.
⯁ HOW IT WORKS
Calculates Fast EMA 50, Slow EMA 200, and an always-on EMA 100 (white).
Bias = Fast vs. Slow: Fast > Slow → long regime; Fast < Slow → short regime.
Cross dots appear at confirmed 50/200 crosses (once per bar close).
First Pullback: after a cross, the script arms a window and marks the first return to the chosen EMA (100 or Fast) within ATR × tolerance.
Bar coloring is solid by regime (pink/orange by default, classic green/red when enabled).
No lookahead; signals confirm on bar close.
⯁ KEY FEATURES
• EMA 50/200 with EMA-100 anchor (always visible, white)
• Cross Up/Down dots (style-configurable)
• First Pullback marker (toggle) with ATR tolerance & window
• Solid bias bar coloring (Nevox or classic)
• Optional bias fill between Fast/Slow
• Minimal 1-cell HUD (OFF by default)
• Ready-made alerts with clean prefixes
⯁ SETTINGS (quick)
Visual: Classic colors toggle; Bias Fill (ON); Fill Transparency (85); Bar Color (solid, ON; auto-disabled when Classic is ON).
Core: Source = Close; EMA Fast = 50; EMA Slow = 200.
Pullback: Show marker (ON); Target EMA = EMA 100; Tolerance × ATR = 0.5; Max Bars After Cross = 40; ATR Length = 14.
HUD: Mini HUD OFF; Position selector.
Status Line: OFF by default (optional EMA values).
⯁ ALERTS (built-in)
• Cross Up (Fast above Slow) — confirmed at bar close
• Cross Down (Fast below Slow) — confirmed at bar close
• First Pullback LONG — first return to target after long cross
• First Pullback SHORT — first return to target after short cross
Prefix: EMA and message includes {{ticker}} {{interval}} @ {{close}}.
Suggested: set TradingView alerts to Once Per Bar Close.
⯁ HOW TO USE
• Read trend quickly: 50 above 200 with a rising 100 = healthy long bias.
• Use the First Pullback to time entries after a cross (default target = EMA 100).
• Tune Tolerance × ATR by symbol/TF; 0.3–0.7 is a good start.
• Keep charts clean: bias fill + barcolor ON; switch to Classic for green/red if preferred.
⯁ WHY IT’S DIFFERENT
It preserves the classic 50/200 logic but adds a consistent EMA-100 anchor, a single, one-shot pullback detector, and clean bias bars — all in a lightweight overlay with no repaint tricks.
⯁ DISCLAIMER
Backtest and paper-trade before using live. Not financial advice. Performance depends on market, timeframe, and parameters.
Wyszukaj w skryptach "纳斯达克指数期货cfd"

Adaptive Machine Learning Trading System [PhenLabs]📊Adaptive ML Trading System
Version: PineScript™v6
📌Description
The Adaptive ML Trading System is a sophisticated machine learning indicator that combines ensemble modeling with advanced technical analysis. This system uses XGBoost, Random Forest, and Neural Network algorithms to generate high-confidence trading signals while incorporating robust risk management features. Traders benefit from objective, data-driven decision-making that adapts to changing market conditions.
🚀Points of Innovation
• Machine Learning Ensemble - Three integrated models (XGBoost, Random Forest, Neural Network)
• Confidence-Based Trading - Only executes trades when ML confidence exceeds threshold
• Dynamic Risk Management - ATR-based stop loss and max drawdown protection
• Adaptive Position Sizing - Volatility-adjusted position sizing with confidence weighting
• Real-Time Performance Metrics - Live tracking of win rate, Sharpe ratio, and performance
• Multi-Timeframe Feature Analysis - Adaptive lookback periods for different market regimes
🔧Core Components
• ML Ensemble Engine - Weighted combination of XGBoost, Random Forest, and Neural Network outputs
• Feature Normalization System - Advanced preprocessing with custom tanh/sigmoid activation
• Risk Management Module - Dynamic position sizing and drawdown protection
• Performance Dashboard - Real-time metrics and risk status monitoring
• Alert System - Comprehensive alert conditions for entries, exits, and risk events
🔥Key Features
• High-confidence ML signals with customizable confidence thresholds
• Multiple trading modes (Conservative, Balanced, Aggressive) for different risk profiles
• Integrated stop loss and risk management with ATR-based calculations
• Real-time performance metrics including win rate and Sharpe ratio
• Comprehensive alert system with entry, exit, and risk management notifications
• Visual confidence bands and threshold indicators for easy signal interpretation
🎨Visualization
• ML Signal Line - Primary signal output ranging from -1 to +1
• Confidence Bands - Visual representation of model confidence levels
• Threshold Lines - Customizable buy/sell threshold levels
• Position Histogram - Current market position visualization
• Performance Tables - Real-time metrics display in customizable positions
📖Usage Guidelines
Model Configuration
• Confidence Threshold: Default 0.55, Range 0.5-0.95 - Minimum confidence for signals
• Model Sensitivity: Default 0.9, Range 0.1-2.0 - Adjusts signal sensitivity
• Ensemble Mode: Conservative/Balanced/Aggressive - Trading style preference
• Signal Threshold: Default 0.55, Range 0.3-0.9 - ML signal threshold for entries
Risk Management
• Position Size %: Default 10%, Range 1-50% - Portfolio percentage per trade
• Max Drawdown %: Default 15%, Range 5-30% - Maximum allowed drawdown
• Stop Loss ATR: Default 2.0, Range 0.5-5.0 - Stop loss in ATR multiples
• Dynamic Sizing: Default true - Volatility-based position adjustment
Display Settings
• Show Signals: Default true - Display entry/exit signals
• Show Threshold Signals: Default true - Display ±0.6 threshold crosses
• Show Confidence Bands: Default true - Display ML confidence levels
• Performance Dashboard: Default true - Show metrics table
✅Best Use Cases
• Swing trading with 1-5 day holding periods
• Trend-following strategies in established trends
• Volatility breakout trading during high-confidence periods
• Risk-adjusted position sizing for portfolio management
• Multi-timeframe confirmation for existing strategies
⚠️Limitations
• Requires sufficient historical data for accurate ML predictions
• May experience low confidence periods in choppy markets
• Performance varies across different asset classes and timeframes
• Not suitable for very short-term scalping strategies
• Requires understanding of basic risk management principles
💡What Makes This Unique
• True machine learning ensemble with multiple model types
• Confidence-based trading rather than simple signal generation
• Integrated risk management with dynamic position sizing
• Real-time performance tracking and metrics
• Adaptive parameters that adjust to market conditions
🔬How It Works
Feature Calculation: Computes 20+ technical features from price/volume data
Feature Normalization: Applies custom normalization for ML compatibility
Ensemble Prediction: Combines XGBoost, Random Forest, and Neural Network outputs
Signal Generation: Produces confidence-weighted trading signals
Risk Management: Applies position sizing and stop loss rules
Execution: Generates alerts and visual signals based on thresholds
💡Note:
This indicator works best on daily and 4-hour timeframes for most assets. Ensure you understand the risk management settings before live trading. The system includes automatic risk-off modes that halt trading during excessive drawdown periods.

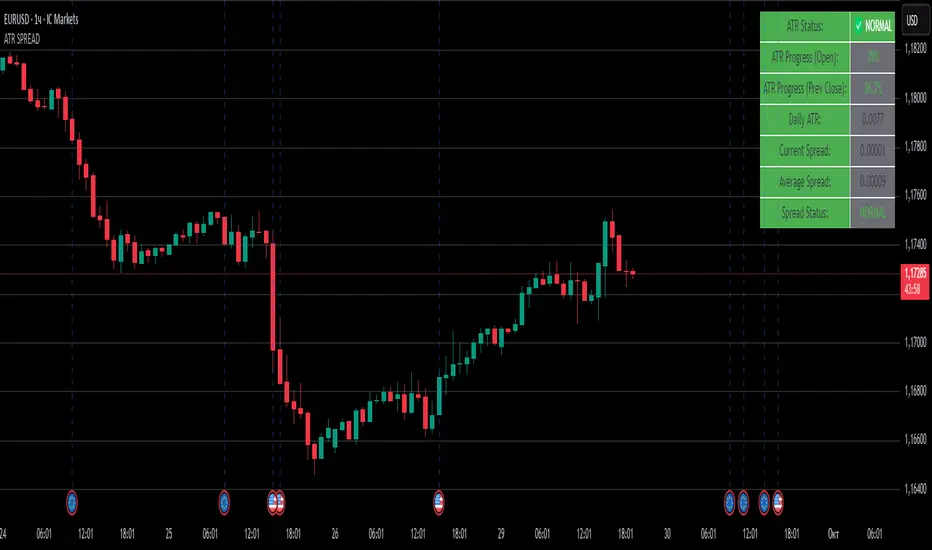
ATR SPREADThis is a comprehensive ATR SPREAD indicator for TradingView that combines volatility monitoring with spread analysis. Here's what it does and why it's useful:
Core Functionality
ATR Progress Tracking:
Monitors how much of the daily ATR (Average True Range) has been "consumed" during the current trading day
Calculates progress from two reference points: day's open and previous day's close
Displays progress as percentages or absolute values
Provides color-coded visual feedback (green → yellow → orange → red) based on ATR consumption levels
Spread Monitoring with Advanced Filtering:
Tracks current market spreads using multiple methods (minute high-low ranges, tick-to-tick differences)
Calculates rolling average spread to establish baseline conditions
Implements sophisticated filtering to exclude anomalous spread readings that could skew analysis
Key Features
Smart Filtering System:
Automatically filters out abnormal spreads during session opens
Excludes spreads that are too large relative to price or ATR
Removes outliers that exceed normal spread multiples
Maintains data quality for accurate analysis
Multi-Level Alert System:
ATR threshold alerts (50%, 80%, 100% consumption)
Customizable warning threshold (default 70%)
Spread expansion warnings and alerts
Session start notifications
Professional Dashboard:
Customizable information panel showing real-time metrics
Multiple positioning options and visual themes
Displays ATR status, progress percentages, current/average spreads
Color-coded status indicators for quick assessment
Trading Applications
Risk Management:
Helps traders understand how much daily volatility has been used up
Assists in position sizing based on remaining expected movement
Identifies periods of unusual market conditions
Market Condition Assessment:
Monitors liquidity conditions through spread analysis
Detects when spreads widen beyond normal levels
Filters out unreliable data during volatile periods
Entry/Exit Timing:
High ATR consumption may suggest limited further movement
Low ATR consumption early in the day might indicate potential for larger moves
Spread conditions help assess execution quality expectations
This indicator is particularly valuable for intraday traders, scalpers, and anyone who needs to monitor market microstructure conditions alongside volatility metrics. It provides a comprehensive view of both price movement potential (ATR) and execution environment quality (spreads) in a single, professional-grade tool.
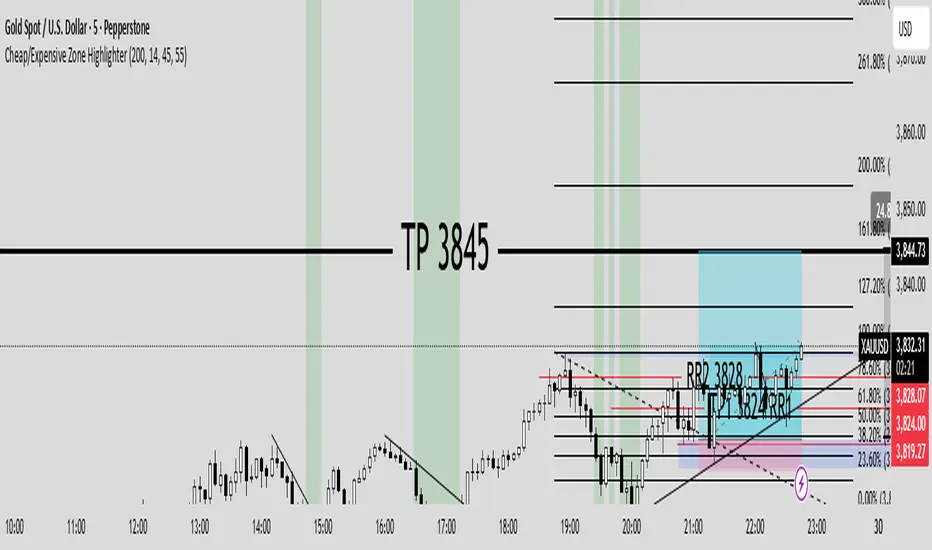
Cheap/Expensive Zone Highlighter V.2 Publicindicator Cheap/Expensive Zone Highlighter Ver2
Uptrend = Based on price> EMA200 (O+H+L+C)/4
Cheap zone = RSI<45
Dowtrend = Based on price< EMA200 (O+H+L+C)/4
Expensive Zone= RSI>55
Cheap/Expensive Zone Highlighter V.2 indicator Cheap/Expensive Zone Highlighter Ver2
Uptrend = Based on price> EMA200 (O+H+L+C)/4
Cheap zone = RSI<45
Dowtrend = Based on price< EMA200 (O+H+L+C)/4
Expensive Zone= RSI>55

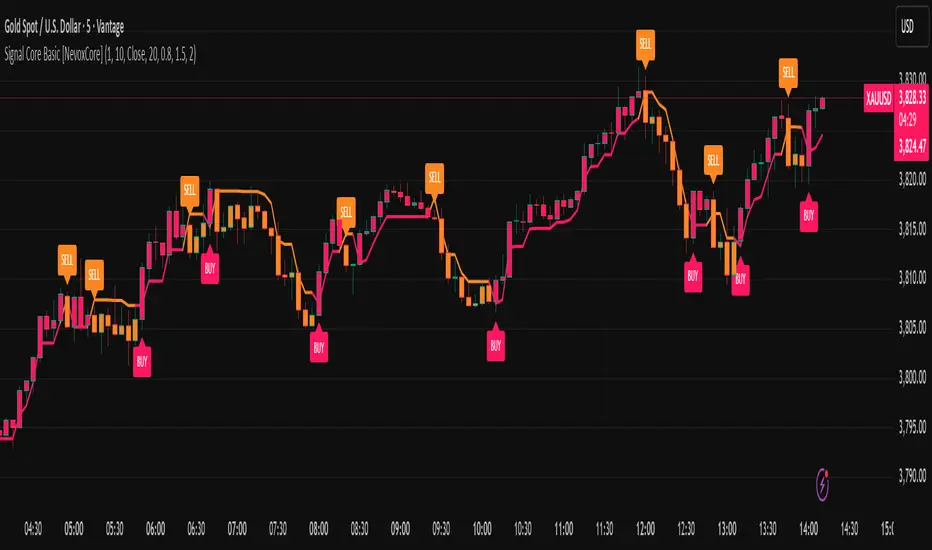
Signal Core Basic [NevoxCore]⯁ OVERVIEW
Signal Core Basic is a clean and functional ATR-based trailing stop with BUY/SELL signals.
It modernizes the classic "UT-style" concept with adaptive sensitivity, multi-source inputs (Close, Heikin-Ashi, ZLEMA, KAMA), and compact visuals.
The tool is designed for traders who want a clear, minimal, and reliable base indicator without repainting issues.
⯁ HOW IT WORKS
Calculates an ATR-based trailing stop (nLoss = Key × ATR).
Adaptive mode scales sensitivity depending on trend strength (trend/range detection).
Trailing stop flips when price crosses from one regime to the other.
BUY/SELL signals trigger only when confirmed and not blocked by cooldown.
Label ring-buffer ensures chart stays clean (max 50 labels).
Bar coloring optional (solid), auto-disabled when classic red/green colors are enabled.
⯁ KEY FEATURES
ATR-based trailing stop with adjustable sensitivity.
Adaptive key (trend/range aware).
Multiple compute sources: Close, Heikin-Ashi, ZLEMA, KAMA.
Global confirm-on-close switch (no repaint).
Early-flip protection (cooldown).
Compact BUY/SELL labels with auto-cleanup (max 50).
Optional solid bar coloring.
Alerts with ticker, timeframe, and price included.
⯁ SETTINGS (quick overview)
Visual: Classic Colors, Show Labels, Plot Trailing Stop, Barcolor ON/OFF.
Source & Sensitivity: Key Value, ATR Length, Compute Source.
Advanced: Adaptive Key toggle with min/max bounds.
Global: Confirm on bar close.
Extras: Cooldown protection (bars).
⯁ ALERTS (built-in)
Basic Long: BUY signal.
Basic Short: SELL signal.
Each alert includes {{ticker}} {{interval}} @ {{close}}.
⯁ HOW TO USE
Use as a trailing stop and regime filter.
Combine BUY/SELL signals with your strategy rules.
Enable cooldown for cleaner signals in choppy markets.
Try ZLEMA or Heikin-Ashi as compute source for smoother performance.
⯁ WHY IT’S DIFFERENT
Unlike generic UT-style scripts, Signal Core Basic adds adaptive sensitivity, multiple input sources, and strict non-repaint safety.
The visuals follow NevoxCore’s design standards: compact, minimal, and clean — ready for live trading with alerts.
⯁ DISCLAIMER
Backtest and paper-trade before using live. Not financial advice.
Performance depends on market, timeframe, and parameters.
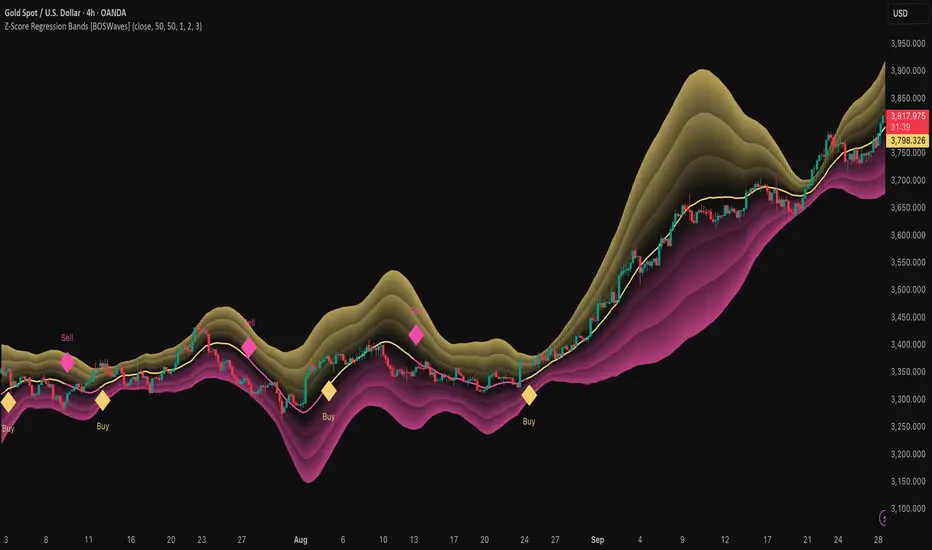
Z-Score Regression Bands [BOSWaves]Z-Score Regression Bands – Adaptive Trend and Volatility Insight
Overview
The Z-Score Regression Bands is a trend and volatility analysis framework designed to give traders a clear, structured view of price behavior. It combines Least Squares Moving Average (LSMA) regression, a statistical method to detect underlying trends, with Z-Score standardization, which measures how far price deviates from its recent average.
Traditional moving average bands, like Bollinger Bands, often lag behind trends or generate false signals in noisy markets. Z-Score Regression Bands addresses these limitations by:
Tracking trends accurately using LSMA regression
Normalizing deviations with Z-Scores to identify statistically significant price extremes
Visualizing multiple bands for normal, strong, and extreme moves
Highlighting trend shifts using diamond markers based on Z-Score crossings
This multi-layered approach allows traders to understand trend strength, detect overextensions, and identify periods of low or high volatility — all from a single, clear chart overlay. It is designed for traders of all levels and can be applied across scalping, day trading, swing trading, and longer-term strategies.
Theoretical Foundation
The Z-Score Regression Bands are grounded in statistical and trend analysis principles. Here’s the idea in plain terms:
Least Squares Moving Average (LSMA) – Unlike standard moving averages, LSMA fits a straight line to recent price data using regression. This “best-fit” line shows the underlying trend more precisely and reduces lag, helping traders see trend changes earlier.
Z-Score Standardization – A Z-Score expresses how far the LSMA is from its recent mean in standard deviation units. This shows whether price is unusually high or low, which can indicate potential reversals, pullbacks, or acceleration of a trend.
Multi-Band Structure – The three bands represent: Band #1: Normal range of price fluctuations; Band #2: Significant deviation from the trend; Band #3: Extreme price levels that are statistically rare. The distance between bands dynamically adapts to market volatility, allowing traders to visualize expansions (higher volatility) and contractions (lower volatility).
Trend Signals – When Z-Score crosses zero, diamonds appear on the chart. These markers signal potential trend initiation, continuation, or reversal, offering a simple alert for shifts in market momentum.
How It Works
The indicator calculates and plots several layers of information:
LSMA Regression (Trend Detection)
Computes a line that best fits recent price points.
The LSMA line smooths out minor fluctuations while reflecting the general direction of the market.
Z-Score Calculation (Deviation Measurement)
Standardizes the LSMA relative to its recent average.
Positive Z-Score → LSMA above average, negative → LSMA below average.
Helps identify overbought or oversold conditions relative to the trend.
Multi-Band Construction (Volatility Envelope)
Upper and lower bands are placed at configurable multiples of standard deviation.
Band #1 captures typical price movement, Band #2 signals stronger deviation, Band #3 highlights extreme moves.
Bands expand and contract with volatility, giving an intuitive visual guide to market conditions.
Trend Signals (Diamonds)
Appear when Z-Score crosses zero.
Indicates moments when momentum may shift, helping traders time entries or exits.
Visual Interpretation
Band width = volatility: wide bands indicate strong movement; narrow bands indicate calm periods.
LSMA shows underlying trend direction, while bands show how far price has strayed from that trend.
Interpretation
The Z-Score Regression Bands provide a multi-dimensional view of market behavior:
Trend Analysis – LSMA line slope shows general market direction.
Momentum & Volatility – Z-Score indicates whether the trend is accelerating or losing strength; band width indicates volatility levels.
Price Extremes – Price touching Band #2 or #3 may suggest overextension and potential reversals.
Trend Shifts – Diamonds signal statistically significant changes in momentum.
Cycle Awareness – Standard deviation bands help distinguish normal market fluctuations from extreme events.
By combining these insights, traders can avoid false signals and react to meaningful structural shifts in the market.
Strategy Integration
Trend Following
Enter trades when diamonds indicate momentum aligns with LSMA direction.
Use Band #1 and #2 for stop placement and partial exits.
Breakout Trading
Watch for narrow bands (low volatility) followed by price pushing outside Band #1 or #2.
Confirm with Z-Score movement in the breakout direction.
Mean Reversion/Pullback
If price reaches Band #2 or #3 without continuation, expect a pullback toward LSMA.
Exhaustion & Reversals
Flattening Z-Score near zero while price remains at extreme bands signals trend weakening.
Tighten stops or scale out before a potential reversal.
Multi-Timeframe Confirmation
High timeframe LSMA confirms the main trend.
Lower timeframe bands provide refined entry and exit points.
Technical Implementation
LSMA Regression : Best-fit line minimizes lag and captures trend slope.
Z-Score Standardization : Normalizes deviation to allow consistent interpretation across markets.
Multi-Band Envelope : Three layers for normal, strong, and extreme deviations.
Trend Signals : Automatic diamonds for Z-Score zero-crossings.
Band Fill Options : Optional shading to visualize volatility expansions and contractions.
Optimal Application
Asset Classes:
Forex : Capture breakouts, overextensions, and trend shifts.
Crypto : High-volatility adaptation with adjustable band multipliers.
Stocks/ETFs : Identify trending sectors, reversals, and pullbacks.
Indices/Futures : Track cycles and structural trends.
Timeframes:
Scalping (1–5 min) : Focus on Band #1 and trend signals for fast entries.
Intraday (15m–1h) : Use Bands #1–2 for continuation and breakout trades.
Swing (4h–Daily) : Bands #2–3 capture trend momentum and exhaustion.
Position (Daily–Weekly) : LSMA trend dominates; Bands #3 highlight regime extremes.
Performance Characteristics
Strong Performance:
Trending markets with moderate-to-high volatility
Assets with steady liquidity and identifiable cycles
Weak Performance:
Flat or highly choppy markets
Very short timeframes (<1 min) dominated by noise
Integration Tips
Combine with support/resistance, volume, or order flow analysis for confirmation.
Use bands for stops, targets, or scaling positions.
Apply multi-timeframe analysis: higher timeframe LSMA confirms main trend, lower timeframe bands refine entries.
Disclaimer
The Z-Score Regression Bands is a trading analysis tool, not a guaranteed profit system. Its effectiveness depends on market conditions, parameter selection, and disciplined risk management. Use it as part of a broader trading strategy, not in isolation.
Gold NY Session Key TimesJust showing to us that news come out, open market, close bond for NY Session Time For Indonesia

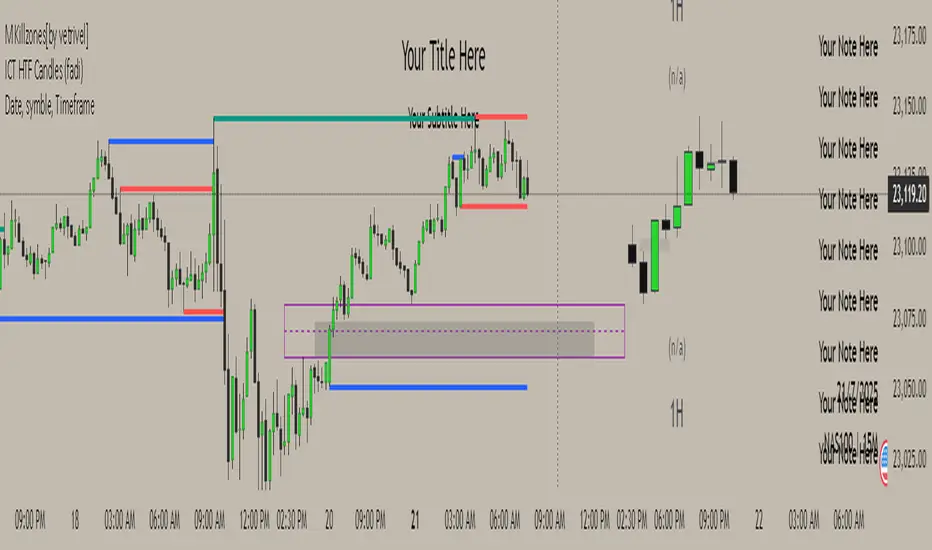
M Killzones[by vetrivel]Cool free style Session indicator, Inspired by TJR trader session times and it's easily changeable. Really this session times changes everything. Basic requirement to use this Discipline and Mindset
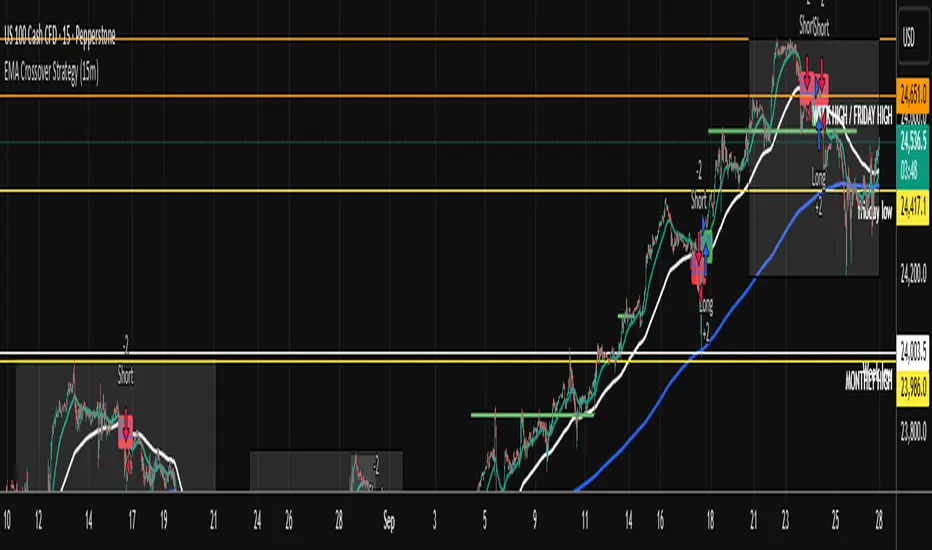
EMA Crossover Strategy (15m)50 and 200 ema crossing when leaving anchor. when 50 and 200 crosses will give you direction of where market is going. wait for a pull back and take trade. sl on highest or lowest point of apex tp open . when you see multiple equal ( low or High) get put of trade.
Effort vs Result TRFxThe Effort vs Result (EVR) indicator is designed to identify high-probability reversal signals based on volume and price action dynamics. It highlights points where the market “effort” (high volume) does not correspond to an immediate “result” (price continuation), providing actionable trade setups for both bullish and bearish scenarios.
Features:
Detects bullish EVR signals when a previous high-volume sell candle is followed by a strong bullish candle that sweeps the previous low.
Detects bearish EVR signals when a previous high-volume buy candle is followed by a strong bearish candle that sweeps the previous high.
Sticky arrows plot automatically above or below the candle, ensuring the signal moves with the price bar.
Considers inside bars, wick size, and relative volume to filter low-quality setups.
Fully compatible with multiple timeframes.
Inputs:
Volume Multiplier: Sets how much higher the current candle’s volume should be compared to the previous candle to count as high volume.
Min Wick % of Candle: Minimum wick size relative to the candle body to filter insignificant bars.
Max Inside Bars to Ignore: Number of inside bars between the previous candle and the EVR candle to ignore minor consolidations.
Usage:
(Green Arrow): Enter long when a green arrow appears below the candle. Place stop-loss slightly below the previous swing low.
(Red Arrow): Enter short when a red arrow appears above the candle. Place stop-loss slightly above the previous swing high.
Can be combined with support/resistance levels, trendlines, or other technical indicators for higher accuracy.
Benefits:
Simple and clean visual signals with tiny arrows that move with candles.
Helps traders identify high-probability reversal points based on volume and price action.
Ideal for intraday and swing trading strategies.

Alerte Croisement EMA9 & SMA12 (Zone remplie)📊 Moving Average 1
Period: 9 → The average is calculated over the last 9 candles (or time periods).
Shift: 0 → No shift; the average is aligned with the current data.
Method: Exponential → Uses an Exponential Moving Average (EMA), which gives more weight to recent data.
Apply to: Close → The average is based on the closing price of each candle.
📊 Moving Average 2
Period: 12 → Calculated over the last 12 periods.
Shift: 0 → No shift.
Method: Simple → Uses a Simple Moving Average (SMA), which gives equal weight to each period.
Apply to: Close → Based on closing prices.

TrailingStopLossLibrary "TrailingStopLoss"
简易追踪止损; 未充分测试,欢迎提交issue
drawdown_percent(entry_bar_index, direction_long)
drawdown_percent: 回撤百分比
Parameters:
entry_bar_index (int)
direction_long (bool)
Returns: percentage: 回撤百分比 > 0
closure_needed(entry_bar_index, initial_sl_price, percentage_ts, num_bars_tolerance, extra_drawdown_distance)
closure_needed: 是否满足平仓条件
Parameters:
entry_bar_index (int)
initial_sl_price (float)
percentage_ts (float)
num_bars_tolerance (int)
extra_drawdown_distance (float)
Returns: do_closure: bool 是否平仓

Shamji's Liquidity Sweep + FVG (Follow-up + Filters) Purpose (what it does)
This indicator looks for two related price structures used by many smart-money / liquidity-hunt traders:
Liquidity Sweeps — candles that wick beyond a recent swing high (for buy-side stop-hunts) or swing low (for sell-side stop-hunts), then close back inside. These are flagged as potential stop-hunt events that clear obvious liquidity.
Fair Value Gaps (FVGs) — simple 3-bar style gaps where an older bar’s high is below the current low (bullish FVG) or an older bar’s low is above the current high (bearish FVG). When an FVG appears after a sweep (within a configurable window), this is considered a follow-up alignment.
The script adds optional filters (volume spike and candle-range vs ATR) to increase confidence, and can restrict marking/alerts to only events that meet the follow-up and filter rules.

XAUUSD CSI+RSI+Delta (15m)XAUUSD 15m
Candle Stability Index: 0.4
RSI Index: 80
Candle Delta Length: 6
Disable Repeating Signals: Enabled

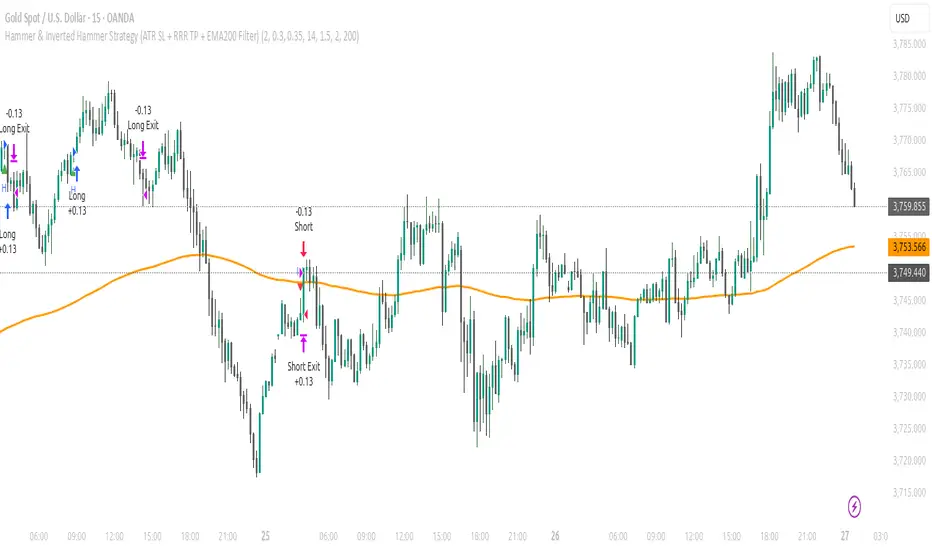
Alain parfHammer signals only valid for longs above EMA200.
Inverted hammer signals only valid for shorts below EMA200.
EMA200 is plotted as an orange line.
卡蛋K线反转Currently, only entry signals and reversal signals are available.
Continuous updates are planned, with subsequent plans to add alarm and reversal alerts.
Watermark with Session Boxes (by Rufi)Watermark & Session Boxes - Chart Branding Tool
What it does: Combines professional chart watermarking with automated trading session visualization for clean, branded analysis.
Key Features:
Smart Session Boxes: Auto-draws boxes around Asia (8PM-11:59PM), London (2AM-5AM), and NY (7AM-10AM) sessions using high/low detection
Custom Watermark: Professional text overlay with your brand/tagline
Full Customization: Adjustable colors, transparency (0-100%), and display limits (1-30 days)
How it works: Uses Pine Script's time() function to detect session periods, tracks price extremes during each session, then draws filled rectangles from session high to low. Perfect for identifying key support/resistance levels from major trading periods.
Best for: Intraday traders who want branded charts with clear session-based S/R levels. Ideal for forex, indices, and crypto on lower timeframes.

NY 14:30 High/Low - 1mThis indicator automatically draws horizontal lines for the High (green) and Low (red) of the 14:30 (Lisbon) candle on the 1-minute chart.
It is designed for traders who want to quickly identify the New York open levels (NY Open), allowing you to:
Visualize the NY market opening zone.
Use these levels as intraday support or resistance.
Plan entries and exits based on breakouts or pullbacks.
Features:
Works on any 1-minute chart.
Lines are drawn immediately after the 14:30 candle closes.
Lines extend automatically to the right.
Simple and lightweight, no complex variables or external dependencies.
Daily reset, always showing the current day’s levels.
Recommended Use:
Combine with support/resistance zones, order blocks, or fair value gaps.
Monitor price behavior during the NY open to identify breakout or rejection patterns.

EMA Regime (9/20/50/100/200) — Stacked with 200 FilterEMA Regime (9/20/50/100/200) — Stacked Long/Short Box
Plots the 9, 20, 50, 100, and 200 EMAs on the chart.
Checks if price is above or below each EMA and whether the EMAs are stacked in order.
LONG signal: price above all selected EMAs and EMAs stacked 9 > 20 > 50 > 100 >(> 200 if strict mode on).
SHORT signal: price below all selected EMAs and EMAs stacked 9 < 20 < 50 < 100 (< 200 if strict mode on).
Shows a two-row table (LONGS / SHORTS) so you can quickly see which EMAs are aligned.
Optionally colors candles green/red when a full long/short regime is active.
Can show labels when a new LONG or SHORT condition appears.
Has alerts you can use for automated notifications when the regime flips.
“Use 200 EMA in the stack” lets you choose ultra-strict mode (9>20>50>100>200) or lighter mode (9>20>50>100 but price & 9 above 200).

EMA Separation (LFZ Scalps) v6 — Early TriggerPlots the percentage distance between a fast and a slow EMA (default 9 & 21) to gauge trend strength and filter out choppy London Flow Zone breakouts.
• Gray – EMAs nearly flat (low momentum, avoid trades)
• Orange – early trend building
• Green/Red – strong directional momentum
Useful for day-traders: wait for the gap to widen beyond your chosen threshold (e.g., 0.25 %) before entering a breakout. Adjustable EMA lengths and alert when the separation exceeds your “strong trend” level.

ORB 15m + MAs (v4.1)Session ORB Live Pro — Pre-Market Boxes & MA Suite (v4.1)
What it is
A precision Opening Range Breakout (ORB) tool that anchors every session to one specific 15-minute candle—then projects that same high/low onto lower timeframes so your 1m/5m levels always match the source 15m bar. Perfect for scalpers who want session structure without drift.
What it draws
Asia, Pre-London, London, Pre-New York, New York session boxes.
On 15m: only the high/low of the first 15-minute bar of each window (optionally persists for extra bars).
On 5m: mirrors the same 15m range, visible up to 10 bars.
On 1m: mirrors the same 15m range, visible up to 15 bars.
Levels update live while the 15m candle is forming, then lock.
Fully editable windows (easy UX)
Change session times with TradingView’s native input.session fields using the familiar format HHMM-HHMM:1234567. You can tweak each window independently:
Asia
Pre-London
London
Pre-New York
New York
Multi-TF logic (no guesswork)
Designed to show only on 1m, 5m, 15m (by default).
15m = ground truth. Lower timeframes never “recalculate a different range”—they mirror the 15m bar for that session, exactly.
Alerts
Optional breakout alerts when price closes above/below the session range.
Clean visuals
Per-session color controls (box + lines). Boxes extend only for the configured number of bars per timeframe, keeping charts uncluttered.
Built-in MA suite
SMA 50 and RMA 200.
Three extra MAs (SMA/EMA/RMA/WMA/HMA) with selectable color, width, and style (line, stepline, circles).
Why traders like it
Consistency: Lower-TF ranges always match the 15m source bar.
Speed: You see structure immediately—no waiting for N bars.
Control: Edit session times directly; tune how long boxes stay on chart per TF.
Clarity: Minimal, purposeful plotting with alerts when it matters.
Quick start
Set your session times via the five input.session fields.
Choose how long boxes persist on 1m/5m/15m.
Enable alerts if you want instant breakout notifications.
(Optional) Configure the MA suite for trend/bias context.
Best for
Intraday traders and scalpers who rely on repeatable session behavior and demand exact cross-TF alignment of ORB levels.
