HEAVI - HawkEye Aggregated Volume IndicatorThis is combined Aggregated BTC Exchange Volume by Neobutane with HawkEye volume clone indicator by LazyBear.
Indicator includes aggregated raw BTC volume from 9 user selectable fiat and tether exchanges + Exponential MA + hawkeye bar coloring where: green is bullish volume, red - bearish and white - volume neutral to the market:
Bitfinex
Coinbase
Bitstamp
Kraken
Binance
Poloniex
Bittrex
bitFlyer
Bithumb
Wyszukaj w skryptach "电脑桌面显示BTC"

RSI / Stoch / SRSI / MFI / Aroon Overlay [SigmaDraconis]Combines 4 popular indicators (RSI, Stoch, SRSI, MFI) and 1 peculiar one (Aroon) in 1 for those who want to save indicators but not only.
This is an evolution of my (simpler) "RSI / Stoch / Stoch RSI (SRSI) Overlay " that you can find on my scripts.
Added bands for oversold/overbought areas (70/30 common for RSI and 80/20 for SRSI and MFI), as well as a middle 50 horizontal line.
Neutral bands around 55-45 added as well that can be hidden for less clutter. I also recommend a more transparent coloring for these since Pine script doesn't allow default transparency for horizontal lines.
By default only RSI and Stoch are activated, you can activate Aroon, MFI and SRSI on the inputs window.
Some extra notes:
* RSI, Stoch and MFI can help to strengthen one's decision as well as Aroon to predict a possible trend reversal, SRSI can show when RSI has high probability of being topped or bottomed when oversold/overbought but don't forget to look at volume and how the trend progresses that can keep SRSI above 80 or below 20 while RSI and price continues to trend, divergences are most helpful here to find possible reversal areas.
* This chart depicts some interesting divergences, as well as Stoch tops and bottoms and confluences between RSI/MFI and Stoch on some over-extended tops and bottoms that shown being good reversal zones.
RSI resistances are shown as well, failing to break above 60 or the neutral zone (this is a bearish BTC trend chart after all) or failing to gain support to break up certain levels (RSI notes a more bullish trend when consistently above 60 and more bearish below 40).
If you like it and use it to profit, please tip me below :)
Tip jars:
BTC: 15nMBiEGVrdGcu9C1h6QRcTNRvugHkqrMQ
ETH: 0xC33845946c48B61fBCbEA0367ec2238CaF2b73bc
BTS: sigma-draconis


U&Dif price has moved up since 1 to 3 candles ago = buy
if price has moved down since 1 to 3 candles ago = sell
has internal SL & TP
tested on
BITFINEX:ETHUSD
BITFINEX:BTCUSD
BITFINEX:LTCUSD
BITFINEX:ETHBTC
4 hour charts

XRPBTC long : BTCUSD shortIt will be an index using the price delivered by Bitfinex exchanges. It is a very simple indicator, but it is a recommended index for those who want to see XRP while keeping the risk of price fluctuation of BTC down. The code is simple and you can use XRP in the same way by changing it to another alto. There is a big gap in the prices of BTC and XRP, so we adjust the values so that the indicators are easy to see.

Relative Estimated Price REP by KIVANÇ fr3762Relative Estimated Price (REP) Indicator shows the estimated price calculated if the tickerid made the same value changes (in %) during a certain period.
The default value of the lookback period is 50.
In the given XRPUSD chart you can see that XRPUSD has a value of 0.26480 and the RPC indicator shows the value of 0.38099.
This means that XRP would be 0.38099USD if it was fully made the same percentage moves with BTC , we can say that XRP is RELATIVELY cheap according to BTC price moves.
Conversely XRP would be RELATIVELY expensive if the last value of REP was lower then current XRP price.
users can choose the relative base price in calculation of REP between 1-5 which are:
1=BTCUSD, 2=ETHUSD, 3=EURTRY(Euro/Turkish Lira), 4=USDTRY (Dollar/Turkish Lira), 5=BIST100 (Istanbul Stock Exchange)
I personally advise you to use this indicator for daily charts in Tradingview to have more accurate estimated prices because of the website's calculation.
Developed by KIVANÇ

[NG] Indicator - Altcoin Alpha - v1(Created for Client)
Alpha (Unique price action of asset) indicator for ALTcoins implementation, taking `BINANCE:BTCUSDT` as the market reference. Can be improved by adding more BTC charts from more sources, so as to get a unified chart of BTC for market representation.
Set `alpha period` to a value, wherein you want to see the unique price action of the asset. For short term trend, a value of 24 is good for `1H` charts (1 day), and value of 168 is good for long term trends on `1H` charts (1 week trend).
Corresponding values of `beta period` should be `168` (1 week for 1 day alpha) and `720` (1 month for 1 week alpha period).
You can set `alpha` and `beta` period as per your requirements.
Regards,

TSP Volume Change Big Small// Better Display of Volume change
// green candle : Big volume change
// red Candle : Small volume change
// Default for BTC m5
// Big volume are limited up to $limup% 5%
// Pump : Volume over $limgreen% 2%
// Flat : Very Small Volume under $limdo% 0.2%
// Adjust based on volatility / TF
// BTC/USD 1h : 4,2,0.25

Quote asset VolumeVolume expressed in quote asset units. For pair DOGE/BTC the volume is shown in BTC, instead of DOGE.
Values are imprecise, because each candle's price is calculated as (O+H+L+C)/4, instead of a weighted average one, which I couldn't obtain.
Noro's Trend MAs Strategy v1.8Trade strategy which uses only 2 MA.
The slow MA (blue) is used for definition of a trend
The fast MA (red) is used for an entrance to the transaction
For:
- For H1
- For crypto/fiat or crypto/crypto
- Good for "BTC/USD", "ETH/USD", "ETH/BTC"
Recomended:
Long = true (if it is profitable as a result of backtests)
Short = true (if it is profitable as a result of backtests)
Stops = false
Stop, % = any
OHLC4 = any
Use Fast MA = true
Fast MA Period = 5
Slow MA Period = 21
Bars Q = (2 for "bitcoin/fiat" or 1 for "crypto/fiat" or 0 for "crypto/crypto")
In the new version 1.8
- The second PriceChannel is added
- Profit became more
- Losses became less
- The unnecessary types of MA are removed

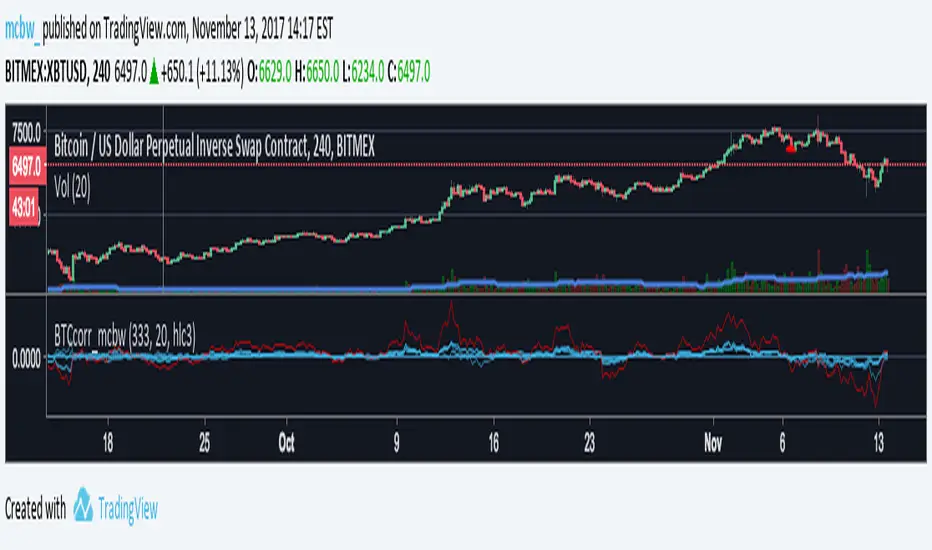
Bitcoin momentum correlation This is a pretty simple indicator, it measures the momentum of bitcoin as compared to usd,eur,eth,dash, and ltc, which you can see in all of the blue lines. If the red line is above zero then it means the overall value of btc is going up, opposite for down. The Ema_window controls how smooth the signal is. If you shorten the Ema_window parameter and open this on higher timeframe btc charts then the zero crossing gives pretty solid signals, despite being pretty choppy. A good way to interpret this is that if all the blue lines are moving in the same direction at once without disagreement, then the value of bitcoin has good momentum.
Mildly more technically:
Momentum is measured in the first derivative of an EMA for each ticker. To normalize the different values against each other they are all divided by their local maximums, which can be chosen in the parameter window, but shouldn't make a huge difference. All the checked values are then summed, as shown in the red line. To include a value into the red line simply keep it checked. Take a look at the script, it's kind of easy on the eyes.
It's pretty handy to look at, but doesn't seem too worthwhile to pursue much further. If someone wants much more out of the script then feel free to message me.
Remember rules #1 & #2
Don't lose money.
Happy trading
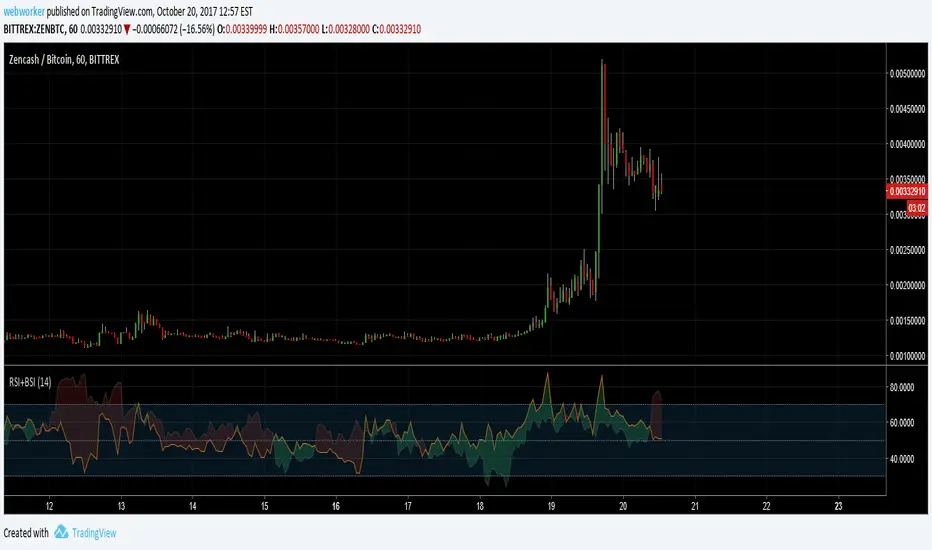
RSI+BSIThis script simply plots the current instruments RSI as well as Bitcoin's RSI from bitfinex. Helpful to identify when an alt is performing stronger than BTC or if BTC is dragging the alt down.
Volume Conversion IndicatorVolume Conversion Indicator
The volume conversion indicator is much like the in-built volume indicator. This particular volume indicator allows you to find out how much of something has been traded in a given timeframe.
This is done by multiplying volume by the average price at that point.
What does this mean?
Well, say, for example, you were watching DGB/BTC (DigiByte/Bitcoin). Instead of the volume being displayed in the amount of DGB traded, the amount of BTC traded is displayed instead.
Feel free to comment... Hope this helps :D

Indicator: Schaff Trend Cycle (STC)Another new indicator for TV community :)
STC detects up and down trends long before the MACD. It does this by using the same exponential moving averages (EMAs), but adds a cycle component to factor instrument cycle trends. STC gives more accuracy and reliability than the MACD.
More info: www.investopedia.com
Feel free to "Make mine" this chart and use the indicator in your charts. Appreciate any feedback on how effective this is for your instrument (I have tested this only with BTC).
For people trading BTC:
-------------------------------
Try 3/10 or 9/30 for MACD (fastLength/slowLength). They seem to catch the cycles better than the defaults. :)

Global M2 YoY % Change (USD) 10W-12W LEADthe base script is from @dylanleclair I modified it slightly according to the views on liquidity by professionals — average estimated lead time to price of btc, leading 10-12 weeks. liquidity and bitcoin’s price performance track pretty close and so it’s a cool tool for phase recognition, forward guidance and expectation management.

ICT Breaker Blocks [Exponential-X]🔄 Breaker Blocks
Overview
Breaker Blocks automatically identifies failed order blocks that have reversed their polarity. When an order block gets broken, it often becomes a powerful support or resistance zone in the opposite direction. This indicator tracks these institutional "flips" based on ICT (Inner Circle Trader) concepts, helping identify where price is likely to find strong support or resistance after a structural break.
━━━━━━━━━━━━━━━━━━━━━━━━━━━━
🎯 What This Indicator Does
Detects Breaker Blocks:
• 🔵 Bullish Breaker Blocks (BB+) - Failed bearish order blocks that became support
• 🟣 Bearish Breaker Blocks (BB-) - Failed bullish order blocks that became resistance
• Tracks order blocks first, then monitors when they break
• Converts broken order blocks into breaker blocks automatically
• Shows when breakers get tested by price
How Breakers Form:
1. Order block forms (last opposite candle before strong move)
2. Price returns and breaks through the order block
3. Broken order block becomes a breaker block with flipped polarity
4. Old resistance becomes new support (or vice versa)
Visual Display: Smart Features:
• Auto-timeframe adjustment for optimal detection
• ATR-based strength filtering
• Active block highlighting
• Test tracking
• Distance calculator
• Duplicate prevention
━━━━━━━━━━━━━━━━━━━━━━━━━━━━
📚 Understanding Breaker Blocks
What Are Breaker Blocks?
Breaker blocks are failed order blocks that price has broken through. In ICT methodology:
• When institutions place orders creating an order block
• If that level fails and price breaks through
• The zone often becomes strong support/resistance in the opposite direction
• This represents institutional position flipping
Why Breakers Form:
• Failed Defense: Institutions couldn't defend the original level
• Position Flip: Institutions reversed their position
• Stop Hunt Complete: After sweeping stops, new levels form
• Polarity Change: Old resistance becomes new support (or vice versa)
Key Difference From Order Blocks: [/b>
• Order Block: Original institutional level (unbroken)
• Breaker Block: Failed order block that flipped polarity
• Breakers often provide STRONGER reactions than original OBs
• Represents where institutions changed their strategy
━━━━━━━━━━━━━━━━━━━━━━━━━━━━
🔵 Bullish Breaker Blocks Explained
Formation Process:
1. Step 1: Bearish order block forms (last bullish candle before drop)
2. Step 2: Price breaks ABOVE this bearish OB
3. Step 3: The broken bearish OB becomes a bullish breaker
4. Step 4: Now acts as SUPPORT when price returns
What It Means:
• Old resistance level failed
• Institutions flipped from selling to buying
• When price returns, zone acts as strong support
• Higher probability long setup than regular support
Trading Bullish Breakers:
Entry Setup:
• Wait for price to retrace back to bullish breaker
• Look for rejection/bounce from the breaker zone
• Enter long when price respects the breaker as support
• Stop loss: Below the breaker block
• Target: Recent high or opposite breaker
Why It Works:
Failed resistance becoming support is a strong technical signal indicating structural change in market sentiment.
━━━━━━━━━━━━━━━━━━━━━━━━━━━━
🟣 Bearish Breaker Blocks Explained
Formation Process:
1. Step 1: Bullish order block forms (last bearish candle before rally)
2. Step 2: Price breaks BELOW this bullish OB
3. Step 3: The broken bullish OB becomes a bearish breaker
4. Step 4: Now acts as RESISTANCE when price returns
What It Means:
• Old support level failed
• Institutions flipped from buying to selling
• When price returns, zone acts as strong resistance
• Higher probability short setup than regular resistance
Trading Bearish Breakers:
Entry Setup:
• Wait for price to retrace back to bearish breaker
• Look for rejection/reversal from the breaker zone
• Enter short when price respects the breaker as resistance
• Stop loss: Above the breaker block
• Target: Recent low or opposite breaker
Why It Works:
Failed support becoming resistance indicates structural change and often leads to continuation moves.
━━━━━━━━━━━━━━━━━━━━━━━━━━━━
📊 How To Use This Indicator
Strategy 1: Breaker Block Retest
Timeframes: 15min, 1H, 4H
Style: [/b> Swing trading, reversal entries
Rules:
1. Identify active breaker block (bright color, not gray)
2. Wait for price to return to the breaker zone
3. Look for reversal confirmation (pin bar, engulfing, rejection)
4. Enter in the direction the breaker suggests
5. Stop: Beyond opposite side of breaker
6. Target: 2-3R or previous structure
Example - Bullish Breaker:
• Bullish breaker at $48,000-$48,500
• Price drops to $48,200 (enters breaker)
• Bullish pin bar forms
• Enter long at $48,600, stop at $47,800
• Target: $50,000+
Strategy 2: Multi-Timeframe Breakers
Timeframes: Combine 1H + 4H or 15min + 1H
Style: [/b> High-probability setups
Rules:
1. Identify breaker on higher timeframe (4H or Daily)
2. Switch to lower timeframe (1H or 15min)
3. Look for lower TF breaker WITHIN higher TF breaker
4. Trade the lower TF breaker in same direction as HTF
5. Stop: Below lower TF breaker
6. Target: Edge of higher TF breaker or beyond
Why It Works: Alignment across timeframes increases probability
Strategy 3: Breaker + Order Block Confluence
Timeframes: 1H, 4H
Style: High-conviction trades
Rules:
1. Find breaker block that overlaps with fresh order block
2. This creates double institutional zone
3. Wait for price to reach confluence area
4. Enter on first touch with confirmation
5. Stop: Beyond confluence zone
6. Target: 3-5R
Why It Works: Two ICT concepts aligned = maximum probability
Strategy 4: Breaker Breakout
Timeframes: [/b> 5min, 15min, 1H
Style: Trend continuation
Rules:
1. Price approaches breaker block
2. Instead of respecting it, price breaks THROUGH
3. This indicates very strong momentum
4. Enter breakout in direction of break
5. Stop: Back inside the breaker
6. Target: 2-3R
Why It Works: When breakers fail, momentum is extremely strong
━━━━━━━━━━━━━━━━━━━━━━━━━━━━
⚙️ Settings Explained
Core Settings
Auto-Adjust for Timeframe (Default: ON)
• Automatically optimizes detection for current chart
• 1min: 3 bars lookback
• 5min: 4 bars lookback
• 15min: 5 bars lookback
• 1H: 6 bars lookback
• 4H+: 8-12 bars lookback
• Recommended: Keep ON
Manual Detection Length (Default: 5)
• Only used when Auto-Adjust is OFF
• Lookback period for finding order blocks
• Lower = more sensitive
• Higher = more selective
Display Settings
Show Bullish/Bearish Breaker Blocks
• Toggle each type independently
• Customize colors (default: cyan and fuchsia)
• Tip: Use colors that stand out from order blocks
Max Breaker Blocks to Display (Default: 10) [/b>
• Limits visible breakers
• Lower (5-8): Cleaner chart
• Higher (15-30): More context
• Recommended: 10-15
Show Breaker Block Labels [/b>
• Displays BB+ and BB- text
• Shows 🎯 on active (nearest) breaker
• Turn OFF for minimal appearance
Extend Blocks (bars) (Default: 50)
• How far to extend boxes to the right
• Recommended: 40-60 bars
Filters
Block Strength Filter (Default: Medium)
• Low: 0.5x ATR - More breakers, more noise
• Medium: 1x ATR - Balanced
• High: 1.5x ATR - Only strongest breakers
• Note: Breakers are naturally less common than OBs
• For learning: Use Low to see more examples
• For trading: Use Medium or High
Min Block Size % (Default: 0.1)
• Minimum breaker size as % of price
• Filters tiny insignificant blocks
• Adjust based on instrument volatility
Advanced
Show Tested Blocks (Default: OFF) [/b>
• When ON: Shows gray boxes for tested breakers
• When OFF: Breakers disappear after test
• Use ON: For learning and analysis
• Use OFF: For clean active trading
Highlight Active Block (Default: ON)
• Highlights nearest breaker to current price
• Active block shown with brighter color and 🎯
• Recommended: Keep ON
━━━━━━━━━━━━━━━━━━━━━━━━━━━━
📱 Info Panel Guide
Bullish BB Count Bearish BB Count
• Number of active (untested) bearish breaker blocks
• More bearish breakers = More resistance zones above
Bias Indicator [/b>
• ⬆ Bullish: More bullish breakers (support > resistance)
• ⬇ Bearish: More bearish breakers (resistance > support)
• ↔ Neutral: Equal breakers on both sides
Near Indicator
• Shows nearest active breaker and distance
• Example: "Bull BB -1.5%" = Bullish breaker 1.5% below price
━━━━━━━━━━━━━━━━━━━━━━━━━━━━
📱 Alert Setup
This indicator includes 2 alert types:
1. Price Entering Bullish Breaker [/b>
• Fires when price touches bullish breaker block
• Action: Watch for bounce/support
2. Price Entering Bearish Breaker
• Fires when price touches bearish breaker block
• Action: Watch for rejection/resistance
To Set Up Alerts:
1. Click "Alert" button (clock icon)
2. Select "Breaker Blocks"
3. Choose alert type
4. Configure notifications
5. Click "Create"
━━━━━━━━━━━━━━━━━━━━━━━━━━━━
💎 Pro Tips & Best Practices
✅ DO:
• Wait for confirmation before entering at breakers
• First touch of breaker has highest reliability
• Use breakers with trend direction for best results
• Combine with order blocks and FVGs for confluence
• Check multiple timeframes for breaker alignment
• Respect breakers - they're stronger than regular S/R
• Use proper stop placement beyond the breaker
⚠️ DON'T:
• Don't trade every breaker - quality over quantity
• Don't ignore breaker breaks - very strong momentum signal
• Don't use tight stops - allow room for wicks
• Don't expect all breakers to hold
• Don't trade against strong momentum through breakers
• Don't confuse breakers with regular order blocks
🎯 Best Timeframes:
• Scalping: 5min, 15min (quick breaker tests)
• Day Trading: 15min, 1H (balanced)
• Swing Trading: 1H, 4H, Daily (major breakers)
🔥 Best Markets:
• Excellent: BTC, ETH, Forex majors, ES, NQ
• Good: Gold, Oil, Major indices
• Note: Breakers need volatility to form
━━━━━━━━━━━━━━━━━━━━━━━━━━━━
🎓 Advanced Concepts
Breaker Strength Hierarchy
From weakest to strongest:
1. Support/Resistance lines
2. Order Blocks (unbroken)
3. Breaker Blocks (broken OBs) ← Often strongest
4. Multiple breakers stacked together
Breaker vs Order Block Priority
If breaker and order block overlap:
• Breaker takes precedence
• Failed levels are more significant
• Price respects breakers more reliably
Nested Breakers [/b>
When lower timeframe breaker exists within higher timeframe breaker:
• Trade lower TF breaker first
• Use higher TF breaker as final target
• Highest probability setups
Multiple Breaker Tests [/b>
• First test: Highest probability
• Second test: Still valid but weaker
• Third test: Likely to break through
Breaker Breakouts [/b>
When price breaks through breaker:
• Extremely strong momentum signal
• Old level completely invalidated
• Trade the breakout aggressively
━━━━━━━━━━━━━━━━━━━━━━━━━━━━
📈 Common Patterns [/b>
Pattern 1: The Perfect Flip
• Bearish OB forms
• Price breaks above it cleanly
• Becomes bullish breaker
• First retest bounces perfectly
• High-probability setup
Pattern 2: The Double Break
• Bullish OB breaks down (becomes bearish breaker)
• Price tests it and rejects
• Later breaks back up through breaker
• Very strong momentum signal
Pattern 3: The Breaker Ladder [/b>
• Multiple breakers stacked like stairs
• Price bounces from one to next
• Each breaker provides support/resistance
Pattern 4: The Failed Breaker
• Breaker forms but gets broken immediately
• Shows extreme momentum
• Don't fight it - trade the breakout
━━━━━━━━━━━━━━━━━━━━━━━━━━━━
🙏 If You Find This Helpful
• ⭐ Leave your feedback
• 💬 Share your experience in the comments
• 🔔 Follow for updates and new tools
Questions about breaker blocks? Feel free to ask in the comments.
━━━━━━━━━━━━━━━━━━━━━━━━━━━━
Version History [/b>
• v1.0 - Initial release with auto-timeframe detection and polarity flip tracking
