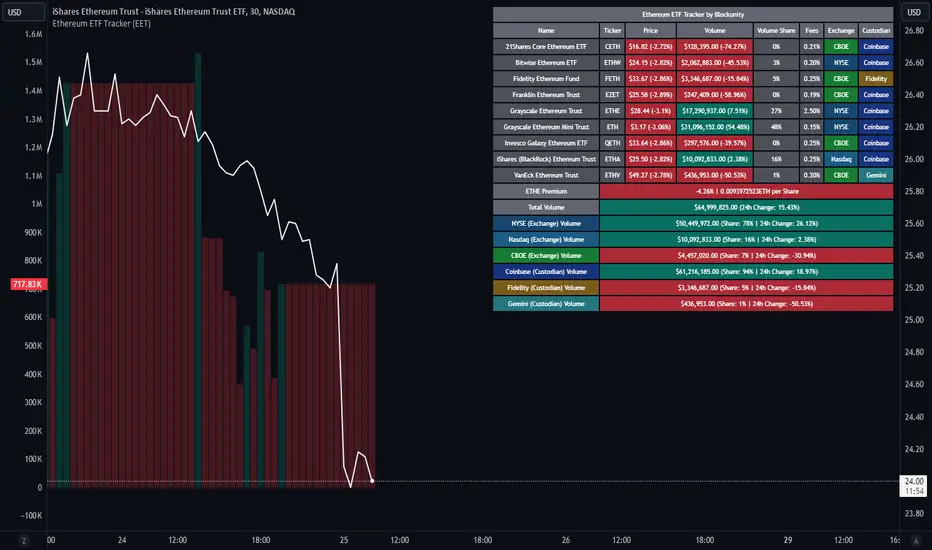
Ethereum ETF Tracker (EET)Get all the information you need about all the different Ethereum ETF.
With the Ethereum ETF Tracker, you can observe all possible Ethereum ETF data:
ETF name.
Ticker.
Price.
Volume.
Share of total ETF volume.
Fees.
Exchange.
Custodian.
At the bottom of the table, you'll find the ETHE Premium (and ETH per Share), and day's total volume.
In addition, you can see the volume for the different Exchanges, as well as for the different Custodians.
If you don't want to display these lines to save space, you can uncheck "Show Additional Data" in the indicator settings.
The Idea
The goal is to provide the community with a tool for tracking all Ethereum ETF data in a synthesized way, directly in your TradingView chart.
How to Use
Simply read the information in the table. You can hover above the Fees and Exchanges cells for more details.
The table takes space on the chart, you can remove the extra lines by unchecking "Show Additional Data" in the indicator settings or reduce text size by changing the "Table Text Size" parameter.
Aggregate volume can be displayed directly on the graph (this volume can be displayed on any asset, such as Ethereum itself). The display can be disabled in the settings.
Wyszukaj w skryptach "文华财经tick价格"
TASC 2024.08 Volume Confirmation For A Trend System█ OVERVIEW
This script demonstrates the use of volume data to validate price movements based on the techniques Buff Pelz Dormeier discusses in his "Volume Confirmation For A Trend System" article from the August 2024 edition of TASC's Traders' Tips . It presents a trend-following system implementation that utilizes a combination of three indicators: the Average Directional Index (ADX), the Trend Thrust Indicator (TTI), and the Volume Price Confirmation Indicator (VPCI).
█ CONCEPTS
In his article, Buff Pelz Dormeier recounts his search for an optimal trend-following strategy enhanced with volume data, starting with a simple system combining the ADX , MACD , and OBV indicators. Even in these early tests, the author observed that the volume confirmation from OBV notably improved trading performance. Subsequently, the author replaced OBV with his VPCI, which considers the proportional weights of volume and price, to enhance the validation of trend momentum. Lastly, the author explored the inclusion of his TTI, a modified MACD that features volume-based enhancements, as a strategy component for improved trend-following performance.
According to the author's research, the ADX+TTI+VPCI system outperformed similar strategies he tested in the article, yielding significantly higher returns and enhanced perceived reliability. Because the system's design revolves around catching pronounced trends, it performs best with a portfolio of individual stocks. The author applies the system in the article by allocating 5% of the equity to long positions in S&P 500 components that meet the ADX+TTI+VPCI entry criteria (see the Calculations section below for details). He uses the proceeds from closing positions to enter new positions in other stocks meeting the screening criteria, holding any excess proceeds in cash.
█ CALCULATIONS
The TTI is similar to the MACD. Its calculation entails the following steps:
Calculate fast (short-term) and slow (long-term) volume-weighted moving averages (VWMAs).
Compute the volume multiple (VM) as the square of the ratio of the fast VWMA to the slow VWMA.
Adjust these averages by multiplying the fast VWMA by the VM and dividing the slow VWMA by the VM.
Calculate the difference between the adjusted VWMAs to determine the TTI value, and take the average of that series to determine the signal line value.
The VPCI utilizes differences and ratios between VWMAs and corresponding simple moving averages (SMAs) to provide an alternative volume-price confirmation tool. Its calculation is as follows:
Subtract the slow SMA from the VWMA of the same length to calculate the volume-price confirmation/contradiction (VPC) value.
Divide the fast VWMA by the corresponding fast SMA to determine the volume-price ratio (VPR).
Divide the short-term VWMA by the long-term VWMA to calculate the VM.
Compute the VPCI as the product of the VPC, VPR, and VM values.
The long entry criteria of the ADX+TTI+VPCI system are as follows:
The ADX is above 30.
The TTI crosses above its signal line.
The VPCI is above 0, confirming the trend.
Signals to close positions occur when the VPCI is below 0, indicating a contradiction .
NOTE: Unlike in the article, this script applies the ADX+TTI+VPCI system to one stock at a time , not a portfolio of S&P 500 constituents.
█ DISCLAIMER
This strategy script educates users on the trading system outlined by the TASC article. By default, it uses 10% of equity as the order size and a slippage amount of 5 ticks. Traders should adjust these settings and the commission amount when using this script.

Equal Highs and Lows {Reh's and Rel's }# Equal Highs and Lows {Reh's and Rel's} Indicator
## Overview
The "Equal Highs and Lows {Reh's and Rel's}" indicator is designed to identify and mark equal highs and lows on a price chart. It detects both exact and relative equal levels, draws lines connecting these levels, and optionally labels them. This tool can help traders identify potential support and resistance zones based on historical price levels.
## Key Features
1. **Exact and Relative Equality**: Detects both precise price matches and relative equality within a specified threshold.
2. **Customizable Appearance**: Allows users to adjust colors, line styles, and widths.
3. **Dynamic Line Management**: Automatically extends or removes lines based on ongoing price action.
4. **Labeling System**: Optional labels to identify types of equal levels (e.g., "Equal High", "REH/Equal High").
5. **Flexible Settings**: Adjustable parameters for lookback periods, maximum bars apart, and relative equality thresholds.
## User Inputs
### Appearance
- `lineColorHigh`: Color for lines marking equal highs (default: red)
- `lineColorLow`: Color for lines marking equal lows (default: green)
- `lineWidth`: Thickness of the lines (range: 1-5, default: 1)
- `lineStyle`: Style of the lines (options: Solid, Dash, Dotted)
- `showLabels`: Toggle to show or hide labels for equal highs and lows
### Settings
- `lookbackLength`: Number of bars to look back for finding equal highs and lows (default: 200)
- `maxBarsApart`: Maximum number of bars apart for equal highs/lows to be considered (range: 2-10, default: 5)
### Relative Equality
- `considerRelativeEquals`: Enable detection of relative equal highs and lows
- `thresholdIndex`: Maximum tick difference for relative equality in index instruments (range: 1-10, default: 2)
- `thresholdStocks`: Maximum tick difference for relative equality in stock instruments (range: 5-200, step: 5, default: 10)
## How It Works
The indicator scans historical price data to identify equal or relatively equal highs and lows. It draws lines connecting these levels and updates them as new price data comes in. Lines are extended if the level holds and removed if the price breaks through. The tool adapts to different market conditions by allowing adjustments to the equality thresholds for various instrument types.
## Practical Use
Traders can use this indicator to:
- Identify potential support and resistance levels
- Spot areas where price might react based on historical turning points
- Enhance their understanding of price structure and repetitive patterns
## Disclaimer
This indicator is provided as a tool to assist in identifying potential price levels of interest. It is not financial advice. Users should not rely solely on this or any single indicator for trading decisions. Always conduct thorough analysis, consider multiple factors, and be aware that past price behavior does not guarantee future results. All trading involves risk.

FVG & IFVG ICT [TradingFinder] Inversion Fair Value Gap Signal🔵 Introduction
🟣 Fair Value Gap (FVG)
To spot a Fair Value Gap (FVG) on a chart, you need to perform a detailed candle-by-candle analysis.
Here’s the process :
Focus on Candles with Large Bodies : Identify a candle with a substantial body and examine it alongside the preceding candle.
Check Surrounding Candles : The candles immediately before and after the central candle should have long shadows.
Ensure No Overlap : The bodies of the candles before and after the central candle should not overlap with the body of the central candle.
Determine the FVG Range : The gap between the shadows of the first and third candles forms the FVG range.
🟣 ICT Inversion Fair Value Gap (IFVG)
An ICT Inversion Fair Value Gap, also known as a reverse FVG, is a failed fair value gap where the price does not respect the gap. An IFVG forms when a fair value gap fails to hold the price and the price moves beyond it, breaking the fair value gap.
This marks the initial shift in price momentum. Typically, when the price moves in one direction, it respects the fair value gaps and continues its trend.
However, if a fair value gap is violated, it acts as an inversion fair value gap, indicating the first change in price momentum, potentially leading to a short-term reversal or a subsequent change in direction.
🟣 Bullish Inversion Fair Value Gap (Bullish IFVG)
🟣 Bearish Inversion Fair Value Gap (Bearish IFVG)
🔵 How to Use
🟣 Identify an Inversion Fair Value Gap
To identify an IFVG, you first need to recognize a fair value gap. Just as fair value gaps come in two types, inversion fair value gaps also fall into two categories:
🟣 Bullish Inversion Fair Value Gap
A bullish IFVG is essentially a bearish fair value gap that is invalidated by the price closing above it.
Here’s how to identify it :
Identify a bearish fair value gap.
When the price closes above this bearish fair value gap, it transforms into a bullish inversion fair value gap.
This gap acts as support for the price and drives it upwards, indicating a reduction in sellers' strength and an initial shift in momentum towards buyers.
🟣 Bearish Inversion Fair Value Gap
A bearish IFVG is primarily a bullish fair value gap that fails to hold the price, with the price closing below it.
Here’s how to identify it :
Identify a bullish fair value gap.
When the price closes below this gap, it becomes a bearish inversion fair value gap.
This gap acts as resistance for the price, pushing it downwards. A bearish inversion fair value gap signifies a decrease in buyers' momentum and an increase in sellers' strength.
🔵 Setting
🟣 Global Setting
Show All FVG : If it is turned off, only the last FVG will be displayed.
S how All Inversion FVG : If it is turned off, only the last FVG will be displayed.
FVG and IFVG Validity Period (Bar) : You can specify the maximum time the FVG and the IFVG remains valid based on the number of candles from the origin.
Switching Colors Theme Mode : Three modes "Off", "Light" and "Dark" are included in this parameter. "Light" mode is for color adjustment for use in "Light Mode".
"Dark" mode is for color adjustment for use in "Dark Mode" and "Off" mode turns off the color adjustment function and the input color to the function is the same as the output color.
🟣 Logic Setting
FVG Filter
When utilizing FVG filtering, the number of identified FVG areas undergoes refinement based on a specified algorithm. This process helps to focus on higher quality signals and eliminate noise.
Here are the types of FVG filters available :
Very Aggressive Filter : Introduces an additional condition to the initial criteria. For an upward FVG, the highest price of the last candle must exceed the highest price of the middle candle. Similarly, for a downward FVG, the lowest price of the last candle should be lower than the lowest price of the middle candle. This mode minimally filters out FVGs.
Aggressive Filter : Builds upon the Very Aggressive mode by considering the size of the middle candle. It ensures the middle candle is not too small, thereby eliminating more FVGs compared to the Very Aggressive mode.
Defensive Filter : In addition to the conditions of the Very Aggressive mode, the Defensive mode incorporates criteria regarding the size and structure of the middle candle. It requires the middle candle to have a substantial body, with specific polarity conditions for the second and third candles relative to the first candle's direction. This mode filters out a significant number of FVGs, focusing on higher-quality signals.
Very Defensive Filter : Further refines filtering by adding conditions that the first and third candles should not be small-bodied doji candles. This stringent mode eliminates the majority of FVGs, retaining only the highest quality signals.
Mitigation Level FVG and IFVG : Its inputs are one of "Proximal", "Distal" or "50 % OB" modes, which you can enter according to your needs. The "50 % OB" line is the middle line between distal and proximal.
🟣 Display Setting
Show Bullish FVG : Enables the display of demand-related boxes, which can be toggled on or off.
Show Bearish FVG : Enables the display of supply-related boxes along the path, which can also be toggled on or off.
Show Bullish IFVG : Enables the display of demand-related boxes, which can be toggled on or off.
Show Bearish IFVG : Enables the display of supply-related boxes along the path, which can also be toggled on or off.
🟣 Alert Setting
Alert FVG Mitigation : If you want to receive the alert about FVG's mitigation after setting the alerts, leave this tick on. Otherwise, turn it off.
Alert Inversion FVG Mitigation : If you want to receive the alert about Inversion FVG's mitigation after setting the alerts, leave this tick on. Otherwise, turn it off.
Message Frequency : This parameter, represented as a string, determines the frequency of announcements. Options include: 'All' (triggers the alert every time the function is called), 'Once Per Bar' (triggers the alert only on the first call within the bar), and 'Once Per Bar Close' (activates the alert only during the final script execution of the real-time bar upon closure). The default setting is 'Once per Bar'.
Show Alert time by Time Zone : The date, hour, and minute displayed in alert messages can be configured to reflect any chosen time zone. For instance, if you prefer London time, you should input 'UTC+1'. By default, this input is configured to the 'UTC' time zone.
Display More Info : The 'Display More Info' option provides details regarding the price range of the order blocks (Zone Price), along with the date, hour, and minute. If you prefer not to include this information in the alert message, you should set it to 'Off'.

Groupings [SS]Hey everyone,
Releasing this indicator called groupings.
If you watch/read my analyses on Tradingview, you will have heard me talk about groups. Groups is something I invented. What it is, is just taking the Euclidean Distance (ED) of the previous 5 candles in a specified period (i.e. daily timeframe, weekly, 1 minute, 5 minute, etc.) and rounding the ED up to a whole number.
I have had great success in this approach because the information provided is broad enough to give leniency in interpretation but narrow enough to hone in on potential moves and target prices.
This indicator is a simplified version of how I do groupings in other software, however it is no less powerful!
What do groups tell us?
A "group" takes into account the previous 5 candles, using the ED. This gives Pinescript a general idea of what the short term trend looks like mathematically. From there, Pinescript can look for other groups that looked similar to how this current trend looks. From there, it can offer us insights into what tends to happen in candles subsequent to this group. For example, the ATR range, the close range and whether it is bearish or bullish.
And that is precisely how this indicator operates, Pinescript will calculate the group of the previous 5 canndles in the timeframe period you are looking at. It will then lookback over the designated "train" length and identify previous groups, and what happened in those groups. It looks specifically at:
- What is that average High ATR associated with that group,
- What is the average Low ATR associated with that group,
- What is the average close range associated with that group,
- What is the sentiment associated with that group.
How to use the indicator?
In terms of use, the indicator is relatively simple to use. It will plot three lines, a red for the anticipated low range, a green for the anticipated high range and purple for the opening range (where the current candle opened at).
In addition, it will plot a dot for the anticipated close area. When the dot is green, it expects a bullish close. When the dot is red, it expects a bearish close.
The indicator is going to give you a heads up as to whether we are in a bullish group, what you can anticipate the high and low range to be and where you can anticipate the close.
Of course, its not always exact, as in the image above you can see it underestimated the high range and over-estimated the low range; however, we did close within the anticipate range.
The indicator is meant to help you with your bias. I will reference this indicator on the daily timeframe at open to see what the expectations are for the day.
However, you can use it on any timeframe you wish.
Other functions:
The indicator can plot the EMA 9, 21 and 5. These are the 3 indicators I like and I find them helpful for both intraday and swing trading. However, they can be toggled off if you do not wish to view them.
In addition, the EMAs will be green if the ticker is trending above the EMA 21 (which is a critical EMA for me to determine the immediate sentiment). If the ticker is below, they will turn red.
There is also the ability to adjust the train time. The default is 1,000 candles back, but I usually have it on 1500. If you have a lot of indicators and a lot going on, on your chart, you may find that 1500 is too much and it will lag/error. That’s okay, 500 candles is sufficient and will not put a lot of stress on Pinescript.
Concluding remarks
Its overall a fairly simple concept and indicator, but it has been a neat and helpful / insightful invention. I originally developed this using R and happy to have now brought it into Pinescript.
I hope you enjoy!
Safe trades everyone!

Fractal Breakout Trend Following StrategyOverview
The Fractal Breakout Trend Following Strategy is a trend-following system which utilizes the Willams Fractals and Alligator to execute the long trades on the fractal's breakouts which have a high probability to be the new uptrend phase beginning. This system also uses the normalized Average True Range indicator to filter trades after a large moves, because it's more likely to see the trend continuation after a consolidation period. Strategy can execute only long trades.
Unique Features
Trend and volatility filtering system: Strategy uses Williams Alligator to filter the counter-trend fractals breakouts and normalized Average True Range to avoid the trades after large moves, when volatility is high
Configurable Trading Periods: Users can tailor the strategy to specific market windows, adapting to different market conditions.
Flexible Risk Management: Users can choose the stop-loss percent (by default = 3%) for trades, but strategy also has the dynamic stop-loss level using down fractals.
Methodology
The strategy places stop order at the last valid fractal breakout level. Validity of this fractal is defined by the Williams Alligator indicator. If at the moment of time when price breaking the last fractal price is higher than Alligator's teeth line (8 period SMA shifted 5 bars in the future) this is a valid breakout. Moreover strategy has the additional volatility filtering system using normalized ATR. It calculates the average normalized ATR for last user-defined number of bars and if this value lower than the user-defined threshold value the long trade is executed.
When trade is opened, script places the stop loss at the price higher of two levels: user defined stop-loss from the position entry price or down fractal validation level. The down fractal is valid with the rule, opposite as the up fractal validation. Price shall break to the downside the last down fractal below the Willians Alligator's teeth line.
Strategy has no fixed take profit. Exit level changes with the down fractal validation level. If price is in strong uptrend trade is going to be active until last down fractal is not valid. Strategy closes trade when price hits the down fractal validation level.
Risk Management
The strategy employs a combined approach to risk management:
It allows positions to ride the trend as long as the price continues to move favorably, aiming to capture significant price movements. It features a user-defined stop-loss parameter to mitigate risks based on individual risk tolerance. By default, this stop-loss is set to a 3% drop from the entry point, but it can be adjusted according to the trader's preferences.
Justification of Methodology
This strategy leverages Williams Fractals to open long trade when price has broken the key resistance level to the upside. This resistance level is the last up fractal and is shall be broken above the Williams Alligator's teeth line to be qualified as the valid breakout according to this strategy. The Alligator filtering increases the probability to avoid the false breakouts against the current trend.
Moreover strategy has an additional filter using Average True Range(ATR) indicator. If average value of ATR for the last user-defined number of bars is lower than user-defined threshold strategy can open the long trade according to open trade condition above. The logic here is following: we want to open trades after period of price consolidation inside the range because before and after a big move price is more likely to be in sideways, but we need a trend move to have a profit.
Another one important feature is how the exit condition is defined. On the one hand, strategy has the user-defined stop-loss (3% below the entry price by default). It's made to give users the opportunity to restrict their losses according to their risk-tolerance. On the other hand, strategy utilizes the dynamic exit level which is defined by down fractal activation. If we assume the breaking up fractal is the beginning of the uptrend, breaking down fractal can be the start of downtrend phase. We don't want to be in long trade if there is a high probability of reversal to the downside. This approach helps to not keep open trade if trend is not developing and hold it if price continues going up.
Backtest Results
Operating window: Date range of backtests is 2023.01.01 - 2024.05.01. It is chosen to let the strategy to close all opened positions.
Commission and Slippage: Includes a standard Binance commission of 0.1% and accounts for possible slippage over 5 ticks.
Initial capital: 10000 USDT
Percent of capital used in every trade: 30%
Maximum Single Position Loss: -3.19%
Maximum Single Profit: +24.97%
Net Profit: +3036.90 USDT (+30.37%)
Total Trades: 83 (28.92% win rate)
Profit Factor: 1.953
Maximum Accumulated Loss: 963.98 USDT (-8.29%)
Average Profit per Trade: 36.59 USDT (+1.12%)
Average Trade Duration: 72 hours
These results are obtained with realistic parameters representing trading conditions observed at major exchanges such as Binance and with realistic trading portfolio usage parameters.
How to Use
Add the script to favorites for easy access.
Apply to the desired timeframe and chart (optimal performance observed on 4h and higher time frames and the BTC/USDT).
Configure settings using the dropdown choice list in the built-in menu.
Set up alerts to automate strategy positions through web hook with the text: {{strategy.order.alert_message}}
Disclaimer:
Educational and informational tool reflecting Skyrex commitment to informed trading. Past performance does not guarantee future results. Test strategies in a simulated environment before live implementation

Propulsion Blocks | Flux Charts💎 GENERAL OVERVIEW
Introducing our new Propulsion Blocks indicator! This new indicator can find & render ICT's propulsion blocks in the current ticker. It's highly customizable with detection, invalidation and style settings. For more information, please visit the "HOW DOES IT WORK ?" section.
Features of the new Propulsion Blocks indicator :
Render Bullish & Bearish Propulsion Blocks
Customizable Algorithm
Enable / Disable Historic Zones
Visual Customizability
📌 HOW DOES IT WORK ?
Order blocks occur when there is a high amount of market orders exist on a price range. It is possible to find order blocks using specific formations on the chart. One of which this indicator uses requires a large engulfing candlestick right after another one of the opposite direction. Then if the price comes back to retest the area that two candlesticks create, then it's an order block pattern.
Propulsion blocks are a specific type of order block used in the trading methodology. They build on the concept of order blocks and aim to identify potential areas for strong price movements. They are detected when a candlestick wicks to any existing order block, retesting it. Then a strong momentum in the direction of the order block is needed for the propulsion block to get created. Check this example :
You can use them as entry / exit points, or for confirmations for your trades. For example, a successful retest attempt to a bullish propulsion block might hint a strong bullish momentum. This indicator works best when used together with other ICT concepts.
🚩UNIQUENESS
Propulsion blocks can help traders identify key levels in a chart, and can be used mainly for confirmation. This indicator can identify and show them automatically in your chart, and provides customization settings for order & propulsion block detection and invalidation. Another capability of the indicator is that it combines overlapping order & propulsion blocks so you will have a clean look at the chart without any overlapping zones.
⚙️SETTINGS
1. General Configuration
Show Historic Zones -> This setting will hide invalidated propulsion blocks if enabled.
Max Distance To Last Bar -> This setting defines the maximum range that the indicator will find propulsion blocks to the past. Higher options will make older zones visible.
Zone Invalidation -> Select between Wick & Close price for Order Block & Propulsion Block Invalidation.
Swing Length -> Swing length is used when finding order block formations. Smaller values will result in finding smaller order blocks.

Watermark Indicator Overview
The Custom Watermark Indicator is a versatile Pine Script tool designed to enhance your TradingView charts with personalized text elements. This indicator allows users to add custom quotes and symbol information directly onto their charts, providing a unique way to display motivational messages, trading information, or any other text-based content.
Features
Customizable Quote Display:
Text Content: Users can input any desired text to be displayed as a quote on the chart.
Positioning: The quote can be positioned at various locations on the chart (top, middle, bottom; left, center, right).
Styling: Options to customize the text color, background color, and size. Borders around the text can also be toggled on or off.
Symbol Information Display:
Text Content: Users can input additional text to accompany the symbol information.
Symbol Details: Options to display the ticker symbol, the timeframe, and the date.
Positioning: Similar to the quote, the symbol information can be positioned at various locations on the chart.
Styling: Customizable text color, background color, and size, with optional borders.
How to Use
Adding the Indicator:
Add the indicator to your TradingView chart by selecting it from the indicators list or by pasting the script into the Pine Editor and adding it to the chart.
Configuring the Quote:
Show Quote: Toggle the visibility of the quote.
Quote Text: Enter your desired quote in the provided text area.
Positioning: Choose the vertical and horizontal positions for the quote.
Styling: Adjust the text color, background color, and size. Optionally, hide the border around the text.
Configuring the Symbol Information:
Show Symbol Info: Toggle the visibility of the symbol information.
Additional Text: Enter any additional text you want to display with the symbol information.
Details to Display: Select which details to show (ticker symbol, timeframe, date).
Positioning: Choose the vertical and horizontal positions for the symbol information.
Styling: Adjust the text color, background color, and size. Optionally, hide the border around the text.
Practical Applications
Motivational Quotes: Keep yourself motivated by displaying your favorite trading quotes or personal affirmations.
Trading Information: Display important trading details such as the symbol, timeframe, and date in a prominent location on your chart.
Customization: Personalize your chart workspace to make it more engaging and tailored to your preferences.
Conclusion
The Custom Watermark Indicator is a powerful tool for traders looking to add a personal touch to their TradingView charts. With its flexible configuration options and easy-to-use interface, it allows for a high degree of customization to meet the unique needs of each trader. Whether for motivation, information, or aesthetics, this indicator enhances the charting experience by integrating valuable textual elements seamlessly.

Momentum Alligator 4h Bitcoin StrategyOverview
The Momentum Alligator 4h Bitcoin Strategy is a trend-following trading system that operates on dual time frames. It utilizes the 1D Williams Alligator indicator to identify the prevailing major price trend and seeks trading opportunities on the 4-hour (4h) time frame when the momentum is turning up. The strategy is designed to close trades if the trend fails to develop or holding position if price continues increasing without any significant correction. Note that this strategy is specifically tailored for the 4-hour time frame.
Unique Features
2-layers market noise filtering system: Trades are only initiated in the direction of the 1D trend, determined by the Williams Alligator indicator. This higher time frame confirmation filters out minor trade signals, focusing on more substantial opportunities. At the same time, strategy has additional filter on 4h time frame with Awesome Oscillator which is showing the current price momentum.
Flexible Risk Management: The strategy exclusively opens long positions, resulting in fewer trades during bear markets. It incorporates a dynamic stop-loss mechanism, which can either follow the jaw line of the 4h Alligator or a user-defined fixed stop-loss. This flexibility helps manage risk and avoid non-trending markets.
Methodology
The strategy initiates a long position when the d-line of Stochastic RSI crosses up it's k-line. It means that there is a high probability that price momentum reversed from down to up. To avoid overtrading in potentially choppy markets, it skips the next two trades following a winning trade, anticipating sideways movement after a significant price surge.
This strategy has two layers trades filtering system: 4h and 1D time frames. The first one is awesome oscillator. It shall be increasing and value has to be higher than it's 5-period SMA. This is an additional confirmation that long trade is opened in the direction of the current momentum. As it was mentioned above, all entry signals are validated against the 1D Williams Alligator indicator. A trade is only opened if the price is above all three lines of the 1D Alligator, ensuring alignment with the major trend.
A trade is closed if the price hits the 4h jaw line of the Alligator or reaches the user-defined stop-loss level.
Risk Management
The strategy employs a combined approach to risk management:
It allows positions to ride the trend as long as the price continues to move favorably, aiming to capture significant price movements. It features a user-defined stop-loss parameter to mitigate risks based on individual risk tolerance. By default, this stop-loss is set to a 2% drop from the entry point, but it can be adjusted according to the trader's preferences.
Justification of Methodology
This strategy leverages Stochastic RSI on 4h time frame to open long trade when momentum started reversing to the upside. On the one hand, Stochastic RSI is one of the most sensitive indicator, which allows to react fast on the potential trend reversal. On the other hand, this indicator can be too sensitive and provide a lot of false trend changing signals. To eliminate this weakness we use two-layers trades filtering system.
The first layer is the 4h Awesome oscillator. This is less sensitive momentum indicator. Usually it starts increasing when price has already passed significant distance from the actual reversal point. The strategy opens long trade only is Awesome oscillator is increasing and above it's 5-period SMA. This approach increases the probability to filter the false signals during the choppy market or if the reversal is false.
The second layer filter is the Williams Alligator indicator on 1D time frame. The 1D Alligator serves as a filter for identifying the primary trend and increases probability to avoid the trades with low potential because trading against major trend usually is more risky. It's much better to catch the trend continuation than local bounce.
Last but not least feature of this strategy is close trades condition. It uses the flexible approach. First of all, user can set up the fixed stop-loss according to his own risk-tolerance, by default this value is 2% of price movement. It restricts the potential loss at the moment when trade has just been opened. Moreover strategy utilizes the 4h Williams Alligator's jaw line to exit the trade. If price fell below it trade is closed. This approach helps to not keep open trade if trend is not developing and hold it if price continues going up.
Backtest Results:
Operating window: Date range of backtests is 2021.01.01 - 2024.05.01. It is chosen to let the strategy to close all opened positions.
Commission and Slippage: Includes a standard Binance commission of 0.1% and accounts for possible slippage over 5 ticks.
Initial capital: 10000 USDT
Percent of capital used in every trade: 50%
Maximum Single Position Loss: -3.04%
Maximum Single Profit: +29.67%
Net Profit: +6228.01 USDT (+62.28%)
Total Trades: 118 (24.58% win rate)
Profit Factor: 1.71
Maximum Accumulated Loss: 1527.69 USDT (-11.52%)
Average Profit per Trade: 52.78 USDT (+0.89%)
Average Trade Duration: 60 hours
These results are obtained with realistic parameters representing trading conditions observed at major exchanges such as Binance and with realistic trading portfolio usage parameters.
How to Use:
Add the script to favorites for easy access.
Apply to the 4h timeframe desired chart (optimal performance observed on the BTC/USDT).
Configure settings using the dropdown choice list in the built-in menu.
Set up alerts to automate strategy positions through web hook with the text: {{strategy.order.alert_message}}
Disclaimer:
Educational and informational tool reflecting Skyrex commitment to informed trading. Past performance does not guarantee future results. Test strategies in a simulated environment before live implementation

TASC 2024.06 REIT ETF Trading System█ OVERVIEW
This strategy script demonstrates the application of the Real Estate Investment Trust (REIT) ETF trading system presented in the article by Markos Katsanos titled "Is The Price REIT?" from TASC's June 2024 edition of Traders' Tips .
█ CONCEPTS
REIT stocks and ETFs offer a simplified, diversified approach to real estate investment. They exhibit sensitivity to interest rates, often moving inversely to interest rate and treasury yield changes. Markos Katsanos explores this relationship and the correlation of prices with the broader market to develop a trading strategy for REIT ETFs.
The script employs Bollinger Bands and Donchian channel indicators to identify oversold conditions and trends in REIT ETFs. It incorporates the 10-year treasury yield index (TNX) as a proxy for interest rates and the S&P 500 ETF (SPY) as a benchmark for the overall market. The system filters trade entries based on their behavior and correlation with the REIT ETF price.
█ CALCULATIONS
The strategy initiates long entries (buy signals) under two conditions:
1. Oversold condition
The weekly ETF low price dips below the 15-week Bollinger Band bottom, the closing price is above the value by at least 0.2 * ATR ( Average True Range ), and the price exceeds the week's median.
Either of the following:
– The TNX index is down over 15% from its 25-week high, and its correlation with the ETF price is less than 0.3.
– The yield is below 2%.
2. Uptrend
The weekly ETF price crosses above the previous week's 30-week Donchian channel high.
The SPY ETF is above its 20-week moving average.
Either of the following:
– Over ten weeks have passed since the TNX index was at its 30-week high.
– The correlation between the TNX value and the ETF price exceeds 0.3.
– The yield is below 2%.
The strategy also includes three exit (sell) rules:
1. Trailing (Chandelier) stop
The weekly close drops below the highest close over the last five weeks by over 1.5 * ATR.
The TNX value rises over the latest 25 weeks, with a yield exceeding 4%, or its value surges over 15% above the 25-week low.
2. Stop-loss
The ETF's price declines by at least 8% of the previous week's close and falls below the 30-week moving average.
The SPY price is down by at least 8%, or its correlation with the ETF's price is negative.
3. Overbought condition
The ETF's value rises above the 100-week low by over 50%.
The ETF's price falls over 1.5 * ATR below the 3-week high.
The ETF's 10-week Stochastic indicator exceeds 90 within the last three weeks.
█ DISCLAIMER
This strategy script educates users on the system outlined by the TASC article. However, note that its default properties might not fully represent real-world trading conditions for an individual. By default, it uses 10% of equity as the order size and a slippage amount of 5 ticks. Traders should adjust these settings and the commission amount when using this script. Additionally, since this strategy utilizes compound conditions on weekly data to trigger orders, it will generate significantly fewer trades than other, higher-frequency strategies.

[BT] NedDavis Series: CPI Minus 5-Year Moving Average🟧 GENERAL
The script works on the Monthly Timeframe and has 2 main settings (explained in FEATURES ). It uses the US CPI data, reported by the Bureau of Labour Statistics.
🔹Functionality 1: The main idea is to plot the distance between the CPI line and the 5 year moving average of the CPI line. This technique in mathematics is called "deviation from the moving average". This technique is used to analyse how has CPI previously acted and can give clues at what it might do in the future. Economic historians use such analysis, together with specific period analysis to predict potential risks in the future (see an example of such analysis in HOW TO USE section. The mathematical technique is a simple subtraction between 2 points (CPI - 5yr SMA of CPI).
▶︎Interpretation for deviation from a moving average:
Positive Deviation: When the line is above its moving average, it indicates that the current value is higher than the average, suggesting potential strength or bullish sentiment.
Negative Deviation: Conversely, when the line falls below its moving average, it suggests weakness or bearish sentiment as the current value is lower than the average.
▶︎Applications:
Trend Identification: Deviations from moving averages can help identify trends, with sustained deviations indicating strong trends.
Reversal Signals: Significant deviations from moving averages may signal potential trend reversals, especially when combined with other technical indicators.
Volatility Measurement: Monitoring the magnitude of deviations can provide insights into market volatility and price movements.
Remember the indicator is applying this only for the US CPI - not the ticker you apply the indicator on!
🔹Functionality 2: It plots on a new pane below information about the Consumer Price Index. You can also find the information by plotting the ticker symbol USACPIALLMINMEI on TradingView, which is a Monthly economic data by the OECD for the CPI in the US. The only addition you would get from the indicator is the plot of the 5 year Simple Moving Average.
🔹What is the US Consumer Price Index?
Measures the change in the price of goods and services purchased by consumers;
Traders care about the CPI because consumer prices account for a majority of overall inflation. Inflation is important to currency valuation because rising prices lead the central bank to raise interest rates out of respect for their inflation containment mandate;
It is measured as the average price of various goods and services are sampled and then compared to the previous sampling.
Source: Bureau of Labor Statistics;
FEATURES OF INDICATOR
1) The US Consumer Price Index Minus the Five Year Moving Average of the same.
As shown on the picture above and explained in previous section. Here a more detailed view.
2) The actual US Consumer Price Index (Annual Rate of change) and the Five year average of the US Consumer Price Index. Explained above and shown below:
To activate 2) go into settings and toggle the check box.
HOW TO USE
It can be used for a fundamental analysis on the relationship between the stock market, the economy and the Feds decisions to hike or cut rates, whose main mandate is to control inflation over time.
I have created this indicator to show my analysis in this idea:
What does a First Fed Rate cut really mean?
CREDITS
I have seen such idea in the past posted by the institutional grade research of NedDavis and have recreated it for the TradingView platform, open-source for the community.

utilsLibrary "utils"
Provides a set of utility functions for use in strategies or indicators.
colorGreen(opacity)
Parameters:
opacity (int)
colorRed(opacity)
Parameters:
opacity (int)
colorTeal(opacity)
Parameters:
opacity (int)
colorBlue(opacity)
Parameters:
opacity (int)
colorOrange(opacity)
Parameters:
opacity (int)
colorPurple(opacity)
Parameters:
opacity (int)
colorPink(opacity)
Parameters:
opacity (int)
colorYellow(opacity)
Parameters:
opacity (int)
colorWhite(opacity)
Parameters:
opacity (int)
colorBlack(opacity)
Parameters:
opacity (int)
trendChangingUp(emaShort, emaLong)
Signals when the trend is starting to change in a positive direction.
Parameters:
emaShort (float)
emaLong (float)
Returns: bool
trendChangingDown(emaShort, emaLong)
Signals when the trend is starting to change in a negative direction.
Parameters:
emaShort (float)
emaLong (float)
Returns: bool
percentChange(start, end)
Returns the percent change between a start number and end number. A positive change returns a positive value and vice versa.
Parameters:
start (float)
end (float)
Returns: float
percentOf(percent, n)
Returns the number that's the percentage of the provided value.
Parameters:
percent (float) : Use 0.2 for 20 percent, 0.35 for 35 percent, etc.
n (float) : The number to calculate the percentage of.
Returns: float
targetPriceByPercent(percent, n)
Parameters:
percent (float)
n (float)
hasNegativeSlope(start, end)
Parameters:
start (float)
end (float)
timeinrange(resolution, session, timezone)
Returns true when the current time is within a given session window. Note, the time is calculated in the "America/New_York" timezone.
Parameters:
resolution (simple string) : The time interval to use to start/end the background color. Use "1" for the coloring the background up to the minute.
session (simple string) : The session string to use to identify the time window. Example: "0930-1600:23456" means normal market hours on weekdays.
timezone (simple string)
Returns: series bool
barsSinceLastEntry()
Returns the number of bars since the last entry order.
Returns: series int
barsSinceLastExit()
Returns the number of bars since the last exit order.
Returns: series int
calcSlope(ln, lookback)
Calculates the slope of the provided line based on its x,y coordinates in the previous bar to the current bar.
Parameters:
ln (float)
lookback (int)
Returns: series float
openPL()
Returns slope of the line given the start and end x,y coordinates.
Returns: series float
hasConsecutiveNegativeCandles(lookbackInput)
Returns true if the number of consecutive red candles matches the provided count.
Parameters:
lookbackInput (int) : The amount of bars to look back to check for consecutive negative bars. Default = 1.
Returns: series bool
stdevPercent(stdev, price)
Returns the standard deviation as a percentage of price.
Parameters:
stdev (float) : The standard deviation value
price (float) : The current price of the target ticker.
Returns: series float
RSI and ATR Trend Reversal SL/TPQuick History:
I was frustrated with a standard fixed percent TP/SL as they often were not receptive to quick market rallies/reversals. I developed this TP/SL and eventually made it into a full fledge strategy and found it did well enough to publish. This strategy can be used as a standalone or tacked onto another strategy as a TP/SL. It does function as both with a single line. This strategy has been tested with TSLA , AAPL, NVDA, on the 15 minutes timeframe.
HOW IT WORKS:
Inputs:
Length: Simple enough, it determines the length of the RSI and ATR used.
Multiplier: This multiplies the RSI and ATR calculation, more on this later.
Delay to prevent Idealization: TradingView will use the open of the bar the strategy triggers on when calculating the backtest. This can produce unrealistic results depending on the source. If your source is open, set to 0, if anything else, set to 1.
Minimum Difference: This is essentially a traditional SL/TP, it is borderline unnecessary, but if the other parameters are wacky this can be used to ensure the SL/TP. It multiplies the source by the percent, so if it is set to 10, the SL/TP is initialized at src +- 10%.
Source input: Self Explanatory, be sure to update the Delay if you use open.
CALCULATION:
Parameters Initialization:
The strategy uses Heikinashi values for calculations, this is not toggleable in parameters, but can be easily changed by changing hclose to equal src.
FUNCTION INITIALIZATION:
highest_custom and lowest_custom do the same thing as ta.highest and ta.lowest, however the built in ta library does not allow for var int input, so I had to create my own functions to be used here. I actually developed these years ago and have used them in almost every strategy since. Feel especially free to use these in your own scripts.
The rsilev is where the magic happens.
SL/TP min/max are initially calculated to be used later.
Then we begin by establishing variables.
BullGuy is used to determine the length since the last crossup or crossdown, until one happens, it returns na, breaking the function. BearGuy is used in all the calculations, and is the same as BullGuy, unless BullGuy is na, where BearGuy counts up from 1 on each bar from 0.
We create our rsi and have to modify the second one to suit the function. In the case of the upper band, we mirror the lower one. So if the RSI is 80, we want it to be 20 on the upper band.
the upper band and lower band are calculated the exact same way, but mirrored. For the purpose of writing, I'm going to talk about the lower band. Assume everything is mirrored for the upper one. It finds the highest source since the last crossup or crossdown. It then multiplies from 1 / the RSI, this means that a rapid RSI increase will increase the band dramatically, so it is able to capture quick rally/reversals. We add this to the atr to source ratio, as the general volatility is a massive factor to be included. We then multiply this number by our chosen amount, and subtract it from the highest source, creating the band.
We do this same process but mirrored with both bands and compared it to the source. If the source is above the lower band, it suggests an uptrend, so the lower band is outputted, and vice versa for the upper one.
PLOTTING:
We also determine the line color in the same manner as we do the trend direction.
STRATEGY:
We then use the source again, and if it crosses up or down relative to the selected band, we enter a long or short respectively.
This may not be the most superb independent strategy, but it can be very useful as a TP/SL for your chosen entry conditions, especially in volatile markets or tickers.
Thank you for taking the time to read, and please enjoy.

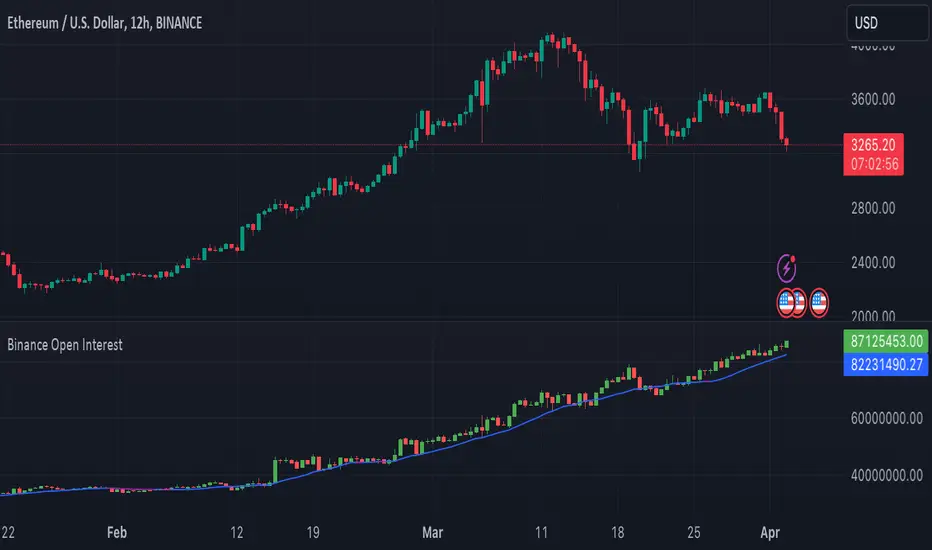
Binance Open Interest (+SMA)# Binance Open Interest + SMA
An indicator showing open interest (OI) in US dollars ($) for Binance USD-margined perpetual contracts. This means the indicator shows the total value of all open perpetual contracts on the Binance platform for the ticker being charted. As such, it can provide insights into market activity for an asset and trading interest, as rising open interest suggests many traders are opening new positions and new money is flowing into the market, and vice-versa. It is also an indicator of the liquidity of the asset's perpetuals contracts, as it reflects the amount of money in a given perpetuals market.
The candle data is shown as expected, with green candles indicating the IU at close is greater than at open, red indicating a lower OI at close than open, with the bodies indicating the open and close prices, and any wicks representing an OI value within that timeframe that went above or below the closing or opening OI.
Unlike other Binance open interest indicators on the platform, this one does not require user input and will automatically pull open interest data for the ticker being looked at, allowing for quicker access to open interest data. It also presents the open interest data in candle format, providing more detail into the open interest at a given timeframe.
Please note that this indicator will only work for assets which Binance offers USD-margined perpetual contracts for, and otherwise will not work.
## Instructions:
Simply add the indicator to your chart and open the asset you would like to chart. If a Binance perpetual contract exists for the asset, the open interest value will be charted. If no chart is generated, no Binance open interest data is available for charting.
To remove the SMA, uncheck the “SMA” box in the style section in the indicator settings. You can also change the source and length of time the SMA data is calculated from in the inputs section. By default, it is based off of the closing value and a length of 15 timeframes.
## Chart example:
The chart shows the price of Ethereum, and below it this indicator for open interest on Binance for their Ethereum perpetual contracts. We can see here open interest is rising steadily, indicating rising interest in holding perpetual contracts backed by Ethereum.
Higher-timeframe requests█ OVERVIEW
This publication focuses on enhancing awareness of the best practices for accessing higher-timeframe (HTF) data via the request.security() function. Some "traditional" approaches, such as what we explored in our previous `security()` revisited publication, have shown limitations in their ability to retrieve non-repainting HTF data. The fundamental technique outlined in this script is currently the most effective in preventing repainting when requesting data from a higher timeframe. For detailed information about why it works, see this section in the Pine Script™ User Manual .
█ CONCEPTS
Understanding repainting
Repainting is a behavior that occurs when a script's calculations or outputs behave differently after restarting it. There are several types of repainting behavior, not all of which are inherently useless or misleading. The most prevalent form of repainting occurs when a script's calculations or outputs exhibit different behaviors on historical and realtime bars.
When a script calculates across historical data, it only needs to execute once per bar, as those values are confirmed and not subject to change. After each historical execution, the script commits the states of its calculations for later access.
On a realtime, unconfirmed bar, values are fluid . They are subject to change on each new tick from the data provider until the bar closes. A script's code can execute on each tick in a realtime bar, meaning its calculations and outputs are subject to realtime fluctuations, just like the underlying data it uses. Each time a script executes on an unconfirmed bar, it first reverts applicable values to their last committed states, a process referred to as rollback . It only commits the new values from a realtime bar after the bar closes. See the User Manual's Execution model page to learn more.
In essence, a script can repaint when it calculates on realtime bars due to fluctuations before a bar's confirmation, which it cannot reproduce on historical data. A common strategy to avoid repainting when necessary involves forcing only confirmed values on realtime bars, which remain unchanged until each bar's conclusion.
Repainting in higher-timeframe (HTF) requests
When working with a script that retrieves data from higher timeframes with request.security() , it's crucial to understand the differences in how such requests behave on historical and realtime bars .
The request.security() function executes all code required by its `expression` argument using data from the specified context (symbol, timeframe, or modifiers) rather than on the chart's data. As when executing code in the chart's context, request.security() only returns new historical values when a bar closes in the requested context. However, the values it returns on realtime HTF bars can also update before confirmation, akin to the rollback and recalculation process that scripts perform in the chart's context on the open bar. Similar to how scripts operate in the chart's context, request.security() only confirms new values after a realtime bar closes in its specified context.
Once a script's execution cycle restarts, what were previously realtime bars become historical bars, meaning the request.security() call will only return confirmed values from the HTF on those bars. Therefore, if the requested data fluctuates across an open HTF bar, the script will repaint those values after it restarts.
This behavior is not a bug; it's simply the default behavior of request.security() . In some cases, having the latest information from an unconfirmed HTF bar is precisely what a script needs. However, in many other cases, traders will require confirmed, stable values that do not fluctuate across an open HTF bar. Below, we explain the most reliable approach to achieve such a result.
Achieving consistent timing on all bars
One can retrieve non-fluctuating values with consistent timing across historical and realtime feeds by exclusively using request.security() to fetch the data from confirmed HTF bars. The best way to achieve this result is offsetting the `expression` argument by at least one bar (e.g., `close [1 ]`) and using barmerge.lookahead_on as the `lookahead` argument.
We discourage the use of barmerge.lookahead_on alone since it prompts the function to look toward future values of HTF bars across historical data, which is heavily misleading. However, when paired with a requested `expression` that includes a one-bar historical offset, the "future" data the function retrieves is not from the future. Instead, it represents the last confirmed bar's values at the start of each HTF bar, thus preventing the results on realtime bars from fluctuating before confirmation from the timeframe.
For example, this line of code uses a request.security() call with barmerge.lookahead_on to request the close price from the "1D" timeframe, offset by one bar with the history-referencing operator [ ] . This line will return the daily price with consistent timing across all bars:
float htfClose = request.security(syminfo.tickerid, "1D", close , lookahead = barmerge.lookahead_on)
Note that:
• This technique only works as intended for higher-timeframe requests .
• When designing a script to work specifically with HTFs, we recommend including conditions to prevent request.security() from accessing timeframes equal to or lower than the chart's timeframe, especially if you intend to publish it. In this script, we included an if structure that raises a runtime error when the requested timeframe is too small.
• A necessary trade-off with this approach is that the script must wait for an HTF bar's confirmation to retrieve new data on realtime bars, thus delaying its availability until the open of the subsequent HTF bar. The time elapsed during such a delay varies with each market, but it's typically relatively small.
👉 Failing to offset the function's `expression` argument while using barmerge.lookahead_on will produce historical results with lookahead bias , as it will look to the future states of historical HTF bars, retrieving values before the times at which they're available in the feed. See the `lookahead` and Future leak with `request.security()` sections in the Pine Script™ User Manual for more information.
Evolving practices
The fundamental technique outlined in this publication is currently the only reliable approach to requesting non-repainting HTF data with request.security() . It is the superior approach because it avoids the pitfalls of other methods, such as the one introduced in the `security()` revisited publication. That publication proposed using a custom `f_security()` function, which applied offsets to the `expression` and the requested result based on historical and realtime bar states. At that time, we explored techniques that didn't carry the risk of lookahead bias if misused (i.e., removing the historical offset on the `expression` while using lookahead), as requests that look ahead to the future on historical bars exhibit dangerously misleading behavior.
Despite these efforts, we've unfortunately found that the bar state method employed by `f_security()` can produce inaccurate results with inconsistent timing in some scenarios, undermining its credibility as a universal non-repainting technique. As such, we've deprecated that approach, and the Pine Script™ User Manual no longer recommends it.
█ METHOD VARIANTS
In this script, all non-repainting requests employ the same underlying technique to avoid repainting. However, we've applied variants to cater to specific use cases, as outlined below:
Variant 1
Variant 1, which the script displays using a lime plot, demonstrates a non-repainting HTF request in its simplest form, aligning with the concept explained in the "Achieving consistent timing" section above. It uses barmerge.lookahead_on and offsets the `expression` argument in request.security() by one bar to retrieve the value from the last confirmed HTF bar. For detailed information about why this works, see the Avoiding Repainting section of the User Manual's Other timeframes and data page.
Variant 2
Variant 2 ( fuchsia ) introduces a custom function, `htfSecurity()`, which wraps the request.security() function to facilitate convenient repainting control. By specifying a value for its `repaint` parameter, users can determine whether to allow repainting HTF data. When the `repaint` value is `false`, the function applies lookahead and a one-bar offset to request the last confirmed value from the specified `timeframe`. When the value is `true`, the function requests the `expression` using the default behavior of request.security() , meaning the results can fluctuate across chart bars within realtime HTF bars and repaint when the script restarts.
Note that:
• This function exclusively handles HTF requests. If the requested timeframe is not higher than the chart's, it will raise a runtime error .
• We prefer this approach since it provides optional repainting control. Sometimes, a script's calculations need to respond immediately to realtime HTF changes, which `repaint = true` allows. In other cases, such as when issuing alerts, triggering strategy commands, and more, one will typically need stable values that do not repaint, in which case `repaint = false` will produce the desired behavior.
Variant 3
Variant 3 ( white ) builds upon the same fundamental non-repainting approach used by the first two. The difference in this variant is that it applies repainting control to tuples , which one cannot pass as the `expression` argument in our `htfSecurity()` function. Tuples are handy for consolidating `request.*()` calls when a script requires several values from the same context, as one can request a single tuple from the context rather than executing multiple separate request.security() calls.
This variant applies the internal logic of our `htfSecurity()` function in the script's global scope to request a tuple containing open and `srcInput` values from a higher timeframe with repainting control. Historically, Pine Script™ did not allow the history-referencing operator [ ] when requesting tuples unless the tuple came from a function call, which limited this technique. However, updates to Pine over time have lifted this restriction, allowing us to pass tuples with historical offsets directly as the `expression` in request.security() . By offsetting all items in a tuple `expression` by one bar and using barmerge.lookahead_on , we effectively retrieve a tuple of stable, non-repainting HTF values.
Since we cannot encapsulate this method within the `htfSecurity()` function and must execute the calculations in the global scope, the script's "Repainting" input directly controls the global `offset` and `lookahead` values to ensure it behaves as intended.
Variant 4 (Control)
Variant 4, which the script displays as a translucent orange plot, uses a default request.security() call, providing a reference point to compare the difference between a repainting request and the non-repainting variants outlined above. Whenever the script restarts its execution cycle, realtime bars become historical bars, and the request.security() call here will repaint the results on those bars.
█ Inputs
Repainting
The "Repainting" input (`repaintInput` variable) controls whether Variant 2 and Variant 3 are allowed to use fluctuating values from an unconfirmed HTF bar. If its value is `false` (default), these requests will only retrieve stable values from the last confirmed HTF bar.
Source
The "Source" input (`srcInput` variable) determines the series the script will use in the `expression` for all HTF data requests. Its default value is close .
HTF Selection
This script features two ways to specify the higher timeframe for all its data requests, which users can control with the "HTF Selection" input (`tfTypeInput` variable):
1) If its value is "Fixed TF", the script uses the timeframe value specified by the "Fixed Higher Timeframe" input (`fixedTfInput` variable). The script will raise a runtime error if the selected timeframe is not larger than the chart's.
2) If the input's value is "Multiple of chart TF", the script multiplies the value of the "Timeframe Multiple" input (`tfMultInput` variable) by the chart's timeframe.in_seconds() value, then converts the result to a valid timeframe string via timeframe.from_seconds() .
Timeframe Display
This script features the option to display an "information box", i.e., a single-cell table that shows the higher timeframe the script is currently using. Users can toggle the display and determine the table's size, location, and color scheme via the inputs in the "Timeframe Display" group.
█ Outputs
This script produces the following outputs:
• It plots the results from all four of the above variants for visual comparison.
• It highlights the chart's background gray whenever a new bar starts on the higher timeframe, signifying when confirmations occur in the requested context.
• To demarcate which bars the script considers historical or realtime bars, it plots squares with contrasting colors corresponding to bar states at the bottom of the chart pane.
• It displays the higher timeframe string in a single-cell table with a user-specified size, location, and color scheme.
Look first. Then leap.

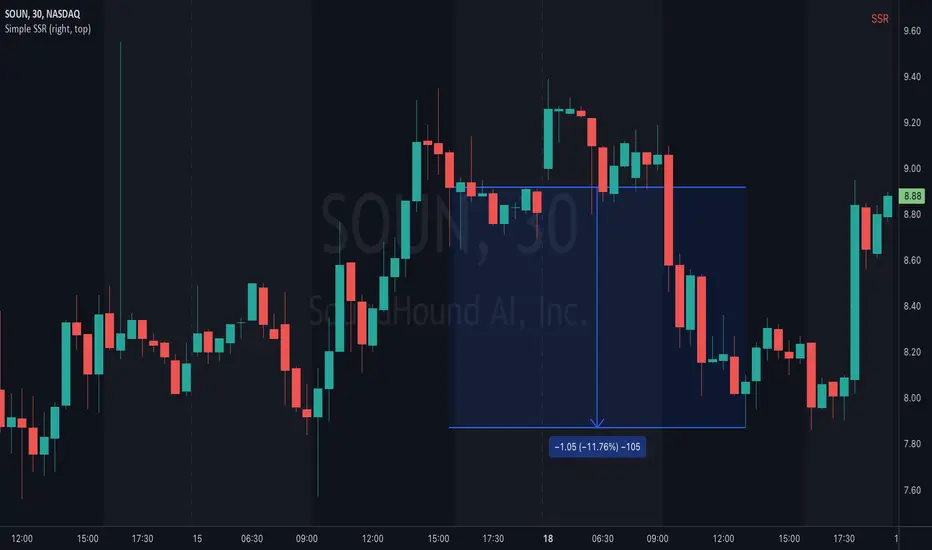
Simple SSRThis indicator shows "SSR" on the chart when SSR "Short Sale Restriction" is activated on the ticker.
SSR "Short Sale Restriction" or "alternative uptick rule" is a rule introduced by the SEC that prohibits shorting on the bid when a stock has dropped more than 10% from the prior days close in the regular trading hours.
It will stay activated for the day it has triggered and the following day through regular and extended market hours.
Since this rule only applies to the US stock market it checks for the exchange and only displays it for US stocks.