Aligned Moving Average FilterThis is another adoption of Aligned Moving Average index study published earlier:
Instead of summing up the aligned moving average strength, here we are checking the max and min values from X bars. If maxValue is above threshold, we show bullish bias by coloring candles lime. Similarly if minValue is below threshold we show bearish bias by coloring candles orange. If the max and min signals are mixed - showing both bullish and bearish or showing neither bullish or bearish, then we do not have any bias and candles are colored in silver.
Parameter descriptions are as below:
Moving Average Type : Select moving average type to calculate moving average alignment index
LookbakPeriod : Periods to calculate min and max values
Threshold : Percentage less/more than min/max values of alignment index. At present, max value of alignment index is 36. Hence, 25 threshold will consider max ma alignment index above 27 as bullish and min alignment index below 9 as bearish
Filter type : allows you to use only bullish or bearish filter.
If bullish type is selected, then candle colors are based only on the maxValue of moving average alignment. Candle color will be lime if above threshold and silver otherwise.
If bearish type is selected, then candle colors are based only on the minValue of moving average alignment. Candle color will be orange if below threshold and silver otherwise.
Wyszukaj w skryptach "哪吒2票房破25亿"

Sniper DragonThis indicator improvement from Indicator | MCDX
I make some revise with adding rsi line and range. Also, hardcoded sensitive value to the rsi base, period etc.
Sniper Dragon created for help trader to identify smart money and momentum using RSI .
The rsi base also hard coded with sensitive rsi value that will get accurate value.
How to use this indicator:-
Histrogram Color legend
1. Green Color - Retailers
2. Yellow Color - Institution
3. Red Color - Smart Money
- the more red color in one bar is prefer for long position
- full yellow color indicate will good for mid position or short term position.
- if more green color then red and yellow indicate that the price likely going down. need to be careful here. the seller is in overpower.
- if more red color increasing, its indicate that the buyers momentum come in. A powerful buying interest.
Black Line RSI using RSI 9
- help trader to indentify current momentum.
- RSI range area already scale to fit in with the histogram.
- RSI scale range:-
- RSI 40-50 : signal overbought. standby for sell
- RSI 25-35 : indecision signal. might sideway. if before got above 35 can buy.
- RSI 0-15 : signal oversold. standby for buy
Horizontal Line Range
- red line :- indicate max range for the momentum. need to standby to sell.
- green line:- indicate lower min range for the momentum. can ready for buy if black line cross up the horizontal range.

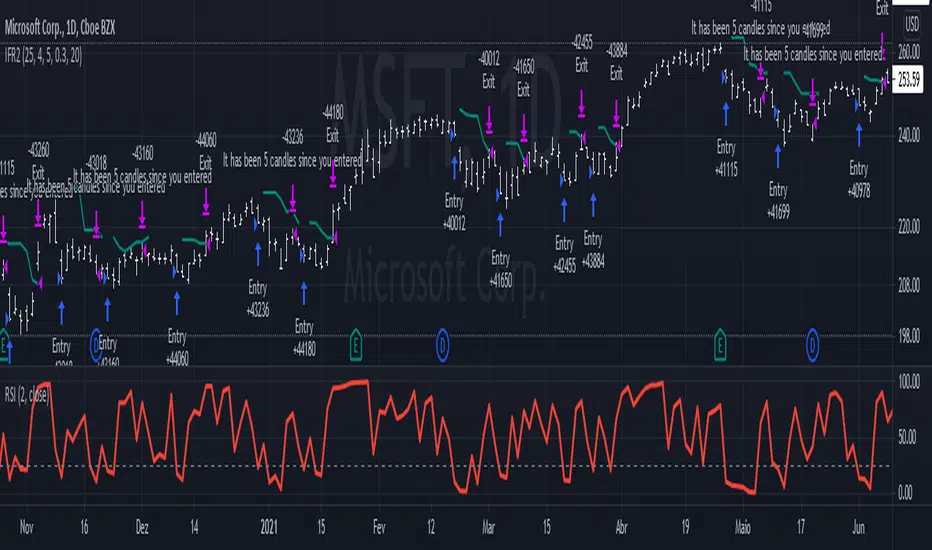
IFR2The IFR2 strategy is based on the RSI indicator.
If the two period RSI is less than the overbought level (25 is the default, but you can configure it to be lower), a long position is placed at the close of the candle. If you are doing it live, you'd have to enter the market ~ 10 minutes before it closes, check the RSI, and buy if it is lower than your overbought level. This generates a discrepancy in the backtesting, but since it is a very small difference, it can be disregarded. Higher overbought levels generate more signals, but they mostly are unreliable. Lower values generates better yields, but they won't occur very often. This strategy is designed to be used in a daily graph, and I don't recommend using it in intraday periods, since you'll make too little money to compensate for the operational cost.
The strategy exits when the high price of two previous candles is reached. If the exit price is higher than the closing price of when you entered, you'll be at a profit, otherwise you'll be at a loss. The exit price is plotted in the graph and it's colors depends on the current open profit: positive values will be green, negative will be red.
This strategy completely disregards the current trend. Long orders will be placed even if you are at a strong down trend. This may seem odd, but you have to keep in mind that this is a volatility based strategy , not a trend following one.
This setup was designed by Alexandre Wolwacz, a.k.a. Stormer.
2 Candles Inside ATR2 agitated candles falling inside ATR range, awaiting possibly a big move.
Buy / Sell signals at combined high / low can be used as order with other as stop loss.
Counter trade, when this minimal stop loss is hit, is also as useful. However, wait till the SL candle closes, before opening position on the other side.
Works quite well on 15 mins chart, with settings of ATR duration 25 and multiplier 0.6. These settings are configurable, so feel free.

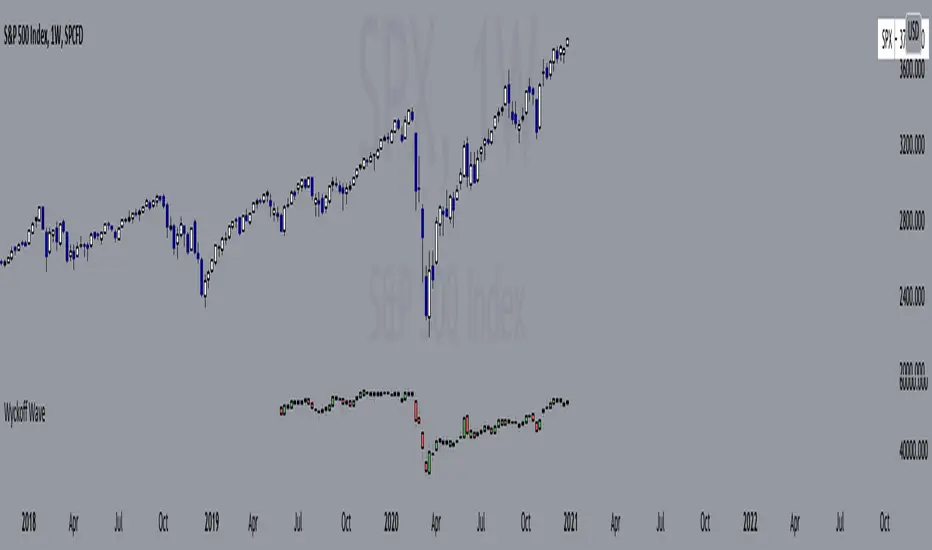
Wyckoff Wave"The Wyckoff Wave is a weighted index consisting of 12 stocks that are leaders in their perspective industries. It was introduced by the Stock Market Institute in 1931.
Made up of leaders in the important stock groups, the Wyckoff Wave represents the core of the American industrial complex.
The Wyckoff Wave has been a market indicator for Wyckoff students for over 50 years. While the stocks comprising the Wyckoff Wave have changed over time, it continues to be a sensitive leading market indicator. The Wyckoff Wave has consistently identified market trends.
The Wyckoff Wave is extremely helpful in predicting the stock market’s timing and the direction of the next market move.
The Wyckoff Wave is analyzed in five minute intervals and individual up and down iintra-day waves are created.
These individual waves, which include the price action and volume during those brief up and down market swings, also provide the data for other important Wyckoff Stock Market Institute indicators, including the Optimism-Pessimism volume index and the Trend Barometer.
These 12 stocks that make up the Wyckoff Wave. They are listed, along with their multipliers, below."
Wave Stock / Multiplier
AT&T / 79
Bank of America / 50
Boeing / 39
Bristol Myers / 119
Caterpillar / 35
DowDuPont / 72
Exxon Mobile / 32
IBM / 21
General Electric / 90
Ford / 25
Union Pacific / 60
WalMart / 43
In 2019, DowDuPont split into three companies: Dow, DuPont, and Corteva. Because TV limits the number of securities in a script to 40, only Dow and DuPont are factored into the Wave calculation (higher market caps than Corteva) with a multiplier of 36 each.
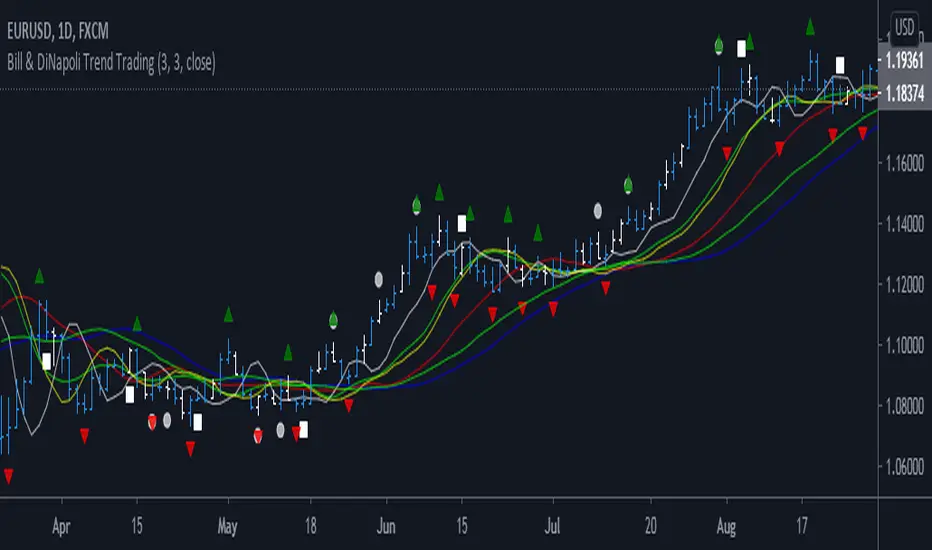
Bill & DiNapoli TradingThis Indicator is a pack of set of Indicators. I am a Bill Williams Chaos and DiNapoli system trader. It includes following indicators,
1. Wiseman 1 - Divergent Bar indicated by Circle. Angulation to be manually observed
2. Wiseman 2 - The Super AO signal, indicated by a square
3. Wiseman 3 - Bill William's Fractal indicated as Triangle
4. DiNapoli DMA1 - 3 Bar SMA, Shifted 3 Periods forward
5. DiNapoli DMA2 - 7 Bar SMA, Shifted 5 Periods forward
6. DiNapoli DMA3 - 25 Bar SMA, Shifted 5 Periods forward
7. Squat Bar - Bill William's Trading System
You can check out Bill Willam's Trading Chaos 2nd Edition and DiNapoli Level Book
Configurable BB+RSI+Aroon strategy backtest for binary optionsI wanted to share this strategy that I use myself for binary options trading. After trading binary options for several years I have learned that every single day is unique... assets behave differently every single day. So, when I start the day I want to know which is the optimum combination of parameters in my indicators that will give me the signals I want during the day and I get that by doing a quick backtest of the parameters combination in a specific asset that same day. When trading Binary Options I usually do 3 or 4 trades max per day and, yes, there are moments in which even with the right backtest data the signals fail (I strongly believe that there is no strategy that guarantees 100% success in any type of trade, and this one here is not an exception - but has worked well with some assets). So, here is my contribution to improve your productivity by automating a bit that backtesting part.
How this script works?
It is a simple price crossunder / crossover Bollinger Bands (BB) with a confirmation from RSI overbought / oversold signals and a fast Aroon. You will see the BB plotted with its confirmations:
(1) a blue circle that plots in the chart when the price is coming back inside the channel (within the Bollinger Bands)
(2) an orange square that plots in the chart when the RSI is coming back from the overbought or oversold areas
(3) a triangle that could be red or green depending on the Aroon confirmation: Red if Aroon Down is crossing down Aroon Up or green if vice versa.
The strategy will call for long (Call) if:
(1) the price is crossing over the lower band of the Bollinger Bands, coming back inside the channel
(2) Aroon Up is crossing or has crossed above Aroon Down
(3) RSI is crossing over the oversold limit
Consequently, the strategy will call for a short (Put) if:
(1) the price is crossing down the upper band of the Bollinger Bands, coming back inside the channel
(2) Aroon Down is crossing or has crossed below Aroon Up
(3) RSI is crossing under the overbought limit
You can configure:
1. Aroon length (keep it as fast as possible: 3, 4 or 5 are recommended values)
2. The point where Aroon Up and Aroon Down cross to make the signal valid (50 is by default. It could also be 25 or 75)
3. The RSI length
4. RSI Overbought and Oversold limits (they do not need to be symmetric: you can use 29 and 93, for example)
5. Bollinger Bands length and standard deviation
6. Number of bars to keep your option open. Depending on the timeframe used, this will determine the time you will keep your binary option open. If you are in a 1 min chart and keep this parameter in 3, then you will need to configure your binary option to expire in 3 minutes.
How to evaluate your backtest?
In Binary Options you only need the success rate, so what I do is that when I am manually updating the parameters I keep my strategy tester window open checking the winning trades vs losing trades ratio ("Percent Profitable"). I personally will only keep an asset monitored looking for signals that day if the Percent Profitable on the backtest of the same day is above 80%.
Regarding the code: it is open, public and free. No need to ask for permission if you want to copy+paste and use it in whole or parts.
Happy pip hunting!
-marco

Vervoort SmoothingThis script has both the Triple Exponential Moving Average (TEMA) and zero lag sma written as functions. Both from Capturing Profit with Technical Analysis (24-25) by Sylvain Vervoort.
Best regards,
capam

SMA Directional Matrix [LuxAlgo]This script was created in collaboration with alexgrover and displays a simple & elegant panel showing the direction of simple moving averages with periods in a user-selected range (Min, Max). The displayed number in the panel is the period of a simple moving average and the symbol situated at the right of it is associated with the direction this moving average is taking.
Settings
Min: Minimum period of the moving average
Max: Maximum period of the moving average
Src: Source input of the moving averages
Number Of Columns: Number of columns to be displayed in the panel, handy when using a large range of periods.
Usage
Looking at the direction of moving averages with different periods is extremely useful when it comes to having information about the short/mid/long term overall market sentiment, and can also tell us if the market is trending or ranging.
Here we use periods ranging from 25 to 50, we can see that shorter moving averages react to the recent upward price variation, longer-term moving averages however are still affected by the overall downward variation you can see on the image. We can as such get information about the presence of potentials divergences, with shorter-term moving averages reacting to the divergence while the longer-term moving averages will still display the direction of the main trend.
As such the indicator can give information about how clean a trend is, with a clean trend being defined as a variation containing no retracements. When our trend contains no retracement, the mid/long term moving averages will all have the same direction, however, when a retracement is present, the midterm moving averages might be affected by it, thus displaying a direction contrary to the main trend.
When the market is ranging we can expect the panel to display an equal number of decreasing/increasing moving averages.
Possible Issues
When using a large range of periods, you might have an error message showing: "String is too long", try lowering the range of periods by increasing Min or decreasing Max .
If the script displays the error message "Loop is too long to execute", try resetting the settings and change them back to the one you wanted to use.

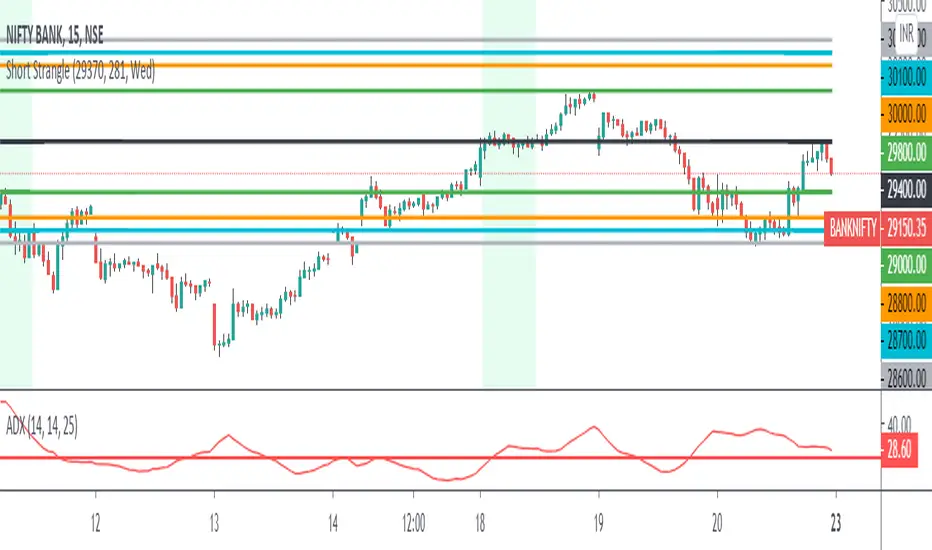
3 Leg Short Strangle BandsDraws 3 leg bands along with safe zone(green lines) based on input
1) Input ATR, Week Day, Current Market Close
2) Input ATR - Previous day 1H Max ATR
3) ADX < 25
4) Input Current Market Close
5) Trading Day - Mon/Tue/Wed/Thu/Fri - Bands distance calculated based on day M/Tu/F 2*(Max ATR), W/Th 1.5(ATR)
6) Safe zone green lines - CMPCls +/- (1.5 * Max ATR)
7) Leg 1 Upper Lower Legs - M/Tu/F - CMPCls +/-(2 * Max ATR), W/Th - CMPCls +/-(1.5 * ATR)
8) Leg 2 & 3 Calculates based on Leg 2 = Leg 1 +/- 100 pts distance, Leg 3 = Leg 2 +/- 100 pts distance'
9) All figures rounded to nearest 100's
10) Safe zone broken exit all positions
This is a popular technic used by Profitable traders on sideway markets for Intraday
One can keep 3K as SL per 1 set of 3 legs for better R:R
21/55 EMA Cloud w/ Optional RibbonThis indicator behaves like a traditional EMA ribbon by using the 21, 25, 30, 35, 40, 45, 50, and 55 bar exponential moving averages. In this particular indicator, the traditional EMA ribbon lines are turned off by default leaving only a filled in area between the 21 and 55 bar averages. The filled in area is green when the 21 bar average is greater than the 55 and red otherwise. Additionally, the 9, 100, and 200 exponential moving averages are available for reference.

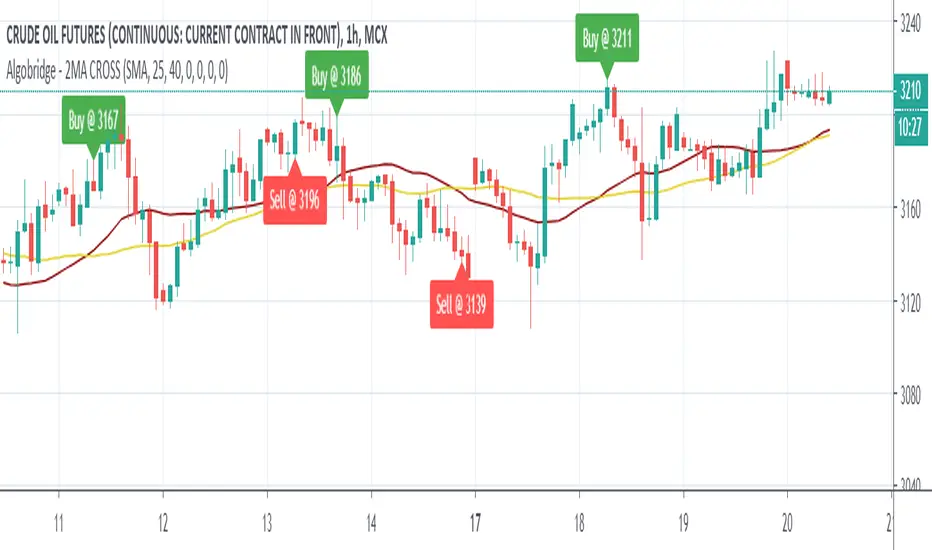
MA_CROSSOVER with SL & TPThis is the Moving Average Script Including the Stoploss and Target Levels. By Default it is working on 25 & 40 Parameters but it can change accordingly.
InariN BasicInariN is original work by N jijii.
I think InariN is modern interpretation of Ichimoku Cloud.
Please read script "InariN simple" for basic usage.
Multi time flame candles in this script is great work Candlestick Plot MTF by mortdiggiddy.
Supplementary explanation :
N jijii decided basic numbers as Ichimoku.
"I" first swing is 9. Only first swing is 9 because all numbers is consisted of nine numbers except start point 0 (his philosophy).
The second and subsequent is 8 because tangent point of previous swing is not counted (his philosophy).
"V" second swing is 9 + 8 = 17. "N" third swing is 9 + 8 + 8 = 25.
"N N = N2" is 25 +24 = 49. "N4" is 97. "N9"is 217.
He used basic numbers for parameters.
I think his idea is unique but the important point is this basic numbers are about popular numbers traders usually use and we can use as the same.
N2 and N9 spans is slightly difficult to use (Ichimoku lagging span).
Basically N span is used to measure Time Retracement and momentum.
If you want to practice Time Retracement , please check script "Ichimoku Time Retracement".
Enjoy!!
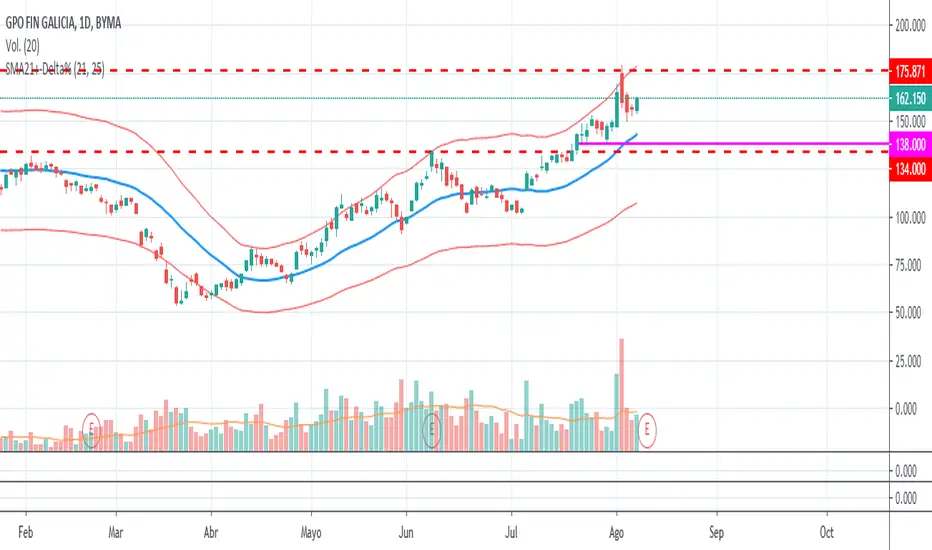
SMA21+-Delta%A simple script that plots a SMA of "length" periods, plus and minus "Delta %" of SMA value. Many Stocks shows a pattern off bulixh/bearish correction based on a % instead of any numbes of Standard Deviations, like Bollinger Bands do.
Default values:
length = 21
Delta% = 25
Un script simple que permite graficar una SMA de "length" períodos, +- "Delta%", un porcentage fijo respecto a la SMA. Muchos papeles muestran payrones de corrección basados en este tipo de límites, en lugar de una cierta cantidad de desvíos estándar, como es el caso de las Bandas de Bollinger.
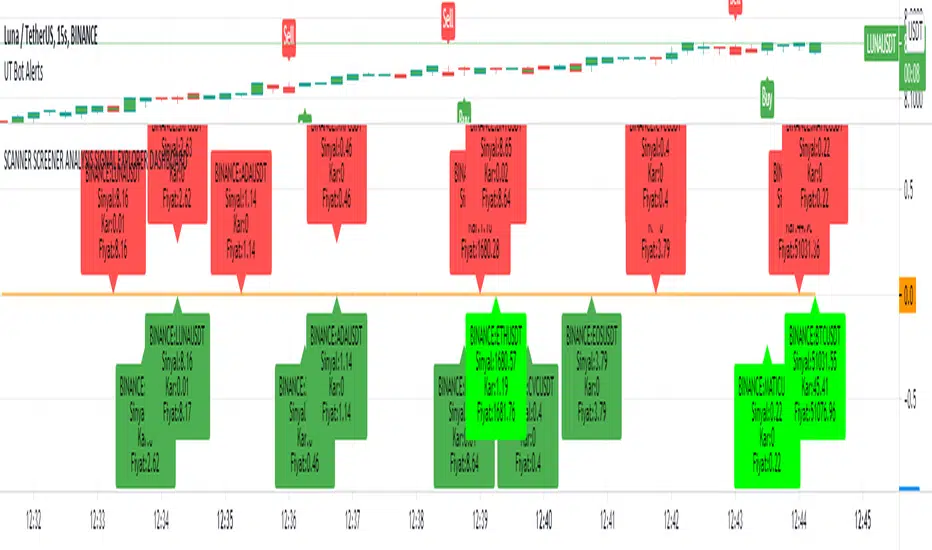
SCANNER SCREENER ANALYSIS SIGNAL EXPLORER DASHBOARDNew Buy signal: light green color
New Sell signal: light red color
Bullish dark green condition
Brearish dark red condition
Set your trend strategy in settings.
You can watch 20 pair in one indicator. Add more indicator panel and move same window and watch more signals in the same window. Set X axis cordinates 0-25-50-75-100-125-150-175-200 etc.for not overlap
You can add your favorite stocks, fx, crypto and analys for buy and sell signal.
When change the time frame new signal show on your selected time frame
it shows profit and signal price.
Look and review my other amazing indicator. It is best on TVs.
For Access and try my other best quality indicators till 7 days, message me. You can monthly subscribe my scripts my google play app on my profile or sent (30 USD) btc my bitcoin adress.
RSI IMPORTANT LEVELSThe indicator allows the user to establish importance levels on the indicator, the levels are established by a color stripe. The difference of this RSI with the others is that it allows you to set custom levels and set colors for each value allowing a better user experience.
Default levels:
-75-90 Overbought Levels
-50 Medium level
-25-10 Oversold levels
The indicator was created based on an existing template based on built-in indicators, my work consisted solely of allowing more levels to be established than already existing.

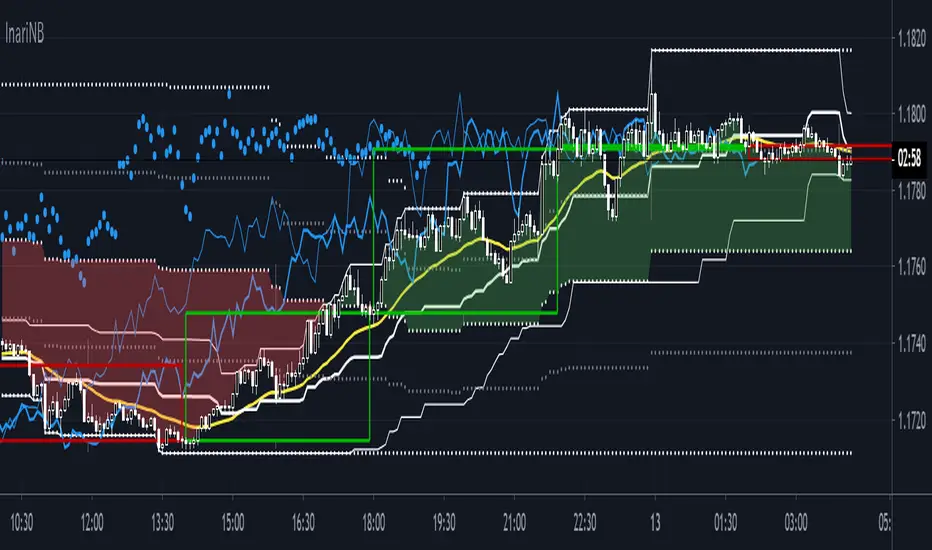
InariN simpleJapanese legendary day trader's indicator "InariN" .
"N jijii " introduced this original indicator at his ebook and I made it simple for my own use .
This is not original type but I picked up essential elements to practice his idea .
I guess he is real forex day trader and "InariN" is similar to "Ichimoku" .
I have used this at EUR/USD 5 minutes chart for several months and I get basis for judgement .
This is not a magical tool but you can make good reference point to use this .
I think " I " means first swing , " nari " is " become " and " = " , and " N " is third swing .
For example , look at chart , AB is first swing ,BC is second and CD is third .
In many cases ,AB = CD and it called measured move .
"InariN" provide reference point to decide always-in ,entry point , entry timing and exit point.
1.
"InariN" is a trendfollowing tool , you can judge bull or bear by a few lines .
25 ema represent short time frame , 49 (about 4 hour bar at 5 minutes chart ) is middle time frame and 217 (about 18 hour at 5 minutes chart )is long time frame (preset periods is "N jijii" style . please use favorite time frame ).
For example , when current price is above 25ema ,49ema and 217 High-low band"s middle line , market is strong bull .
So you can do multi time frame analyze .
Hint ; you also have to check daily chart's trend .
2.
Every line provided by "InariN" tends to become bull-bear battle point , so you can easily check where is support and resistance line .
Hint ; Especially 25ema is important to pullback entry in trend and 217 high-low line is important to do fade trade in range and reversal .
You have to wait entry until touch and stick lines and follow winner (to avoid failed breakout check shrinking bar) .
3.
You can also use lines to except exit point because high-low band is symmetry .
Hint ; I recommend use custom fibonacci retracement tool to measure Risk-Reward Ratio and exit point .
I customized fibo tool to be symmetry .
Entry point ,exit point and loss cut point became symmetry and you can add other symmetry points more .
For example , look at chart , blue lines is fibo tool and you can measure exit point .
Have fun!!

Double BB + Multi Ema Use this indicator to identify the market trend, possible dynamic Supports or Resistances and possible setbacks or corrections.
Take the Moving Averages (50,75,100,200) as a reference to identify if the market is bullish or bearish.
Have as reference the Moving Averages (8,15,20,25) as possible dynamic Supports or Resistances.
Have the BB as a reference, to identify possible setbacks or changes in trends.

KINSKI RSI Short/LongExtends the display of the Relative Strength Index (RSI) by shorts and longs from Bitmex and shows them as a diagram.
How to interpret the display?
- blue line is the default Relative Strength Index
- red line means "oversold
- green line "overbought"
- grey dotted line up/down indicates the optimal range for up and down movements 30 to 70
- in general, the reaching or crossing of the thresholds in the direction of the mid-range is seen as a possible buy or sell signal
- RSI values (blue line) of over 70 percent are considered "overbought", values below 30 percent "oversold
Which settings can be made?
- Selection for the "Currency". Default value is "BTCUSD". Currently only the following currencies are supported "BTCUSD", "ETHUSD", "ETCUSD", "OMGUSD", "XLMUSD", "XTZUSD".
- Selection for calculation formula ("Calculation"). The default value is "hlc3".
- Field for the moving average value ("RSI Length"). The default value is 14, but values of 7, 9 or 25 are also common. The shorter the period under consideration, the more volatile the indicator is, but with longer periods, fewer signals are triggered.
- furthermore you can make layout adjustments via the "Style" menu

Buy/Sell IndicatorBased on logic from many top contributors here, the script utilizes LazyBear's WaveTrend Oscillator Indicator along with custom code to plot a few key components for daily trading;
Boundaries for entry and exit points which are based on a 6-day trend in OPEN/HIGH and OPEN/LOW prices.
Daily HIGH and LOW points to establish a good view of stock's movements
Entry and exit points with confidence levels. These can be treated as entry points for short to medium term investments
Entry points come in the colours of White and Lime, where white is slightly confident and lime is extremely confident
Exit points come in the colours of Maroon, and Red, where maroon is slightly confident and red is extremely confident
Each Entry and Exit point also comes without text, or with a M or H above it, where M indicates medium confidence on the point and an O indicates overconfidence.
Use Case:
The best possible use case is to enter a trade on a LIME point with O text, this means that is an overconfident entry point.
The trade should be exited on a RED point with O text, this means that is an overconfident exit point.
But you can do with the indicators as you please.
In addition to LazyBear's code, the following existing models and indicators are taken into account:
RSI of closing price over a period of 25
EMA of RSI

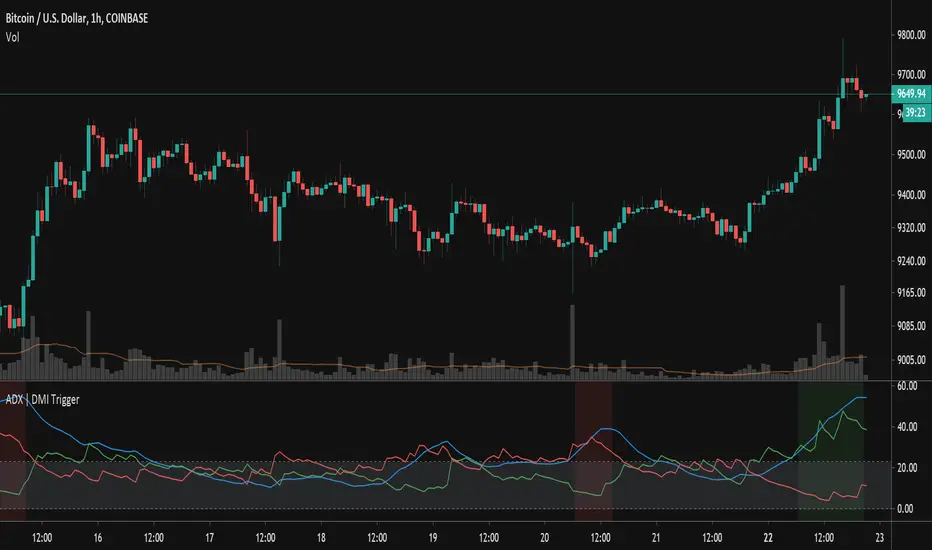
ADX TriggerThis script fires off a buy alert when the ADX is rising and above a user-defined value (default 25). It fires off a sell signal when ADX starts sloping downward. The lookback period to determine if it is sloping up/down (in bars) is also configurable by the user. The plot highlights green when there is a "go" signal. Thanks to @9e52f12edd034d28bdd5544e7ff92e for the idea.
Combing in MACD and MTFHi all, I'm trying to wedge in the MACD into a multiple timeframe. Scope is to create:
1) an alert when the MACD across all timeframes is positive,
2) an alert when the MACD across all timeframes is negative, and
3) one when neither of them is applicable.
Would anyone be so kind to give it some thoughts, please?
//@version=2
strategy(" Easy MTF Strategy", overlay=false)
TF_1_time = input("3", "Timeframe 1")
TF_2_time = input("5", "Timeframe 2")
TF_3_time = input("15", "Timeframe 3")
TF_4_time = input("30", "Timeframe 4")
fastLen = input(title="Fast Length", type=integer, defval=12)
slowLen = input(title="Slow Length", type=integer, defval=26)
sigLen = input(title="Signal Length", type=integer, defval=9)
= macd(close, fastLen, slowLen, sigLen)
width = 5
upcolor = green
downcolor = red
neutralcolor = blue
linestyle = line
TF_1 = security(tickerid, TF_1_time, open) < security(tickerid, TF_1_time, close) ? true:false
TF_1_color = TF_1 ? upcolor:downcolor
TF_2 = security(tickerid, TF_2_time, open) < security(tickerid, TF_2_time, close) ? true:false
TF_2_color = TF_2 ? upcolor:downcolor
TF_3 = security(tickerid, TF_3_time, open) < security(tickerid, TF_3_time, close) ? true:false
TF_3_color = TF_3 ? upcolor:downcolor
TF_4 = security(tickerid, TF_4_time, open) < security(tickerid, TF_4_time, close) ? true:false
TF_4_color = TF_4 ? upcolor:downcolor
TF_global = TF_1 and TF_2 and TF_3 and TF_4
TF_global_bear = TF_1 == false and TF_2 == false and TF_3 == false and TF_4 == false
TF_global_color = TF_global ? green : TF_global_bear ? red : white
TF_trigger_width = TF_global ? 6 : width
plot(1, style=linestyle, linewidth=width, color=TF_1_color)
plot(5, style=linestyle, linewidth=width, color=TF_2_color)
plot(10, style=linestyle, linewidth=width, color=TF_3_color)
plot(15, style=linestyle, linewidth=width, color=TF_4_color)
plot(25, style=linestyle, linewidth=4, color=TF_global_color)
exitCondition_Long = TF_global_bear
exitCondition_Short = TF_global
longCondition = TF_global
if (longCondition)
strategy.entry("MTF_Long", strategy.long)
shortCondition = TF_global_bear
if (shortCondition)
strategy.entry("MTF_Short", strategy.short)
strategy.close("MTF_Long", when=exitCondition_Long)
strategy.close("MTF_Short", when=exitCondition_Short)

