BPS Multi-MA 5 — 22/30, SMA/WMA/EMA# Multi-MA 5 — 22/30 base, SMA/WMA/EMA
**What it is**
A lightweight 5-line moving-average ribbon for fast visual bias and trend/mean-reversion reads. You can switch the MA type (SMA/WMA/EMA) and choose between two ways of setting lengths: by monthly “session-based” base (22 or 30) with multipliers, or by entering exact lengths manually. An optional info table shows the effective settings in real time.
---
## How it works
* Calculates five moving averages from the selected price source.
* Lengths are either:
* **Multipliers mode:** `Base × Multiplier` (e.g., base 22 → 22/44/66/88/110), or
* **Manual mode:** any five exact lengths (e.g., 10/22/50/100/200).
* Plots five lines with fixed legend titles (MA1…MA5); the **info table** displays the actual type and lengths.
---
## Inputs
**Length Mode**
* **Multipliers** — choose a **Base** of **22** (≈ trading sessions per month) or **30** (calendar-style, smoother) and set **×1…×5** multipliers.
* **Manual** — enter **Len1…Len5** directly.
**MA Settings**
* **MA Type:** SMA / WMA / EMA
* **Source:** any series (e.g., `close`, `hlc3`, etc.)
* **Use true close (ignore Heikin Ashi):** when enabled, the MA is computed from the underlying instrument’s real `close`, not HA candles.
* **Show info table:** toggles the on-chart table with the current mode, type, base, and lengths.
---
## Quick start
1. Add the indicator to your chart.
2. Pick **MA Type** (e.g., **WMA** for faster response, **SMA** for smoother).
3. Choose **Length Mode**:
* **Multipliers:** set **Base = 22** for session-based monthly lengths (stocks/FX), or **30** for heavier smoothing.
* **Manual:** enter your exact lengths (e.g., 10/22/50/100/200).
4. (Optional) On **Heikin Ashi** charts, enable **Use true close** if you want the lines based on the instrument’s real close.
---
## Tips & notes
* **1 month ≈ 21–22 sessions.** Using 30 as “monthly” yields a smoother, more delayed curve.
* **WMA** reacts faster than **SMA** at the same length; expect earlier signals but more whipsaws in chop.
* **Len = 1** makes the MA track the chosen source (e.g., `close`) almost exactly.
* If changing lengths doesn’t move the lines, ensure you’re editing fields for the **active Length Mode** (Multipliers vs Manual).
* For clean comparisons, use the **same timeframe**. If you later wrap this in MTF logic, keep `lookahead_off` and handle gaps appropriately.
---
## Use cases
* Trend ribbon and dynamic bias zones
* Pullback entries to the mid/slow lines
* Crossovers (fast vs slow) for confirmation
* Volatility filtering by spreading lengths (e.g., 22/44/88/132/176)
---
**Credits:** Built for clarity and speed; designed around session-based “monthly” lengths (22) or smoother calendar-style (30).
Wyszukaj w skryptach "价格在30元内股票"

SuperZweig thrust (<= 30 dias)SuperZweig Thrust (≤ 30-day breadth trigger)
This study tracks the classic Zweig Breadth Thrust pattern, but restricts valid signals to a 30-bar (≈ 30-trading-day) window.
---
What it plots
| Plot | Meaning |
|------|---------|
| **Blue line** – `EMA10` | 10-bar exponential moving average of the _breadth ratio_:`advancing issues / (advancing + declining)` |
| **Red h-line 0.35** | Oversold threshold ( < 0.35 ) |
| **Green h-line 0.64** | Overbought threshold ( > 0.64 ) |
| **Red “×”** | The moment EMA10 crosses **down** through 0.35 |
| **Green “●”** | The moment EMA10 crosses **up** through 0.64 |
| **Green “BUY” label** | Complete Super-Zweig thrust: red × followed by green ● **within 30 daily bars** |
Signal logic
1. **Trigger phase** – when EMA10 drops below 0.35
*Script starts a 30-bar countdown.*
2. **Confirmation phase** – if, while the countdown is active, EMA10 rises above 0.64:
*A single “BUY” label is plotted beneath that bar.*
3. **Expiry** – if 30 bars elapse without the 0.64 cross, the cycle resets; no signal is produced.
4. After any valid “BUY” the cycle also resets, so a new signal requires a fresh cross < 0.35.
Inputs
* **EMA length** – default 10.
* **Advancing / Declining symbols** – default `ADVS` / `DECS` (NYSE issues); can be pointed to any Exchange-specific or custom breadth tickers.
Typical use
Apply on a **daily chart** of a broad index (e.g., S&P; 500).
A printed “BUY” indicates a historically rare surge in market breadth often associated with durable rallies. Combine with other risk-management and trend filters before trading.

PENTAD THEORY 30 MINUTE INITIAL BALANCE With Candle HighlightThis indicator is designed to highlight the 30-minute initial balance range, visualize key retracement levels, and provide insights into market behavior based on defined conditions. It also enhances clarity by applying specific color changes to the :06 and :36 minute candle in relative 30-minute intervals.
Key Features:
Initial Balance Box:
Automatically creates a price range (box) representing the first 6 minutes of each 30-minute interval.
The box dynamically updates during this period to capture the high and low prices.
Color-Coded Zones:
Inside the Box: Yellow background indicates price trading within the range.
Above the Box: Green background shows price breaking above the range.
Below the Box: Red background reflects price breaking below the range.
EMA Overlay:
Plots 3 customizable EMAs (default lengths: 9, 21, 55).
Each EMA can be toggled on/off and colored individually for trend analysis.
Retracement Levels:
Automatically calculates and displays key Fibonacci retracement levels (61.8% and 38.2%) based on the box size.
Adds a midline for additional price reference.
Candle Highlighting:
The :06 and :36 minute candle in relative 30-minute intervals is highlighted with a customizable blue color to draw attention to specific market activity.
The break above or below the 6 minute candle or the close of the 6 minute candle outside the box can help determine the direction of the 30-minute interval.
How to Use:
Trend Confirmation:
Use the EMAs to identify overall trend direction. For example, a bullish trend is indicated when shorter EMAs (e.g., 9 EMA) are above longer ones (e.g., 55 EMA).
Breakout and Retracement Analysis:
Watch for price breaking out of the initial balance box.
Observe retracement levels (61.8% and 38.2%) as potential areas for reversal or continuation.
Candle Highlight:
Pay special attention to the :06 or :36 minute candle, which is highlighted to signify its relevance in the relative 30-minute cycle.
Customization:
Adjust colors and EMA settings via the input menu to align with your trading style and chart aesthetics.
Ideal For:
Intraday traders looking to analyze initial balance ranges.
Traders focused on breakout, retracement, and trend-following strategies.
Those who benefit from visual clarity and real-time market insights.
Notes:
Ensure your chart is set to a 3-minute timeframe or lower for optimal performance.
This indicator is most effective when combined with other confluence factors, such as support/resistance zones and volume analysis.

RSI with SMA + 70/60/50/40/30 LevelsIndicator Name:
RSI with SMA + 70/60/50/40/30 Levels
🧩 Concept Overview:
यह indicator दो popular tools को combine करता है:
RSI (Relative Strength Index) – momentum indicator जो market ke overbought aur oversold zones ko identify karta hai.
SMA (Simple Moving Average) – trend smoother jo RSI ke movement ko average karke lagging confirmation deta hai.
इन दोनों के साथ 70, 60, 50, 40, और 30 की multiple reference lines draw की जाती हैं, ताकि trader को RSI ke swings aur reversals easily samajh aaye.
⚙️ Indicator Components:
RSI Line:
Default Period: 14 (customize kar sakte ho).
Show karta hai price momentum – agar RSI 70 ke upar jaata hai to market overbought zone me hota hai; agar 30 ke niche jaata hai to oversold zone me.
SMA on RSI:
RSI ka smooth version (usually 9-period SMA).
Trend confirmation ke liye – jab RSI line SMA ke upar cross karti hai to bullish signal, aur neeche cross kare to bearish signal.
Horizontal Levels:
70: Overbought zone (potential sell area).
60: Strong bullish momentum line (trend confirmation).
50: Neutral / midline (trend direction flip area).
40: Weak bearish zone (trend losing strength).
30: Oversold zone (potential buy area).
💡 How to Use:
Trend Identification:
RSI > 60 aur SMA ke upar → Bullish trend.
RSI < 40 aur SMA ke neeche → Bearish trend.
Reversal Spotting:
RSI 70 ke upar jaake wapas niche aaye → Sell signal.
RSI 30 ke neeche jaake wapas upar aaye → Buy signal.
Confirmation Using SMA:
RSI cross SMA from below → Confirmed bullish reversal.
RSI cross SMA from above → Confirmed bearish reversal.

Morning Structure – Live 30 Min Range📝 Description:
This indicator captures the morning price structure by tracking the high and low during the first 30 minutes after market open (default: 9:30 AM to 10:00 AM, New York time).
🔧 How it works:
At market open, it begins tracking the highest high and lowest low
The high and low lines are dynamic and update in real-time during the first 30 minutes
Once the 30-minute range completes, the lines freeze at their final values
Lines extend horizontally across the rest of the session to mark the "Morning Range"
✅ Key Features:
Tracks live price action during the morning session
Freezes the structure after 30 minutes (or user-defined)
Automatically resets each new trading day
Built-in timezone setting (America/New_York) to align with standard U.S. market hours
Clean visual lines that scroll naturally with the chart
⚙️ Use Cases:
Identify morning breakout zones
Define support and resistance early in the session
Combine with breakout, fade, or range-trading strategies
⚠️ Note:
This version does not include alerts or labels, by design (clean and focused).
Those can be added easily for custom strategies.

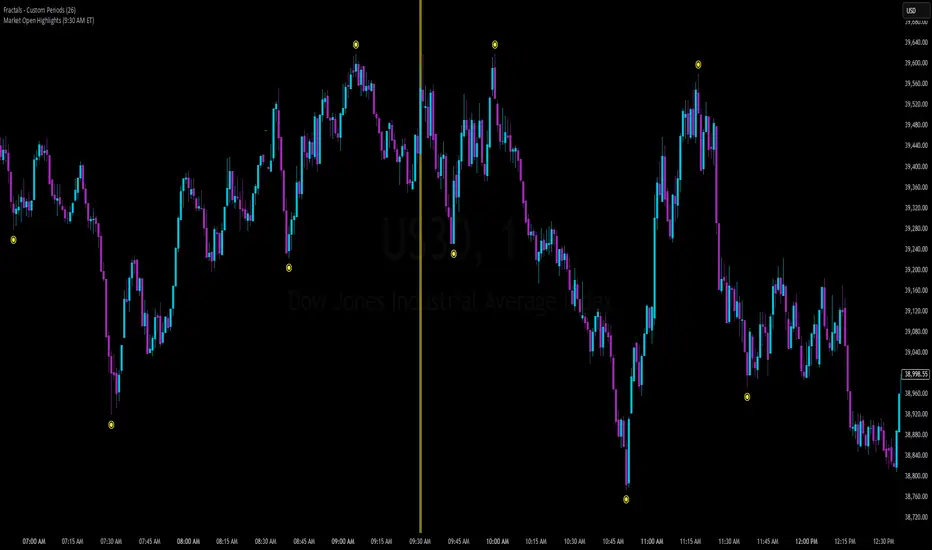
Market Open Highlights (9:30 AM ET)This indicator zeroes in on the 9:30 AM Eastern Time market opens for NAS100 and US30, highlighting all market opens with a bold yet subtle yellow background. Tailored for precision backtesting, it uses TradingView’s timezone capabilities to pinpoint the exact 9:30 AM candle, skipping weekends to focus solely on U.S. equity market opens.
What It Does:
The script tracks the bar indices of all market opens at 9:30 AM ET, applying a semi-transparent yellow highlight to those candles. It’s a clean, efficient way to mark key session starts for analyzing price action or testing strategies.
How to Use It:
1. Apply the script to a chart of NAS100 (e.g., FX:NAS100) or US30 (e.g., FX:US30) in TradingView on any timeframe.
2. Set your chart timezone to "America/New_York" (Settings > Timezone/Sessions).
3. Scroll back through trading days to see the yellow highlights on the 9:30 AM candles.
4. While it functions across all timeframes, it’s optimized for 5-minute and 1-minute charts, where the 9:30 AM candle aligns precisely with the U.S. market open for detailed analysis.
5. Use it to study price behavior or refine strategies around this critical daily event.
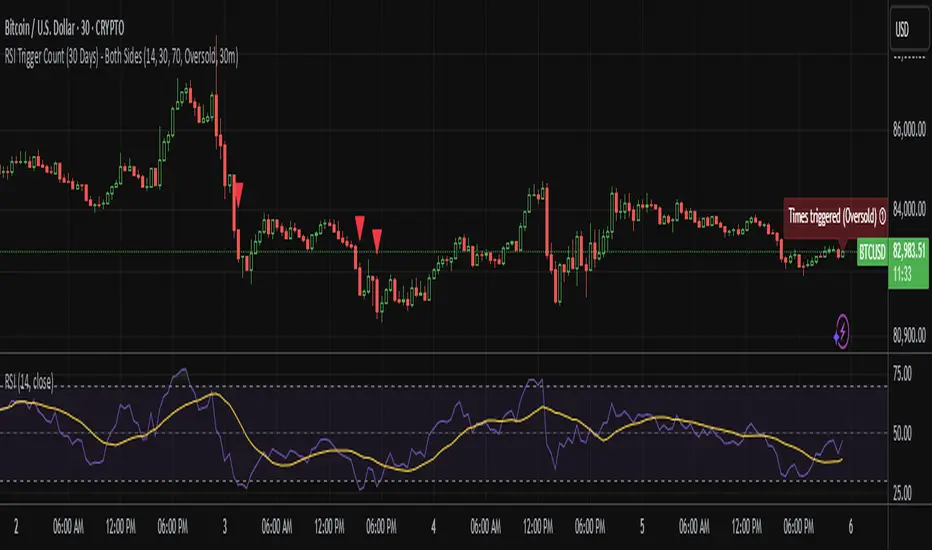
RSI Trigger Count (30 Days) - Both SidesRSI Dual Trigger Counter (30 Days)
This indicator tracks both oversold ( crossunder ) and overbought ( crossover ) RSI events on a 30-minute chart, featuring:
Dual-Mode Selector:
Counts either RSI < 30 (oversold) or RSI > 70 (overbought) crossings
Toggle between modes via input menu
30-Day Rolling Count:
Displays total triggers in the last 30 days (e.g., "Times triggered (Oversold) ① 19")
Visual Alerts:
Red triangles ↓ for oversold crossunders
Green triangles ↑ for overbought crossovers
Customizable:
Adjustable RSI length (2-100) and thresholds (1-100)
Works on any timeframe (auto-scales calculations)
Purpose: Identifies frequent reversal signals for both buying dips (oversold) and selling rallies (overbought).
EMA Cross Strategy v5 (30 lots) (15 min candle only)- safe flip🚀 EMA Cross Strategy v5 (30 Lots) (15 min candle only)— Safe Flip Edition
Fully Automated | Fast | Reliable | Battle-tested
Welcome to a clean, powerful, and automation-friendly EMA crossover system.
This strategy is built for traders who want consistent trend-based entries without the risk of unwanted pyramiding or doubled positions.
🔥 How It Works
This strategy uses a fast EMA (10) crossing a slow EMA (20) to detect trend shifts:
Bullish Crossover → LONG (30 lots)
Bearish Crossover → SHORT (30 lots)
Every opposite signal safely flips the position by first closing the current trade, then opening a fresh position of exactly 30 lots.
No doubling.
No runaway position size.
No surprises.
Just clean, mechanical trend-following.
📈 Why This Strategy Stands Out
Unlike basic EMA crossbots, this version:
✔ Prevents unintended pyramiding
✔ Never over-allocates capital
✔ Works perfectly with webhook-based automation
✔ Produces stable, systematic entries
✔ Executes directional flips with precision
🔍 Backtest Highlights (1-Year)
(Backtests will vary by instrument/timeframe)
1,500+ trades executed
Profit factor above 1.27
Strong trend performance
Balanced long/short behavior
No margin calls
Consistent trade execution
This strategy thrives in trending markets and maintains strict discipline even in choppy conditions.
⚙️ Automation Ready
Designed for automated execution via webhook and API setups on supported platforms.
Just connect, run, and let the bot follow the rules without hesitation.
No emotions.
No overtrading.
No fear or greed.
Pure logic.

EMA Cloud 9/30/60 – Visual Trend Strength - CryptowitchThis indicator displays three Exponential Moving Averages (EMAs):
🔸 EMA 9 (short-term)
🔸 EMA 30 (mid-term)
🔸 EMA 60 (long-term)
A dynamic cloud is drawn between EMA 9 and EMA 30 to visually highlight trend momentum:
Green cloud = bullish momentum (EMA 9 above EMA 30)
Red cloud = bearish momentum (EMA 9 below EMA 30)
This cloud setup helps quickly identify trend direction, momentum shifts, consolidation zones, and potential entry/exit points.
Clean, visual, and effective – suitable for scalpers, swing traders, and trend followers alike.

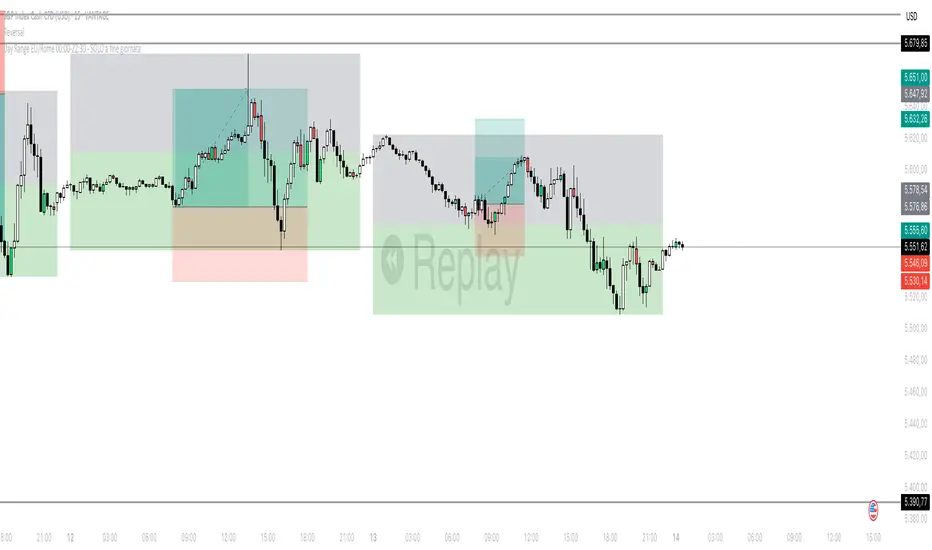
Day Range EU/Rome 00:00-22:30 Final Version# Day Range EU/Rome 00:00–22:30 — live + historical (colors)
**What it does**
Draws, for each day (timezone **Europe/Rome**), a rectangle that contains the **high** and **low** recorded between **00:00** and **22:30**.
* During the day it creates a **live box** that updates bar by bar (it extends to the latest candle).
* At the end of the session (after 22:30) it saves a **fixed historical box** for that day.
* The rectangle is **split horizontally**: half **top** and half **bottom** (customizable colors).
* Boxes are **anchored in time** (*xloc = bar\_time*): they don’t “slide” when you zoom or pan the chart.
* Works on **intraday** timeframes (recommended **15m**; also fine on 5m, 30m, 1h).
* Includes **all days**, **Friday included**.
---
## How it works
* The code detects the **00:00 → 22:30 (Europe/Rome)** session with `time("0000-2230","Europe/Rome")`.
* Within that window it continuously updates the day’s **High/Low**.
* When the **session closes** it creates two historical boxes (upper and lower halves) using the **H/L** of the day that just ended.
* The current day’s box remains **live** and follows the chart until 22:30.

Day Range EU/Rome 00:00-22:30 - live + storico (colori)# Day Range EU/Rome 00:00–22:30 — live + historical (colors)
**What it does**
Draws, for each day (timezone **Europe/Rome**), a rectangle that contains the **high** and **low** recorded between **00:00** and **22:30**.
* During the day it creates a **live box** that updates bar by bar (it extends to the latest candle).
* At the end of the session (after 22:30) it saves a **fixed historical box** for that day.
* The rectangle is **split horizontally**: half **top** and half **bottom** (customizable colors).
* Boxes are **anchored in time** (*xloc = bar\_time*): they don’t “slide” when you zoom or pan the chart.
* Works on **intraday** timeframes (recommended **15m**; also fine on 5m, 30m, 1h).
* Includes **all days**, **Friday included**.
---
## How it works
* The code detects the **00:00 → 22:30 (Europe/Rome)** session with `time("0000-2230","Europe/Rome")`.
* Within that window it continuously updates the day’s **High/Low**.
* When the **session closes** it creates two historical boxes (upper and lower halves) using the **H/L** of the day that just ended.
* The current day’s box remains **live** and follows the chart until 22:30.
ES OHLC BASED ON 9:301. RTH Price Levels
YC (Yesterday's Close): Previous day's RTH closing price at 4:00 PM ET
0DTE-O (Today's Open): Current day's RTH opening price at 9:30 AM ET
T-E-M (Today's Europe-Asia Midpoint): Midpoint of overnight session high/low
T-E-R (Today's Europe-Asia Resistance): Overnight session high
T-E-S (Today's Europe-Asia Support): Overnight session low
Y-T-M (Yesterday-Today Midpoint): Midpoint between YC and 0DTE-O
2. Previous Bar Percentage Levels
Displays 50% retracement level for all bars
Shows 70% level for bullish bars (close > open)
Shows 30% level for bearish bars (close < open)
Lines automatically update with each new bar
3. Custom Support/Resistance Lines
Up to 4 customizable horizontal levels (2 resistance, 2 support)
Useful for marking key psychological levels or pivot points
4. VIX-Based Options Strategy Suggestions
Real-time VIX value display
Time Zone Handling
The indicator is configured for Central Time (CT) as Pine Script's default:
RTH Open: 8:30 AM CT (9:30 AM ET)
RTH Close: 3:00 PM CT (4:00 PM ET)
Overnight session: 7:00 PM CT to 8:30 AM CT next day
Usage Notes
Chart Requirement: This indicator only works on 5-minute timeframe charts
Auto-refresh: All lines and labels automatically refresh at each new trading day's RTH open
24-hour Market: Designed for ES futures which trade nearly 24 hours
Visual Clarity: Different line styles and colors for easy identification
Ideal For
Day traders focusing on ES futures
0DTE options traders needing key reference levels
Traders using overnight gaps and previous day's levels
Those incorporating VIX-based strategies in their trading

[Unxi]McClellan Summation Index for DAX 30 (GER30) [modified]About McClellan Summation Index
The McClellan Summation Index is a market breadth indicator which was developed by Sherman and Marian McClellan. It is based on the McClellan Oscillator and add its values together, effectively running a total. The index goes up when the McClellan Oscillator is positive and goes down when it is negative. Signals can be derived from the index crossing the middle line (bullish when it's crossing up and bearish when it's crossing down). Other potential signals include divergences and overbought and oversold conditions. The indicator is best used in combination with other analysis techniques.
About this implementation
This version here is a modification of the McClellan Summation Index.
It runs the simple version of the McClellan Oscillator and uses the simple method to calculate the Summation Index. No ratios are used in this implementation.
Further information:
- It can only be used on the DAX index ( DAX 30 or GER 30)
- It only considers the DAX 30 stocks
- The data window will provide a summary about rising and declining stocks
- The data window will output the last change for each of the 30 stocks
- The script is pretty slow because it has to calculate the change for each bar individually (instead of receiving a complete calculation from the stock exchange).
DISCLAIMER
This script was mainly written for educational purposes (training myself how to write custom indicatotors).
As you can see, the code is really messy.
FOR YOUR INFORMATION: This script will work on any time period. It is recommended to use it with timeperiod = 1d, though. Just use whatever timeperiod you are comfortable with, the indicator will automatically adjust accordingly.
Credits
Based on the simple version of aftabmk and of code from lazybear.

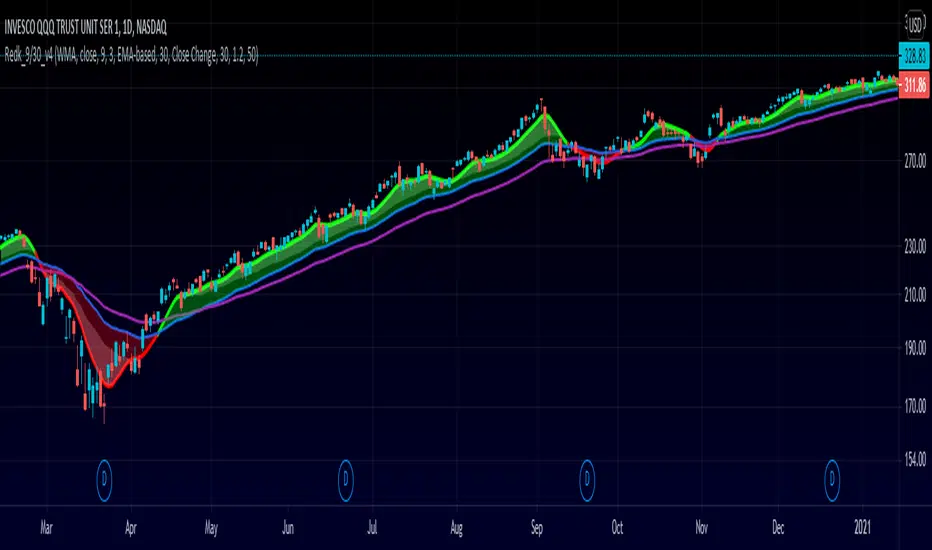
RedK_9/30 Trader_v1: aka The MusicianThis is my implementation of a simple trading system inspired by the 9/30 trading strategy, which i came across few years ago. i hope some traders are still using it :)
(please google "9/30 trading strategy" if you're not sure what it is)
- the improvements i added focus on: faster (long/short) signals, discovery of best entry "zone", ride the trend
- no exit option, trader can use a pre-set target, a trailing stop, or any other mechanisms
- i tried to explain some of the definitions and rules on the below chart
- in spite if its simplicity, the 9/30 has a lot to offer - different traders will also use it differently and add their own "do's and don't's"
default settings should be adjusted to suit timeframe, type of trader and what is being traded (Stocks, FOREX,..etc) - the concept itself is very flexible and well-tested for mechanical trading.
code-named "The Musician" due to the 5-line plot :)
i will continue to improve this work whenever i find time - i liked it a lot.. (please tag the idea to receive the updates)
Extras and improvements (compared to the classic 9/30 concept)
---------------------------------------------------------------------------------
* signal line is a smoothed zero-lag WMA of a shorter length (responds faster to trend change = faster signal)
* instead of a single longer MA line, we utilize an "average range" -based channel (not ATR, but provides the same concept) to provide the ideal "entry zones" in both directions - an adjustable multiplier is included in the settings to adjust the channel width
* adds an optional long EMA as additional filter (take longs only above, take shorts only below)
* clearer visualization
What's next:
==============
* clean-up code
* add signals (arrow-up & arrow-dn) for entry and for exit
* tri-color signal line (green on long, red on short, gray on no trade)
* other options for the channel (ATR-based, DC center-line..etc)
* other MA-type options for the Filter MA (SMA, WMA ?)
* maybe: convert to strategy and back-test
Please feel free to explore and test - Comments and feedback are welcome.
Good Luck!
Sharpshooter 30 – EMA DistanceSharpshooter 30 – EMA Distance Pullback Detector
This indicator is designed for disciplined traders who prefer to wait for deep pullbacks
after a clear trend shift. Following a 7/200 EMA death cross, the script “arms” and waits
for the Fast EMA to move a configurable USD distance below the Slow EMA.
When this distance threshold is reached and confirmed by a closed bar,
the script plots a single BUY signal — signaling a potential rebound entry point.
Recommended timeframe: 5-minute chart (XAU/USD works best)
Key features:
• Adjustable EMA lengths
• Adjustable USD distance threshold
• One-time signal logic to avoid overplotting
Philosophy:
"Always wait" — patience defines precision. The method aims to catch
the first high-probability retracement after trend exhaustion.
日本語説明:
Sharpshooter 30は、トレンド転換後の押し目を狙うトレーダー向けのインジケーターです。
7/200 EMAのデッドクロス後、Fast EMAがSlow EMAより一定金額(例:30ドル)下回った確定足でBUYを1度だけ点灯します。
ルールを守り、焦らず待つことを目的としています。
推奨時間軸:5分足(特にXAU/USDで効果的)
MA期間や乖離幅は調整可能。

Swing Guardrail — 30-sec Midterm Check (EBITDA Margin & EV/EBITDWhat it does
Before a short-term swing entry, this indicator right-sizes positions by a quick midterm (3–12m) durability screen using two fundamentals:
EBITDA Margin (TTM) → earning power / operational resilience
EV/EBITDA (TTM) → price tag vs earning capacity (payback feel)
A high-contrast table (top-right) shows both metrics and a verdict:
PASS — both meet thresholds → normal size
HALF — only one meets → reduce size
FAIL — neither meets → avoid
Why check “midterm” for a short-term trade?
Short swings still face earnings/news gaps, failed breakouts, and regime shifts. Names with weak margins or stretched valuation tend to break faster and deeper. A 30-sec durability check helps you:
Filter fragile setups (avoid expensive + weakening names)
Stabilize drawdowns (size down when quality/price don’t align)
Keep timing unchanged while improving risk-adjusted returns
Inputs (defaults)
Min EBITDA Margin % (TTM): 8%
Max EV/EBITDA (TTM): 12
Dark chart? High-contrast colors
How to use with a swing system
Get your entry from price/volume (e.g., Ichimoku cloud break, Kijun reclaim, Tenkan>Kijun; or your A/B/C rules).
Run this check only to set size (not timing).
Optional alerts: Once per bar close for PASS / HALF / FAIL.
Size mapping & event guard
PASS → 100% of your planned size
HALF → ~50% size / tighter stops
FAIL → watchlist only
If earnings < ~10 JP business days, drop one tier; ≤3 days → avoid.
Sector guides (tweak as needed)
Software/Internet: Margin ≥ 15%, EV/EBITDA ≤ 18
Industrials/Consumer: Margin ≥ 8%, EV/EBITDA ≤ 12
Retail: Margin ≥ 5–7%, EV/EBITDA ≤ 10–12
Edge cases / substitutions
Banks/Insurers/REITs or net-cash/negative EBITDA: EV/EBITDA may mislead → consider Net Debt/EBITDA or sector metrics (CET1/LTV/DSCR).
Sparse data / fresh listings: numbers may be NA until updates.
Notes & limitations
Data via request.financial() (TTM/most-recent). Some tickers/regions can show NA until fundamentals refresh.
This is a risk-screen / sizing tool, not a buy/sell signal.
Disclaimer
Educational use only. Not investment advice.
日本語
タイトル
スイング用ガードレール―中期“壊れにくさ”30秒チェック(EBITDAマージン & EV/EBITDA, TTM)
概要
短期スイングのエントリー前に、中期(3〜12か月)の耐久性を2指標で素早く確認し、ポジションサイズを決めるためのツールです。
EBITDAマージン(TTM):事業の稼ぐ力・体力
EV/EBITDA(TTM):その体力に対する“値札”(回収年数の感覚)
右上の高コントラスト表に数値と判定を表示:
PASS:両方クリア → 通常サイズ
HALF:片方のみ → サイズ半分
FAIL:両方NG → 見送り
なぜ短期でも“中期”を確認?
短期でも決算・ニュースのギャップ、ブレイク失敗、地合い転換は起きます。マージンが弱い/割高すぎる銘柄は崩れやすく、戻りも鈍い傾向。30秒の耐久性チェックで
脆いセットアップを回避
ドローダウンを平準化(サイズで吸収)
タイミングは変えずに、リスク調整後リターンの改善を狙えます。
入力(既定)
最低EBITDAマージン:8%
最大EV/EBITDA:12
黒背景向け:高コントラスト表示
使い方(スイング手法と併用)
まずは価格シグナル(一目の雲上抜け/基準線回復/転換線>基準線、またはA/B/Cルール)。
本インジの判定でサイズのみ決定(エントリーのタイミングは出しません)。
任意でバー確定アラート(PASS/HALF/FAIL)を設定。
サイズ目安 & イベント抑制
PASS:計画サイズ100%
HALF:約50%(ストップもタイトに)
FAIL:見送り
決算まで≦10営業日なら1段階サイズダウン、≦3営業日は原則見送り。
セクター目安(調整推奨)
ソフト/ネット:マージン 15%以上、EV/EBITDA 18以下
工業/一般消費:マージン 8%以上、EV/EBITDA 12以下
小売:マージン 5〜7%以上、EV/EBITDA 10〜12以下
例外・代替
銀行・保険・REIT/ネットキャッシュ・EBITDAマイナス:EV/EBITDAは適さない場合 → Net Debt/EBITDAやCET1/LTV/DSCR等で補助。
新規上場・データ薄:更新までNAのことあり。
注意
データは request.financial() を使用。更新前はNAの可能性。
本ツールはリスク確認/サイズ調整用で、売買シグナルではありません。
免責
情報提供のみ。投資判断は自己責任で。

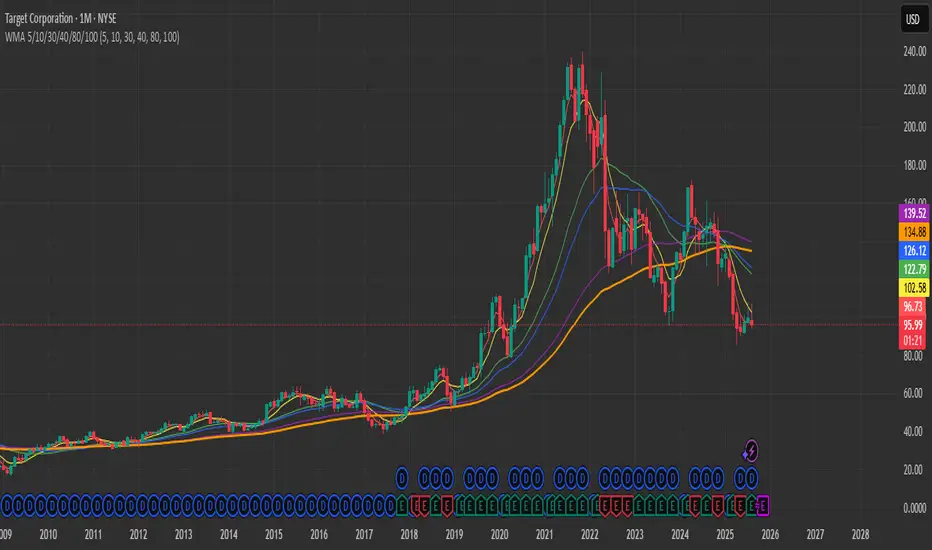
WMA 5/10/30/40/80/1006 WMAs on the chart: 5, 10, 30, 40, 80, and 100 — each in its own color.
This indicator plots multiple Weighted Moving Averages (WMA) on the price chart: 5, 10, 30, 40, 80, and 100.
Shorter WMAs (5 & 10) react quickly to price changes and are useful for short-term trend detection.
Longer WMAs (30, 40, 80, 100) help identify medium- to long-term trends and dynamic support/resistance zones.
Traders often watch for crossovers between short-term and long-term WMAs as potential trade signals.
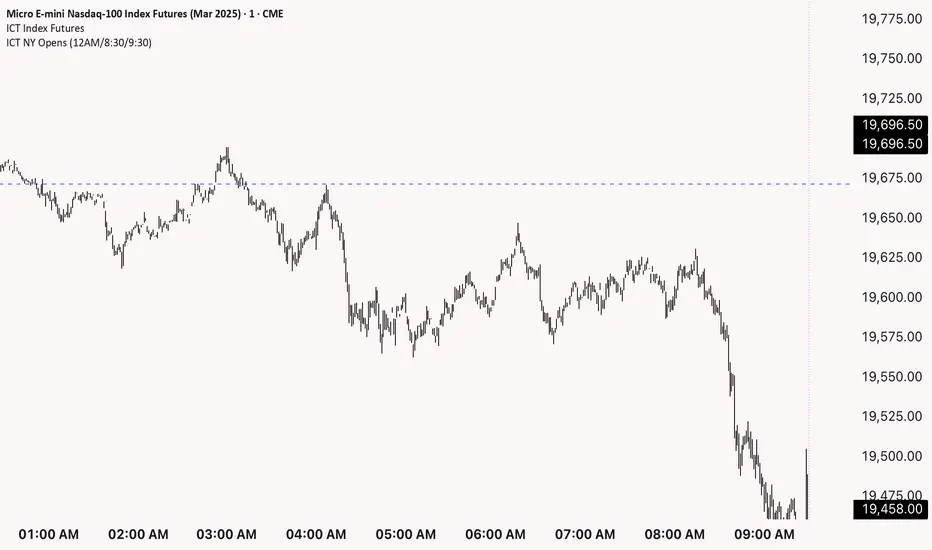
ICT NY Opens (12AM/8:30/9:30)This indicator plots three key New York session reference levels used by ICT traders and intraday scalpers: the Midnight Open (12:00 AM EST), the 8:30 AM EST level (common macro print window), and the 9:30 AM EST RTH open. Each line is drawn at that day’s opening price for the specified time and extends horizontally to 4:15 PM TDC so you always have clean, fixed anchors for the entire trading day.
10 Monday's 1H Avg Range + 30-Day Daily RangeWhat This Script Does
This indicator is designed for traders who want to monitor volatility and range behavior at the start of the trading week . It focuses specifically on the first four 15-minute candles of each Monday and tracks their combined high-low range over time.
How It Works
Monday 1H Range Detection:
Each week, it automatically detects and highlights the first 4 candles of Monday on a 15-minute chart (1 hour total). It calculates the range between the highest high and lowest low of these candles.
10-Week Average of Monday 1H Ranges:
It stores and averages the last 10 such ranges, displaying this average in a table for weekly comparison.
30-Day Daily Range Average:
Separately, it calculates the average daily range (high – low) of the last 30 daily candles. This value helps put the Monday 1H range into broader context and can guide Stop Loss or TP planning.
Dynamic Labeling & Visual Highlights:
The script visually highlights the first 4 candles of Monday and places a label showing the pip range once the 4 candles have completed. It also updates a small table with the two averages described above.
How to Use It
Use it on the 15-minute timeframe to activate the Monday 1H logic.
Compare the current week’s Monday range to the 10-week average to see if volatility is increasing or decreasing.
Use the 30-day daily range to determine if the Monday opening movement is unusually large or small.
Consider adjusting trade entries, stops, or targets if the Monday range is disproportionately large compared to recent historical behavior.
What Makes It Original?
This is not a typical volatility indicator like ATR or standard deviation. Instead, it’s a purpose-built tool combining:
Time-specific behavior (first hour of the week),
Historical contextualization (10-week average tracking),
A dual-timeframe analysis (15-min + daily),
A user-friendly table and visual interface.
This script helps intraday or swing traders spot abnormal volatility early in the week and adjust their strategies accordingly—especially in fast-moving Forex or Index markets.

Prev-Day High-Low Box 09:30-15:30This indicator plots a visual range box for the previous day's regular trading session, based specifically on 09:30 AM to 3:30 PM market hours (Eastern Time by default).
Features:
Automatically detects each new trading day
Draws a box from the previous day’s high to low
Box extends into the current session for a set number of bars (default: 160)
Labels mark the previous high and previous low individually
Clean and minimal — only one box and label set is drawn at a time
Works on intraday timeframes (1min, 5min, 15min, etc.)
Use it to:
Identify zones of interest from the last session
Watch for breakouts, reversals, or mean reversion setups
Combine with VWAP, moving averages, or price action for added context
This tool is handy for day traders and scalpers who want to map out the structure of prior sessions during live trading hours.

Bull Flag (9:30-12:00 Only) [One-Liner Fix]🚀 Bull Flag Breakout Strategy | Intraday Momentum (9:30-12:00) 🔥📈
💡 Designed for Intraday Traders who love momentum breakouts and want to automate Bull Flag setups with volume confirmation! This strategy detects strong bullish moves, measures pullbacks, and triggers trades when the first candle makes a new high—ensuring maximum momentum.
⸻
🏆 Why This Strategy?
✅ Bull Flag Pattern Automation – No need to manually spot pullbacks! 🎯
✅ Smart Volume Confirmation – Only enter trades when breakout volume is strong! 📊
✅ Morning Session Focused (9:30 - 12:00 EST) – Trade when momentum is at its peak! ⏰
✅ Customizable ATR & Risk Settings – Adjust pullback %, stop-loss, and take-profit! 🛠️
✅ Backtest-Friendly – See how the strategy performs over time! 🔍
⸻
🎯 How It Works
📌 Step 1: Detects a Bullish Impulse Bar
🔹 Large green candle 🚀
🔹 Candle range > ATR multiplier
🔹 Volume > Average volume threshold
📌 Step 2: Confirms a Valid Pullback
🔸 Pullback must stay within % range of the impulse move 📉
🔸 If the pullback is too deep or takes too long, the setup is ignored ⛔
📌 Step 3: First Candle to Make a New High 📈
🔹 When a candle breaks the previous high and volume confirms, go long! 💰
🔹 Stop-Loss set at pullback low
🔹 Take-Profit at Risk:Reward (R:R) Target 🎯
⸻
🔥 Best For
💎 Scalpers & Day Traders – Capture short-term breakout momentum! ⚡
📊 Backtesters – Optimize ATR, volume, and pullback rules for best performance! 🧪
⏳ Morning Momentum Traders – Focus on 9:30-12:00 AM EST for higher probability setups!
⸻
🚨 Important Notes
🔹 This strategy is not financial advice! 📜
🔹 Always backtest & paper trade before using real money! 📉📈
🔹 Volatility varies – Customize settings based on your trading style! 🔧
🚀 Like this script? Give it a try & let us know how it works for you! 🔥👊
⸻

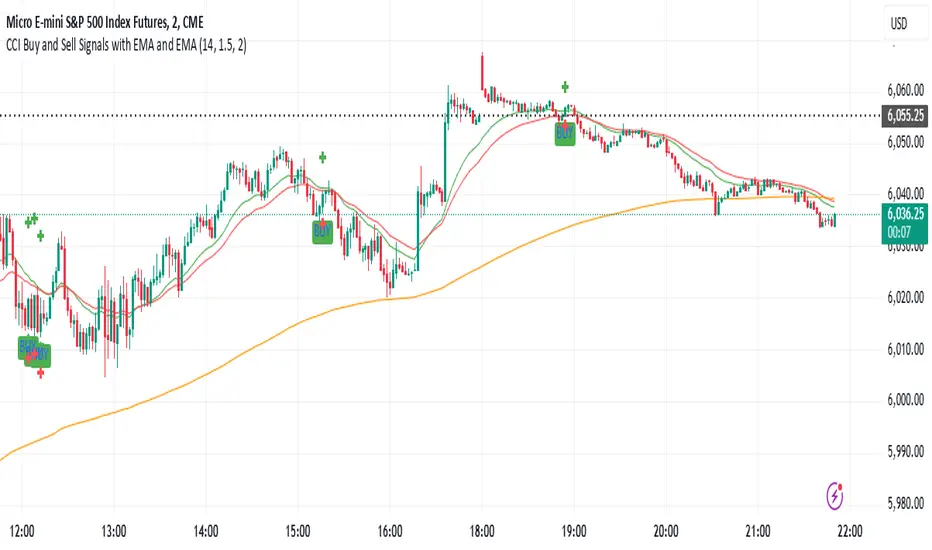
CCI Buy and Sell Signals with 20/30 EMACCI Buy and Sell Signals with EMA and ATR Stop Loss/Take Profit
This indicator is designed to identify buy and sell signals based on a combination of the Commodity Channel Index (CCI) and Exponential Moving Averages (EMA). It also includes an optional ATR-based stop loss and take profit system, which is useful for traders who want to manage their trades with dynamic risk levels.
Features:
CCI Buy and Sell Signals:
Buy Signal: A buy signal is triggered when the CCI crosses up through -100 (from an oversold condition), the 20-period EMA is above the 30-period EMA, and the price is above the 200-period EMA. This suggests that the market is entering an upward trend.
Sell Signal: A sell signal is triggered when the CCI crosses down through +100 (from an overbought condition), the 20-period EMA is below the 30-period EMA, and the price is below the 200-period EMA. This suggests that the market is entering a downward trend.
Exponential Moving Averages (EMA):
The script plots three EMAs:
20-period EMA (Green): Used to identify short-term trends.
30-period EMA (Red): Used to capture medium-term trends.
200-period EMA (Orange): A long-term trend filter, with the price above it generally indicating bullish conditions and below it indicating bearish conditions.
ATR-Based Stop Loss and Take Profit:
Optional Feature: The ATR (Average True Range) indicator can be used to set stop loss and take profit levels based on market volatility.
Stop Loss: Set at a multiple of the ATR below the entry price for long positions and above the entry price for short positions.
Take Profit: Set at a multiple of the ATR above the entry price for long positions and below the entry price for short positions.
Customizable: You can adjust the ATR length, Stop Loss Multiplier, and Take Profit Multiplier through the settings.
Dots: The stop loss and take profit levels are plotted as dots on the chart when the ATR feature is enabled.
Alert Conditions:
Buy Signal Alert: Triggered when a buy signal occurs based on CCI crossing up -100 and other conditions being met.
Sell Signal Alert: Triggered when a sell signal occurs based on CCI crossing down +100 and other conditions being met.
Any Signal Alert: This is a combined alert that triggers for either a buy or sell signal. It helps you stay updated on both types of signals simultaneously.
How to Use:
The indicator will plot buy and sell arrows on the chart, giving clear entry points for trades based on CCI and EMA conditions.
The ATR stop loss and take profit dots (when enabled) provide automatic risk management levels, adjusting dynamically with market volatility.
Traders can customize the ATR settings to fine-tune their stop loss and take profit levels, making this strategy adaptable to different trading styles and market conditions.