FIG - Volume Spread analysis Volume spread analysis is a very powerful tool developed by Tom Williams. Probably considered as the father of Volume spread analysis. He is a Syndicate trader who knows well about how smart moneys are playing their role.
I have developed an Indicator with Trading View called Volume spread analysis. We in FIG strongly believe that, we cannot beat or out perform institutional traders, instead we have to travel along with them . With that in mind we follow the footprints of Smart players who leave behind trails. People who are wise enough pick the trails along with us and earn descent amount of profit.
I have designed this indicator, so that it is capable of giving signals for all the phenomenon explained in the Tom Williams book.
Note The calculation of spread and volume are based on my research and analysis. To know more about me and my trading skills just follow me in trading view.
This Indicator is successful for the following phenomenon presently.
Trapped Buyers
Trapped Sellers
Stopping Volume (long)
Buying Climax
Selling Climax
I will be giving constant updates to indicator whenever a signal becomes successful. Other indicators are under test. so kindly disable those indicators in the settings window,. after an update you can start using other phenomenons.
Stay tuned. Follow us in ( FIG )
Wyszukaj w skryptach "williams"

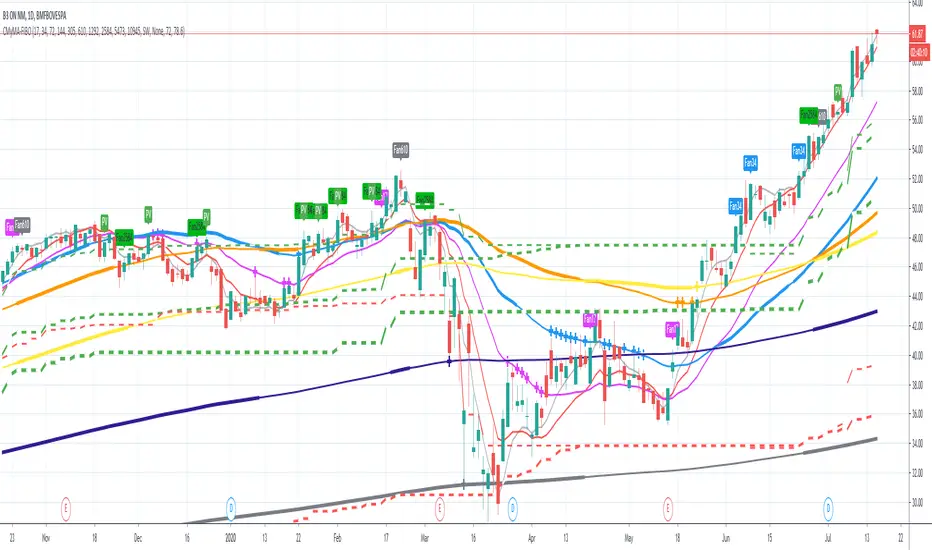
MyMA + FIBOThis script combines 6 Moving Averages (MAs) with 3 Donchian Channel 78.6% and 21.4% intermediary level lines to perform trade analysis. The 6 MAs (I, II, III , IV, V and VI ) default lengths come from one of the Fibonacci Phi^3 and Phi^3/2 sub series (17, 34, 72, 144, 305 and 610), but can be changed to any values, particularly to the traditionally used 20, 40, 50, 100, 200 and 300. Up to my knowledge, Fibonacci Phi^3 and Phi^3/2 sub series lengths were first proposed by Bo Williams.
The used Moving Averages can be chosen between EMA and MyMA. MyMA is a Moving Average that tries to mimic Bo William's MIMA. Due to the close resemblance between MyMA and MIMA, I do not feel comfortable to open this script source code. In order to learn how this script operates with EMAs, please refer to my Custom EMA + Fibo indicator that has its source code open.
The 3 Donchian Channels used have default lengths 72, 305 and 1292, calculated after the first length default value of 72. For each of the 3 Donchian Channels only an upper line, set by default at 78.6%, is plotted in green and its complement, set to 21.4%, is plotted in red. When the closing price is above 3 green lines, we say it is Forbidden to Sell ( PV ), and when the closing price is below 3 red lines, we say it is Forbidden to Buy ( PC ). Those conditions are flagged on the chart. These PV-PC conditions were, up to my knowledge, first proposed by Bo Williams.
This script also includes optional plot of the Giant MAs to help detecting old Resistance and Support lines when the price seems to be doing new historical highs and lows, respectively. These Giant lines have length greater than 1000.
This script also include the indication of the MA Fans. Those fans are formed when 6 Phi^3/2 distant MAs are ordered, for instance, we say there is EMA Fan 610 if close > EMA 17 > EMA 34 > EMA 72 > EMA 144 > EMA 305 > EMA 610. As far as I know, this concept of EMA Fan was first proposed by Bo Williams.
Mean Reversion Oscillator [Alpha Extract]An advanced composite oscillator system specifically designed to identify extreme market conditions and high-probability mean reversion opportunities, combining five proven oscillators into a single, powerful analytical framework.
By integrating multiple momentum and volume-based indicators with sophisticated extreme level detection, this oscillator provides precise entry signals for contrarian trading strategies while filtering out false reversals through momentum confirmation.
🔶 Multi-Oscillator Composite Framework
Utilizes a comprehensive approach that combines Bollinger %B, RSI, Stochastic, Money Flow Index, and Williams %R into a unified composite score. This multi-dimensional analysis ensures robust signal generation by capturing different aspects of market extremes and momentum shifts.
// Weighted composite (equal weights)
normalized_bb = bb_percent
normalized_rsi = rsi
normalized_stoch = stoch_d_val
normalized_mfi = mfi
normalized_williams = williams_r
composite_raw = (normalized_bb + normalized_rsi + normalized_stoch + normalized_mfi + normalized_williams) / 5
composite = ta.sma(composite_raw, composite_smooth)
🔶 Advanced Extreme Level Detection
Features a sophisticated dual-threshold system that distinguishes between moderate and extreme market conditions. This hierarchical approach allows traders to identify varying degrees of mean reversion potential, from moderate oversold/overbought conditions to extreme levels that demand immediate attention.
🔶 Momentum Confirmation System
Incorporates a specialized momentum histogram that confirms mean reversion signals by analyzing the rate of change in the composite oscillator. This prevents premature entries during strong trending conditions while highlighting genuine reversal opportunities.
// Oscillator momentum (rate of change)
osc_momentum = ta.mom(composite, 5)
histogram = osc_momentum
// Momentum confirmation
momentum_bullish = histogram > histogram
momentum_bearish = histogram < histogram
// Confirmed signals
confirmed_bullish = bullish_entry and momentum_bullish
confirmed_bearish = bearish_entry and momentum_bearish
🔶 Dynamic Visual Intelligence
The oscillator line adapts its color intensity based on proximity to extreme levels, providing instant visual feedback about market conditions. Background shading creates clear zones that highlight when markets enter moderate or extreme territories.
🔶 Intelligent Signal Generation
Generates precise entry signals only when the composite oscillator crosses extreme thresholds with momentum confirmation. This dual-confirmation approach significantly reduces false signals while maintaining sensitivity to genuine mean reversion opportunities.
How It Works
🔶 Composite Score Calculation
The indicator simultaneously tracks five different oscillators, each normalized to a 0-100 scale, then combines them into a smoothed composite score. This approach eliminates the noise inherent in single-oscillator analysis while capturing the consensus view of multiple momentum indicators.
// Mean reversion entry signals
bullish_entry = ta.crossover(composite, 100 - extreme_level) and composite < (100 - extreme_level)
bearish_entry = ta.crossunder(composite, extreme_level) and composite > extreme_level
// Bollinger %B calculation
bb_basis = ta.sma(src, bb_length)
bb_dev = bb_mult * ta.stdev(src, bb_length)
bb_percent = (src - bb_lower) / (bb_upper - bb_lower) * 100
🔶 Extreme Zone Identification
The system automatically identifies when markets reach statistically significant extreme levels, both moderate (65/35) and extreme (80/20). These zones represent areas where mean reversion has the highest probability of success based on historical market behavior.
🔶 Momentum Histogram Analysis
A specialized momentum histogram tracks the velocity of oscillator changes, helping traders distinguish between healthy corrections and potential trend reversals. The histogram's color-coded display makes momentum shifts immediately apparent.
🔶 Divergence Detection Framework
Built-in divergence analysis identifies situations where price and oscillator movements diverge, often signaling impending reversals. Diamond-shaped markers highlight these critical divergence patterns for enhanced pattern recognition.
🔶 Real-Time Information Dashboard
An integrated information table provides instant access to current oscillator readings, market status, and individual component values. This dashboard eliminates the need to manually check multiple indicators while trading.
🔶 Individual Component Display
Optional display of individual oscillator components allows traders to understand which specific indicators are driving the composite signal. This transparency enables more informed decision-making and deeper market analysis.
🔶 Adaptive Background Coloring
Intelligent background shading automatically adjusts based on market conditions, creating visual zones that correspond to different levels of mean reversion potential. The subtle color gradations make pattern recognition effortless.
1D
3D
🔶 Comprehensive Alert System
Multi-tier alert system covers confirmed entry signals, divergence patterns, and extreme level breaches. Each alert type provides specific context about the detected condition, enabling traders to respond appropriately to different signal strengths.
🔶 Customizable Threshold Management
Fully adjustable extreme and moderate levels allow traders to fine-tune the indicator's sensitivity to match different market volatilities and trading timeframes. This flexibility ensures optimal performance across various market conditions.
🔶 Why Choose AE - Mean Reversion Oscillator?
This indicator provides the most comprehensive approach to mean reversion trading by combining multiple proven oscillators with advanced confirmation mechanisms. By offering clear visual hierarchies for different extreme levels and requiring momentum confirmation for signals, it empowers traders to identify high-probability contrarian opportunities while avoiding false reversals. The sophisticated composite methodology ensures that signals are both statistically significant and practically actionable, making it an essential tool for traders focused on mean reversion strategies across all market conditions.

Willams %R extreme and MACD DivergenceThis is two different indicators combine into one.
First is the two different period of Williams% 5 mins and 15 mins.
Second is the MACD line of 5 mins chart.
Both will be primarily use on the 5 mins chart, you can use on another time frame if you wish
Williams %:
green = uptrending
red = downtrending
Bright green: overbought condition, look to Short at the end of the signal
Bright Red: oversold condition, look to Long at the end of the signal
MACD:
I also added the MACD line which you can use for divergence
when price move higher and MACD is moving down, expecting price to drop sometime soon or vice versa. See chart for example.

Proxy Index [MTF]Description This indicator is a specialized implementation of the Proxy Index, a market timing tool originally conceptualized by Larry Williams. It is designed to identify potential market reversals by analyzing the relationship between price momentum and real volatility.
Unlike standard oscillators that look at absolute price levels, the Proxy Index measures the duration and intensity of price movement relative to the asset's specific volatility.
Underlying Concepts & Methodology The script operates by normalizing price action against volatility. The calculation logic is as follows:
Momentum Component: The script first calculates the net movement of each bar (Close minus Open) to determine the true directional strength, ignoring gaps.
Smoothing: This raw momentum is smoothed using a Moving Average (default 8-period) to filter out market noise.
Volatility Normalization (ATR): The smoothed value is then divided by the Average True Range (ATR).
Significance: This step adjusts the indicator for changing market conditions. A 50-point move is treated differently in a low-volatility environment versus a high-volatility one.
MTF Dashboard: A built-in table monitors this calculation across Daily, Weekly, and Monthly timeframes simultaneously.
How to Use
Buy Zone (≤ 30): Indicates the asset is historically cheap/oversold relative to its recent volatility.
Sell Zone (≥ 70): Indicates the asset is historically expensive/overbought relative to its recent volatility.
Divergences: Strong signals occur when Price makes a new High/Low, but the Proxy Index fails to confirm it, indicating exhaustion.
Settings
Timeframes: Fully customizable MTF table.
Colors: Dynamic coloring based on Overbought/Oversold zones.
Portugês
Descrição Este indicador é uma implementação especializada do Proxy Index, uma ferramenta de timing de mercado originalmente conceituada por Larry Williams. Ele foi projetado para identificar potenciais reversões de mercado analisando a relação entre o momentum do preço e a volatilidade real.
Ao contrário de osciladores padrão, o Proxy Index mede a duração e intensidade do movimento do preço em relação à volatilidade específica do ativo.
Metodologia
Componente de Momentum: Calcula o movimento líquido da barra (Fechamento - Abertura).
Normalização pela Volatilidade: O valor é dividido pelo ATR (Average True Range). Isso ajusta o indicador para as condições atuais do mercado.
Tabela MTF: Monitora esses dados em múltiplos tempos gráficos simultaneamente.
Como Usar
Zona de Compra (≤ 30): Ativo "barato" em relação à volatilidade.
Zona de Venda (≥ 70): Ativo "caro" em relação à volatilidade.
3. Categorias (Categories)
Marque estas 3 opções (são as que melhor descrevem a matemática do script):
✅ Volatility (Volatilidade) - Pois usa ATR.
✅ Oscillators (Osciladores) - Pois oscila entre 0 e 100.
✅ Trend Analysis (Análise de Tendência) - Pois identifica reversões.

Scout Regiment - KSI# Scout Regiment - KSI Indicator
## English Documentation
### Overview
Scout Regiment - KSI (Key Stochastic Indicators) is a comprehensive momentum oscillator that combines three powerful technical indicators - RSI, CCI, and Williams %R - into a single, unified display. This multi-indicator approach provides traders with diverse perspectives on market momentum, overbought/oversold conditions, and potential reversal points through advanced divergence detection.
### What is KSI?
KSI stands for "Key Stochastic Indicators" - a composite momentum indicator that:
- Displays multiple oscillators normalized to a 0-100 scale
- Uses standardized bands (20/50/80) for consistent interpretation
- Combines RSI for trend, CCI for cycle, and Williams %R for reversal detection
- Provides enhanced divergence detection specifically for RSI
### Key Features
#### 1. **Triple Oscillator System**
**① RSI (Relative Strength Index)** - Primary Indicator
- **Purpose**: Measures momentum and identifies overbought/oversold conditions
- **Default Length**: 22 periods
- **Display**: Blue line (2px)
- **Key Levels**:
- Above 50: Bullish momentum
- Below 50: Bearish momentum
- Above 80: Overbought
- Below 20: Oversold
- **Special Features**:
- Background color indication (green/red)
- Crossover labels at 50 level
- Full divergence detection (4 types)
**② CCI (Commodity Channel Index)** - Dual Period
- **Purpose**: Identifies cyclical trends and extreme conditions
- **Dual Display**:
- CCI(33): Short-term cycle - Green line (1px)
- CCI(77): Medium-term cycle - Orange line (1px)
- **Default Source**: HLC3 (typical price)
- **Normalized Scale**: Mapped from ±100 to 0-100 for consistency
- **Interpretation**:
- Above 80: Strong upward momentum
- Below 20: Strong downward momentum
- 50 level: Neutral
- Divergence between periods: Trend change warning
**③ Williams %R** - Optional
- **Purpose**: Identifies overbought/oversold extremes
- **Default Length**: 28 periods
- **Display**: Magenta line (2px)
- **Scale**: Inverted and normalized to 0-100
- **Best For**: Short-term reversal signals
- **Default**: Disabled (enable when needed for extra confirmation)
#### 2. **Standardized Band System**
**Three-Level Structure:**
- **Upper Band (80)**: Overbought zone
- Strong momentum area
- Watch for reversal signals
- Divergences here are most reliable
- **Middle Line (50)**: Equilibrium
- Separates bullish/bearish zones
- Crossovers indicate momentum shifts
- Key decision level
- **Lower Band (20)**: Oversold zone
- Weak momentum area
- Look for bounce signals
- Divergences here signal potential reversals
**Band Fill**: Dark background between 20-80 for visual clarity
#### 3. **RSI Visual Enhancements**
**Background Color Indication**
- Green background: RSI above 50 (bullish bias)
- Red background: RSI below 50 (bearish bias)
- Optional display for cleaner charts
- Helps identify overall momentum direction
**Crossover Labels**
- "突破" (Breakout): RSI crosses above 50
- "跌破" (Breakdown): RSI crosses below 50
- Marks momentum shift points
- Can be toggled on/off
#### 4. **Advanced RSI Divergence Detection**
The indicator includes comprehensive divergence detection for RSI only (most reliable oscillator):
**Regular Bullish Divergence (Yellow)**
- **Price**: Lower lows
- **RSI**: Higher lows
- **Signal**: Potential upward reversal
- **Label**: "涨" (Up)
- **Most Common**: Near oversold levels (below 30)
**Regular Bearish Divergence (Blue)**
- **Price**: Higher highs
- **RSI**: Lower highs
- **Signal**: Potential downward reversal
- **Label**: "跌" (Down)
- **Most Common**: Near overbought levels (above 70)
**Hidden Bullish Divergence (Light Yellow)**
- **Price**: Higher lows
- **RSI**: Lower lows
- **Signal**: Uptrend continuation
- **Label**: "隐涨" (Hidden Up)
- **Use**: Add to existing longs
**Hidden Bearish Divergence (Light Blue)**
- **Price**: Lower highs
- **RSI**: Higher highs
- **Signal**: Downtrend continuation
- **Label**: "隐跌" (Hidden Down)
- **Use**: Add to existing shorts
**Divergence Parameters** (Fully Customizable):
- **Right Lookback**: Bars to right of pivot (default: 5)
- **Left Lookback**: Bars to left of pivot (default: 5)
- **Max Range**: Maximum bars between pivots (default: 60)
- **Min Range**: Minimum bars between pivots (default: 5)
### Configuration Settings
#### KSI Display Settings
- **Show RSI**: Toggle RSI indicator
- **Show CCI**: Toggle both CCI lines
- **Show Williams %R**: Toggle Williams %R (optional)
#### RSI Settings
- **RSI Length**: Period for calculation (default: 22)
- **Data Source**: Price source (default: close)
- **Show Background**: Toggle green/red background
- **Show Cross Labels**: Toggle 50-level crossover labels
#### RSI Divergence Settings
- **Right Lookback**: Pivot detection right side
- **Left Lookback**: Pivot detection left side
- **Max Range**: Maximum lookback distance
- **Min Range**: Minimum lookback distance
- **Show Regular Divergence**: Enable regular divergence lines
- **Show Regular Labels**: Enable regular divergence labels
- **Show Hidden Divergence**: Enable hidden divergence lines
- **Show Hidden Labels**: Enable hidden divergence labels
#### CCI Settings
- **CCI Length**: Short-term period (default: 33)
- **CCI Mid Length**: Medium-term period (default: 77)
- **Data Source**: Price calculation (default: HLC3)
- **Show CCI(33)**: Toggle short-term CCI
- **Show CCI(77)**: Toggle medium-term CCI
#### Williams %R Settings
- **Length**: Calculation period (default: 28)
- **Data Source**: Price source (default: close)
### How to Use
#### For Basic Momentum Trading
1. **Enable RSI Only** (primary indicator)
- Focus on 50-level crossovers
- Enable crossover labels for signals
2. **Identify Momentum Direction**
- RSI > 50 = Bullish momentum
- RSI < 50 = Bearish momentum
- Background color confirms direction
3. **Look for Extremes**
- RSI > 80 = Overbought (consider selling)
- RSI < 20 = Oversold (consider buying)
4. **Trade Setup**
- Enter long when RSI crosses above 50 from oversold
- Enter short when RSI crosses below 50 from overbought
#### For Divergence Trading
1. **Enable RSI with Divergence Detection**
- Turn on regular divergence
- Optionally add hidden divergence
2. **Wait for Divergence Signal**
- Yellow label = Bullish divergence
- Blue label = Bearish divergence
3. **Confirm with Price Structure**
- Wait for support/resistance break
- Look for candlestick patterns
- Check volume confirmation
4. **Enter Position**
- Enter after confirmation
- Stop beyond divergence pivot
- Target next key level
#### For Multi-Oscillator Confirmation
1. **Enable All Three Indicators**
- RSI (momentum)
- CCI dual (cycle analysis)
- Williams %R (extremes)
2. **Look for Alignment**
- All above 50 = Strong bullish
- All below 50 = Strong bearish
- Mixed signals = Consolidation
3. **Identify Extremes**
- All indicators > 80 = Extreme overbought
- All indicators < 20 = Extreme oversold
4. **Trade Reversals**
- Enter counter-trend when all aligned at extremes
- Confirm with divergence if available
- Use tight stops
#### For CCI Dual-Period Analysis
1. **Enable Both CCI Lines**
- CCI(33) = Short-term
- CCI(77) = Medium-term
2. **Watch for Crossovers**
- Green crosses above orange = Bullish acceleration
- Green crosses below orange = Bearish acceleration
3. **Analyze Divergence Between Periods**
- Short-term rising, medium falling = Potential reversal
- Both rising together = Strong trend
4. **Trade Accordingly**
- Follow crossover direction
- Exit when lines converge
### Trading Strategies
#### Strategy 1: RSI 50-Level Crossover
**Setup:**
- Enable RSI with background and labels
- Wait for clear trend
- Look for retracement to 50 level
**Entry:**
- Long: "突破" label appears after pullback
- Short: "跌破" label appears after bounce
**Stop Loss:**
- Long: Below recent swing low
- Short: Above recent swing high
**Exit:**
- Opposite crossover label
- Or predetermined target (2:1 risk-reward)
**Best For:** Trend following, clear markets
#### Strategy 2: RSI Divergence Reversal
**Setup:**
- Enable RSI with regular divergence
- Wait for extreme levels (>70 or <30)
- Look for divergence signal
**Entry:**
- Long: Yellow "涨" label at oversold level
- Short: Blue "跌" label at overbought level
**Confirmation:**
- Wait for price to break structure
- Check for volume increase
- Look for candlestick reversal pattern
**Stop Loss:**
- Beyond divergence pivot point
**Exit:**
- Take partial profit at 50 level
- Exit remainder at opposite extreme or divergence
**Best For:** Swing trading, range-bound markets
#### Strategy 3: Triple Oscillator Confluence
**Setup:**
- Enable all three indicators
- Wait for all to reach extreme (>80 or <20)
- Look for alignment
**Entry:**
- Long: All three below 20, first one crosses above 20
- Short: All three above 80, first one crosses below 80
**Confirmation:**
- All indicators must align
- Price at support/resistance
- Volume spike helps
**Stop Loss:**
- Fixed percentage or ATR-based
**Exit:**
- When any indicator crosses 50 level
- Or at predetermined target
**Best For:** High-probability reversals, volatile markets
#### Strategy 4: CCI Dual-Period System
**Setup:**
- Enable both CCI lines only
- Disable RSI and Williams %R for clarity
- Watch for crossovers
**Entry:**
- Long: CCI(33) crosses above CCI(77) below 50 line
- Short: CCI(33) crosses below CCI(77) above 50 line
**Confirmation:**
- Both should be moving in entry direction
- Price breaking key level helps
**Stop Loss:**
- When CCIs cross back in opposite direction
**Exit:**
- Both CCIs enter opposite extreme zone
- Or trailing stop
**Best For:** Catching trend continuations, momentum trading
#### Strategy 5: Hidden Divergence Continuation
**Setup:**
- Enable RSI with hidden divergence
- Confirm existing trend
- Wait for pullback
**Entry:**
- Uptrend: "隐涨" label during pullback
- Downtrend: "隐跌" label during bounce
**Confirmation:**
- Price holds key moving average
- Trend structure intact
**Stop Loss:**
- Beyond pullback extreme
**Exit:**
- Regular divergence appears (reversal warning)
- Or trend structure breaks
**Best For:** Adding to positions, trend trading
### Best Practices
#### Choosing Which Indicators to Display
**For Beginners:**
- Use RSI only
- Enable background color and labels
- Focus on 50-level crossovers
- Simple and effective
**For Intermediate Traders:**
- RSI + Regular Divergence
- Add CCI for confirmation
- Use dual perspectives
- Better accuracy
**For Advanced Traders:**
- All three indicators
- Full divergence detection
- Multi-timeframe analysis
- Maximum information
#### Oscillator Priority
**Primary**: RSI (22)
- Most reliable
- Best divergence detection
- Good for all timeframes
- Use this as your main decision maker
**Secondary**: CCI (33/77)
- Adds cycle analysis
- Great for confirmation
- Dual-period crossovers valuable
- Use to confirm RSI signals
**Tertiary**: Williams %R (28)
- Extreme readings useful
- More volatile
- Best for short-term
- Use sparingly for extra confirmation
#### Timeframe Considerations
**Lower Timeframes (1m-15m):**
- More signals, less reliable
- Use tight divergence parameters
- Focus on RSI crossovers
- Quick entries and exits
**Medium Timeframes (30m-4H):**
- Balanced signal frequency
- Default settings work well
- Best for divergence trading
- Swing trading optimal
**Higher Timeframes (Daily+):**
- Fewer but stronger signals
- Widen divergence ranges
- All indicators more reliable
- Position trading best
#### Divergence Trading Tips
1. **Wait for Confirmation**
- Divergence alone isn't enough
- Need price structure break
- Volume helps validate
2. **Best at Extremes**
- Divergences near 80/20 levels most reliable
- Mid-level divergences often fail
- Combine with support/resistance
3. **Multiple Divergences**
- Second divergence stronger than first
- Third divergence extremely powerful
- Watch for "triple divergence"
4. **Timeframe Alignment**
- Check higher timeframe for direction
- Trade divergences in direction of larger trend
- Counter-trend divergences riskier
### Indicator Combinations
**With Moving Averages:**
- Use EMAs (21/55/144) for trend
- KSI for entry timing
- Enter when both align
**With Volume:**
- Volume confirms breakouts
- Divergence + volume divergence = Stronger
- Low volume at extremes = Reversal likely
**With Support/Resistance:**
- Price levels for targets
- KSI for entry timing
- Divergences at levels = Highest probability
**With Bias Indicator:**
- Bias shows price deviation
- KSI shows momentum
- Both diverging = Strong reversal signal
**With OBV Indicator:**
- OBV shows volume trend
- KSI shows price momentum
- Volume/momentum divergence powerful
### Common Patterns
1. **Bullish Reversal**: All oscillators oversold + RSI bullish divergence
2. **Bearish Reversal**: All oscillators overbought + RSI bearish divergence
3. **Trend Acceleration**: RSI > 50, both CCIs rising, Williams %R not extreme
4. **Weakening Trend**: RSI declining while price rising (pre-divergence warning)
5. **Strong Trend**: All oscillators stay above/below 50 for extended period
6. **Consolidation**: Oscillators crossing 50 frequently without extremes
7. **Exhaustion**: Multiple oscillators at extreme + hidden divergence failure
### Performance Tips
- Start simple: RSI only
- Add indicators gradually as you learn
- Disable unused features for cleaner charts
- Use labels strategically (not always on)
- Test different RSI lengths for your market
- Adjust divergence parameters based on volatility
### Alert Conditions
The indicator includes alerts for:
- RSI crossing above 50
- RSI crossing below 50
- RSI regular bullish divergence
- RSI regular bearish divergence
- RSI hidden bullish divergence
- RSI hidden bearish divergence
---
## 中文说明文档
### 概述
Scout Regiment - KSI(关键随机指标)是一个综合性动量振荡器,将三个强大的技术指标 - RSI、CCI和威廉指标 - 组合到一个统一的显示中。这种多指标方法为交易者提供了市场动量、超买超卖状况和通过高级背离检测发现潜在反转点的多元视角。
### 什么是KSI?
KSI代表"关键随机指标" - 一个综合动量指标:
- 显示多个振荡器,标准化到0-100刻度
- 使用标准化波段(20/50/80)便于一致解读
- 结合RSI用于趋势、CCI用于周期、威廉指标用于反转检测
- 专门为RSI提供增强的背离检测
### 核心功能
#### 1. **三重振荡器系统**
**① RSI(相对强弱指数)** - 主要指标
- **用途**:测量动量并识别超买超卖状况
- **默认长度**:22周期
- **显示**:蓝色线(2像素)
- **关键水平**:
- 50以上:看涨动量
- 50以下:看跌动量
- 80以上:超买
- 20以下:超卖
- **特殊功能**:
- 背景颜色指示(绿色/红色)
- 50水平穿越标签
- 完整背离检测(4种类型)
**② CCI(顺势指标)** - 双周期
- **用途**:识别周期性趋势和极端状况
- **双重显示**:
- CCI(33):短期周期 - 绿色线(1像素)
- CCI(77):中期周期 - 橙色线(1像素)
- **默认数据源**:HLC3(典型价格)
- **标准化刻度**:从±100映射到0-100以保持一致性
- **解读**:
- 80以上:强劲上升动量
- 20以下:强劲下降动量
- 50水平:中性
- 周期间背离:趋势变化警告
**③ 威廉指标 %R** - 可选
- **用途**:识别超买超卖极值
- **默认长度**:28周期
- **显示**:洋红色线(2像素)
- **刻度**:反转并标准化到0-100
- **最适合**:短期反转信号
- **默认**:禁用(需要额外确认时启用)
#### 2. **标准化波段系统**
**三层结构:**
- **上轨(80)**:超买区域
- 强动量区域
- 注意反转信号
- 此处的背离最可靠
- **中线(50)**:均衡线
- 分隔看涨/看跌区域
- 穿越表示动量转变
- 关键决策水平
- **下轨(20)**:超卖区域
- 弱动量区域
- 寻找反弹信号
- 此处的背离预示潜在反转
**波段填充**:20-80之间的深色背景,增强视觉清晰度
#### 3. **RSI视觉增强**
**背景颜色指示**
- 绿色背景:RSI在50以上(看涨偏向)
- 红色背景:RSI在50以下(看跌偏向)
- 可选显示,图表更清爽
- 帮助识别整体动量方向
**穿越标签**
- "突破":RSI向上穿越50
- "跌破":RSI向下穿越50
- 标记动量转变点
- 可开关
#### 4. **高级RSI背离检测**
指标仅为RSI(最可靠的振荡器)提供全面背离检测:
**常规看涨背离(黄色)**
- **价格**:更低的低点
- **RSI**:更高的低点
- **信号**:潜在向上反转
- **标签**:"涨"
- **最常见**:在超卖水平附近(30以下)
**常规看跌背离(蓝色)**
- **价格**:更高的高点
- **RSI**:更低的高点
- **信号**:潜在向下反转
- **标签**:"跌"
- **最常见**:在超买水平附近(70以上)
**隐藏看涨背离(浅黄色)**
- **价格**:更高的低点
- **RSI**:更低的低点
- **信号**:上升趋势延续
- **标签**:"隐涨"
- **用途**:加仓现有多头
**隐藏看跌背离(浅蓝色)**
- **价格**:更低的高点
- **RSI**:更高的高点
- **信号**:下降趋势延续
- **标签**:"隐跌"
- **用途**:加仓现有空头
**背离参数**(完全可自定义):
- **右侧回溯**:枢轴点右侧K线数(默认:5)
- **左侧回溯**:枢轴点左侧K线数(默认:5)
- **最大范围**:枢轴点之间最大K线数(默认:60)
- **最小范围**:枢轴点之间最小K线数(默认:5)
### 配置设置
#### KSI显示设置
- **显示RSI**:切换RSI指标
- **显示CCI**:切换两条CCI线
- **显示威廉指标 %R**:切换威廉指标(可选)
#### RSI设置
- **RSI长度**:计算周期(默认:22)
- **数据源**:价格源(默认:收盘价)
- **显示背景**:切换绿色/红色背景
- **显示穿越标签**:切换50水平穿越标签
#### RSI背离设置
- **右侧回溯**:枢轴检测右侧
- **左侧回溯**:枢轴检测左侧
- **回溯范围最大值**:最大回溯距离
- **回溯范围最小值**:最小回溯距离
- **显示常规背离**:启用常规背离线
- **显示常规背离标签**:启用常规背离标签
- **显示隐藏背离**:启用隐藏背离线
- **显示隐藏背离标签**:启用隐藏背离标签
#### CCI设置
- **CCI长度**:短期周期(默认:33)
- **CCI中期长度**:中期周期(默认:77)
- **数据源**:价格计算(默认:HLC3)
- **显示CCI(33)**:切换短期CCI
- **显示CCI(77)**:切换中期CCI
#### 威廉指标 %R 设置
- **长度**:计算周期(默认:28)
- **数据源**:价格源(默认:收盘价)
### 使用方法
#### 基础动量交易
1. **仅启用RSI**(主要指标)
- 关注50水平穿越
- 启用穿越标签获取信号
2. **识别动量方向**
- RSI > 50 = 看涨动量
- RSI < 50 = 看跌动量
- 背景颜色确认方向
3. **寻找极值**
- RSI > 80 = 超买(考虑卖出)
- RSI < 20 = 超卖(考虑买入)
4. **交易设置**
- RSI从超卖区向上穿越50时做多
- RSI从超买区向下穿越50时做空
#### 背离交易
1. **启用RSI和背离检测**
- 打开常规背离
- 可选添加隐藏背离
2. **等待背离信号**
- 黄色标签 = 看涨背离
- 蓝色标签 = 看跌背离
3. **用价格结构确认**
- 等待支撑/阻力突破
- 寻找K线形态
- 检查成交量确认
4. **进入仓位**
- 确认后进入
- 止损设在背离枢轴点之外
- 目标下一个关键水平
#### 多振荡器确认
1. **启用全部三个指标**
- RSI(动量)
- CCI双周期(周期分析)
- 威廉指标 %R(极值)
2. **寻找一致性**
- 全部在50以上 = 强劲看涨
- 全部在50以下 = 强劲看跌
- 信号混合 = 盘整
3. **识别极值**
- 所有指标 > 80 = 极度超买
- 所有指标 < 20 = 极度超卖
4. **交易反转**
- 所有指标在极值一致时逆势进入
- 可能的话用背离确认
- 使用紧密止损
#### CCI双周期分析
1. **启用两条CCI线**
- CCI(33) = 短期
- CCI(77) = 中期
2. **观察穿越**
- 绿色线穿越橙色线向上 = 看涨加速
- 绿色线穿越橙色线向下 = 看跌加速
3. **分析周期间背离**
- 短期上升,中期下降 = 潜在反转
- 两者同时上升 = 强趋势
4. **相应交易**
- 跟随穿越方向
- 线条汇合时退出
### 交易策略
#### 策略1:RSI 50水平穿越
**设置:**
- 启用RSI及背景和标签
- 等待明确趋势
- 寻找回调至50水平
**入场:**
- 多头:回调后出现"突破"标签
- 空头:反弹后出现"跌破"标签
**止损:**
- 多头:近期波动低点之下
- 空头:近期波动高点之上
**离场:**
- 出现相反穿越标签
- 或预定目标(2:1风险收益比)
**适合:**趋势跟随、明确市场
#### 策略2:RSI背离反转
**设置:**
- 启用RSI和常规背离
- 等待极端水平(>70或<30)
- 寻找背离信号
**入场:**
- 多头:超卖水平出现黄色"涨"标签
- 空头:超买水平出现蓝色"跌"标签
**确认:**
- 等待价格突破结构
- 检查成交量增加
- 寻找K线反转形态
**止损:**
- 背离枢轴点之外
**离场:**
- 在50水平部分获利
- 其余在相反极值或背离处离场
**适合:**波段交易、震荡市场
#### 策略3:三重振荡器汇合
**设置:**
- 启用全部三个指标
- 等待全部达到极值(>80或<20)
- 寻找一致性
**入场:**
- 多头:三个全部低于20,第一个向上穿越20
- 空头:三个全部高于80,第一个向下穿越80
**确认:**
- 所有指标必须一致
- 价格在支撑/阻力位
- 成交量激增有帮助
**止损:**
- 固定百分比或基于ATR
**离场:**
- 任一指标穿越50水平时
- 或在预定目标
**适合:**高概率反转、波动市场
#### 策略4:CCI双周期系统
**设置:**
- 仅启用两条CCI线
- 禁用RSI和威廉指标以保持清晰
- 观察穿越
**入场:**
- 多头:CCI(33)在50线下方向上穿越CCI(77)
- 空头:CCI(33)在50线上方向下穿越CCI(77)
**确认:**
- 两者都应朝入场方向移动
- 价格突破关键水平有帮助
**止损:**
- CCI反向穿越时
**离场:**
- 两条CCI进入相反极值区域
- 或移动止损
**适合:**捕捉趋势延续、动量交易
#### 策略5:隐藏背离延续
**设置:**
- 启用RSI和隐藏背离
- 确认现有趋势
- 等待回调
**入场:**
- 上升趋势:回调期间出现"隐涨"标签
- 下降趋势:反弹期间出现"隐跌"标签
**确认:**
- 价格守住关键移动平均线
- 趋势结构完整
**止损:**
- 回调极值之外
**离场:**
- 出现常规背离(反转警告)
- 或趋势结构破坏
**适合:**加仓、趋势交易
### 最佳实践
#### 选择显示哪些指标
**新手:**
- 仅使用RSI
- 启用背景颜色和标签
- 关注50水平穿越
- 简单有效
**中级交易者:**
- RSI + 常规背离
- 添加CCI确认
- 使用双重视角
- 更高准确度
**高级交易者:**
- 全部三个指标
- 完整背离检测
- 多时间框架分析
- 信息最大化
#### 振荡器优先级
**主要**:RSI (22)
- 最可靠
- 最佳背离检测
- 适用所有时间框架
- 用作主要决策依据
**次要**:CCI (33/77)
- 添加周期分析
- 确认效果好
- 双周期穿越有价值
- 用于确认RSI信号
**第三**:威廉指标 %R (28)
- 极值读数有用
- 更波动
- 最适合短期
- 谨慎使用以获额外确认
#### 时间框架考虑
**低时间框架(1分钟-15分钟):**
- 更多信号,可靠性较低
- 使用紧密背离参数
- 关注RSI穿越
- 快速进出
**中等时间框架(30分钟-4小时):**
- 信号频率平衡
- 默认设置效果好
- 最适合背离交易
- 波段交易最优
**高时间框架(日线+):**
- 信号较少但更强
- 扩大背离范围
- 所有指标更可靠
- 最适合仓位交易
#### 背离交易技巧
1. **等待确认**
- 仅背离不够
- 需要价格结构突破
- 成交量帮助验证
2. **极值处最佳**
- 80/20水平附近的背离最可靠
- 中间水平背离常失败
- 结合支撑/阻力
3. **多重背离**
- 第二次背离强于第一次
- 第三次背离极其强大
- 注意"三重背离"
4. **时间框架对齐**
- 检查更高时间框架方向
- 顺大趋势方向交易背离
- 逆势背离风险更大
### 指标组合
**与移动平均线配合:**
- 使用EMA(21/55/144)确定趋势
- KSI用于入场时机
- 两者一致时进入
**与成交量配合:**
- 成交量确认突破
- 背离 + 成交量背离 = 更强
- 极值处低成交量 = 可能反转
**与支撑/阻力配合:**
- 价格水平作为目标
- KSI用于入场时机
- 水平处的背离 = 最高概率
**与Bias指标配合:**
- Bias显示价格偏离
- KSI显示动量
- 两者都背离 = 强反转信号
**与OBV指标配合:**
- OBV显示成交量趋势
- KSI显示价格动量
- 成交量/动量背离强大
### 常见形态
1. **看涨反转**:所有振荡器超卖 + RSI看涨背离
2. **看跌反转**:所有振荡器超买 + RSI看跌背离
3. **趋势加速**:RSI > 50,两条CCI上升,威廉指标不极端
4. **趋势减弱**:价格上升时RSI下降(背离前警告)
5. **强趋势**:所有振荡器长时间保持在50上方/下方
6. **盘整**:振荡器频繁穿越50无极值
7. **衰竭**:多个振荡器在极值 + 隐藏背离失败
### 性能提示
- 从简单开始:仅RSI
- 学习时逐渐添加指标
- 禁用未使用功能以保持图表清晰
- 策略性使用标签(不总是开启)
- 为您的市场测试不同RSI长度
- 根据波动性调整背离参数
### 警报条件
指标包含以下警报:
- RSI向上穿越50
- RSI向下穿越50
- RSI常规看涨背离
- RSI常规看跌背离
- RSI隐藏看涨背离
- RSI隐藏看跌背离
---
## Technical Support
For questions or issues, please refer to the TradingView community or contact the indicator creator.
## 技术支持
如有问题,请参考TradingView社区或联系指标创建者。

Gabriel's Squeeze Momentum📊 Gabriel’s Squeeze Momentum — Deluxe Volatility + Momentum Suite
An advanced, all-in-one squeeze & momentum framework that times volatility compression/expansion and trend shifts, with optional CVD (cumulative volume delta) momentum, ATR zone context, Discontinued Signal Lines (DSL) scalps, Colored DMI trend label, Williams VIX Fix (WVF) low-volatility exhaustion pings, Buff’s VTTI/VPCI volume confirmation, and real-time divergence detection.
What it does:
Discover Squeezes. They occur when volatility contracts, often preceding significant price moves.
Measures momentum with a fast, ATR-normalized linear regression—optionally on Price or CVD—so you see direction and “how hard it’s pushing.”
🧭 Signal Legend ~ Colors the squeeze so you instantly know regime:
🟡 / 🟣 (Tight/Very Tight): Coiled spring; prepare a plan.
🔴 / ⚫ = (Regular/Wide): Watch for Divergences between Price and Momentum.
🟢 (Fired): Expansion started; trade with momentum cross and bias.
Adds context bands at ±1/±2/±3 ATR (“trend / expansion / OB-OS”) to filter late or weak signals.
DSL (Discontinued Signal Lines) give early scalp flips on momentum vs. adaptive bands.
DMI label & triangles communicate trend strength and whether +DI / −DI is in control.
Williams VIX Fix flags capitulation/exhaustion style spikes (with optional VIX proxy).
VTTI/VPCI modules confirm when volume aligns with price trend or contradicts it.
Divergences (regular & hidden) auto-draw with optional live (may repaint) or on-close.
🎢 Squeeze Momentum — How the Logic Works 🎢
The Squeeze Momentum model is built on the principle of volatility compression and expansion. In markets, periods of low volatility are often followed by explosive moves, while high volatility eventually contracts. The “squeeze” seeks to identify these compression phases and prepare traders for the likely expansion that follows.
This indicator achieves that by comparing Bollinger Bands (BB) to Keltner Channels (KC).
Bands: Bollinger vs. Keltner
Bollinger Bands (BB): Calculated using a Simple Moving Average (SMA) of price and standard deviations (σ) of the closing price. The bands expand and contract depending on volatility.
Keltner Channels (KC): Built from an SMA plus/minus multiples of the Average True Range (ATR). Unlike some simplified squeeze indicators that approximate ATR, this implementation uses a true ATR-based KC, ensuring accuracy across different assets and timeframes.
By comparing whether the Bollinger Bands are inside or outside the Keltner Channels, the indicator identifies different squeeze regimes, each representing a distinct volatility environment.
📦 Regime Colors
The squeeze states are color-coded for quick interpretation:
🔹Wide Squeeze (⚫): BB inside KC with a high ATR multiplier. Extremely low volatility, often before major expansion.
🔹Normal Squeeze (🔴): BB inside KC with a moderate ATR multiplier (about 25% more sensitive than Wide). Typical compression setting.
🔹Narrow Squeeze (🟡): BB inside KC with a lower ATR multiplier (about 50% more sensitive than Wide). Signals tighter compression.
🔹Very Narrow Squeeze (🟣): BB inside KC with the lowest ATR multiplier (100% more sensitive than Wide). Indicates extreme coiling.
🔹Fired Squeeze (🟢): BB break outside KC. Marks the release of volatility and potential trend acceleration.
This multi-layered system improves upon classical SQZPRO by using precisely calculated Keltner Channels and multiple sensitivity levels, giving traders more granular information about volatility states.
🔒 Multi-Timeframe Support
The indicator automatically adjusts squeeze thresholds for different timeframes — hourly, 4-hour, daily, weekly, and monthly charts. Each regime has been manually tuned for its timeframe, allowing traders to use the same tool whether scalping, swing trading, or holding longer-term positions.
🎯 Momentum Core
Detecting a squeeze is only half the equation — the indicator also includes a momentum engine to determine direction and strength.
Price momentum is measured as the distance of Close from its Highest High and Lowest Low range, smoothed with a Simple Moving Average, and refined with Linear Regression.
This value is then divided by ATR, normalizing momentum relative to volatility.
Optionally, CVD Mode (Cumulative Volume Delta ÷ Volume) can replace price momentum for assets where order-flow and volume dynamics dominate (e.g., crypto).
🦆 Signal Line
Momentum is paired with a Simple Moving Average signal line:
🔹Bullish: Momentum > Signal.
🔹Bearish: Momentum < Signal.
This crossover logic provides directional bias and filters for false squeezes.
🚀 When to Use Price vs. CVD
CVD Mode (Crypto, FX with tick volume): Best for assets with strong volume/order-flow signals.
Price Mode (Equities, Commodities, Higher TFs): Best for assets with irregular or thin volume data.
🛢️ATR Zones (context filter) 🛢️
Its design is straightforward yet effective: it measures the difference between the current price from its highest highs, lowest lows, and a moving average over a chosen period, then expresses that difference in terms of the Average True Range (ATR) over the same period. By normalizing price deviations against volatility, ATR provides a clear sense of how far and how fast price is moving relative to its “normal” range.
Interpreting the Zone
Positive Values: When it is above zero, price is trading above its HH, LL, and moving average, suggesting bullish momentum. The higher the value, the stronger the momentum relative to volatility.
Negative Values: When the Momentum is below zero, price is trading below its HH, LL, and moving average, signaling bearish momentum. The deeper the reading, the stronger the downside pressure.
Magnitude Matters: Because the Momentum is expressed in ATR units, traders can immediately gauge whether the move is small (less than 1 ATR), moderate (1–2 ATRs), or extreme (3+ ATRs). This makes it especially useful for assessing overbought or oversold conditions in a normalized way.
Strengths:
🔹Volatility-Normalized: Unlike simple squeeze momentum oscillators that have different OB/OS levels, this Momentum adjusts for volatility. This makes signals more consistent across assets with different volatility profiles.
🔹Simplicity:
±1 ATR: trending zone (bulls above +1, bears below −1)
±2 ATR: expansion (keep, add, or trail). Stretch/risk of mean reversion.
±3 ATR: potential exhaustion/mean-revert zone.
🔹Momentum Clarity: By framing momentum in ATR terms, it is easier to distinguish between a small deviation from trend and a genuinely significant move. Sometimes it is a good sign that it trend to ±3/2 ATR, looks for similar directional moves.
Color: The script shades +2/+3 (OB) and −2/−3 (OS) areas and provides swing alerts at ±1 ATR.
💚 What Are Discontinued Signal Lines (DSL)? 💚
In technical analysis, one of the most common tools for smoothing out noisy data is the signal line. This concept appears in many indicators, such as the MACD or stochastic oscillator, where the raw value of an indicator is compared to a smoothed version of itself. The signal line acts as a lagging filter, making it easier to identify shifts in momentum, crossovers, and directional changes.
While useful, the classic signal line approach has limitations. By design, a single smoothed line introduces lag, which means traders may receive signals later than ideal. Additionally, a one-size-fits-all smoothing process often struggles to adapt to different levels of volatility or rapidly changing market conditions.
This is where Discontinued Signal Lines (DSL) come in. DSL is an advanced extension of the traditional signal line concept. Instead of relying on just one smoothed comparison, DSL employs multiple adaptive lines that adjust dynamically to the current state of the indicator. These adaptive lines effectively “discontinue” the dependence on a single, fixed smoothing method, producing a more flexible and nuanced representation of market conditions.
How DSL Works?
Traditional Signal Line: Compares an the Momentum against its own moving average. Provides crossover signals when the raw indicator value moves above or below the smoothed line.
Strength: reduces noise. Weakness: delayed signals and limited adaptability.
DSL Extension: Uses multiple adaptive lines that respond differently to the indicator’s current behavior. Instead of one static moving average, the DSL approach creates faster and slower “reaction lines.” These lines adapt dynamically, capturing acceleration or deceleration in the indicator’s state.
Result: Traders see how momentum is evolving across multiple adaptive thresholds. This reduces false signals and improves responsiveness in volatile conditions.
Benefits of Discontinued Signal Lines
🔹Nuanced Trend Detection
DSL doesn’t just flag when momentum changes direction—it shows the quality of that shift, highlighting whether it is gaining strength, losing steam, or consolidating.
🔹Adaptability Across Markets
Because DSL adjusts to the Momentum’s own dynamics, it works well across different asset classes and timeframes, from equities and futures to forex and crypto.
🔹Earlier Signal Recognition
Multiple adaptive lines allow traders to spot developing trends earlier than with a single smoothed signal line, without being overwhelmed by raw indicator noise.
🔹Better Confirmation
DSL is particularly useful for confirmation. If both adaptive lines agree then a fill is applied in the direction, confidence in the trend is higher as the color turns bull/bear.
🔹Practical Uses
Momentum Trading: Spot acceleration or deceleration in trend strength.
Trend Confirmation: Verify whether a breakout has momentum behind it.
Noise Filtering: Smooth out erratic moves while retaining adaptability.
⚖️ Colored Directional Movement Index (CDMI) ⚖️
The Directional Movement Index (DMI), created by J. Welles Wilder, is one of the most respected trend-following indicators in technical analysis. It is actually a family of three separate indicators combined into one: the +DI (Positive Directional Indicator), the –DI (Negative Directional Indicator), and the ADX (Average Directional Index). Together, they measure not only whether the market is trending but also the strength of that trend. Traders have used the DMI for decades to identify trend direction, gauge momentum, and filter out periods of market noise.
However, despite its reliability, the traditional DMI can be challenging to interpret. Reading three separate lines at once and extracting meaningful signals requires both experience and careful observation. This complexity often discourages newer traders from fully utilizing its power.
The Colored Directional Movement Index (CDMI) is a modern reinterpretation of Wilder’s classic tool. It condenses the same information into a single visual line while using color, shape, and density to communicate what’s happening beneath the surface. The goal is simple: make the DMI’s insights faster to read, easier to act upon, and more intuitive to integrate into trading decisions.
Key Features of CDMI
🔹Color Scale for Trend Strength
The main triangle changes its base color depending on the strength of the DI reading. Dark Red or Green, colors correspond to stronger trends, while faded Gray or lighter yellow tones signal weaker or fading trends. This makes it visually clear when the market is consolidating versus trending strongly.
🔹Color Density for Momentum
Beyond strength, the CDMI uses color density to represent momentum in the trend’s strength. If the ADX is rising (trend gaining momentum), the triangles grows more darker. If the ADX is falling (trend losing momentum), the triangle becomes paler. This provides an instant sense of whether a trend is accelerating or decelerating.
🔹Directional Triangles for Trend Direction
To replace the separate +DI and –DI lines, the CDMI plots small triangle shapes along the bottom axis. An upward-facing triangle indicates that +DI is dominant, confirming bullish direction. A downward-facing triangle signals –DI dominance, confirming bearish direction. This way, both strength and direction are shown without the clutter of multiple overlapping lines.
🔹Label Display for Detailed Values
For traders who want precise data alongside the visuals, CDMI includes a label that shows:
Current trend strength (ADX value).
Current +DI and –DI values.
Momentum status of the ADX (rising or falling).
Historical values of DMI readings, so traders can track how the indicator has evolved over time.
Tooltips are also available to explain “How to read the colored DMI line”, making this version more beginner-friendly.
Why CDMI Matters
The CDMI retains the proven reliability of Wilder’s DMI while solving its biggest drawback—interpretation difficulty. Instead of juggling three separate plots, traders get a single, information-rich line supplemented with intuitive shapes and labels. This streamlined format makes trend verification, momentum analysis, and signal confirmation much faster.
For trading applications, the CDMI can help:
Confirm Entries by showing whether the market is trending strongly enough to justify a position.
Avoid False Signals by filtering out periods of low ADX (weak trend).
Enhance Timing by tracking momentum shifts in trend strength.
By simplifying the complexity of the original DMI into an elegant, color-coded tool, the CDMI makes one of technical analysis’ most advanced indicators practical for everyday use.
😅 The VIX, the Williams Vix Fix, and Market Bottoms 😎
The VIX, formally known as the CBOE Volatility Index, has long been considered one of the most reliable indicators for spotting major market bottoms. Often referred to as the “fear gauge,” it measures the market’s expectation of volatility in the S&P 500 over the next 30 days. When fear grips investors and volatility spikes, the VIX rises sharply. Historically, these moments of extreme fear often coincide with powerful buying opportunities, as markets have a tendency to rebound once panic selling exhausts itself.
Larry Williams, a well-known trader and author, developed the Williams Vix Fix as a way to replicate the insights of the VIX across any tradable asset. While the VIX itself is tied specifically to S&P 500 options, Williams wanted a tool that could capture similar panic-driven dynamics in stocks, futures, forex, and other markets where the VIX is not directly applicable. His “fix” uses price action and volatility formulas to approximate the same emotional extremes reflected in the official VIX, creating almost identical results in practice. This makes the Williams Vix Fix a powerful addition to the trader’s toolbox, allowing the same principle that works on U.S. equities to be applied universally.
One of the most important characteristics of both the VIX and the Williams Vix Fix is that they are far more reliable at signaling market bottoms than market tops. The reason is psychological as much as it is mathematical. At market bottoms, fear and panic are widespread. Retail investors often capitulate, selling in a frenzy as prices drop. This panic drives volatility higher, producing the spikes we see in the VIX. At the same time, professional traders and institutions—those with larger capital and more disciplined strategies—tend to step in when volatility is stretched. They buy when others are fearful, using the panic of retail investors as an opportunity to acquire assets at discounted prices. This confluence of retail panic and institutional buying power is what makes the VIX such a strong bottom-finding tool.
In contrast, at market tops, the dynamic is very different. Tops tend not to be marked by panic or fear. Instead, they form quietly as enthusiasm fades, liquidity dries up, and buying interest wanes. Investors are often complacent, assuming prices will continue to rise, while professional money begins distributing their positions. Because there is no surge in fear, volatility remains muted, and the VIX does not offer a clear warning. This is why traders who rely on the VIX or the Williams Vix Fix must understand its limitations: it is exceptional for detecting bottoms but less useful for anticipating tops.
For traders, the lesson is straightforward. When you see the VIX or Williams Vix Fix spiking to extreme levels, it often indicates a high-probability environment for a rebound. These tools should not be used in isolation, but when combined with support levels, sentiment indicators, and market breadth, they can provide some of the most reliable bottom-fishing signals available. While no indicator is perfect, few have stood the test of time as consistently as the VIX—and thanks to Williams’ adaptation, its power can now be applied to nearly every market.
Indicator Signals (Great in risk-off charts):
🔹Flags spike events (tops/bottoms) with both original and filtered (AE/FE) criteria.
🔹Great as a risk overlay: tighten stops into AE/FE, or require “no spike” to enter.
🤯 Volume Comfirmation: VTTI & VPCI (Buff Dormeier) 🤯
Volume Trend Technical Indicator (VTTI)
The Volume Trend Technical Indicator (VTTI) is a momentum-style tool that analyzes how volume trends interact with price movement. Unlike basic volume measures that simply report how many shares or contracts were traded, the VTTI evaluates whether volume is expanding or contracting in the same direction as the prevailing price trend. The underlying logic is that healthy trends are supported by rising volume, while weakening trends often occur on shrinking volume.
At its core, VTTI looks at the rate of change in volume compared to price movements. By smoothing and normalizing these relationships, the indicator helps traders determine whether momentum is accelerating, decelerating, or diverging.
Rising VTTI: Suggests that volume is confirming the current price trend, strengthening the case for continuation. Flips BG Green after crossing it's signal.
Falling VTTI: Indicates that the trend may be losing participation, often a sign of possible consolidation or reversal. Flips BG Red after crossing it's signal.
Traders often use VTTI to filter entries and exits. For example, if price breaks out but VTTI does not rise above zero, the breakout may lack conviction. On the other hand, when both price and VTTI are aligned, probability of continuation improves.
Volume Price Confirmation Indicator (VPCI)
The Volume Price Confirmation Indicator (VPCI), developed by Buff Dormeier, takes the relationship between price and volume a step further. While traditional indicators like On-Balance Volume (OBV) or Chaikin Money Flow look at cumulative patterns, VPCI breaks price and volume into trend and volatility components and then recombines them to measure how well they confirm each other.
In essence, VPCI asks: “Does volume confirm what price is signaling?”
The formula integrates:
Price Trend Component – whether the market is trending upward or downward.
Volume Trend Component – whether trading activity supports that price trend.
Volatility Adjustments – to account for irregular swings.
The resulting oscillator fluctuates around a zero line:
Positive VPCI: Indicates that price and volume trends are in agreement (bullish confirmation).
Negative VPCI: Suggests that price and volume are diverging (bearish warning or false move).
Crossovers of Zero: Can serve as potential buy or sell signals, depending on context.
A key strength of VPCI is its sensitivity to divergence. When prices continue rising but VPCI begins falling, it often foreshadows a weakening rally. Conversely, a rising VPCI during a flat or down market can highlight early accumulation.
VTTI (Entry Signal) vs. VPCI (Exit Signal)
While both indicators study price-volume dynamics, their focus differs:
VTTI is simpler, emphasizing the trend of volume relative to price for momentum confirmation.
VPCI is more advanced, decomposing both price and volume into multiple components to produce a nuanced oscillator.
Used together, they provide complementary insights. VTTI helps quickly spot whether volume is supporting a move, while VPCI offers deeper confirmation and highlights subtle divergences.
Note: The Up/Down Volume Alert works better on the 4 HR, for Daily scalps or 30 minute for HR scalps. Intraday it's 2/10 minute.
🦅 Divergence toolkit 🦅
Divergences in Technical Analysis
Divergence occurs when the price action of an asset moves in one direction while a technical indicator, such as RSI, MACD, or Momentum, moves in the opposite direction. This disagreement between price and indicator often signals a shift in underlying market dynamics. Traders use divergences to anticipate either potential reversals or continuations in trends.
There are two main types of divergences: regular divergences, which typically precede reversals, and hidden divergences, which suggest continuation of the current trend.
Regular Divergence (Reversal Signals)
A regular divergence occurs when price and indicator disagree during a trend extension. These divergences signal that momentum is no longer fully supporting the current trend and that a reversal may be imminent.
🔹Regular Bullish Divergence
Price Action: Forms a lower low.
Indicator: Forms a higher low.
Interpretation: Price is making new lows, but the indicator is gaining strength. This suggests that selling pressure is weakening, and a reversal to the upside may occur.
Example: RSI rising while price dips to fresh lows.
🔹Regular Bearish Divergence
Price Action: Forms a higher high.
Indicator: Forms a lower high.
Interpretation: Price is reaching new highs, but the indicator shows weakening momentum. This implies that buying pressure is fading, warning of a potential downside reversal.
Example: MACD histogram falling while price makes higher highs.
Regular divergences are often spotted near the end of trends and are most powerful when aligned with key support/resistance levels or overbought/oversold conditions.
Hidden Divergence (Continuation Signals)
A hidden divergence occurs during retracements within a trend. Unlike regular divergences, hidden divergences suggest that the prevailing trend still has strength and is likely to continue.
🔹Hidden Bullish Divergence
Price Action: Forms a higher low.
Indicator: Forms a lower low.
Interpretation: Price is retracing within an uptrend, but the indicator is overshooting downward. This shows that momentum remains intact, supporting continuation upward.
🔹Hidden Bearish Divergence
Price Action: Forms a lower high.
Indicator: Forms a higher high.
Interpretation: Price is retracing within a downtrend, while the indicator overshoots upward. This indicates that bearish momentum remains strong, supporting continuation downward.
Hidden divergences often appear during pullbacks, helping traders time entries in the direction of the prevailing trend.
Practical Use of Divergences
🔹Trend Reversal Alerts – Regular divergences are early warnings that a trend may be ending.
🔹Trend Continuation Signals – Hidden divergences help confirm that retracements are simply pauses, not full reversals.
🔹Confluence with Other Tools – Divergences are more reliable when combined with support/resistance, candlestick patterns, or volume analysis.
🔹Multi-Timeframe Analysis – Spotting divergences on higher timeframes often produces stronger signals.
🕭🔔🛎️ Alert 🛎️🔔🕭
🔹Squeeze
🟢 Fired Squeeze
⚫ Low (Wide) Squeeze / 🔴 Normal / 🟡 Tight / 🟣 Very Tight
🔹Momentum
🐂 Bullish Trend Reversal (Crossover of Momentum and Signal from sub −2)
🐻 Bearish Trend Reversal (Crossover of Momentum and Signal from above +2)
📈 Bullish Swing (cross above +1 ATR) / 📉 Bearish Swing (cross below −1 ATR)
🔹DSL
💚 Bullish DSL Scalp / 💔 Bearish DSL Scalp
🔹Volume
🎯 Strong Up Volume (VPCI > 0 and VTTI up)
⏳ Strong Down Volume (VPCI < 0 and VTTI down)
🔹Divergences
🦅 Bullish, 🦆 Bearish, 🦅 Bullish Hidden, 🦆 Bearish Hidden
Management: Search Vanguard ETFs in your browser, look up full list of VOO holdings. Download it, or copy paste all the ticker symbols. Place that with a AI, just ask it to place , in between each ticker. NVDA, TSLA, AVGO, etc. Create a new watchlist, in the + add all tickers separated by commas. Place a watchlist alert ⚠️ only available for premium + subscribers.
Practical playbook
1) Classic Squeeze Break
Setup: 🔴(D)/🟡(2D)/🟣(3D) squeeze → wait for 🟢(1HR) Fired.
Confirm: Momentum > Signal and above +1 ATR (or DMI strong & rising).
Manage: add on pullbacks that hold +1 ATR; scale near +2 ATR or WVF AE/FE.
2) DSL Scalp in Trend
Setup: Clear trend (DMI strong) + DSL bull/bear trigger in the direction of trend.
Filter: avoid tight/very tight yellow/purple unless you want micro-scalps.
Exit: opposite DSL or ATR midline loss.
3) Mean-Reversion Fade
Setup: Momentum extended to ±3 ATR, WVF spike, and a regular divergence.
Entry: Counter signal only when mom crosses back through ±3 ATR toward mid. Exit early if squeeze ⚫/🔴, Momentum may extend to ±3/2 ATR in the same direction.
Risk: reduce size; this is a fade, not trend following.
4) Volume-Confirmed Breakout
Setup: Squeeze → 🟢 Fired + VPCI > 0 and VTTI up → trend continuation.
Manage: trail behind +1 ATR (long) or −1 ATR (short). 9 SMA works good.
Inputs at a glance (key ones)
Mode: Price or CVD momentum; Squeeze Sensitivity (σ); Momentum Length; Signal Length; ATR Smoothing.
🧮 Colors:
SQZMOM: per squeeze regime, momentum, ATR fills.
DSL: On/Off, Fast/Slow, Length.
ATR Zones: Bullish/Bearish levels (±1), ±2/±3 zone lines & fills.
DMI: Lengths, key & weak thresholds, label on/off.
WVF/VIX: Lookbacks, bands, AE/FE toggles, VIX proxy symbol.
VTTI/VPCI: Fast/slow/signal (VTTI), Short/Long (VPCI), and volume source (Tick/CVD/NVI/PVI/OBV/PVT/AccDist/VWAP).
Divergences: Regular/Hidden toggles, Sensitivity %, Lifetime, Live vs On-Close, Lines/Labels.
🔎 Suggested defaults (feel free to tweak)
Calibration: Size Momentum, so that when it's above zero the asset is trending up. For the signal, it can be kept the same or lower.
Intraday (60–240m): σ = 2.0, 18~20, 3~5, DSL Fast, DMI key 23, weak 17.
Daily/Weekly: keep σ = 2.0, consider DSL Slow, DMI key 25, weak 20, widen ATR filters; lean on VPCI/VTTI (4-HR).
CVD mode: use where tick/volume quality is high (index futures, liquid equities, crypto majors).
🪟 Tips & caveats
Swing Screener: Favor liquid underlyings (index futures/ETFs, large caps). Large-Cap, 2 M Vol, Mid-Cap, 500K Vol. Squeeze: BB( 20) upper < KC (20) upper, and BB (20) lower > KC (20) lower. Optional: Price above 9 SMA, 21 SMA, and 50 SMA, they are my SMA of choice. 200 SMA too, unless you are willing to fish in a bear market. Vice-versa for shorts. Optional: ADX 4 HR > 17, or 23 depending on what you are looking for.
Scalp Screener: Same as above, change the D 9 SMA to 5, and the BB/KC from D to 1 HR. Scalps may last 2~3 days.
Position Screener: Change all daily setting to W, aside from Volume. Optional: PEG < 1.5, FCF > 0, ROA > 8% or ROE > 6%.
Good with Moving averages (9/21/50) and low-volume zones.
Position size by IV, ATR, and account risk. Consider stop/hedge rules around ±2/±3 ATR.
Let alerts stage your watchlist; act only on combined squeeze + momentum signals.
Divergences in live mode can repaint (Real-Time); for algo or alerts, use on-close.
Tight/Very tight squeezes are great for scalps but choppy; combine with DMI rising + VPCI>0.
±3 ATR is exhaustion context, not an auto-fade—look for WVF/Div/DSL confirmation.
For alerts, pair “Fired Squeeze + Bullish Swing” (or bearish) to avoid false starts.
🎯 How to Trade Entry ~ Recap:
Tight/very tight squeeze → fires → momentum crosses up (or DSL bull).
Exit/Flip: Momentum crosses down into/after expansion or hits +2/+3 ATR with fade signs. Filter: Avoid fresh longs at +3 ATR; avoid fresh shorts at −3 ATR unless fading with confirmation.
📐 Options Integrations
✅ Risk Reversal/Modified Risk Reversal (Bullish: Short Put + Long Call)
Use when: Squeeze fires up from 🟡/🟣 and momentum crosses above signal (or zero/DSL).
Playbook Entry: On or just after the bullish fire and momentum upcross. DMI or Volume supports trend as well.
Structure: Sell a put at/just below the −2 ATR reference (or recent swing support). Buy a call at/above the breakout zone (prior high/mid-range +1 to +2 ATR).
A classic risk reversal is a long call plus a short put. That’s a very bullish structure—you gain if the price rallies (via the call), and you collect a premium by selling a put. But it has a naked downside risk. The modified risk reversal fixes that by adding a long lower put (making the short put into a defined put credit spread).
Management: If momentum stays above signal, ride toward +2 → +3 ATR. Sell the put near the current price → receive big premium. Buy the lower put → spend part of that premium (risk cap). Buy the call above the current price → spend more, but the short put premium mostly pays for it.
Exits/Adjust: Momentum downcross or squeeze flips back on (new compression) → reduce. If price retests −1/−2 ATR and holds, you can roll the short put down/out.
Breakout = Big Success; No Breakout = you keep the initial credit. Reversal = Max loss is capped by the long lower put.
✅ Iron Condor (Neutral: Short OTM Put Spread + Short OTM Call Spread)
Use when: Squeeze is active (🟡/🟣), momentum is flat near zero, and there is no directional edge. 🟢 lasts for around 5~8 bars typically. I measure the historical duration of it, and wait for a range period to occur.
Playbook Entry: During compression, set wings outside ±2 ATR (or recent range extremes). I prefer identifying boxes where the rectangle pattern occurs on the chart.
Management: Time decay works while price remains trapped in the coil. High-winrate ~80%, but 1 loser can wipe most of the gains.
Exits/Adjust: If a squeeze fires and momentum breaks hard one way, close the losing side, consider converting to a vertical or rotating to a directional spread aligned with momentum.
4HR-Bullish, closing one wing:
Tip: Align daily/weekly context with your intraday entries. 9 > 50 on Weekly, similar on Daily. Sell premium into compression; switch to directional spreads on expansion and momentum confirmation.
✅ Naked Call/Puts (Directional: 10~30 Delta Calls)
Stick to naked calls and puts when the squeezes are fired from either 🔴 or ⚫.
Look for Strikes slightly out of the money with an OI and Volume spread less than <10%.
If Strike Date is >45, manage 21 Days before expiration. Scalp: Expiration Strikes of 1/4 of the Squeeze period. Leap: Expiration Strikes of 1.75x of the Squeeze period.
📐 Futures Integrations
Playbook Entry:
Verify if the squeeze on the hourly is red or green, and enter on the 2- or 5-minute during a similar squeeze state.
Trend-Following: Traditional 2 Renko Block above 21 SMA and Momentum is bullish, or vice versa. (2~ES, 5~NQ)
Structure: Go long at/just below the ATR reference (or recent swing support). Exit below the breakout zone (prior high/mid-range +1 to +2 ATR).
Management: If momentum stays above +1 ATR ride toward +2 → +3 ATR, etc. House-money, should be kept.
Exits/Adjust: Momentum downcross or squeeze flips back on (new compression) → exit. On Renko Charts, lower the sensitivity to 0.7~1. If price retests 0/−1/−2 ATR and holds, you can enter when the 9 SMA flips. The 50 SMA is better for Daily and up; I wouldn't trade against it then.
📌 FOMO Trading Playbook
Credits & License
Credits: @JF10R (Multi-Timeframe Squeeze), @BigBeluga (DSL), @OskarGallard (Colored DMI base), @ChrisMoody (WVF ideas), @PineCodersTASC (VTTI/VPCI), @EliCobra (Divergence toolkit).
License: Mozilla Public License 2.0 (MPL-2.0).
Author: © GabrielAmadeusLau

Phicube EMASAR ( EMA Support and Resistance )Indicator based on the Concept created by Bo Williams. But unlike the original that uses MIMAs, EMAs are used here.
Exponential moving averages will be shown according to fractal alignment, in order to show the important support and resistance levels ( SAR ).
When the fractals are aligned to become support,
we will have the EMA in the graph with a bright color.
When the fractals are aligned to become resistance, we will have EMA in the graph with a matte color.
Available exponential moving averages: 17,34,72,144,305,610,1292 and 2584
____________________________________________________//_____________________________________________________________________
Indicador baseado no Conceito criado pelo Bo Williams. Mas diferente do original que utiliza MIMAs, aqui é utilizado EMAs.
As médias móveis exponenciais serão mostradas de acordo com o alinhamento dos fractais, com objetivo de mostrar os níveis importantes
de suporte e resistência( SAR ).
Quando estiver com os fractais alinhados virando suporte, teremos no gráfico a EMA com uma cor em tom brilhante.
Quando estiver com os fractais alinhados virando resistência, teremos no gráfico a EMA com uma cor em tom fosco.
Médias móveis exponenciais disponíveis: 17,34,72,144,305,610,1292 e 2584

Custom EMA + FIBOThis script combines 6 EMAs with 3 Donchian Channel 78.6% and 21.4% intermediary level lines to perform trade analysis. The 6 EMAs (I, II, III , IV, V and VI ) default lengthes come from one of the Fibonacci Phi^3 and Phi^3/2 sub series (17, 34, 72, 144, 305 and 610), but can be changed to any values, particularly to the traditionally used 20, 40, 50, 100, 200 and 300. Up to my knowledge, Fibonacci Phi^3 and Phi^3/2 sub series lengthes were first proposed by Bo Williams.
The 3 Donchian Channels used have default lengthes 72, 305 and 1292, calculated after the first length default value of 72. For each of the 3 Donchian Channels only an upper line, set by default at 78.6%, is plotted in green and its complement, set to 21.4%, is plotted in red. When the closing price is above 3 green lines, we say it is Forbidden to Sell ( PV ), and when the closing price is below 3 red lines, we say it is Forbidden to Buy ( PC ). Those conditions are flagged on the chart. These PV-PC conditions were, up to my knowledge, first proposed by Bo Williams.

ViPlay Signal Indicator ProViPlay Signal Indicator Pro is an innovative tool designed for traders looking to enhance the accuracy and effectiveness of their trading decisions. It provides a comprehensive approach to market analysis, generating informative trend change signals based on in-depth market analysis and advanced algorithms.
By adjusting the RISK parameter, traders can customize the signal frequency to match their preferences and trading strategies. This versatile tool is suitable for various trading styles and assets, including Forex, stocks, cryptocurrencies, and commodities, helping traders make informed decisions across any market.
Key Features of the Indicator
1. The RISK parameter controls the frequency of trend change signals. The lower the value, the more frequent the signals will appear, and vice versa. This gives users flexibility in adjusting the indicator according to their strategy.
2. Signal Generation:
Modified Range Oscillator (MRO):
This is the core element of the indicator's functionality. It works in two stages:
– MRO1: This stage focuses on short-term price movements, identifying volatility peaks and potential reversal points that may indicate an upcoming trend change. It is particularly useful for traders looking for quick opportunities.
– MRO2: This stage analyzes long-term trends, filtering out minor market fluctuations. It helps traders focus on more stable movements, reducing the impact of noise.
Williams %R:
This indicator works in conjunction with MRO, confirming reversal points by analyzing market overbought or oversold conditions. This reduces the likelihood of false signals, providing additional confidence in forecasts.
The combination of MRO and Williams %R ensures that traders receive reliable and timely signals, reflecting both immediate market conditions (via MRO1) and long-term trends (via MRO2), making the tool suitable for different trading horizons.
How the components work together:
MRO performs the primary task of identifying potential trend reversal points, dividing the analysis into short-term and long-term perspectives. In the first stage (MRO1), it evaluates market volatility and predicts potential reversals. In the second stage (MRO2), it filters out random fluctuations, providing more stable signals. Williams %R acts as an additional layer of confirmation: if MRO indicates a trend reversal and Williams %R confirms it by showing overbought or oversold conditions, the signal is considered more reliable.
In an uptrend, MRO1 indicates a reversal when the price reaches a local high, while MRO2 confirms the trend's stability. Williams %R further validates this signal, reducing the likelihood of a false entry. In a downtrend, the indicator works similarly, helping traders lock in profits or open short positions.
Williams %R:
Complements MRO by assessing market conditions for overbought or oversold levels. If MRO1 indicates a reversal and Williams %R confirms it, the likelihood of a false signal is significantly reduced.
RISK parameter:
Controls the sensitivity of MRO1 to changes in volatility. At higher values, minor fluctuations are filtered out, which is useful for long-term strategies. At lower values, the signals become more frequent, making it suitable for scalping.
3. Visual Signals:
– Green Up Arrow: Marks potential upward trends.
– Red Down Arrow: Marks potential downward trends, helping traders identify possible entry points
4. How levels are calculated:
Support and resistance levels are calculated based on historical price data. Specifically:
Support 1: This is the minimum price (low) over the last 200 bars.
Support 2: This is the minimum price over the last 500 bars.
Support 3: This is the minimum price over the last 1000 bars.
Resistance 1: This is the maximum price (high) over the last 200 bars.
Resistance 2: This is the maximum price over the last 500 bars.
Resistance 3: This is the maximum price over the last 1000 bars.
The levels are not static; they update with every bar, allowing traders to see current price zones. Users can enable or disable the display of different levels through parameters.
Support and resistance levels help traders identify key points for potential price reversals. The indicator automatically calculates these levels and displays them on the chart, allowing the user to use them for making trading decisions.
How to Use ViPlay Signal Indicator Pro
1. Add the Indicator to the Chart
2. Choose a Timeframe suitable for your trading strategy. The indicator supports all timeframes.
3. Customize Parameters:
Adjust the RISK parameter to control signal frequency (1–49, default 49).
Set the Take-Profit percentage (default 7%).
Configure moving average periods.
Adjust support and resistance levels.
4. Analyze:
– Use informative buy and sell signals based on market analysis.
– Use a customizable Take-Profit level based on the entry price to determine optimal exit points.
– Utilize key support and resistance levels on the selected timeframe to identify optimal entry and exit points.
– The information in the table indicates the strength of the current trend. When the value reaches 0 or 100, the trend changes.
* Note that the indicator serves as an analytical tool and does not replace sound trading strategies.
Uniqueness and Originality
1. Innovative Algorithms
The combination of Modified Range Oscillator (MRO) and Williams %R is not a standard pairing in trading tools. The two-phase approach of MRO provides users with a comprehensive understanding of the market, offering information on both short-term fluctuations and long-term trends, while Williams %R serves as an additional filter to eliminate false signals.
2. The indicator uses mathematical functions such as True Range (TR) to analyze volatility and identify potential entry and exit points.
3. Versatility
The indicator supports all financial market assets, including Forex, stocks, cryptocurrencies, and commodities. It adapts to any trading style or strategy. Additionally, it is compatible with all timeframes, benefiting both short-term and long-term traders.
4. Ease of Use
5. All elements of the indicator can be customized or hidden according to the user’s needs, making it a convenient tool for market analysis. The indicator is compatible with all financial market assets, including Forex, stocks, cryptocurrencies, and commodities.
Important Notes
This indicator is an analytical tool and does not guarantee profits. Signals should be used alongside personal analysis and risk management strategies. Traders should note that no indicator can provide 100% accurate predictions, and there is always a possibility of false signals.

Bullish/Bearish Reversal Bars Indicator [Skyrexio]Introduction
Bullish/Bearish Reversal Bars Indicator leverages the combination of candlestick reversal bar pattern and the Williams Alligator indicator to help traders in understanding where there is a high probability of market reversal or correction. Indicator works for both bearish and bullish cases. It visualizes the bearish and bullish reversal bars with red and green dots and also plots the Alligator's lips to make it more convenient for traders to understand if price is above or below lips line (more information in "Methodology and it's justification" paragraph).
Features
Market Facilitation Index(MFI) filter: with the specified parameter in settings user can choose to filter bullish and bearish reversal bars which passed the MFI condition.
Awesome Oscillator(AO) filter: with the specified parameter in settings user can choose to filter bullish and bearish reversal bars which passed the AO condition.
Alerts: user can set up the alert and have notifications when bullish/bearish reversal bar has been printed.
Methodology and it's justification
In the script’s methodology, we apply the concepts of bullish and bearish reversal bars introduced by Bill Williams in his book Trading Chaos. So, what exactly is a bullish or bearish reversal bar? At its core, it’s a candlestick pattern. A bullish reversal bar is a bar that closes in its upper half, while a bearish reversal bar closes in its lower half.
Why is this type of bar significant? Let’s look at the bullish reversal bar as an example. When the price is trending upward, forming higher highs with each candle, and we suddenly see a bullish bar that makes a new high but ultimately closes in its lower half, it signals a shift in control. Bears have taken control toward the end of that candle's period, pushing the price back down. This can be interpreted as a sign of trend weakness and a potential reversal (or at least a correction).
An additional key point is that a reversal bar often indicates a possible end to the trend. Therefore, for a reversal bar to be valid, several preceding candles should show lower highs (for bullish bars) or higher lows (for bearish bars), reinforcing the likelihood of a trend change.
The second step on methodology is the location of the bar related to Williams Alligator. The Williams Alligator Indicator, developed by Bill Williams, is a technical analysis tool that helps traders identify trends and potential turning points in the market. It consists of three lines, often called the jaw, teeth, and lips of the alligator, each representing different moving averages:
Jaw (Blue Line): A slower moving average, typically a 13-period smoothed moving average shifted 8 bars into the future.
Teeth (Red Line): A medium moving average, typically an 8-period smoothed moving average shifted 5 bars into the future.
Lips (Green Line): A faster moving average, usually a 5-period smoothed moving average shifted 3 bars into the future.
When the three lines are spread out and moving in the same direction, it suggests a strong trend (the "alligator" is "awake and feeding"). When they intertwine, the indicator suggests that the market is moving sideways, or in a range, signaling a lack of clear trend (the "alligator" is "sleeping"). Traders use the Alligator Indicator to enter trades in trending markets and avoid trades in choppy, non-trending markets.
If bullish reversal bar's high is not below and bearish reversal bar's low is not above all three Alligator's lines (jaw, lips, teeth) they cannot be interpreted as these types of bars. It can be explained as following: if we are waiting for the bullish reversal bar it shall be reversal from downtrend. If price is not below all three lines it can't be interpret as the downtrend according to this method. The opposite is true for the bearish reversal bar.
All described above are obligatory conditions for reversal bar, now let's discuss two not obligatory conditions. The first one is Market Facilitation Index (MFI) restriction. Let's briefly look what is MFI. The Market Facilitation Index (MFI) is a technical indicator that measures the price movement per unit of volume, helping traders gauge the efficiency of price movement in relation to trading volume. Here's how you can calculate it:
MFI = (High−Low)/Volume
MFI can be used in combination with volume, so we can divide 4 states. Bill Williams introduced these to help traders interpret the interaction between volume and price movement. Here’s a quick summary:
Green Window (Increased MFI & Increased Volume): Indicates strong momentum with both price and volume increasing. Often a sign of trend continuation, as both buying and selling interest are rising.
Fake Window (Increased MFI & Decreased Volume): Shows that price is moving but with lower volume, suggesting weak support for the trend. This can signal a potential end of the current trend.
Squat Window (Decreased MFI & Increased Volume): Shows high volume but little price movement, indicating a tug-of-war between buyers and sellers. This often precedes a breakout as the pressure builds.
Fade Window (Decreased MFI & Decreased Volume): Indicates a lack of interest from both buyers and sellers, leading to lower momentum. This typically happens in range-bound markets and may signal consolidation before a new move.
For our purposes we are interested in squat bars. This is the sign that volume cannot move the price easily. This type of bar increases the probability of trend reversal. In this indicator we added to enable the MFI filter of reversal bars. If potential reversal bar or two preceding bars have squat state this bar can be interpret as a reversal one.
The second additional filter is Awesome Oscillator. The Awesome Oscillator (AO), developed by Bill Williams, is a momentum indicator that measures market momentum by comparing recent price action to a longer historical context. It helps traders identify potential trend reversals and the strength of trends. Formula:
AO = SMA5(Median Price) − SMA34(Median Price)
where:
Median Price = (High + Low) / 2
SMA5 = 5-period Simple Moving Average of the Median Price
SMA 34 = 34-period Simple Moving Average of the Median Price
If AO is decreasing momentum is bearish, if increasing - bullish. According to Bill Williams approach reversal bars are the potential trades against the trend. As a result we added second filter for bullish reversal bars AO shall be decreasing, for bearish increasing.
How to use indicator
Apply it to desired chart and time frame. It works on every time frame.
Setup the filters with the "Enable MFI" and "Enable AO" checkboxes in the settings. By default they are turned on.
Analyze the price action. Indicator plotted the white line, this is the lips of an Alligator. It will help you to understand how price is moving in comparison to lips line. Indicator will print the green dot and text "BULL" below it current bar is bullish reversal. It will print the red dot and text "BEAR" above it if current bar is interpreted by algorithm as a bearish reversal.
Set up the alerts if it's needed. Indicator has two custom alerts called "Bullish reversal bar has been printed" and "Bearish reversal bar has been printed"
Disclaimer:
Educational and informational tool reflecting Skyrex commitment to informed trading. Past performance does not guarantee future results. Test indicators before live implementation.

W%R Cycle Swings - MTF Trend📄 English Description
Overview
The W%R Cycle Swings – MTF Trend indicator is a market-structure tool built on top of Williams %R cycle logic. It detects meaningful swing highs and lows from W%R behavior, then uses those swings to locate the first Market Structure Shift (MSS-first) and track multi-timeframe trend bias + cancel levels.
This is not a random mashup of indicators: all components are derived from one core concept—W%R cycles—and are combined into a single, coherent framework for reading structure and trend across timeframes.
Core Concepts
1. Williams %R Cycle Swings (Current Timeframe)
Instead of using price swings based only on highs/lows, this script uses Williams %R behavior to define swing points:
Swing High pattern: OS → OB → OS
Swing Low pattern: OB → OS → OB
The script:
Tracks overbought/oversold states using user-defined levels.
Builds a zone for each potential swing (accumulating the extremums during the OB/OS phase).
Confirms a swing only when the opposite state appears again.
Plots labels on the chart:
Swing High label above price
Swing Low label below price
Optional price display on the label (toggle in settings).
This makes the swing points cycle-based rather than purely bar-based.
2. MSS-first (Market Structure Shift on Current TF)
Once swings are defined, the script looks for the first break of the most recent swing:
Bullish MSS-first: price breaks above the last confirmed swing high.
Bearish MSS-first: price breaks below the last confirmed swing low.
You can choose whether to confirm by close or by wick (mssByClose input).
When an MSS-first is detected:
A colored label (bullish/bearish) is drawn at the relevant swing level.
A horizontal line is drawn from the swing bar to the MSS bar to visually connect the structure break.
Internal trendBias is updated to Up or Down, preventing duplicate MSS labels in the same direction.
This gives a clear, visual definition of when the structure actually shifted based on W%R-driven swings.
3. MTF MSS-first Trend & Cancel Logic
The same MSS-first concept is applied inside a function and called via request.security() on multiple timeframes (5m, 15m, 30m, 1h, 4h).
For each timeframe, the function:
Recalculates W%R swings with the same parameters.
Detects MSS-first events (bullish or bearish).
Tracks a trend state:
1 → Up trend
-1 → Down trend
0 → Unknown / Neutral
Maintains a cancel level, which represents the price that would invalidate the current trend:
In an uptrend, cancel is typically the last relevant swing low.
In a downtrend, cancel is typically the last relevant swing high.
This provides:
Trend direction per TF (Up / Down / -)
A concrete price level that acts as a structural “stop” or invalidation level.
4. MTF Trend Table (Visual Overview)
If enabled, a compact table is displayed on the chart (position configurable):
Columns: 5m, 15m, 30m, 1h, 4h
Rows:
Trend → shows Up, Down or -, with color-coded background.
Cancel → shows the current cancel price for that timeframe.
This creates a multi-timeframe structure dashboard that tells you:
Which timeframes are currently in an Up or Down MSS-based trend.
At which price the current structural view would be canceled.
5. Alert Conditions
The script includes alert conditions for:
Current timeframe MSS-first:
Bullish MSS-first (structure break up).
Bearish MSS-first (structure break down).
MTF MSS-first events for:
5m, 15m, 30m, 1h, 4h (Bullish & Bearish separately).
This allows you to receive notifications when a fresh structural shift happens on any of the tracked timeframes.
How to Use
Use Swing High / Swing Low labels to understand the current W%R cycle structure on your main timeframe.
Watch for MSS-first labels to catch the first break of structure after a swing completes.
Use the MTF Trend table:
Trade in the direction of higher-timeframe trends.
Use cancel levels as logical invalidation areas or structural stop guides.
Combine the current timeframe swings with MTF bias:
Example: look for long setups when H1/H4 show Up trend and price forms new bullish MSS on lower TF.
The tool is suitable for both intraday and swing trading, on any symbol and timeframe.
Why This Script Is Original
It links cycle-based swings from Williams %R directly to MSS-first detection, rather than using generic pivot logic.
It combines:
W%R-driven swing definition,
MSS-first structural breaks,
Multi-timeframe trend state,
Cancel (invalidation) levels,
Alerts for MSS events on multiple TFs,
into a single, coherent market-structure framework.
The MTF table is not a generic dashboard: it is specifically built around this W%R-MSS-first structural model, which gives traders both trend context and exact invalidation prices.
🇹🇭 Thai Description — คำอธิบายภาษาไทย
ภาพรวม
อินดิเคเตอร์ W%R Cycle Swings – MTF Trend เป็นเครื่องมืออ่านโครงสร้างราคา โดยใช้ “วงจรของ Williams %R” เป็นหลักในการหา Swing High / Swing Low แล้วใช้จุด Swing เหล่านั้นมาหา MSS-first (จุดเปลี่ยนโครงสร้างครั้งแรก) จากนั้นต่อยอดไปสู่ การดูแนวโน้มหลายกรอบเวลา + ระดับ Cancel (จุดที่โครงสร้างจะถูกมองว่าพัง)
แนวคิดหลัก
Swing จาก Williams %R (TF ปัจจุบัน)
ใช้รูปแบบ OS → OB → OS เพื่อยืนยัน Swing High
และ OB → OS → OB เพื่อยืนยัน Swing Low
เมื่อยืนยันแล้วจะสร้าง Label “Swing High / Swing Low” บนกราฟ และสามารถแสดงราคาบนป้ายได้
ทำให้จุด Swing มีพื้นฐานจาก “Cycle ของ W%R” ไม่ใช่แค่ high/low เฉย ๆ
MSS-first บน TF ปัจจุบัน
ถ้าราคาทะลุ Swing High ล่าสุด → มองเป็น Bullish MSS-first
ถ้าราคาทะลุ Swing Low ล่าสุด → มองเป็น Bearish MSS-first
เลือกได้ว่าจะยืนยันจาก Close หรือจาก ไส้แท่งเทียน
วาดป้าย MSS + เส้นเชื่อมจาก Swing ไปยังจุดที่เกิด MSS
มีตัวแปร trendBias ป้องกันไม่ให้ยิง MSS ซ้ำในทิศทางเดิมจนรก
MTF MSS-first + Cancel Logic
นำ Logic เดียวกันไปใช้กับ TF: 5m, 15m, 30m, 1h, 4h
สำหรับแต่ละ TF จะได้:
สถานะแนวโน้ม: Up / Down / Unknown
ระดับ Cancel: ราคาที่ถ้าหลุดจะถือว่าโครงสร้างเทรนด์นั้นถูก “ยกเลิก”
เช่น ในเทรนด์ขาขึ้น ระดับ Cancel มักมาจาก Swing Low ล่าสุด ฯลฯ
MTF Table บนกราฟ
แสดง Trend + Cancel ของ 5 TF ในรูปแบบตาราง
อ่านง่าย: แถว Trend เป็น Up/Down พร้อมสีพื้น, แถว Cancel เป็นตัวเลขราคา
ใช้ดูภาพรวมโครงสร้างหลาย TF ในมุมมองเดียว
Alert Conditions
แจ้งเตือน MSS-first ของ TF ปัจจุบัน
แจ้งเตือน MSS-first ของ TF 5m / 15m / 30m / 1h / 4h แยก Bull / Bear
วิธีใช้งาน
ใช้ Swing High / Swing Low เพื่อดูว่าโครงสร้าง cycle ปัจจุบันอยู่ตรงไหน
รอให้เกิด MSS-first เพื่อมองว่า “โครงสร้างราคาเริ่มกลับตัวแล้ว”
ใช้ Table MTF:
ดูว่า TF ไหนเป็น Up / Down
ใช้ราคาบรรทัด Cancel เป็นแนว “จุดตัดขาดทุนเชิงโครงสร้าง” หรือจุดเปลี่ยนมุมมอง
เทรดตามทิศทาง TF ใหญ่ แล้วหา Entry จาก MSS ของ TF เล็ก
จุดเด่น / ความเป็น Original
ใช้ Williams %R เป็นฐานในการสร้าง Swing Pattern แทนการใช้ Pivot ธรรมดา
เชื่อม W%R Swing เข้ากับแนวคิด MSS-first อย่างเป็นระบบ
มีทั้ง:
ป้าย Swing
ป้าย MSS + เส้นเชื่อม
MTF Trend + Cancel
Alert เตือน MSS ในหลาย TF
อยู่ในสคริปต์เดียว
เหมาะกับคนที่ต้องการอ่านโครงสร้างราคาแบบมีที่มาที่ไป ไม่ใช่แค่ตามอินดี้ตัวเดียวครับ ✅

Quantum Momentum FusionPurpose of the Indicator
"Quantum Momentum Fusion" aims to combine the strengths of RSI (Relative Strength Index) and Williams %R to create a hybrid momentum indicator tailored for volatile markets like crypto:
RSI: Measures the strength of price changes, great for understanding trend stability but can sometimes lag.
Williams %R: Assesses the position of the price relative to the highest and lowest levels over a period, offering faster responses but sensitive to noise.
Combination: By blending these two indicators with a weighted average (default 50%-50%), we achieve both speed and reliability.
Additionally, we use the indicator’s own SMA (Simple Moving Average) crossovers to filter out noise and generate more meaningful signals. The goal is to craft a simple yet effective tool, especially for short-term trading like scalping.
How Signals Are Generated
The indicator produces signals as follows:
Calculations:
RSI: Standard 14-period RSI based on closing prices.
Williams %R: Calculated over 14 periods using the highest high and lowest low, then normalized to a 0-100 scale.
Quantum Fusion: A weighted average of RSI and Williams %R (e.g., 50% RSI + 50% Williams %R).
Fusion SMA: 5-period Simple Moving Average of Quantum Fusion.
Signal Conditions:
Overbought Signal (Red Background):
Quantum Fusion crosses below Fusion SMA (indicating weakening momentum).
And Quantum Fusion is above 70 (in the overbought zone).
This is a sell signal.
Oversold Signal (Green Background):
Quantum Fusion crosses above Fusion SMA (indicating strengthening momentum).
And Quantum Fusion is below 30 (in the oversold zone).
This is a buy signal.
Filtering:
The background only changes color during crossovers, reducing “fake” signals.
The 70 and 30 thresholds ensure signals trigger only in extreme conditions.
On the chart:
Purple line: Quantum Fusion.
Yellow line: Fusion SMA.
Red background: Sell signal (overbought confirmation).
Green background: Buy signal (oversold confirmation).
Overall Assessment
This indicator can be a fast-reacting tool for scalping. However:
Volatility Warning: Sudden crypto pumps/dumps can disrupt signals.
Confirmation: Pair it with price action (candlestick patterns) or another indicator (e.g., volume) for validation.
Timeframe: Works best on 1-5 minute charts.
Suggested Settings for Long Timeframes
Here’s a practical configuration for, say, a 4-hour chart:
RSI Period: 20
Williams %R Period: 20
RSI Weight: 60%
Williams %R Weight: 40% (automatically calculated as 100 - RSI Weight)
SMA Period: 15
Overbought Level: 75
Oversold Level: 25

Stochastic Vix Fix SVIX (Tartigradia)The Stochastic Vix or Stochastic VixFix (SVIX), just like the Williams VixFix, is a realized volatility indicator, and can help in finding market bottoms as well as tops without requiring bollinger bands or any other construct, as the SVIX is bounded between 0-100 which allows for an objective thresholding regardless of the past.
Mathematically, SVIX is the complement of the original Stochastic Oscillator, with such a simple transform reproducing Williams' VixFix and the VIX index signals of high volatility and hence of market bottoms quite accurately but within a bounded 0-100 range. Having a predefined range allows to find markets bottoms without needing to compare to past prices using a bollinger band (Chris Moody on TradingView) nor a moving average (Hesta 2015), as a simple threshold condition (by default above 80) is sufficient to reliably signal interesting entry points at bottoming prices.
Having a predefined range allows to find markets bottoms without needing to compare to past prices using a bollinger band (Chris Moody on TradingView) nor a moving average (Hesta 2015), as a simple threshold condition (by default above 80) is sufficient to reliably signal interesting entry points at bottoming prices.
Indeed, as Williams describes in his paper, markets tend to find the lowest prices during times of highest volatility, which usually accompany times of highest fear.
Although the VixFix originally only indicates market bottoms, the Stochastic VixFix can also indicate good times to exit, when SVIX is at a low value (default: below 20), but just like the original VixFix and VIX index, exit signals are as usual much less reliable than long entries signals, because: 1) mature markets such as SP500 tend to increase over the long term, 2) when market fall, retail traders panic and hence volatility skyrockets and bottom is more reliably signalled, but at market tops, no one is panicking, price action only loses momentum because of liquidity drying up.
Compared to Hesta 2015 strategy of using a moving average over Williams' VixFix to generate entry signals, SVIX generates much fewer false positives during ranging markets, which drastically reduce Hesta 2015 strategy profitability as this incurs quite a lot of losses.
This indicator goes further than the original SVIX, by restoring the smoothed D and second-level smoothed D2 oscillators from the original Stochastic Oscillator, and use a 14-period ZLMA instead of the original 20-period SMA, to generate smoother yet responsive signals compared to using just the raw SVIX (by default, this is disabled, as the original raw SVIX is used to produce more entry signals).
Usage:
Set the timescale to daily or weekly preferably, to reduce false positives.
When the background is highlighted in green or when the highlight disappears, it is usually a good time to enter a long position.
Red background highlighting can be enabled to signal good exit zones, but these generate a lot of false positives.
To further reduce false positives, the SVIX_MA can be used to generate signals instead of the raw SVIX.
For more information on Williams' Vix Fix, which is a strategy published under public domain:
The VIX Fix, Larry Williams, Active Trader magazine, December 2007, web.archive.org
Fixing the VIX: An Indicator to Beat Fear, Amber Hestla-Barnhart, Journal of Technical Analysis, March 13, 2015, ssrn.com
For more information on the Stochastic Vix Fix (SVIX), published under Creative Commons:
Replicating the CBOE VIX using a synthetic volatility index trading algorithm, Dayne Cary and Gary van Vuuren, Cogent Economics & Finance, Volume 7, 2019, Issue 1, doi.org
Note: strangely, in the paper, the authors failed to mention that the SVIX is the complement of the original Stochastic Oscillator, instead reproducing just the original equation. The correct equation for the SVIX was retroengineered by comparing charts they published in the paper with charts generated by this pinescript indicator.
For a more complete indicator, see:

WilliamTrendFollowerWith this indicator, we try to catch the trends in price. With continued use of this indicator, we expect it to eventually escape horizontal positions and catch up with continuous trends.
Combined with the WilliamsR indicator and the exponential moving average indicator.
The WilliamsR Fisher Transforms are combined with the ATR indicator to create a line that lags behind the moving average value.
Since it is a tracking indicator, we created a line that is more connected to the price and itself.
In this way, a curve close to the price line is obtained in uptrends and downtrends.
In this indicator, if you choose the parameters correctly, you can easily bypass the horizontal positions. This gives you a safe visualization of support and resistance points as well.
With this tracker, you can generate Buy and Sell signals and you can see them on the chart.
From the settings of these indicators, you can set the multiplier and the exponential moving average period.
It works in all time intervals.
But it was calculated without volume , instead it was created using fisher transforms, moving averages, and the average true range .
You can set an alarm for Buy and Sell orders.
You can see the processing entry and exit areas in a straight line.
The Fisher Transform indicator is an oscillator that helps identify trend reversals and can be applied to any financial instrument. J.F. Created by Ehlers
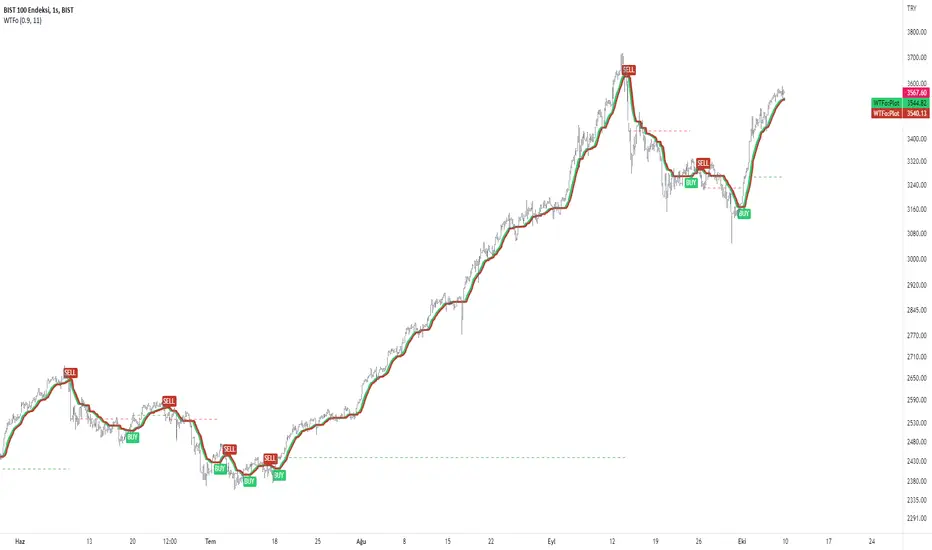
Reversal 2 Bar + W%R🇺🇸 English Description
Reversal 2 Bar + W%R is a clean and powerful price-action indicator designed to detect momentum-based reversal signals by combining multi-bar structure with Williams %R exhaustion zones.
🔍 Core Logic
A reversal signal is triggered when:
Bullish Reversal
The current candle closes above the highest price of the previous 2 candles,
AND Williams %R entered Oversold (≤ OS level) within the last N bars (user-defined window).
Bearish Reversal
The current candle closes below the lowest price of the previous 2 candles,
AND Williams %R entered Overbought (≥ OB level) within the last N bars.
This approach captures real momentum shifts rather than simple wick touches and gives “credit” to signals shortly after the market hits OB/OS zones — ideal for traders who want price-action confirmation after exhaustion.
🎯 Why It Works
Confirms trend exhaustion using W%R OB/OS
Confirms breakout strength using 2-Bar structure
Avoids weak signals by requiring close-based confirmation
The user-defined window (5–10 bars) allows flexibility for different volatility environments
📈 What You Get
Clear bullish/bearish reversal markers (REV↑ / REV↓)
Auto-colored candles for quick trend bias
Optional W%R filtering
Alerts for automated trading or notifications
This indicator is ideal for scalpers, day traders, and swing traders who rely on clean PA signals + strong exhaustion confirmation.
============================================================================
🇹🇭 คำอธิบายภาษาไทย
Reversal 2 Bar + W%R คืออินดิเคเตอร์ Price Action แบบเรียบง่ายแต่ทรงพลัง ที่ออกแบบมาเพื่อหา “สัญญาณกลับตัวที่มีโมเมนตัมจริง” โดยใช้โครงสร้างแท่งเทียน 2 แท่งร่วมกับโซน Overbought/Oversold ของ Williams %R
🔍 หลักการทำงาน
อินดิเคเตอร์จะให้สัญญาณกลับตัวเมื่อ:
ขาขึ้น (Bullish Reversal)
แท่งปัจจุบัน ปิดสูงกว่า high ของ 2 แท่งก่อนหน้า
และ Williams %R เคยเข้าโซน Oversold ภายในช่วง N แท่งล่าสุด (ตั้งค่าได้)
ขาลง (Bearish Reversal)
แท่งปัจจุบัน ปิดต่ำกว่า low ของ 2 แท่งก่อนหน้า
และ Williams %R เคยเข้าโซน Overbought ภายในช่วง N แท่งล่าสุด
วิธีนี้ทำให้สัญญาณกลับตัว “มีความหมาย” กว่าแค่โดนไส้แทง เพราะใช้การปิดทะลุระดับราคา พร้อมยืนยันว่าโมเมนตัมฝั่งตรงข้ามเริ่มหมดแรงจากการเข้าโซน OB/OS แล้ว
🎯 จุดเด่น
ใช้ W%R ช่วยยืนยันว่าเกิด “ภาวะหมดแรง” จริง
ใช้โครงสร้าง 2 Bar เพื่อยืนยัน “การเบรกโครงสร้าง”
เน้นสัญญาณคุณภาพสูงด้วยเงื่อนไข close-based
มีหน้าต่างให้เครดิต 5–10 แท่งหลังเข้าโซน เพื่อไม่ให้สัญญาณกลับตัวหลุดโอกาส
📈 สิ่งที่อินดี้แสดงให้คุณ
จุดกลับตัว REV↑ / REV↓ ชัดเจน
ระบายสีแท่งเพื่อบอก bias
แจ้งเตือน (Alert) ตั้งค่าได้
เลือกเปิด/ปิดการใช้ W%R filter ได้
เหมาะกับเทรดเดอร์ทุกรูปแบบที่ต้องการสัญญาณกลับตัวที่แม่นยำ เข้าใจง่าย และไม่รกจอ

Ultimate Oscillator (ULTOSC)The Ultimate Oscillator (ULTOSC) is a technical momentum indicator developed by Larry Williams that combines three different time periods to reduce the volatility and false signals common in single-period oscillators. By using a weighted average of three Stochastic-like calculations across short, medium, and long-term periods, the Ultimate Oscillator provides a more comprehensive view of market momentum while maintaining sensitivity to price changes.
The indicator addresses the common problem of oscillators being either too sensitive (generating many false signals) or too slow (missing opportunities). By incorporating multiple timeframes with decreasing weights for longer periods, ULTOSC attempts to capture both short-term momentum shifts and longer-term trend strength, making it particularly valuable for identifying divergences and potential reversal points.
## Core Concepts
* **Multi-timeframe analysis:** Combines three different periods (typically 7, 14, 28) to capture various momentum cycles
* **Weighted averaging:** Assigns higher weights to shorter periods for responsiveness while including longer periods for stability
* **Buying pressure focus:** Measures the relationship between closing price and the true range rather than just high-low range
* **Divergence detection:** Particularly effective at identifying momentum divergences that precede price reversals
* **Normalized scale:** Oscillates between 0 and 100, with clear overbought/oversold levels
## Common Settings and Parameters
| Parameter | Default | Function | When to Adjust |
|-----------|---------|----------|---------------|
| Fast Period | 7 | Short-term momentum calculation | Lower (5-6) for more sensitivity, higher (9-12) for smoother signals |
| Medium Period | 14 | Medium-term momentum calculation | Adjust based on typical swing duration in the market |
| Slow Period | 28 | Long-term momentum calculation | Higher values (35-42) for longer-term position trading |
| Fast Weight | 4.0 | Weight applied to fast period | Higher weight increases short-term sensitivity |
| Medium Weight | 2.0 | Weight applied to medium period | Adjust to balance medium-term influence |
| Slow Weight | 1.0 | Weight applied to slow period | Usually kept at 1.0 as the baseline weight |
**Pro Tip:** The classic 7/14/28 periods with 4/2/1 weights work well for most markets, but consider using 5/10/20 with adjusted weights for faster markets or 14/28/56 for longer-term analysis.
## Calculation and Mathematical Foundation
**Simplified explanation:**
The Ultimate Oscillator calculates three separate "buying pressure" ratios using different time periods, then combines them using weighted averaging. Buying pressure is defined as the close minus the true low, divided by the true range.
**Technical formula:**
```
BP = Close - Min(Low, Previous Close)
TR = Max(High, Previous Close) - Min(Low, Previous Close)
BP_Sum_Fast = Sum(BP, Fast Period)
TR_Sum_Fast = Sum(TR, Fast Period)
Raw_Fast = 100 × (BP_Sum_Fast / TR_Sum_Fast)
BP_Sum_Medium = Sum(BP, Medium Period)
TR_Sum_Medium = Sum(TR, Medium Period)
Raw_Medium = 100 × (BP_Sum_Medium / TR_Sum_Medium)
BP_Sum_Slow = Sum(BP, Slow Period)
TR_Sum_Slow = Sum(TR, Slow Period)
Raw_Slow = 100 × (BP_Sum_Slow / TR_Sum_Slow)
ULTOSC = 100 × / (Fast_Weight + Medium_Weight + Slow_Weight)
```
Where:
- BP = Buying Pressure
- TR = True Range
- Fast Period = 7, Medium Period = 14, Slow Period = 28 (defaults)
- Fast Weight = 4, Medium Weight = 2, Slow Weight = 1 (defaults)
> 🔍 **Technical Note:** The implementation uses efficient circular buffers for all three period calculations, maintaining O(1) time complexity per bar. The algorithm properly handles true range calculations including gaps and ensures accurate buying pressure measurements across all timeframes.
## Interpretation Details
ULTOSC provides several analytical perspectives:
* **Overbought/Oversold conditions:** Values above 70 suggest overbought conditions, below 30 suggest oversold conditions
* **Momentum direction:** Rising ULTOSC indicates increasing buying pressure, falling indicates increasing selling pressure
* **Divergence analysis:** Divergences between ULTOSC and price often precede significant reversals
* **Trend confirmation:** ULTOSC direction can confirm or question the prevailing price trend
* **Signal quality:** Extreme readings (>80 or <20) indicate strong momentum that may be unsustainable
* **Multiple timeframe consensus:** When all three underlying periods agree, signals are typically more reliable
## Trading Applications
**Primary Uses:**
- **Divergence trading:** Identify when momentum diverges from price for reversal signals
- **Overbought/oversold identification:** Find potential entry/exit points at extreme levels
- **Trend confirmation:** Validate breakouts and trend continuations
- **Momentum analysis:** Assess the strength of current price movements
**Advanced Strategies:**
- **Multi-divergence confirmation:** Look for divergences across multiple timeframes
- **Momentum breakouts:** Trade when ULTOSC breaks above/below key levels with volume
- **Swing trading entries:** Use oversold/overbought levels for swing position entries
- **Trend strength assessment:** Evaluate trend quality using momentum consistency
## Signal Combinations
**Strong Bullish Signals:**
- ULTOSC rises from oversold territory (<30) with positive price divergence
- ULTOSC breaks above 50 after forming a base near 30
- All three underlying periods show increasing buying pressure
**Strong Bearish Signals:**
- ULTOSC falls from overbought territory (>70) with negative price divergence
- ULTOSC breaks below 50 after forming a top near 70
- All three underlying periods show decreasing buying pressure
**Divergence Signals:**
- **Bullish divergence:** Price makes lower lows while ULTOSC makes higher lows
- **Bearish divergence:** Price makes higher highs while ULTOSC makes lower highs
- **Hidden bullish divergence:** Price makes higher lows while ULTOSC makes lower lows (trend continuation)
- **Hidden bearish divergence:** Price makes lower highs while ULTOSC makes higher highs (trend continuation)
## Comparison with Related Oscillators
| Indicator | Periods | Focus | Best Use Case |
|-----------|---------|-------|---------------|
| **Ultimate Oscillator** | 3 periods | Buying pressure | Divergence detection |
| **Stochastic** | 1-2 periods | Price position | Overbought/oversold |
| **RSI** | 1 period | Price momentum | Momentum analysis |
| **Williams %R** | 1 period | Price position | Short-term signals |
## Advanced Configurations
**Fast Trading Setup:**
- Fast: 5, Medium: 10, Slow: 20
- Weights: 4/2/1, Thresholds: 75/25
**Standard Setup:**
- Fast: 7, Medium: 14, Slow: 28
- Weights: 4/2/1, Thresholds: 70/30
**Conservative Setup:**
- Fast: 14, Medium: 28, Slow: 56
- Weights: 3/2/1, Thresholds: 65/35
**Divergence Focused:**
- Fast: 7, Medium: 14, Slow: 28
- Weights: 2/2/2, Thresholds: 70/30
## Market-Specific Adjustments
**Volatile Markets:**
- Use longer periods (10/20/40) to reduce noise
- Consider higher threshold levels (75/25)
- Focus on extreme readings for signal quality
**Trending Markets:**
- Emphasize divergence analysis over absolute levels
- Look for momentum confirmation rather than reversal signals
- Use hidden divergences for trend continuation
**Range-Bound Markets:**
- Standard overbought/oversold levels work well
- Trade reversals from extreme levels
- Combine with support/resistance analysis
## Limitations and Considerations
* **Lagging component:** Contains inherent lag due to multiple moving average calculations
* **Complex calculation:** More computationally intensive than single-period oscillators
* **Parameter sensitivity:** Performance varies significantly with different period/weight combinations
* **Market dependency:** Most effective in trending markets with clear momentum patterns
* **False divergences:** Not all divergences lead to significant price reversals
* **Whipsaw potential:** Can generate conflicting signals in choppy markets
## Best Practices
**Effective Usage:**
- Focus on divergences rather than absolute overbought/oversold levels
- Combine with trend analysis for context
- Use multiple timeframe analysis for confirmation
- Pay attention to the speed of momentum changes
**Common Mistakes:**
- Over-relying on overbought/oversold levels in strong trends
- Ignoring the underlying trend direction
- Using inappropriate period settings for the market being analyzed
- Trading every divergence without additional confirmation
**Signal Enhancement:**
- Combine with volume analysis for confirmation
- Use price action context (support/resistance levels)
- Consider market volatility when setting thresholds
- Look for convergence across multiple momentum indicators
## Historical Context and Development
The Ultimate Oscillator was developed by Larry Williams and introduced in his 1985 article "The Ultimate Oscillator" in Technical Analysis of Stocks and Commodities magazine. Williams designed it to address the limitations of single-period oscillators by:
- Reducing false signals through multi-timeframe analysis
- Maintaining sensitivity to short-term momentum changes
- Providing more reliable divergence signals
- Creating a more robust momentum measurement tool
The indicator has become a standard tool in technical analysis, particularly valued for its divergence detection capabilities and its balanced approach to momentum measurement.
## References
* Williams, L. R. (1985). The Ultimate Oscillator. Technical Analysis of Stocks and Commodities, 3(4).
* Williams, L. R. (1999). Long-Term Secrets to Short-Term Trading. Wiley Trading.

Advanced Speedometer Gauge [PhenLabs]Advanced Speedometer Gauge
Version: PineScript™v6
📌 Description
The Advanced Speedometer Gauge is a revolutionary multi-metric visualization tool that consolidates 13 distinct trading indicators into a single, intuitive speedometer display. Instead of cluttering your workspace with multiple oscillators and panels, this gauge provides a unified interface where you can switch between different metrics while maintaining consistent visual interpretation.
Built on PineScript™ v6, the indicator transforms complex technical calculations into an easy-to-read semi-circular gauge with color-coded zones and a precision needle indicator. Each of the 13 available metrics has been carefully normalized to a 0-100 scale, ensuring that whether you’re analyzing RSI, volume trends, or volatility extremes, the visual interpretation remains consistent and intuitive.
The gauge is designed for traders who value efficiency and clarity. By consolidating multiple analytical perspectives into one compact display, you can quickly assess market conditions without the visual noise of traditional multi-indicator setups. All metrics are non-overlapping, meaning each provides unique insights into different aspects of market behavior.
🚀 Points of Innovation
13 selectable metrics covering momentum, volume, volatility, trend, and statistical analysis, all accessible through a single dropdown menu
Universal 0-100 normalization system that standardizes different indicator scales for consistent visual interpretation across all metrics
Semi-circular gauge design with 21 arc segments providing smooth precision and clear visual feedback through color-coded zones
Non-redundant metric selection ensuring each indicator provides unique market insights without analytical overlap
Advanced metrics including MFI (volume-weighted momentum), CCI (statistical deviation), Volatility Rank (extended lookback), Trend Strength (ADX-style), Choppiness Index, Volume Trend, and Price Distance from MA
Flexible positioning system with 5 chart locations, 3 size options, and fully customizable color schemes for optimal workspace integration
🔧 Core Components
Metric Selection Engine: Dropdown interface allowing instant switching between 13 different technical indicators, each with independent parameter controls
Normalization System: All metrics converted to 0-100 scale using indicator-specific algorithms that preserve the statistical significance of each measurement
Semi-Circular Gauge: Visual display using 21 arc segments arranged in curved formation with two-row thickness for enhanced visibility
Color Zone System: Three distinct zones (0-40 green, 40-70 yellow, 70-100 red) providing instant visual feedback on metric extremes
Needle Indicator: Dynamic pointer that positions across the gauge arc based on precise current metric value
Table Implementation: Professional table structure ensuring consistent positioning and rendering across different chart configurations
🔥 Key Features
RSI (Relative Strength Index): Classic momentum oscillator measuring overbought/oversold conditions with adjustable period length (default 14)
Stochastic Oscillator: Compares closing price to price range over specified period with smoothing, ideal for identifying momentum shifts
MFI (Money Flow Index): Volume-weighted RSI that combines price movement with volume to measure buying and selling pressure intensity
CCI (Commodity Channel Index): Measures statistical deviation from average price, normalized from typical -200 to +200 range to 0-100 scale
Williams %R: Alternative overbought/oversold indicator using high-low range analysis, inverted to match 0-100 scale conventions
Volume %: Current volume relative to moving average expressed as percentage, capped at 100 for extreme spikes
Volume Trend: Cumulative directional volume flow showing whether volume is flowing into up moves or down moves over specified period
ATR Percentile: Current Average True Range position within historical range using specified lookback period (default 100 bars)
Volatility Rank: Close-to-close volatility measured against extended historical range (default 252 days), differs from ATR in calculation method
Momentum: Rate of change calculation showing price movement speed, centered at 50 and normalized to 0-100 range
Trend Strength: ADX-style calculation using directional movement to quantify trend intensity regardless of direction
Choppiness Index: Measures market choppiness versus trending behavior, where high values indicate ranging markets and low values indicate strong trends
Price Distance from MA: Measures current price over-extension from moving average using standard deviation calculations
🎨 Visualization
Semi-Circular Arc Display: Curved gauge spanning from 0 (left) to 100 (right) with smooth progression and two-row thickness for visibility
Color-Coded Zones: Green zone (0-40) for low/oversold conditions, yellow zone (40-70) for neutral readings, red zone (70-100) for high/overbought conditions
Needle Indicator: Downward-pointing triangle (▼) positioned precisely at current metric value along the gauge arc
Scale Markers: Vertical line markers at 0, 25, 50, 75, and 100 positions with corresponding numerical labels below
Title Display: Merged cell showing “𓄀 PhenLabs” branding plus currently selected metric name in monospace font
Large Value Display: Current metric value shown with two decimal precision in large text directly below title
Table Structure: Professional table with customizable background color, text color, and transparency for minimal chart obstruction
📖 Usage Guidelines
Metric Selection
Select Metric: Default: RSI | Options: RSI, Stochastic, Volume %, ATR Percentile, Momentum, MFI (Money Flow), CCI (Commodity Channel), Williams %R, Volatility Rank, Trend Strength, Choppiness Index, Volume Trend, Price Distance | Choose the technical indicator you want to display on the gauge based on your current analytical needs
RSI Settings
RSI Length: Default: 14 | Range: 1+ | Controls the lookback period for RSI calculation, shorter periods increase sensitivity to recent price changes
Stochastic Settings
Stochastic Length: Default: 14 | Range: 1+ | Lookback period for stochastic calculation comparing close to high-low range
Stochastic Smooth: Default: 3 | Range: 1+ | Smoothing period applied to raw stochastic value to reduce noise and false signals
Volume Settings
Volume MA Length: Default: 20 | Range: 1+ | Moving average period used to calculate average volume for comparison with current volume
Volume Trend Length: Default: 20 | Range: 5+ | Period for calculating cumulative directional volume flow trend
ATR and Volatility Settings
ATR Length: Default: 14 | Range: 1+ | Period for Average True Range calculation used in ATR Percentile metric
ATR Percentile Lookback: Default: 100 | Range: 20+ | Historical range used to determine current ATR position as percentile
Volatility Rank Lookback (Days): Default: 252 | Range: 50+ | Extended lookback period for Volatility Rank metric using close-to-close volatility
Momentum and Trend Settings
Momentum Length: Default: 10 | Range: 1+ | Lookback period for rate of change calculation in Momentum metric
Trend Strength Length: Default: 20 | Range: 5+ | Period for directional movement calculations in ADX-style Trend Strength metric
Advanced Metric Settings
MFI Length: Default: 14 | Range: 1+ | Lookback period for Money Flow Index calculation combining price and volume
CCI Length: Default: 20 | Range: 1+ | Period for Commodity Channel Index statistical deviation calculation
Williams %R Length: Default: 14 | Range: 1+ | Lookback period for Williams %R high-low range analysis
Choppiness Index Length: Default: 14 | Range: 5+ | Period for calculating market choppiness versus trending behavior
Price Distance MA Length: Default: 50 | Range: 10+ | Moving average period used for Price Distance standard deviation calculation
Visual Customization
Position: Default: Top Right | Options: Top Left, Top Right, Bottom Left, Bottom Right, Middle Right | Controls gauge placement on chart for optimal workspace organization
Size: Default: Normal | Options: Small, Normal, Large | Adjusts overall gauge dimensions and text size for different monitor resolutions and preferences
Low Zone Color (0-40): Default: Green (#00FF00) | Customize color for low/oversold zone of gauge arc
Medium Zone Color (40-70): Default: Yellow (#FFFF00) | Customize color for neutral/medium zone of gauge arc
High Zone Color (70-100): Default: Red (#FF0000) | Customize color for high/overbought zone of gauge arc
Background Color: Default: Semi-transparent dark gray | Customize gauge background for contrast and chart integration
Text Color: Default: White (#FFFFFF) | Customize all text elements including title, value, and scale labels
✅ Best Use Cases
Quick visual assessment of market conditions when you need instant feedback on whether an asset is in extreme territory across multiple analytical dimensions
Workspace organization for traders who monitor multiple indicators but want to reduce chart clutter and visual complexity
Metric comparison by switching between different indicators while maintaining consistent visual interpretation through the 0-100 normalization
Overbought/oversold identification using RSI, Stochastic, Williams %R, or MFI depending on whether you prefer price-only or volume-weighted analysis
Volume analysis through Volume %, Volume Trend, or MFI to confirm price movements with corresponding volume characteristics
Volatility monitoring using ATR Percentile or Volatility Rank to identify expansion/contraction cycles and adjust position sizing
Trend vs range identification by comparing Trend Strength (high values = trending) against Choppiness Index (high values = ranging)
Statistical over-extension detection using CCI or Price Distance to identify when price has deviated significantly from normal behavior
Multi-timeframe analysis by duplicating the gauge on different timeframe charts to compare metric readings across time horizons
Educational purposes for new traders learning to interpret technical indicators through consistent visual representation
⚠️ Limitations
The gauge displays only one metric at a time, requiring manual switching to compare different indicators rather than simultaneous multi-metric viewing
The 0-100 normalization, while providing consistency, may obscure the raw values and specific nuances of each underlying indicator
Table-based visualization cannot be exported or saved as an image separately from the full chart screenshot
Optimal parameter settings vary by asset type, timeframe, and market conditions, requiring user experimentation for best results
💡 What Makes This Unique
Unified Multi-Metric Interface: The only gauge-style indicator offering 13 distinct metrics through a single interface, eliminating the need for multiple oscillator panels
Non-Overlapping Analytics: Each metric provides genuinely unique insights—MFI combines volume with price, CCI measures statistical deviation, Volatility Rank uses extended lookback, Trend Strength quantifies directional movement, and Choppiness Index measures ranging behavior
Universal Normalization System: All metrics standardized to 0-100 scale using indicator-appropriate algorithms that preserve statistical meaning while enabling consistent visual interpretation
Professional Visual Design: Semi-circular gauge with 21 arc segments, precision needle positioning, color-coded zones, and clean table implementation that maintains clarity across all chart configurations
Extensive Customization: Independent parameter controls for each metric, five position options, three size presets, and full color customization for seamless workspace integration
🔬 How It Works
1. Metric Calculation Phase:
All 13 metrics are calculated simultaneously on every bar using their respective algorithms with user-defined parameters
Each metric applies its own specific calculation method—RSI uses average gains vs losses, Stochastic compares close to high-low range, MFI incorporates typical price and volume, CCI measures deviation from statistical mean, ATR calculates true range, directional indicators measure up/down movement, and statistical metrics analyze price relationships
2. Normalization Process:
Each calculated metric is converted to a standardized 0-100 scale using indicator-appropriate transformations
Some metrics are naturally 0-100 (RSI, Stochastic, MFI, Williams %R), while others require scaling—CCI transforms from ±200 range, Momentum centers around 50, Volume ratio caps at 2x for 100, ATR and Volatility Rank calculate percentile positions, and Price Distance scales by standard deviations
3. Gauge Rendering:
The selected metric’s normalized value determines the needle position across 21 arc segments spanning 0-100
Each arc segment receives its color based on position—segments 0-8 are green zone, segments 9-14 are yellow zone, segments 15-20 are red zone
The needle indicator (▼) appears in row 5 at the column corresponding to the current metric value, providing precise visual feedback
4. Table Construction:
The gauge uses TradingView’s table system with merged cells for title and value display, ensuring consistent positioning regardless of chart configuration
Rows are allocated as follows: Row 0 merged for title, Row 1 merged for large value display, Row 2 for spacing, Rows 3-4 for the semi-circular arc with curved shaping, Row 5 for needle indicator, Row 6 for scale markers, Row 7 for numerical labels at 0/25/50/75/100
All visual elements update on every bar when barstate.islast is true, ensuring real-time accuracy without performance impact
💡 Note:
This indicator is designed for visual analysis and market condition assessment, not as a standalone trading system. For best results, combine gauge readings with price action analysis, support and resistance levels, and broader market context. Parameter optimization is recommended based on your specific trading timeframe and asset class. The gauge works on all timeframes but may require different parameter settings for intraday versus daily/weekly analysis. Consider using multiple instances of the gauge set to different metrics for comprehensive market analysis without switching between settings.

Commitment of Trader %RThis script is a TradingView Pine Script that creates a custom indicator to analyze Commitment of Traders (COT) data. It leverages the TradingView COT library to fetch data related to futures and options markets, processes this data, and then applies the Williams %R indicator to the COT data to assist in trading decisions. Here’s a detailed explanation of its components and functionality:
Importing and Configuration:
The script imports the COT library from TradingView and sets up tooltips to explain different input options to the user.
It allows the user to choose the mode for fetching COT data, which can be based on the root of the symbol, base currency, or quote currency.
Users can also input a specific CFTC code directly, instead of relying on automatic code generation.
Inputs and Parameters:
The script provides inputs to select the type of data (futures, options, or both), the type of COT data to display (long positions, short positions, etc.), and thresholds for the Williams %R indicator.
It also allows setting the period for the Williams %R calculation.
Data Request and Processing:
The dataRequest function fetches COT data for large traders, small traders, and commercial hedgers.
The script calculates the Williams %R for each type of trader, which measures overbought and oversold conditions.
Visualization:
The script uses background colors to highlight when the Williams %R crosses the specified thresholds for commercial hedgers.
It plots the COT data and Williams %R on the chart, with different colors representing large traders, small traders, and commercial hedgers.
Horizontal lines are drawn to indicate the upper and lower thresholds.
Display Information:
A table is displayed on the chart’s lower left corner showing the current COT data and CFTC code used.
Use of COT Report in Futures Trading
The COT report is a weekly publication by the Commodity Futures Trading Commission (CFTC) that provides insights into the positions held by different types of traders in the futures markets. This information is valuable for traders as it shows:
Market Sentiment: By analyzing the positions of commercial traders (often considered to be more informed), non-commercial traders (speculative traders), and small traders, traders can gauge market sentiment and potential future movements.
Contrarian Indicators: Large shifts in positions, especially when non-commercial traders hold extreme positions, can signal potential reversals or trends.
Research on COT Data and Price Movements
Several academic studies have examined the relationship between COT data and price movements in financial markets. Here are a few key works:
"The Predictive Power of the Commitment of Traders Report" by Jacob J. (2009):
This paper explores how changes in the positions of different types of traders in the COT report can predict future price movements in futures markets.
Citation: Jacob, J. (2009). The Predictive Power of the Commitment of Traders Report. Journal of Futures Markets.
"A New Look at the Commitment of Traders Report" by Mitchell, C. (2010):
Mitchell analyzes the efficacy of using COT data as a trading signal and its impact on trading strategies.
Citation: Mitchell, C. (2010). A New Look at the Commitment of Traders Report. Financial Analysts Journal.
"Market Timing Using the Commitment of Traders Report" by Kirkpatrick, C., & Dahlquist, J. (2011):
This study investigates the use of COT data for market timing and the effectiveness of various trading strategies based on the report.
Citation: Kirkpatrick, C., & Dahlquist, J. (2011). Market Timing Using the Commitment of Traders Report. Technical Analysis of Stocks & Commodities.
These studies provide insights into how COT data can be utilized for forecasting and trading decisions, reinforcing the utility of incorporating such data into trading strategies.
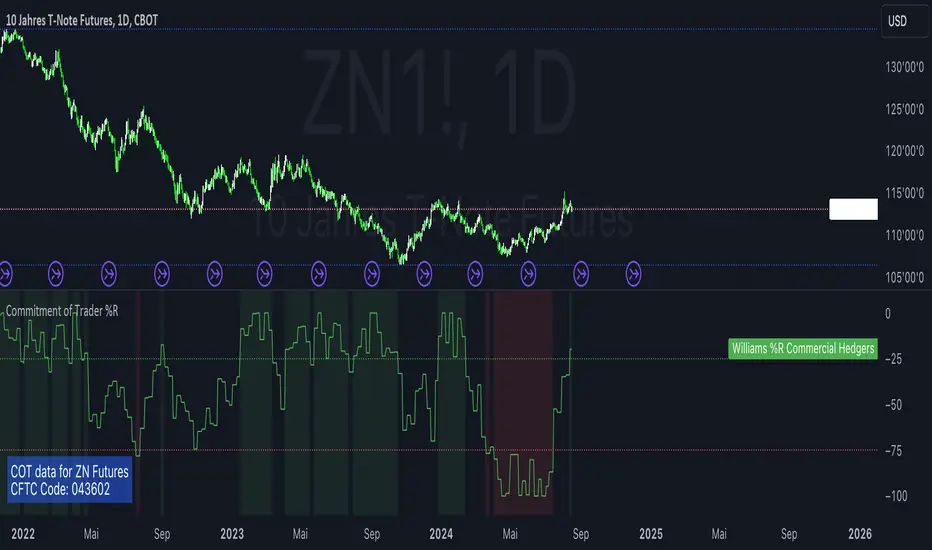
Volatility System by W. WilderVolatility System (Volatility Stops) Similarity
Most traders adjust their stops over time in the direction of the trend in order to lock in profits. Apart from moving averages, one of the most popular techniques is trailing stops using a multiple of Average True Range. There are several variations:
The original Volatility System(Volatility Stops), introduced by Welles Wilder in his 1978 book: New Concepts in Technical Trading Systems
Chandelier exits introduced by Alexander Elder in Come Into My Trading Room (2002) trail the stops from Highs or Lows rather than Closing Price
Average True Range Trailing Stops are similar to the above, but include a ratchet mechanism to prevent stops moving down during an up-trend or rising during a down-trend, as ATR increases
WillTrend intoduced by Larry Williams in 1988
Comparison of systems
All the systems under consideration have one common ingredient - ATR. ATR was developed by Welles Wilder and described in his book in 1978, also in this book the Volatility System was described, which in the future became known as Volatility Stops.
In fact, Wilder is the father of such systems due to the presence of ATR in the calculation of this type of indicator.
The main difference of Volatility System
Followers such as Larry Williams and Alexander Elder made minor changes to the value based on the ATR, mainly focusing on changing the base to which this value is added or subtracted.
Larry Williams uses the square root of 5 as a multiplier and calculates the ATR with a period of 66, and Alexander Elder uses a multiplier of 2.5-3.5 applying it to the ATR with a period of 22. Both authors changed the original value for ATR and multiplier calculations. Alexander Elder is closest to the original Welles Wilder calculation, which used a multiplier of 2.8.-3.1 applying it to an ATR with a period of 7.
As a reference, Elder took the Highest High(22) from which he subtracts ATR*Multiplier in an uptrend or the Lowest Low(22) to which he adds ATR*Multiplier to obtain the turning point (SAR).
Larry Williams uses the average price of extremes (Highest High(10) + Lowest Low(10)) / 2 as a reference base to which he adds or subtracts the ATR*Multilpyer values.
Both systems differ from the original, because Wilder used Significan Close(SIC) in his calculations. SIC is the maximum closing price during an uptrend and the minimum closing price during a downtrend, which
does not go beyond the current trade, as in other systems. To calculate the base when a trend changes, bars that are outside the current trend will be used when calculating WillTrend and Chandelier Exit, in contrast to the Volatility System, which takes SIC values only within the current trade. This is the main difference from subsequent developments of similar systems.
Improvements made
The original Volatility System is present as an indicator on TradingView, but it is an improved version with the addition of a ratchet and works differently from the original Weilder system.
List of improvements:
Added the ability to remove the ratchet. You need to turn off the "Trail one way" checkbox in the setting menu. When this function is turned off, the system will operate in the author-inventor mode. On some instruments, the original system works much better than the improved ratchet system, which cannot be turned off.
Added the ability to use Highest High and Lowest Low as a base instead of the closing price.
Volatility Stops Formula Description
Welles Wilder's system uses Closing Price and incorporates a stop-and-reverse feature (as with his Parabolic SAR).
Determine the initial trend direction
Calculate the Significant Close ("SIC"): the highest close reached in an up-trend or the lowest close in a down-trend
Calculate Average True Range ("ATR") for the selected period (7 days in this example)
Multiply ATR by the Multiple (3.0 in this example, best values author describes as 2.8-3.1)
The first stop is calculated in day 7 and plotted for day 8
If an up-trend, the first stop is SIC - 3 * ATR, otherwise SIC + 3 * ATR for a down-trend
Repeat each day until price closes below the stop (or above in a down-trend)
Set SIC equal to the latest Close, reverse the trend and continue.
Chandelier Exit Description
Chandelier Exits subtract a multiple of Average True Range ("ATR") from the highest high for the selected period. Using the default settings as an example:
Highest High in last 22 days - 3 * ATR for 22 days
In a down-trend the formula is reversed:
Lowest Low in last 22 days + 3 * ATR for 22 days
The time period must be long enough to capture the highest point of the recent up-trend: too short and the stops move downward; too long and the high may be taken from a previous down-trend.
It is not essential to use the same period for up and down trends; down-trends are notoriously faster than up-trends and may benefit from a shorter time period.
The multiple of 3 may be varied, but most traders settle between 2.5 and 3.5.
WillTrend Description
Larry Williams is prefer to used the Square Root from 5 as a multiplayer for ATR. SQRT(5) = 2.236
WillTrend subtract a multiple of Average True Range ("ATR") from the Middle Price (Highest High for the selected period + Lowest Low for the selected period / 2).
(Highest High in last 10 days + Lowest Low in last 10 days) / 2 - 2.236 * ATR for 66 days
In a down-trend the formula is reversed:
(Highest High in last 10 days + Lowest Low in last 10 days) / 2 + 2.236 * ATR for 66 days

Jake Bernstein - Moving Average ChannelWe all know that moving averages, in particular, moving averages of closing prices tend to be highly inaccurate indicators and frequently miss major tops and bottoms. In backtesting, they tend to be accurate some 30 to 40% of the time which is to my way of thinking unacceptable. On the contrary moving averages of opens versus closes for highs versus lows, when used properly avoid the drawbacks of closing moving averages, particularly when combined with a trigger. Shown above is my moving average channel method which uses the 57 SMA of Williams accumulation distribution as a setup or trigger. As shown by the arrows two consecutive price bars completely below the MA channel low and triggered by Williams below SMA constitutes a sell signal. Conversely, two consecutive price bars or more above the moving average channel high accompanied by Williams above its moving average constitutes a sell trigger. The moving average channel high, the red line is a 10 period Moving average of highs. The Moving average channel low, the green line is an 8 period Moving average of the low. There are at least a dozen applications of this methodology including its ability to spot trend changes, support, resistance, swing trades, market strength, market weakness, and more. I will post some of these additional uses of the moving average channel as they present themselves. Do note that in this chart there were two instances above the moving average channel high but these were not triggered by Williams AD and therefore the trend remains down for the duration of this chart. The methodology associated with my MAC is completely rules-based and works in any timeframe. Thank you my friend Larry Williams for developing your excellent version of accumulation-distribution

Buy & Sell Arrows - MACD + Best_Solve WPRMACD + Best_Solve Williams %R – Aggressive Trend-Reversal Catcher
(Allow Signals Even in Overbought/Oversold Zones)
This indicator combines the classic MACD histogram with Best_Solve’s popular custom Williams %R (a 0–100 momentum oscillator that behaves more like a fast Stochastic) to deliver clean, high-conviction entry signals on daily (and higher) timeframes.
Core Logic – Only TWO conditions are required
BUY (large green arrow below bar)
MACD histogram is green (bullish momentum)
Williams %R fast line is crossing above OR already above its EMA
SELL (large red arrow above bar)
MACD histogram is red (bearish momentum)
Williams %R fast line is crossing below OR already below its EMA
Unlike most oscillators, this version deliberately removes the traditional “do not buy when overbought / do not sell when oversold” filters. This allows the script to catch powerful trend reversals and explosive moves immediately — even on violent earnings gaps or panic sell-offs (example: META’s -11 % drop on Oct 30 2025 triggered an instant sell even though %R was deeply oversold).
Built-in Clean-Signal Logic
No consecutive buys or sells — each new signal must be preceded by the opposite direction.
This keeps the chart extremely clean and prevents whipsaw clusters during strong trends.
Best Use Cases
Daily and 4H swing trading on stocks, indices, crypto, forex
Excellent for catching sharp reversals after earnings, news events, or overextended moves
Works especially well on high-beta names and growth stocks
Visuals
Large green/red arrows with “BUY” / “SELL” text (your favorite style)
Subtle transparent MACD histogram overlaid on price for instant momentum context
Ready-to-use alerts (“Buy Alert” / “Sell Alert”)
Set it, alert it, trade it — one of the cleanest and most responsive daily reversal systems you’ll find.
Enjoy the edge!

Rubotics BolleWilly Rubotics BolleWilly Signal Engine (Rubots BW)
This closed-source system fuses volatility expansion, band-reversion patterns, and Williams %R momentum shifts into a unified signal engine. Instead of merely combining common indicators, the BolleWilly model creates a custom interaction between Bollinger Band pressure and momentum exhaustion, allowing traders to identify potential reversal points directly on the price chart.
This is a signal model, not a full strategy, and is intended for discretionary use or as a modular input inside automated systems such as the Rubotics EA.
Core Components and Unique Features
Volatility Compression & Expansion (Bollinger Logic)
The indicator detects when price pushes outside the Bollinger structure and then snaps back inside.
This volatility expansion → reversion behavior acts as the foundational “energy release” condition for the system.
Williams %R Momentum Module
The script measures Williams %R and an EMA-smoothed version of it.
A valid signal requires:
* A %R crossover through its EMA
* A clear momentum reversal confirmation
* Proper alignment with the band-reversion condition
This filters out weak band touches and focuses on genuine directional shifts.
Band-Breach Lookback Window
A configurable lookback (default: 1 bar) verifies whether nearby candles breached the upper or lower Bollinger Band.
This ensures signals only occur after actual volatility expansion, not random drift.
Optional Candle Confirmation
You can require:
* Bullish candle for Buy signals
* Bearish candle for Sell signals
This helps remove signals during indecisive or doji-like bars.
Optional WaveTrend Exhaustion Filter
An additional WT2 layer (disabled by default) can be activated to confirm true exhaustion zones:
* WT oversold → allow long signals
* WT overbought → allow short signals
This strengthens signal quality in choppy or extended markets.
Signal Generation
A Buy signal requires:
1. Price re-enters the Bollinger structure after breaching below
2. Williams %R crosses upward through its EMA
3. (Optional) Candle is bullish
4. (Optional) WT2 confirms oversold exhaustion
5. Location is inside the volatility envelope
A Sell signal requires the mirrored conditions.
Signals appear as chart-based arrows and can be used for EA integration, discretionary confirmation, or execution filters.
Customization and Originality
* Every component (Bands, %R, EMA smoothing, WT filters, candle rules, lookback logic) is user-adjustable
* You can enable/disable entire modules to tune the model for different markets
* The logic is not a mash-up; it’s a sequenced interaction of volatility, momentum, and exhaustion filtering
* This makes the BolleWilly system fundamentally different from standard indicators
Closed-Source Justification
This script uses proprietary logic for its reversal-detection process and multi-layered filter sequencing.
Although the description fully explains how the concepts work, the underlying implementation remains part of the internal Rubotics framework — therefore the script is closed-source in accordance with TradingView rules.
This tool is not financial advice and is provided strictly for analytical and educational purposes.
