Ultimate Global Trading Hours📊 Global Markets Pro - Summary
What it does:
Shows real-time trading hours for 11 major stock markets worldwide
Displays countdown timers for when each market opens/closes
Includes Forex sessions and US extended hours (pre-market/after-hours)
Features advanced market sentiment analysis with Fear/Greed indicators
Key Features:
✅ Chronological market order (Sydney → Tokyo → London → NYSE, etc.)
✅ Customisable times for each market in HH:MM format
✅ Multi-factor sentiment (VIX, Bonds vs Stocks, Weekly trends, Volume)
✅ Clean interface with emoji indicators and colour coding
✅ Your timezone display with GMT+/- options
Perfect for:
Day traders tracking global market sessions
Swing traders gauging market sentiment
Anyone wanting to know when major markets are active
Result: One comprehensive dashboard showing when to trade and market mood across all time zones!
Wyszukaj w skryptach "vix"

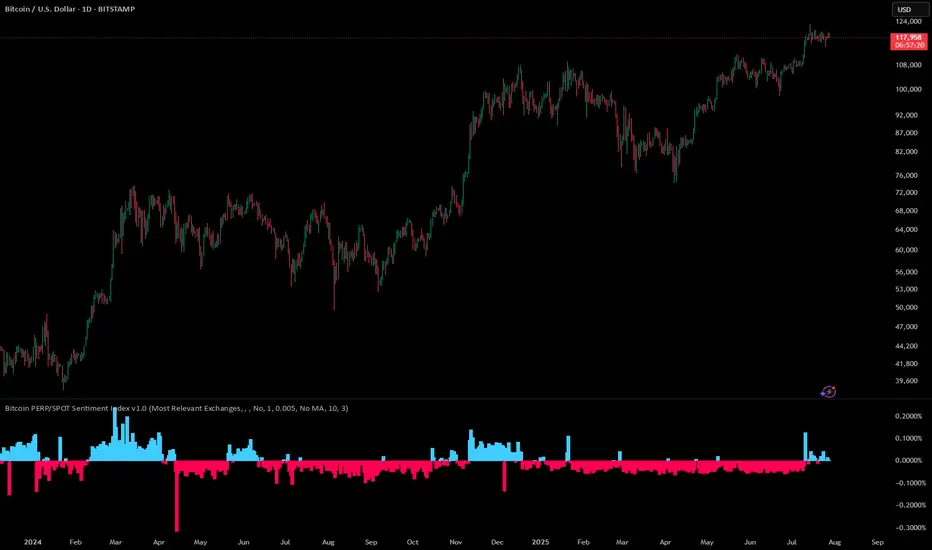
Bitcoin PERP/SPOT Sentiment Index# Bitcoin PERP/SPOT Sentiment Index
A comprehensive Pine Script indicator that measures market sentiment by analyzing the premium/discount between Bitcoin perpetual futures and spot prices across multiple cryptocurrency exchanges.
## 📊 Overview
The Bitcoin PERP/SPOT Sentiment Index provides traders with deep insights into market psychology and risk appetite in the cryptocurrency ecosystem. By calculating the price difference (premium/discount) between perpetual futures contracts and spot prices, it reveals how traders are positioned and their sentiment toward Bitcoin's price direction.
**Key Insight**: The premium between PERP and SPOT prices is a powerful sentiment indicator that reflects trader positioning, risk appetite, and market psychology - data that influences but is separate from actual exchange funding rates.
## 🎯 Core Functionality
### Premium Calculation Methodology
The indicator calculates market sentiment using the following approach:
1. **Multi-Exchange Data Collection**: Fetches real-time prices from major exchanges for both perpetual futures (PERP) and spot markets
2. **TWAP Calculation**: Computes time-weighted average prices for both market types to reduce noise
3. **Premium Analysis**: Calculates the percentage difference between PERP and SPOT prices
4. **Sentiment Smoothing**: Applies time-weighted smoothing for stable sentiment readings
**Formula**: `Premium = (PERP_TWAP / SPOT_TWAP - 1) × 100`
### Market Sentiment Insights
**Positive Premium (PERP > SPOT) = Risk-On Sentiment**
- Traders prefer leveraged long positions via perpetuals
- High risk appetite and bullish expectations
- Willingness to pay premium for leverage access
- Often coincides with FOMO and greed phases
**Negative Premium (PERP < SPOT) = Risk-Off Sentiment**
- Traders prefer spot holdings or short perpetuals
- Fear-driven behavior and bearish expectations
- Spot premium indicates institutional accumulation
- Often coincides with capitulation and fear phases
### Exchange Coverage
**Perpetual Futures (17 markets)**:
- Bitmex (USD, USDT)
- Binance (USDT, USD)
- Bitget (USD, USDT, USDC)
- Bybit (USDT, USD)
- Phemex (USD, USDT)
- Huobi, Kraken, OKX (USD, USDT)
- Deribit, BingX
**Spot Markets (12 markets)**:
- Bitstamp, Binance, Coinbase
- Phemex, Huobi, Kraken, OKX
- Kucoin (USDT, USDC)
- Bitget (USDT, USDC)
- BTC Index
## 🎛️ Exchange Selection Modes
### 1. "Most Relevant Exchanges" (Default) ⭐
**Why this selection provides the best sentiment analysis:**
This preset focuses on exchanges that most accurately reflect true market sentiment by prioritizing:
#### **Institutional & Retail Balance**
- **Diverse User Base**: Includes exchanges serving both institutional (Coinbase, Kraken) and retail (Binance, Bybit) traders
- **Geographic Diversity**: Balances Western and Asian markets for global sentiment representation
- **Regulatory Clarity**: Focuses on exchanges with clear regulatory standing
#### **High-Quality Sentiment Data**
- **Deep Liquidity**: Ensures price movements reflect genuine sentiment, not thin book effects
- **Price Discovery Leaders**: These exchanges set market direction and sentiment trends
- **Reduced Manipulation**: Larger exchanges are less susceptible to artificial price manipulation
#### **Trading Behavior Insights**
- **Leverage Preferences**: Captures where traders actually choose to take leveraged positions
- **Risk Appetite Signals**: Reflects real money sentiment from major market participants
- **Arbitrage Efficiency**: Premium differences here represent actionable sentiment signals
**Included Exchanges**:
- **PERP**: Bitmex (USD/USDT), Binance (USDT/USD), Bybit (USDT/USD)
- **SPOT**: Bitstamp, Binance, Coinbase, Kraken, Kucoin, Bitget (USDT/USDC)
### 2. "All Exchange Data"
- Maximum market coverage for comprehensive sentiment analysis
- Includes smaller exchanges that may reflect niche trading behaviors
- Best for research and identifying sentiment divergences across market segments
### 3. "Excl. OKX and Huobi"
- Focuses on Western and international exchanges
- Useful for analyzing sentiment outside specific jurisdictions
- Maintains broad coverage while addressing regional concerns
### 4. "Individual: Select Below"
- Custom sentiment analysis for specific exchange combinations
- Perfect for testing regional sentiment differences
- Allows focus on specific trader demographics or market segments
## ⚙️ Configuration Options
### Core Settings
- **TWAP Interval**: Time period for price averaging
- **Premium Calculation Interval**: Data fetching frequency for sentiment updates
- **Percentage Rate Timeframe**: Multiplier for annualizing premium rates (e.g., 365 for annual rate)
### Sentiment Analysis Controls
- **Cut High Values**: Filters extreme sentiment spikes (>0.1%, >0.2%, >0.5%, >1.2%)
- **Enable Data Validation**: Automatically filters invalid price data for accurate sentiment
- **Minimum Exchanges Required**: Ensures reliable sentiment calculation (default: 3)
### Advanced Features
- **Sentiment Boost**: Adds realistic trading costs to better reflect actual sentiment impact
- **Moving Average Options**: SMA, WMA, EMA, RMA smoothing for trend analysis
- **Real-time Validation**: Prevents calculation with insufficient data
## 📈 Sentiment Interpretation Guide
### Positive Premium (Blue Bars) - Risk-On Sentiment
- **0-0.1%**: Neutral to slightly bullish sentiment
- **0.1-0.3%**: Moderate bullish sentiment, increasing risk appetite
- **0.3-0.5%**: Strong bullish sentiment, high leverage demand
- **>0.5%**: Extreme greed, potential contrarian signal
**Trading Psychology**: Traders are eager to pay premium for leveraged long exposure, indicating confidence and risk-taking behavior.
### Negative Premium (Red Bars) - Risk-Off Sentiment
- **0 to -0.1%**: Neutral to slightly bearish sentiment
- **-0.1% to -0.3%**: Moderate bearish sentiment, risk reduction
- **-0.3% to -0.5%**: Strong bearish sentiment, fear-driven behavior
- **<-0.5%**: Extreme fear, potential capitulation, contrarian opportunity
**Trading Psychology**: Traders prefer spot holdings or short positions, indicating caution and defensive positioning.
## 🧠 Sentiment Analysis Applications
### 1. **Market Psychology Assessment**
- Gauge overall trader confidence and risk appetite
- Identify shifts from greed to fear (and vice versa)
- Spot emotional extremes that often precede reversals
### 2. **Contrarian Trading Signals**
- Extreme positive premium (>0.5%) = potential sell signal (overconfidence)
- Extreme negative premium (<-0.5%) = potential buy signal (oversold sentiment)
- Divergences between price and sentiment for early reversal detection
### 3. **Risk Management**
- High premium = reduce position size (crowded long trades)
- Low/negative premium = potential opportunity for contrarian positions
- Sentiment trend analysis for position timing
### 4. **Market Timing**
- Premium expansion = momentum continuation likely
- Premium contraction = potential trend exhaustion
- Zero-line crosses = sentiment regime changes
### 5. **Institutional vs Retail Behavior**
- Sustained negative premium often indicates institutional accumulation
- Extreme positive premium suggests retail FOMO and leverage excess
## 🔧 Technical Implementation
### Anti-Repainting Protection
```pine
securemodule(data, intervall, source) =>
request.security(data, intervall, source , lookahead=barmerge.lookahead_on)
```
### Data Quality & Sentiment Accuracy
- Price bounds checking (1,000 - 200,000 USD) for realistic data
- Invalid data filtering to prevent sentiment distortion
- Minimum exchange count requirements for reliable sentiment readings
- Outlier detection to filter manipulation attempts
### Performance Optimizations
- Array-based exchange management for efficiency
- Efficient TWAP calculations for real-time sentiment updates
- Modular configuration system for easy customization
- Reduced redundant calculations for faster processing
## 🚀 Key Features (v1.0)
- **Bitcoin PERP/SPOT Sentiment Index**: First public release focused on sentiment analysis
- **Multi-Exchange Aggregation**: Combines data from 17 PERP and 12 SPOT markets
- **Advanced Data Validation**: Robust outlier filtering and data quality controls
- **Configurable Exchange Presets**: Optimized selections for different analysis needs
- **Real-Time Sentiment Analysis**: Live premium calculations with anti-repainting protection
## ⚠️ Important Distinctions
**What This Indicator Measures:**
- ✅ PERP/SPOT price premium (sentiment indicator)
- ✅ Market psychology and risk appetite
- ✅ Trader positioning preferences
- ✅ Leverage demand vs spot preference
**What This Indicator Does NOT Measure:**
- ❌ Actual exchange funding rates (these come from exchange APIs)
- ❌ Real funding costs paid by traders
- ❌ Exact arbitrage profitability
- ❌ Future price direction (sentiment can be wrong)
**Relationship to Funding Rates:**
The premium calculated by this indicator influences actual funding rates, but funding rates also include exchange-specific factors like funding intervals, rate caps, and internal calculations. This premium serves as a leading sentiment indicator that helps predict funding rate direction.
## 💡 Advanced Sentiment Strategies
1. **Sentiment Divergence**: Watch for premium direction differing from price movement
2. **Regime Change Detection**: Monitor sustained shifts in premium sign (+ to - or vice versa)
3. **Volatility Prediction**: Extreme premiums often precede high volatility periods
4. **Correlation Analysis**: Compare with VIX, Fear & Greed Index, and on-chain metrics
5. **Multi-Timeframe Sentiment**: Use different timeframes to identify sentiment trends vs noise
IV PercentileIV Percentile Indicator - Brief Description
What It Does
The IV Percentile Indicator measures where current implied volatility ranks compared to the past year, showing what percentage of time volatility was lower than today's level.
How It Works
Data Collection:
Tracks implied volatility (or historical volatility as proxy) for each trading day
Stores the last 252 days (1 year) of volatility readings
Uses VIX data for SPY/SPX, historical volatility for other stocks
Calculation:
IV Percentile = (Days with IV below current level) ÷ (Total days) × 100
Example: If IV Percentile = 75%, it means current volatility is higher than 75% of the past year's readings.
Visual Output
Main Display:
Blue line showing percentile (0-100%)
Reference lines at key levels (20%, 30%, 50%, 70%, 80%)
Color-coded backgrounds for quick identification
Info table with current readings
Key Levels:
80%+ (Red): Very high IV → Sell premium
70-79% (Orange): High IV → Consider selling
30-20% (Green): Low IV → Consider buying
<20% (Bright Green): Very low IV → Buy premium
Trading Application
When IV Percentile is HIGH (70%+):
Options are expensive relative to recent history
Good time to sell premium (iron condors, credit spreads)
Expect volatility to decrease toward normal levels
When IV Percentile is LOW (30%-):
Options are cheap relative to recent history
Good time to buy premium (straddles, long options)
Expect volatility to increase from compressed levels
Core Logic
The indicator helps answer: "Is this a good time to buy or sell options based on how expensive/cheap they are compared to recent history?" It removes the guesswork from volatility timing by providing historical context for current option prices.

Arambhik's Option Buyer Trend📈 Arambhik's Option Buyer Trend
Crafted for Intraday Option Buyers | Precision. Logic. Control.
This advanced trend-following tool helps option buyers capture directional momentum using layered confirmations and adaptive risk management, fine-tuned for the Indian derivatives market.
🔍 Core Features
🔵 Primary Trend Detection: Built with JMA & Kalman Filter for smooth trend recognition.
⚡ Two-Step Entry Validation: Confirms entries using dual ADX logic (on both option chart and underlying).
🧠 Smart Market Mode: Automatically detects market condition (Volatile / Slow) using India VIX and adjusts strategy logic.
🧮 Dynamic Risk Control: ATR-based Stop Loss with 3 Reward Targets (TP1, TP2, TP3) and ADX-guided trailing stop climb.
🟣 Optional Exit Logic: Especially effective in slow markets to protect mid-trend gains.
📊 Visual Aids: Clean plotting of Entry, SL, TPs, and Trailing SL along with real-time profit/loss labels.
🔔 Alerts: Alerts for Entry, Exit, Profit Booking, and Stop Loss for better automation.
🛠️ Usage Guide
Apply on: NIFTY/BANKNIFTY Option CE/PE charts
Chart Selection:
▸ At The Money (ATM) — recommended
▸ Up to 2 strikes In The Money (ITM)
▸ Or up to 4 strikes Out Of The Money (OTM)
Timeframe: 3-minute (recommended)
Settings Reminder:
☑️ Be sure to set the correct underlying (e.g., NIFTY or BANKNIFTY) in the indicator settings.
☑️ Set the ADX values for the option and underlying market as per your preference—the default values are optimized and good enough for most users.
☑️ Keep all other settings unchanged (default) for best results.
⚠️ Disclaimer
This indicator is for educational purposes only. The author is not SEBI registered. Please paper trade or backtest thoroughly before using it live. Use at your own discretion and risk.

ATR Trailing Stop with ATR Targets [v6]What the Indicator Does
This custom TradingView indicator is designed for active traders who want to automate and visualize their trailing stop management and target setting, using true market volatility. It combines the Average True Range (ATR) with dynamic market structure logic to:
Trail a stop-loss behind major swings in real time, using 2×ATR (adjustable) from the highest high in uptrends or the lowest low in downtrends.
Flip trading bias between bullish and bearish when the stop is breached.
Identify and plot three profit targets (at 1, 2, and 3 ATR from the breakout/flip point) after every stop-flip, helping traders scale out or set take-profits objectively.
Maintain a visible presence on your chart every bar to avoid indicator errors, with color and labeling for clear distinction between long/short phases.
How the Indicator Works
1. ATR Calculation
ATR Period and Multiplier: You select your preferred ATR length (default is 14 bars) and a multiplier (default is 2.0).
Volatility Adjustment: ATR measures the average "true" bar range, so the trailing stop and targets adapt to current volatility.
2. Trailing Stop Logic
Uptrend (bullish bias): The indicator tracks the highest high made since the last bearish-to-bullish flip and sets the stop at - .
The stop only raises (never lowers) during an uptrend, protecting gains in strong moves.
Downtrend (bearish bias): Tracks the lowest low made since the last bullish-to-bearish flip, with stop at + .
The stop only lowers (never raises) in a downtrend.
Flip Point: If price closes through the trailing stop, the current bias “flips,” and the logic reverses (bullish to bearish or vice versa). At the new close, flip price and bar index are stored for target calculation.
3. ATR Targets after Flip
After each stop flip:
Three targets—based on the new close price—are calculated and plotted:
Long flip (new bull bias): Target1 = close + 1×ATR, Target2 = close + 2×ATR, Target3 = close + 3×ATR.
Short flip (new bear bias): Target1 = close - 1×ATR, Target2 = close - 2×ATR, Target3 = close - 3×ATR.
These targets help with scaling out, partial profit-taking, or setting automated orders.
4. Visual Feedback
Trailing stop line: Green for long bias, red for short bias.
Targets: Distinct color-coded circles at 1, 2, 3 ATR levels from the most recent flip.
Flip Labels: Mark the bar and price where bias flipped (“Long Flip” or “Short Flip”) for quick pattern recognition.
Subtle background shading: Ensures TradingView's requirement for “indicator output every bar.”
How to Use This Indicator
Parameter Setup
ATR Period and Multiplier: Adjust to match the timeframe and volatility of your instrument.
Lower periods/multipliers for short-term/volatile trading.
Higher values for smoother signals or higher timeframes.
Starting Trend: Set to match the expected initial bias if the instrument has strong trend characteristics.
Trading Application
1. Daily Bias Approach
Establish your bias in line with your trading plan (e.g., only trade long if price is above the previous day's high, short below the previous day's low).
Only look for trades in the indicator's current bias direction, as expressed by the stop and background color.
2. Entry
Use the indicator as a real-time confirmation or trailing stop for your entries.
Breakout: Enter when price establishes the current bias, using the trailing stop as your risk level.
Reversal: Wait for a bias flip after an extended move; enter in the direction of the new bias.
VWAP Rebound: Combine with a VWAP bounce—enter only if the indicator bias supports your direction.
3. Exits/Targets
Trailing stop management: Move your stop according to the plotted line; exit if your stop is hit.
Profit-taking: Scale out or take profits as price approaches each ATR-based target.
Use the dynamic labeling to identify reversal flips and reset your plan if stopped or the bias changes.
4. Market Context
Filter and frame setups by watching correlated indicators (DXY, VIX, AUDJPY, put/call ratio) and upcoming news; trade only in the daily bias direction for best consistency.
5. Practical Tips
Combine this indicator with your custom watchlist and alert settings to get notified on flips or targets.
Review the last label ("Long Flip"/"Short Flip") and targets to plan partial exits.
Remember: ATR adapts to volatility, so the stop and targets stay proportionate even when price action shifts.

RISK ROTATION MATRIX ║ BullVision [3.0]🔍 Overview
The Risk Rotation Matrix is a comprehensive market regime detection system that analyzes global market conditions across four critical domains: Liquidity, Macroeconomic, Crypto/Commodities, and Risk/Volatility. Through proprietary algorithms and advanced statistical analysis, it transforms 20+ diverse market metrics into a unified framework for identifying regime transitions and risk rotations.
This institutional-grade system aims to solve a fundamental challenge: how to synthesize complex, multi-domain market data into clear, actionable trading intelligence. By combining proprietary liquidity calculations with sophisticated cross-asset analysis.
The Four-Domain Architecture
1. 💧 LIQUIDITY DOMAIN
Our liquidity analysis combines standard metrics with proprietary calculations:
Proprietary Components:
Custom Global Liquidity Index (GLI): Unique formula aggregating central bank assets, credit spreads, and FX dynamics through our weighted algorithm
Federal Reserve Balance Proxy: Advanced calculation incorporating reverse repos, TGA fluctuations, and QE/QT impacts
China Liquidity Proxy: First-of-its-kind metric combining PBOC operations with FX-adjusted aggregates
Global M2 Composite: Custom multi-currency M2 aggregation with proprietary FX normalization
2. 📈 MACRO DOMAIN
Sophisticated integration of global economic indicators:
S&P 500: Momentum and trend analysis with custom z-score normalization
China Blue Chips: Asian market sentiment with correlation filtering
MBA Purchase Index: Real estate market health indicator
Emerging Markets (EEMS): Risk appetite measurement
Global ETF (URTH): Worldwide equity exposure tracking
Each metric undergoes proprietary transformation to ensure comparability and regime-specific sensitivity.
3. 🪙 CRYPTO/COMMODITIES DOMAIN
Unique cross-asset analysis combining:
Total Crypto Market Cap: Liquidity flow indicator with custom smoothing
Bitcoin SOPR: On-chain profitability analysis with adaptive periods
MVRV Z-Score: Advanced implementation with multiple MA options
BTC/Silver Ratio: Novel commodity-crypto relationship metric
Our algorithms detect when crypto markets lead or lag traditional assets, providing crucial timing signals.
4. ⚡ RISK/VOLATILITY DOMAIN
Advanced volatility regime detection through:
MOVE Index: Bond volatility with inverse correlation analysis
VVIX/VIX Ratio: Volatility-of-volatility for regime extremes
SKEW Index: Tail risk measurement with custom normalization
Credit Stress Composite: Proprietary combination of credit spreads
USDT Dominance: Crypto flight-to-safety indicator
All risk metrics are inverted and normalized to align with the unified scoring system.
🧠 Advanced Integration Methodology
Multi-Stage Processing Pipeline
Data Collection: Real-time aggregation from 20+ sources
Normalization: Custom z-score variants accounting for regime-specific volatility
Domain Scoring: Proprietary weighting within each domain
Cross-Domain Synthesis: Advanced correlation matrix between domains
Regime Detection: State-transition model identifying four market phases
Signal Generation: Composite score with adaptive smoothing
🔁 Composite Smoothing & Signal Generation
The user can apply smoothing (ALMA, EMA, etc.) to highlight trends and reduce noise. Smoothing length, type, and parameters are fully customizable for different trading styles.
🎯 Color Feedback & Market Regimes
Visual dynamics (color gradients, labels, trails, and quadrant placement) offer an at-a-glance interpretation of the market’s evolving risk environment—without forecasting or forward-looking assumptions.
🎯 The Quadrant Visualization System
Our innovative visual framework transforms complex calculations into intuitive intelligence:
Dynamic Ehlers Loop: Shows current position and momentum
Trailing History: Visual path of regime transitions
Real-Time Animation: Immediate feedback on condition changes
Multi-Layer Information: Depth through color, size, and positioning
🚀 Practical Applications
Primary Use Cases
Multi-Asset Portfolio Management: Optimize allocation across asset classes based on regime
Risk Budgeting: Adjust exposure dynamically with regime changes
Tactical Trading: Time entries/exits using regime transitions
Hedging Strategies: Implement protection before risk-off phases
Specific Trading Scenarios
Domain Divergence: When liquidity improves but risk metrics deteriorate
Early Rotation Detection: Crypto/commodity signals often lead broader markets
Volatility Regime Trades: Position for mean reversion or trend following
Cross-Asset Arbitrage: Exploit temporary dislocations between domains
⚙️ How It Works
The Composite Score Engine
The system's intelligence emerges from how it combines domains:
Each domain produces a normalized score (-2 to +2 range)
Proprietary algorithms weight domains based on market conditions
Composite score indicates overall market regime
Smoothing options (ALMA, EMA, etc.) optimize for different timeframes
Regime Classification
🟢 Risk-On (Green): Positive composite + positive momentum
🟠 Weakening (Orange): Positive composite + negative momentum
🔵 Recovery (Blue): Negative composite + positive momentum
🔴 Risk-Off (Red): Negative composite + negative momentum
Signal Interpretation Framework
The indicator provides three levels of analysis:
Composite Score: Overall market regime (-2 to +2)
Domain Scores: Identify which factors drive regime
Individual Metrics: Granular analysis of specific components
🎨 Features & Functionality
Core Components
Risk Rotation Quadrant: Primary visual interface with Ehlers loop
Data Matrix Dashboard: Real-time display of all 20+ metrics
Domain Aggregation: Separate scores for each domain
Composite Calculation: Unified score with multiple smoothing options
Customization Options
Selective Metrics: Enable/disable individual components
Period Adjustment: Optimize lookback for each metric
Smoothing Selection: 10 different MA types including ALMA
Visual Configuration: Quadrant scale, colors, trails, effects
Advanced Settings
Pre-smoothing: Reduce noise before final calculation
Adaptive Periods: Automatic adjustment during volatility
Correlation Filters: Remove redundant signals
Regime Memory: Hysteresis to prevent whipsaws
📋 Implementation Guide
Setup Process
Add to chart (optimized for daily, works on all timeframes)
Review default settings for your market focus
Adjust domain weights based on trading style
Configure visual preferences
Optimization by Trading Style
Position Trading: Longer periods (60-150), heavy smoothing
Swing Trading: Medium periods (20-60), balanced smoothing
Active Trading: Shorter periods (10-40), minimal smoothing
Best Practices
Monitor domain divergences for early signals
Use extreme readings (-1.5/+1.5) for high-conviction trades
Combine with price action for confirmation
Adjust parameters during major events (FOMC, earnings)
💎 What Makes This Unique
Beyond Traditional Indicators
Multi-Domain Integration: Only system combining liquidity, macro, crypto, and volatility
Proprietary Calculations: Custom formulas for GLI, Fed, China, and M2 proxies
Adaptive Architecture: Dynamically adjusts to market regimes
Institutional Depth: 20+ integrated metrics vs typical 3-5
Technical Innovation
Statistical Normalization: Custom z-score variants for cross-asset comparison
Correlation Management: Prevents double-counting related signals
Regime Persistence: Algorithms to identify sustainable vs temporary shifts
Visual Intelligence: Information-dense display without overwhelming
🔢 Performance Characteristics
Strengths
Early regime detection (typically 1-3 weeks ahead)
Robust across different market environments
Clear visual feedback reduces interpretation errors
Comprehensive coverage prevents blind spots
Optimal Conditions
Most effective with 100+ bars of history
Best on daily timeframe (4H minimum recommended)
Requires liquid markets for accurate signals
Performance improves with more enabled components
⚠️ Risk Considerations & Limitations
Important Disclaimers
Probabilistic system, not predictive
Requires understanding of macro relationships
Signals should complement other analysis
Past regime behavior doesn't guarantee future patterns
Known Limitations
Black swan events may cause temporary distortions
Central bank interventions can override signals
Requires active management during regime transitions
Not suitable for pure technical traders
💎 Conclusion
The Risk Rotation Matrix represents a new paradigm in market regime analysis. By combining proprietary liquidity calculations with comprehensive multi-domain monitoring, it provides institutional-grade intelligence previously available only to large funds. The system's strength lies not just in its individual components, but in how it synthesizes diverse market information into clear, actionable trading signals.
⚠️ Access & Intellectual Property Notice
This invite-only indicator contains proprietary algorithms, custom calculations, and years of quantitative research. The mathematical formulations for our liquidity proxies, cross-domain correlation matrices, and regime detection algorithms represent significant intellectual property. Access is restricted to protect these innovations and maintain their effectiveness for serious traders who understand the value of comprehensive market regime analysis.

RSI Multi-Frame Multi-Asset
✅ Key Features:
Multi-Asset: Simultaneously analyze Bitcoin, SP500, Nasdaq, DXY, Gold, Oil, VIX and more
Multi-Timeframe: Configure any timeframe for all RSI calculations
Smart Average RSI: Automatically calculates the mean of all active RSI values
Special Data: Includes Bitcoin Hashrate, 10Y-2Y Spread, and US Interest Rates
Built-in Alerts: Automatic notifications on overbought/oversold crossovers
🎯 Why is it Unique?
Instead of looking at 10 different charts, you get an instant macro view of the market. The average RSI shows you the overall strength/weakness of global markets, while individual RSI values let you identify divergences and specific opportunities.
🚀 Perfect For:
Traders seeking correlations between assets
Global markets macro analysis
Identifying divergences between Bitcoin and traditional markets
Multi-timeframe breakout trading

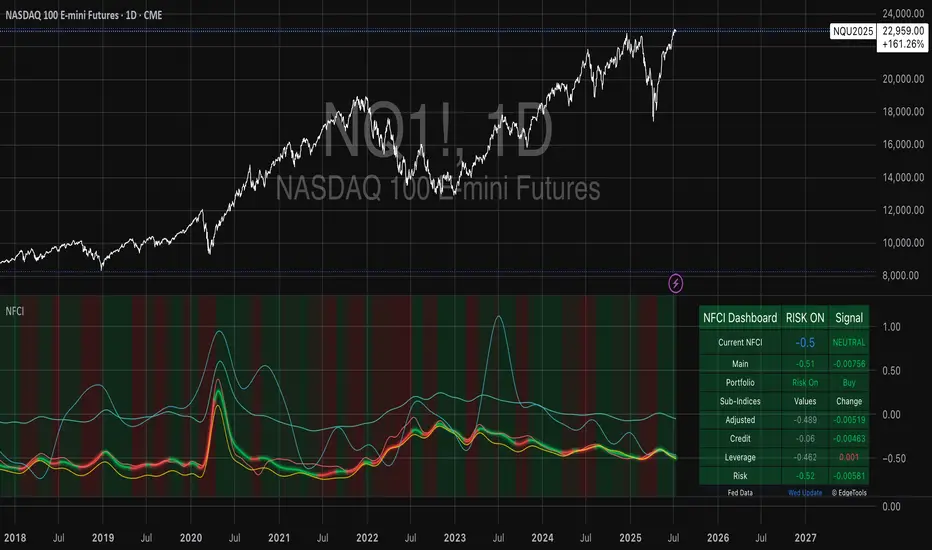
National Financial Conditions Index (NFCI)This is one of the most important macro indicators in my trading arsenal due to its reliability across different market regimes. I'm excited to share this with the TradingView community because this Federal Reserve data is not only completely free but extraordinarily useful for portfolio management and risk assessment.
**Important Disclaimers**: Be aware that some NFCI components are updated only monthly but carry significant weighting in the composite index. Additionally, the Fed occasionally revises historical NFCI data, so historical backtests should be interpreted with some caution. Nevertheless, this remains a crucial leading indicator for financial stress conditions.
---
## What is the National Financial Conditions Index?
The National Financial Conditions Index (NFCI) is a comprehensive measure of financial stress and liquidity conditions developed by the Federal Reserve Bank of Chicago. This indicator synthesizes over 100 financial market variables into a single, interpretable metric that captures the overall state of financial conditions in the United States (Brave & Butters, 2011).
**Key Principle**: When the NFCI is positive, financial conditions are tighter than average; when negative, conditions are looser than average. Values above +1.0 historically coincide with financial crises, while values below -1.0 often signal bubble-like conditions.
## Scientific Foundation & Research
The NFCI methodology is grounded in extensive academic research:
### Core Research Foundation
- **Brave, S., & Butters, R. A. (2011)**. "Monitoring financial stability: A financial conditions index approach." *Economic Perspectives*, 35(1), 22-43.
- **Hatzius, J., Hooper, P., Mishkin, F. S., Schoenholtz, K. L., & Watson, M. W. (2010)**. "Financial conditions indexes: A fresh look after the financial crisis." *US Monetary Policy Forum Report*, No. 23.
- **Kliesen, K. L., Owyang, M. T., & Vermann, E. K. (2012)**. "Disentangling diverse measures: A survey of financial stress indexes." *Federal Reserve Bank of St. Louis Review*, 94(5), 369-397.
### Methodological Validation
The NFCI employs Principal Component Analysis (PCA) to extract common factors from financial market data, following the methodology established by **English, W. B., Tsatsaronis, K., & Zoli, E. (2005)** in "Assessing the predictive power of measures of financial conditions for macroeconomic variables." The index has been validated through extensive academic research (Koop & Korobilis, 2014).
## NFCI Components Explained
This indicator provides access to all five official NFCI variants:
### 1. **Main NFCI**
The primary composite index incorporating all financial market sectors. This serves as the main signal for portfolio allocation decisions.
### 2. **Adjusted NFCI (ANFCI)**
Removes the influence of credit market disruptions to focus on non-credit financial stress. Particularly useful during banking crises when credit markets may be impaired but other financial conditions remain stable.
### 3. **Credit Sub-Index**
Isolates credit market conditions including corporate bond spreads, commercial paper rates, and bank lending standards. Important for assessing corporate financing stress.
### 4. **Leverage Sub-Index**
Measures systemic leverage through margin requirements, dealer financing, and institutional leverage metrics. Useful for identifying leverage-driven market stress.
### 5. **Risk Sub-Index**
Captures market-based risk measures including volatility, correlation, and tail risk indicators. Provides indication of risk appetite shifts.
## Practical Trading Applications
### Portfolio Allocation Framework
Based on the academic research, the NFCI can be used for portfolio positioning:
**Risk-On Positioning (NFCI declining):**
- Consider increasing equity exposure
- Reduce defensive positions
- Evaluate growth-oriented sectors
**Risk-Off Positioning (NFCI rising):**
- Consider reducing equity exposure
- Increase defensive positioning
- Favor large-cap, dividend-paying stocks
### Academic Validation
According to **Oet, M. V., Eiben, R., Bianco, T., Gramlich, D., & Ong, S. J. (2011)** in "The financial stress index: Identification of systemic risk conditions," financial conditions indices like the NFCI provide early warning capabilities for systemic risk conditions.
**Illing, M., & Liu, Y. (2006)** demonstrated in "Measuring financial stress in a developed country: An application to Canada" that composite financial stress measures can be useful for predicting economic downturns.
## Advanced Features of This Implementation
### Dynamic Background Coloring
- **Green backgrounds**: Risk-On conditions - potentially favorable for equity investment
- **Red backgrounds**: Risk-Off conditions - time for defensive positioning
- **Intensity varies**: Based on deviation from trend for nuanced risk assessment
### Professional Dashboard
Real-time analytics table showing:
- Current NFCI level and interpretation (TIGHT/LOOSE/NEUTRAL)
- Individual sub-index readings
- Change analysis
- Portfolio guidance (Risk On/Risk Off)
### Alert System
Professional-grade alerts for:
- Risk regime changes
- Extreme stress conditions (NFCI > 1.0)
- Bubble risk warnings (NFCI < -1.0)
- Major trend reversals
## Optimal Usage Guidelines
### Best Timeframes
- **Daily charts**: Recommended for intermediate-term positioning
- **Weekly charts**: Suitable for longer-term portfolio allocation
- **Intraday**: Less effective due to weekly update frequency
### Complementary Indicators
For enhanced analysis, combine NFCI signals with:
- **VIX levels**: Confirm stress readings
- **Credit spreads**: Validate credit sub-index signals
- **Moving averages**: Determine overall market trend context
- **Economic surprise indices**: Gauge fundamental backdrop
### Position Sizing Considerations
- **Extreme readings** (|NFCI| > 1.0): Consider higher conviction positioning
- **Moderate readings** (|NFCI| 0.3-1.0): Standard position sizing
- **Neutral readings** (|NFCI| < 0.3): Consider reduced conviction
## Important Limitations & Considerations
### Data Frequency Issues
**Critical Warning**: While the main NFCI updates weekly (typically Wednesdays), some underlying components update monthly. Corporate bond indices and commercial paper rates, which carry significant weight, may cause delayed reactions to current market conditions.
**Component Update Schedule:**
- **Weekly Updates**: Main NFCI composite, most equity volatility measures
- **Monthly Updates**: Corporate bond spreads, commercial paper rates
- **Quarterly Updates**: Banking sector surveys
- **Impact**: Significant portion of index weight may lag current conditions
### Historical Revisions
The Federal Reserve occasionally revises NFCI historical data as new information becomes available or methodologies are refined. This means backtesting results should be interpreted cautiously, and the indicator works best for forward-looking analysis rather than precise historical replication.
### Market Regime Dependency
The NFCI effectiveness may vary across different market regimes. During extended sideways markets or regime transitions, signals may be less reliable. Consider combining with trend-following indicators for optimal results.
**Bottom Line**: Use NFCI for medium-term portfolio positioning guidance. Trust the directional signals while remaining aware of data revision risks and update frequency limitations. This indicator is particularly valuable during periods of financial stress when reliable guidance is most needed.
---
**Data Source**: Federal Reserve Bank of Chicago
**Update Frequency**: Weekly (typically Wednesdays)
**Historical Coverage**: 1973-present
**Cost**: Free (public Fed data)
*This indicator is for educational and analytical purposes. Always conduct your own research and risk assessment before making investment decisions.*
## References
Brave, S., & Butters, R. A. (2011). Monitoring financial stability: A financial conditions index approach. *Economic Perspectives*, 35(1), 22-43.
English, W. B., Tsatsaronis, K., & Zoli, E. (2005). Assessing the predictive power of measures of financial conditions for macroeconomic variables. *BIS Papers*, 22, 228-252.
Hatzius, J., Hooper, P., Mishkin, F. S., Schoenholtz, K. L., & Watson, M. W. (2010). Financial conditions indexes: A fresh look after the financial crisis. *US Monetary Policy Forum Report*, No. 23.
Illing, M., & Liu, Y. (2006). Measuring financial stress in a developed country: An application to Canada. *Bank of Canada Working Paper*, 2006-02.
Kliesen, K. L., Owyang, M. T., & Vermann, E. K. (2012). Disentangling diverse measures: A survey of financial stress indexes. *Federal Reserve Bank of St. Louis Review*, 94(5), 369-397.
Koop, G., & Korobilis, D. (2014). A new index of financial conditions. *European Economic Review*, 71, 101-116.
Oet, M. V., Eiben, R., Bianco, T., Gramlich, D., & Ong, S. J. (2011). The financial stress index: Identification of systemic risk conditions. *Federal Reserve Bank of Cleveland Working Paper*, 11-30.
WVAD with Gap Compensation**Indicator Name:** WVAD with Gap Compensation
**Purpose:** Enhances the classic Williams Vix Fix (WVAD) by incorporating the impact of price gaps (jump ups/downs) in its calculation.
**Key Features:**
1. **Gap Detection:** Automatically identifies significant gaps (default: >0.5% from prior bar's high/low).
2. **Gap Compensation:** Adjusts the WVAD calculation by adding the gap size to the daily price change.
3. **Dynamic Weighting:** Applies a multiplier (1.2x or 1.5x) to the WVAD value on days with medium/large gaps (based on ATR).
4. **Visualization:**
- Plots the enhanced WVAD line (blue) and optionally the original WVAD (gray circles).
- Marks gap events with colored arrows (green ▲ for gap up, red ▼ for gap down) and connects the gap's impact with dashed lines.
- Includes a zero line for reference.
**Use Cases:**
- Gauges the true strength of money flow by accounting for gaps.
- Identifies potential trend shifts around gap events.
- Filters noise by focusing on significant gaps.
**Parameters:**
- `Accumulation Period`: Number of days to sum WVAD (default: 12).
- `Gap Threshold (%)`: Minimum gap size to trigger compensation (default: 0.5%).
- `Show Original WVAD`: Toggles display of the classic WVAD.
**Version:** Pine Script® v6

Fear and Greed Index [DunesIsland]The Fear and Greed Index is a sentiment indicator designed to measure the emotions driving the stock market, specifically investor fear and greed. Fear represents pessimism and caution, while greed reflects optimism and risk-taking. This indicator aggregates multiple market metrics to provide a comprehensive view of market sentiment, helping traders and investors gauge whether the market is overly fearful or excessively greedy.How It WorksThe Fear and Greed Index is calculated using four key market indicators, each capturing a different aspect of market sentiment:
Market Momentum (30% weight)
Measures how the S&P 500 (SPX) is performing relative to its 125-day simple moving average (SMA).
A higher value indicates that the market is trading well above its moving average, signaling greed.
Stock Price Strength (20% weight)
Calculates the net number of stocks hitting 52-week highs minus those hitting 52-week lows on the NYSE.
A greater number of net highs suggests strong market breadth and greed.
Put/Call Options (30% weight)
Uses the 5-day average of the put/call ratio.
A lower ratio (more call options being bought) indicates greed, as investors are betting on rising prices.
Market Volatility (20% weight)
Utilizes the VIX index, which measures market volatility.
Lower volatility is associated with greed, as investors are less fearful of large market swings.
Each component is normalized using a z-score over a 252-day lookback period (approximately one trading year) and scaled to a range of 0 to 100. The final Fear and Greed Index is a weighted average of these four components, with the weights specified above.Key FeaturesIndex Range: The index value ranges from 0 to 100:
0–25: Extreme Fear (red)
25–50: Fear (orange)
50–75: Neutral (yellow)
75–100: Greed (green)
Dynamic Plot Color: The plot line changes color based on the index value, visually indicating the current sentiment zone.
Reference Lines: Horizontal lines are plotted at 0, 25, 50, 75, and 100 to represent the different sentiment levels: Extreme Fear, Fear, Neutral, Greed, and Extreme Greed.
How to Interpret
Low Values (0–25): Indicate extreme fear, which may suggest that the market is oversold and could be due for a rebound.
High Values (75–100): Indicate greed, which may signal that the market is overbought and could be at risk of a correction.
Neutral Range (25–75): Suggests a balanced market sentiment, neither overly fearful nor greedy.
This indicator is a valuable tool for contrarian investors, as extreme readings often precede market reversals. However, it should be used in conjunction with other technical and fundamental analysis tools for a well-rounded view of the market.

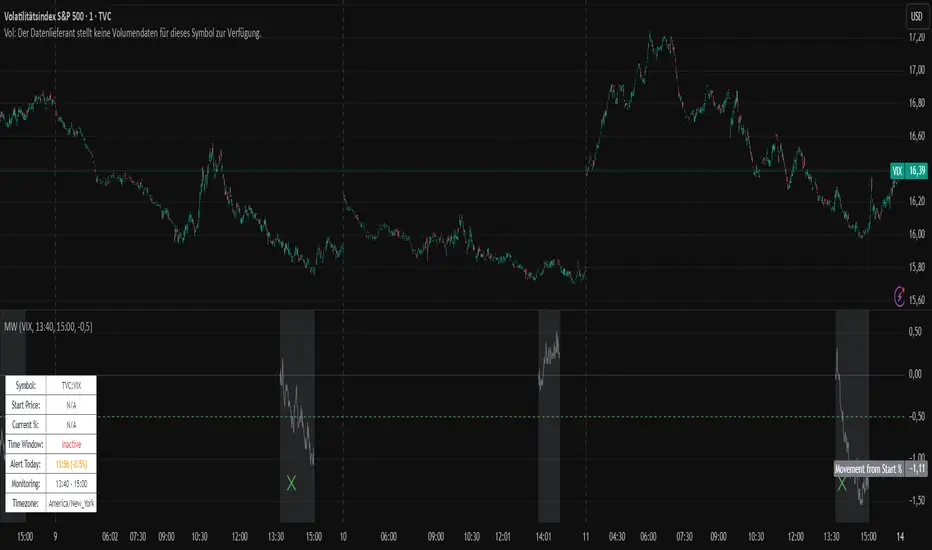
Movement WatcherMovement Watcher – Intraday Price Change Alert
This indicator tracks the percentage price movement of a selected symbol (e.g., VIX) from a configurable start time. If the intraday movement crosses a defined threshold (up or down), it triggers a one-time alert per day.
Key Features:
Monitors intraday % change from the specified start time.
Triggers one-time alerts for upper or lower threshold crossings.
Optional end time for monitoring period.
Visual plots and alert markers.
Useful for automated trading via webhook integrations.
This script was designed to work with automated trading tools such as the Trading Automation Toolbox. You can use it to generate alerts based on intraday volatility and route them via webhook for automated strategies.
Cycle Composite 3.6 WeightedThe Cycle Composite is a multi-factor market cycle model designed to classify long-term market behavior into distinct phases using normalized and weighted data inputs.
It combines ten key on-chain, dominance, volatility, sentiment, and trend-following metrics into a single composite output. The goal is to provide a clearer understanding of where the market may stand in the broader cycle (e.g., accumulation, early bull, late bull, or euphoria).
This version (3.4) introduces flexible weighting, trend strength markers, and additional context-aware signals such as risk-on confirmations and altseason flags.
Phases Identified:
The model categorizes the market into one of five zones:
Euphoria (> 85)
Late Bull (70 – 85)
Mid Bull (50 – 70)
Early Bull (30 – 50)
Fear (< 30)
Each phase is determined by a smoothed EMA of the weighted composite score.
Data Sources and Metrics Used (10 total):
BTC Dominance (CRYPTOCAP:BTC.D)
Stablecoin Dominance (USDT + USDC average) (inverted for risk-on)
ETH Dominance (CRYPTOCAP:ETH.D)
BBWP (normalized Bollinger Band Width % over 1-year window)
WVF (Williams VIX Fix for volatility spike detection)
NUPL (Net Unrealized Profit/Loss, external source)
CMF (Chaikin Money Flow, smoothed volume accumulation)
CEX Open Interest (custom input from DAO / external source)
Whale Inflows (custom input from whale exchange transfer data)
Google Trends Average (BTC, Crypto, Altcoin terms)
All inputs are normalized over a 200-bar window and combined via weighted averaging, where each weight is user-configurable.
Additional Features:
Phase Labels: Labels are printed only when a new phase is entered.
Bull Continuation Marker: Triangle up when composite makes higher highs and NUPL increases.
Weakening Marker: Triangle down when composite rolls over in Late Bull and NUPL falls.
Risk-On Signal: Green circle appears when CMF and Google Trends are both rising.
Altseason Flag: Orange diamond appears when dominance of "others.d" exceeds BTC.D and ETH.D and composite is above 50.
Background Shading: Each phase is shaded with a semi-transparent background color.
Timeframe-Aware Display: All markers and signals are shown only on weekly timeframe for clarity.
Intended Use:
This script is intended for educational and macro-trend analysis purposes.
It can be used to:
Identify macro cycle position (accumulation, bull phases, euphoria, etc.)
Spot long-term trend continuation or weakening signals
Add context to price action with external on-chain and sentiment data
Time rotation events such as altseason risk
Disclaimer:
This script does not constitute financial advice.
It is intended for informational and research purposes only.
Users should conduct their own due diligence and analysis before making investment decisions.

5DMA Optional HMA Entry📈 5DMA Optional HMA Entry Signal – Precision-Based Momentum Trigger
Category: Trend-Following / Reversal Timing / Entry Optimization
🔍 Overview:
The 5DMA Optional HMA Entry indicator is a refined price-action entry tool built for traders who rely on clean trend alignment and precise timing. This script identifies breakout-style entry points when price gains upward momentum relative to short-term moving averages — specifically the 5-day Simple Moving Average (5DMA) and an optional Hull Moving Average (HMA).
Whether you're swing trading stocks, scalping ETFs like UVXY or VXX, or looking for pullback recovery entries, this tool helps time your long entries with clarity and flexibility.
⚙️ Core Logic:
Primary Condition (Always On):
🔹 Close must be above the 5DMA – ensuring upward short-term momentum is confirmed.
Optional Condition (Toggled by User):
🔹 Close above the HMA – adds slope-responsive trend filtering for smoother setups. Enable or disable via checkbox.
Bonus Entry Filter (Optional):
🔹 Green Candle Wick Breakout – optional pattern logic that detects bullish momentum when the high pierces above both MAs, with a green body.
Reset Mechanism:
🔁 Signal resets only after price closes back below all active MAs (5DMA and HMA if enabled), reducing noise and avoiding repeated signals during chop.
🧠 Why This Works:
This indicator captures the kind of setups that professional traders look for:
Momentum crossovers without chasing late.
Mean reversion snapbacks that align with fresh bullish moves.
Avoids premature entries by requiring clear structure above moving averages.
Optional HMA filter allows adaptability: turn it off during choppy markets or range conditions, and on during trending environments.
🔔 Features:
✅ Adjustable HMA Length
✅ Enable/Disable HMA Filter
✅ Optional Green Wick Breakout Detection
✅ Visual “Buy” label plotted below qualifying bars
✅ Real-time Alert Conditions for automated trading or manual alerts
🎯 Use Cases:
VIX-based ETFs (e.g., UVXY, VXX): Catch early breakouts aligned with volatility spikes.
Growth Stocks: Time pullback entries during bullish runs.
Futures/Indices: Combine with macro levels for intraday scalps or swing setups.
Overlay on Trend Filters: Combine with RSI, MACD, or VWAP for confirmation.
🛠️ Recommended Settings:
For smooth setups in volatile names, use:
HMA Length: 20
Keep green wick filter ON
For fast momentum trades, disable the HMA filter to act on 5DMA alone.
⭐ Final Thoughts:
This script is built to serve both systematic traders and discretionary scalpers who want actionable signals without noise or lag. The toggleable HMA feature lets you adjust sensitivity depending on market conditions — a key edge in adapting to volatility cycles.
Perfect for those who value clean, non-repainting entries rooted in logical structure.

Gabriel's Squeeze Momentum PRO📌 Gabriel’s Squeeze Momentum PRO
A full-spectrum market compression, momentum, and seasonality suite engineered for cycle-aware traders.
🚀 What Is It?
Gabriel’s Squeeze Momentum PRO is an advanced trading indicator that detects volatility compression, calculates adaptive momentum, and reveals hidden seasonal opportunities. It builds on and transcends the traditional SQZMOM by incorporating spectral filters (Ehlers/MESA), Goertzel transforms, Pivot reversal logic, and optional seasonality overlays based on rolling-year returns. The script adapts to all timeframes and asset classes—stocks, futures, crypto, and forex.
🔍 Key Modules
🔸 1. Dynamic Squeeze Detection (RAFA Framework)
Identifies 5 squeeze types: Wide (🟠), Normal (🔴), Narrow (🟡), Very Narrow (🟣), and Fired (🟢).
Uses adaptive Bollinger Band and Keltner Channel thresholds unique to each timeframe (15m to 1M).
BB multiplier is adjusted dynamically via Goertzel and RMS-volatility signals.
Comes with RAFA alerts: Ready (compression), Aim (Jurik trigger), and Fire (breakout).
🔸 2. Adaptive Momentum Engine
Core momentum line: Linear regression of mid-price deviation from SMA + highest/lowest mean.
Signal line: Jurik Moving Average (JMA) with adaptive phasing and power smoothing.
Multiple normalization modes:
Unbounded (raw)
Min-Max (0–100)
RSX-based (centered -50 * 2)
Standard Deviations (via Butterworth/EMA RMS)
Optional Directional Momentum Mode: highlights histogram slope/angle with four-tier color coding.
🔸 3. MESA-Based Dynamic Bands
Calculates dominant fast and slow cycles via Maximum Entropy Spectral Analysis.
Computes a composite cyclic memory and percentile-based overbought/oversold levels.
Enables dynamic OS/OB bands that adjust with the market rhythm.
🔸 4. Multi-Timeframe MA Ribbon
Fully customizable ribbon with 5 MA slots per timeframe.
Supports 10 MA types: SMA, EMA, WMA, VWMA, RMA, DEMA, TEMA, LSMA, KAMA, TRAMA.
Includes Symmetrical MA smoothing via ta.swma() for visual consistency across volatile markets.
Optional trend coloring and ribbon overlays.
🔸 5. Goertzel + RMS-Filtered ROC
Rate of change line for momentum differentials with scaling multiplier.
Option to use Goertzel frequency detection to dynamically adjust the adaptive length.
📈 Additional Features
🔹 Williams VIX Fix Integration
Includes both standard and Inverse WVF for top/bottom detection.
Highlights both Aggressive (AE) and Filtered (FE) entry/exit zones.
Alerts and optional OBV-based squeeze dots included.
Useful for spotting reversals, early volatility expansions, and sentiment shifts.
🔹 Grab Bar System
Inspired by Michael Covel's trend-following logic.
Colors bars based on EMA(34) or RMA(28) channels to visually identify entry zones.
Overlayed trend direction markers on bar close.
🔹 Reversal Signal Lines
Plots DM-style pivot projections on momentum crossovers with configurable MA length.
Color-coded bullish and bearish setups.
🧠 Seasonality Toolkit (Seasonax Mode)
📅 Year-Based Return Modeling
Aggregates historical price returns per calendar year.
Supports 4 independent lookback periods (e.g., 5y, 10y, 15y, 30y).
Automatically filters outliers via IQR method (customizable factor setting).
📉 Detrending Options
Choose from:
Off: Raw seasonal trend
Linear: Removes regression slope
MA: Removes centered moving average
🎯 Entry/Exit Highlights
Highlights the most bullish/bearish seasonal windows using rolling return ranges.
Labels best seasonal entry and exit points on the chart.
🧰 Visual Grid & Legend
Clean grid overlay with monthly divisions.
Inline legend with custom line styles, sizes, and colors for each year set.
⚙️ Customization Highlights
Feature Options / Notes
Normalization Unbounded, Min-Max, RSX, Standard Deviation
MA Ribbon Enable/disable, Symmetry smoothing, full color & type customization
Momentum Direction Mode Directional histogram vs. baseline coloring
Reversal Logic Toggle per timeframe with custom JMA length
Cauchy Smoothing Gamma adjustable (0.1–6), optionally volume-weighted
Goertzel Filtering For adaptive momentum length and rate of change signal scaling
Timeframe Logic Fully adapts thresholds, lengths, and styles based on current chart timeframe
Seasonality Mode Custom lookbacks, overlays, trend removal, best/worst windows
📊 Alerts Included
🔔 Momentum Crossovers: Bullish/Bearish Reversals
🔔 Squeeze States: Wide, Normal, Narrow, Very Narrow, and Fired
🔔 WVF Events: Raw, Aggressive, Filtered, Inverted (Top Detection)
🔔 New Month + EOM Warnings: Seasonality-aware shift alerts
✅ Use Cases
Use Case How It Helps
🔹 Squeeze Breakout Trader Detects compression zones and high-probability breakouts
🔹 Cycle-Based Swing Trader Uses MESA filters + band dynamics to time pullbacks and mean reversion
🔹 Volatility Strategist Tracks multi-tier squeeze states across intraday to monthly charts
🔹 Seasonal Analyst Highlights best/worst periods using historical seasonality and anomaly logic
🔹 Reversal Sniper Uses signal cross + DM-pivots for precise reversal line placement
🎓 Advanced Math Behind It
Spectral Analysis: MESA (John Ehlers), Goertzel Transform
High/Low-Pass Filtering: 2-pole Butterworth + Super Smoother
Momentum Deviation: Linear regression + SMA + Cauchy-weighted midlines
Cyclic Band Percentiles: Rolling histograms, percentile mapping
Seasonal Aggregation: Rolling years + IQR outlier pruning
Volatility Proxy: RMS + adaptive deviation = signal-agnostic band precision

Project SynthIntroducing Project Synth !
Inspired by Pace of Tape and Cumulative Delta I created Project Synth in order to aggregate volume flow data across multiple marketsfor two primary reasions:
Traditional orderflow tools are not available on Tradingview. My script attempts to bring an original; calculus-based approach to creating not only an alternative for traditional orderflow tools, but also a more accurate one.
In order to detect genuine buying and selling pressure that cannot be easily manipulated. I did this because while I've always enjoyed concept behind both of those tools, I did not think they captured enough data to be useful. By analyzing assets that move together (positive correlation) and assets that move inversely (negative correlation), my system aims to fix the fundamental problems with those indicators and create an objective view of market sentiment based on aggregate orderflow.
Some more detailed explanations (using QQQ and SQQQ as an example):
Inverse Market Dynamics (QQQ vs SQQQ):
In an inverse market like SQQQ, aggressive buyers hit the ask when they expect the underlying (QQQ) to fall, while passive buyers wait on the bid hoping for cheaper inverse exposure. When QQQ rallies, SQQQ sees aggressive selling (people dumping their bearish bets) hitting bids, while passive sellers sit on the ask hoping to exit at better prices. The aggression flows opposite to the underlying market direction.
Why Utilizing Both Markets Provides A More Accurate Delta:
Watching both QQQ and SQQQ gives cross-validation - real buying pressure in QQQ should coincide with selling pressure in SQQQ. If you see buying in QQQ but also buying in SQQQ, that's a conflicting signal suggesting the move might be artificial or driven by other factors. The inverse relationship acts as a confirmation filter, making false signals much harder to generate.
Multiple Markets = Authentic Pressure:
The more unique, important markets you track, the harder it becomes to create fake delta moves. Real institutional buying/selling pressure affects multiple correlated assets simultaneously in predictable patterns - you can't easily manipulate tech stocks, treasury bonds, VIX, and currency pairs all at once to create a false signal. Each additional market acts as a fraud detection layer, ensuring the delta measurement reflects genuine ecosystem-wide buying and selling pressure rather than isolated manipulation or noise.
My Suggestions For Usage:
In order to keep the explanation simple and short for now, I suggest using it just like a cumulative delta indicator. For example: let's say you were watching CME_MINI:ES1! , and you had a resistance level at 6000. When the price reaches your resistance level, you would be looking for a significant divergence between price and Delta. Price : rising, Delta : falling. This means that even though the price was going up, strong and aggressive sellers are jumping in more and more, this can be used as a confirmation tool for a resistance level.
Notes For Moderators, Authors and Users:
Firstly, to the best of my knowledge, I have not been able to find many tools built around the concept of cumulative delta or pace of tape. While I know there are a couple projects, none to the magnitude of synthetically recreating these tools via an algorithm designed around basic calculus principles. While tools like Volume Delta are built in, they do not attempt to capture an accurate picture of aggregated orderflow from what I understand.
Secondly, it needs to be noted that tool aims to create an approximation of buying and selling pressure. To my knowledge it is not possible to create an accurate full picture, at least not within the limitations of Tradingview.

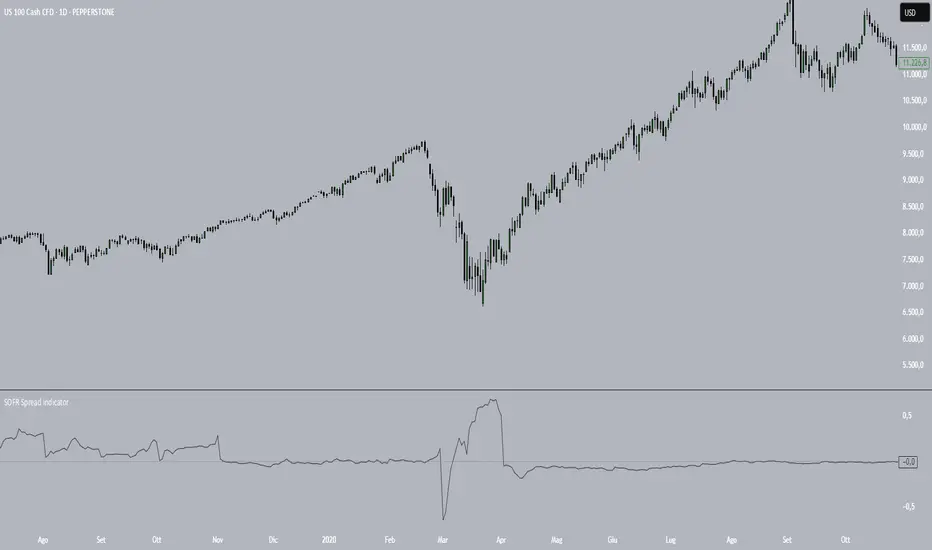
SOFR Spread (proxy: FEDFUNDS - US03MY)📊 SOFR Spread (Proxy: FEDFUNDS - US03MY) – Monitoring USD Money Market Liquidity
In 2008, the spread exhibits a sharp vertical spike, signaling a severe liquidity dislocation: investors rushed into short-term U.S. Treasuries, pushing their yields down dramatically, while the FEDFUNDS rate remained relatively high.
This behavior indicates extreme systemic stress in the interbank lending market, preceding massive Federal Reserve interventions such as rate cuts, emergency liquidity operations, and the launch of quantitative easing (QE).
Description:
This indicator plots the spread between the Effective Federal Funds Rate (FEDFUNDS) and the 3-Month US Treasury Bill yield (US03MY), used here as a proxy for the SOFR spread.
It serves as a simple yet powerful tool to detect liquidity dislocations and stress signals in the US short-term funding markets.
Interpretation:
🔴 Spread > 0.20% → Possible liquidity stress: elevated repo rates, cash shortage, interbank distrust.
🟡 Spread ≈ 0% → Normal market conditions, balanced liquidity.
🟢 Spread < 0% → Excess liquidity: strong demand for T-Bills, “flight to safety”, or distortion due to expansionary monetary policy.
Ideal for:
Monitoring Fed policy impact
Anticipating market-wide liquidity squeezes
Correlation with DXY, SPX, VIX, MOVE Index, and risk sentiment
🧠 Note: As SOFR is not directly available on TradingView, FEDFUNDS is used as a reliable proxy, closely tracking the same trends in most macro conditions.
JPMorgan G7 Volatility IndexThe JPMorgan G7 Volatility Index: Scientific Analysis and Professional Applications
Introduction
The JPMorgan G7 Volatility Index (G7VOL) represents a sophisticated metric for monitoring currency market volatility across major developed economies. This indicator functions as an approximation of JPMorgan's proprietary volatility indices, providing traders and investors with a normalized measurement of cross-currency volatility conditions (Clark, 2019).
Theoretical Foundation
Currency volatility is fundamentally defined as "the statistical measure of the dispersion of returns for a given security or market index" (Hull, 2018, p.127). In the context of G7 currencies, this volatility measurement becomes particularly significant due to the economic importance of these nations, which collectively represent more than 50% of global nominal GDP (IMF, 2022).
According to Menkhoff et al. (2012, p.685), "currency volatility serves as a global risk factor that affects expected returns across different asset classes." This finding underscores the importance of monitoring G7 currency volatility as a proxy for global financial conditions.
Methodology
The G7VOL indicator employs a multi-step calculation process:
Individual volatility calculation for seven major currency pairs using standard deviation normalized by price (Lo, 2002)
- Weighted-average combination of these volatilities to form a composite index
- Normalization against historical bands to create a standardized scale
- Visual representation through dynamic coloring that reflects current market conditions
The mathematical foundation follows the volatility calculation methodology proposed by Bollerslev et al. (2018):
Volatility = σ(returns) / price × 100
Where σ represents standard deviation calculated over a specified timeframe, typically 20 periods as recommended by the Bank for International Settlements (BIS, 2020).
Professional Applications
Professional traders and institutional investors employ the G7VOL indicator in several key ways:
1. Risk Management Signaling
According to research by Adrian and Brunnermeier (2016), elevated currency volatility often precedes broader market stress. When the G7VOL breaches its high volatility threshold (typically 1.5 times the 100-period average), portfolio managers frequently reduce risk exposure across asset classes. As noted by Borio (2019, p.17), "currency volatility spikes have historically preceded equity market corrections by 2-7 trading days."
2. Counter-Cyclical Investment Strategy
Low G7 volatility periods (readings below the lower band) tend to coincide with what Shin (2017) describes as "risk-on" environments. Professional investors often use these signals to increase allocations to higher-beta assets and emerging markets. Campbell et al. (2021) found that G7 volatility in the lowest quintile historically preceded emerging market outperformance by an average of 3.7% over subsequent quarters.
3. Regime Identification
The normalized volatility framework enables identification of distinct market regimes:
- Readings above 1.0: Crisis/high volatility regime
- Readings between -0.5 and 0.5: Normal volatility regime
- Readings below -1.0: Unusually calm markets
According to Rey (2015), these regimes have significant implications for global monetary policy transmission mechanisms and cross-border capital flows.
Interpretation and Trading Applications
G7 currency volatility serves as a barometer for global financial conditions due to these currencies' centrality in international trade and reserve status. As noted by Gagnon and Ihrig (2021, p.423), "G7 currency volatility captures both trade-related uncertainty and broader financial market risk appetites."
Professional traders apply this indicator in multiple contexts:
- Leading indicator: Research from the Federal Reserve Board (Powell, 2020) suggests G7 volatility often leads VIX movements by 1-3 days, providing advance warning of broader market volatility.
- Correlation shifts: During periods of elevated G7 volatility, cross-asset correlations typically increase what Brunnermeier and Pedersen (2009) term "correlation breakdown during stress periods." This phenomenon informs portfolio diversification strategies.
- Carry trade timing: Currency carry strategies perform best during low volatility regimes as documented by Lustig et al. (2011). The G7VOL indicator provides objective thresholds for initiating or exiting such positions.
References
Adrian, T. and Brunnermeier, M.K. (2016) 'CoVaR', American Economic Review, 106(7), pp.1705-1741.
Bank for International Settlements (2020) Monitoring Volatility in Foreign Exchange Markets. BIS Quarterly Review, December 2020.
Bollerslev, T., Patton, A.J. and Quaedvlieg, R. (2018) 'Modeling and forecasting (un)reliable realized volatilities', Journal of Econometrics, 204(1), pp.112-130.
Borio, C. (2019) 'Monetary policy in the grip of a pincer movement', BIS Working Papers, No. 706.
Brunnermeier, M.K. and Pedersen, L.H. (2009) 'Market liquidity and funding liquidity', Review of Financial Studies, 22(6), pp.2201-2238.
Campbell, J.Y., Sunderam, A. and Viceira, L.M. (2021) 'Inflation Bets or Deflation Hedges? The Changing Risks of Nominal Bonds', Critical Finance Review, 10(2), pp.303-336.
Clark, J. (2019) 'Currency Volatility and Macro Fundamentals', JPMorgan Global FX Research Quarterly, Fall 2019.
Gagnon, J.E. and Ihrig, J. (2021) 'What drives foreign exchange markets?', International Finance, 24(3), pp.414-428.
Hull, J.C. (2018) Options, Futures, and Other Derivatives. 10th edn. London: Pearson.
International Monetary Fund (2022) World Economic Outlook Database. Washington, DC: IMF.
Lo, A.W. (2002) 'The statistics of Sharpe ratios', Financial Analysts Journal, 58(4), pp.36-52.
Lustig, H., Roussanov, N. and Verdelhan, A. (2011) 'Common risk factors in currency markets', Review of Financial Studies, 24(11), pp.3731-3777.
Menkhoff, L., Sarno, L., Schmeling, M. and Schrimpf, A. (2012) 'Carry trades and global foreign exchange volatility', Journal of Finance, 67(2), pp.681-718.
Powell, J. (2020) Monetary Policy and Price Stability. Speech at Jackson Hole Economic Symposium, August 27, 2020.
Rey, H. (2015) 'Dilemma not trilemma: The global financial cycle and monetary policy independence', NBER Working Paper No. 21162.
Shin, H.S. (2017) 'The bank/capital markets nexus goes global', Bank for International Settlements Speech, January 15, 2017.

Bloomberg Financial Conditions Index (Proxy)The Bloomberg Financial Conditions Index (BFCI): A Proxy Implementation
Financial conditions indices (FCIs) have become essential tools for economists, policymakers, and market participants seeking to quantify and monitor the overall state of financial markets. Among these measures, the Bloomberg Financial Conditions Index (BFCI) has emerged as a particularly influential metric. Originally developed by Bloomberg L.P., the BFCI provides a comprehensive assessment of stress or ease in financial markets by aggregating various market-based indicators into a single, standardized value (Hatzius et al., 2010).
The original Bloomberg Financial Conditions Index synthesizes approximately 50 different financial market variables, including money market indicators, bond market spreads, equity market valuations, and volatility measures. These variables are normalized using a Z-score methodology, weighted according to their relative importance to overall financial conditions, and then aggregated to produce a composite index (Carlson et al., 2014). The resulting measure is centered around zero, with positive values indicating accommodative financial conditions and negative values representing tighter conditions relative to historical norms.
As Angelopoulou et al. (2014) note, financial conditions indices like the BFCI serve as forward-looking indicators that can signal potential economic developments before they manifest in traditional macroeconomic data. Research by Adrian et al. (2019) demonstrates that deteriorating financial conditions, as measured by indices such as the BFCI, often precede economic downturns by several months, making these indices valuable tools for predicting changes in economic activity.
Proxy Implementation Approach
The implementation presented in this Pine Script indicator represents a proxy of the original Bloomberg Financial Conditions Index, attempting to capture its essential features while acknowledging several significant constraints. Most critically, while the original BFCI incorporates approximately 50 financial variables, this proxy version utilizes only six key market components due to data accessibility limitations within the TradingView platform.
These components include:
Equity market performance (using SPY as a proxy for S&P 500)
Bond market yields (using TLT as a proxy for 20+ year Treasury yields)
Credit spreads (using the ratio between LQD and HYG as a proxy for investment-grade to high-yield spreads)
Market volatility (using VIX directly)
Short-term liquidity conditions (using SHY relative to equity prices as a proxy)
Each component is transformed into a Z-score based on log returns, weighted according to approximated importance (with weights derived from literature on financial conditions indices by Brave and Butters, 2011), and aggregated into a composite measure.
Differences from the Original BFCI
The methodology employed in this proxy differs from the original BFCI in several important ways. First, the variable selection is necessarily limited compared to Bloomberg's comprehensive approach. Second, the proxy relies on ETFs and publicly available indices rather than direct market rates and spreads used in the original. Third, the weighting scheme, while informed by academic literature, is simplified compared to Bloomberg's proprietary methodology, which may employ more sophisticated statistical techniques such as principal component analysis (Kliesen et al., 2012).
These differences mean that while the proxy BFCI captures the general direction and magnitude of financial conditions, it may not perfectly replicate the precision or sensitivity of the original index. As Aramonte et al. (2013) suggest, simplified proxies of financial conditions indices typically capture broad movements in financial conditions but may miss nuanced shifts in specific market segments that more comprehensive indices detect.
Practical Applications and Limitations
Despite these limitations, research by Arregui et al. (2018) indicates that even simplified financial conditions indices constructed from a limited set of variables can provide valuable signals about market stress and future economic activity. The proxy BFCI implemented here still offers significant insight into the relative ease or tightness of financial conditions, particularly during periods of market stress when correlations among financial variables tend to increase (Rey, 2015).
In practical applications, users should interpret this proxy BFCI as a directional indicator rather than an exact replication of Bloomberg's proprietary index. When the index moves substantially into negative territory, it suggests deteriorating financial conditions that may precede economic weakness. Conversely, strongly positive readings indicate unusually accommodative financial conditions that might support economic expansion but potentially also signal excessive risk-taking behavior in markets (López-Salido et al., 2017).
The visual implementation employs a color gradient system that enhances interpretation, with blue representing neutral conditions, green indicating accommodative conditions, and red signaling tightening conditions—a design choice informed by research on optimal data visualization in financial contexts (Few, 2009).
References
Adrian, T., Boyarchenko, N. and Giannone, D. (2019) 'Vulnerable Growth', American Economic Review, 109(4), pp. 1263-1289.
Angelopoulou, E., Balfoussia, H. and Gibson, H. (2014) 'Building a financial conditions index for the euro area and selected euro area countries: what does it tell us about the crisis?', Economic Modelling, 38, pp. 392-403.
Aramonte, S., Rosen, S. and Schindler, J. (2013) 'Assessing and Combining Financial Conditions Indexes', Finance and Economics Discussion Series, Federal Reserve Board, Washington, D.C.
Arregui, N., Elekdag, S., Gelos, G., Lafarguette, R. and Seneviratne, D. (2018) 'Can Countries Manage Their Financial Conditions Amid Globalization?', IMF Working Paper No. 18/15.
Brave, S. and Butters, R. (2011) 'Monitoring financial stability: A financial conditions index approach', Economic Perspectives, Federal Reserve Bank of Chicago, 35(1), pp. 22-43.
Carlson, M., Lewis, K. and Nelson, W. (2014) 'Using policy intervention to identify financial stress', International Journal of Finance & Economics, 19(1), pp. 59-72.
Few, S. (2009) Now You See It: Simple Visualization Techniques for Quantitative Analysis. Analytics Press, Oakland, CA.
Hatzius, J., Hooper, P., Mishkin, F., Schoenholtz, K. and Watson, M. (2010) 'Financial Conditions Indexes: A Fresh Look after the Financial Crisis', NBER Working Paper No. 16150.
Kliesen, K., Owyang, M. and Vermann, E. (2012) 'Disentangling Diverse Measures: A Survey of Financial Stress Indexes', Federal Reserve Bank of St. Louis Review, 94(5), pp. 369-397.
López-Salido, D., Stein, J. and Zakrajšek, E. (2017) 'Credit-Market Sentiment and the Business Cycle', The Quarterly Journal of Economics, 132(3), pp. 1373-1426.
Rey, H. (2015) 'Dilemma not Trilemma: The Global Financial Cycle and Monetary Policy Independence', NBER Working Paper No. 21162.

RSI Z-Score + TableHow It Works
RSI Calculation
The standard RSI is computed over a user-defined period (default: 14), measuring the strength of recent price movements.
Z-Score Transformation
The RSI is then normalized using the Z-Score formula:
ini
Kopieren
Bearbeiten
Z = (RSI - Mean) / Standard Deviation
This highlights whether RSI is unusually high or low compared to its historical behavior.
Smoothing
An optional EMA is applied to the Z-Score for smoother and more reliable signals (default: 10-period smoothing).
Z-Score Table
A real-time value of the RSI Z-Score is displayed in a table in the top-right of the indicator pane.
The value is clamped between +2 and -2
+2 aligns with strong overbought RSI conditions
-2 aligns with strong oversold RSI conditions
How to Use It
Buy Signal Potential: When the Z-Score drops below -1.5 or -2 → statistically oversold RSI
Sell Signal Potential: When the Z-Score rises above +1.5 or +2 → statistically overbought RSI
Use in Confluence: Combine with price action, trend filters, or other Z-Score indicators (e.g. OBV, VWAP, VIX) for SDCA or mean-reversion strategies

Market Warning Dashboard Enhanced📊 Market Warning Dashboard Enhanced
A powerful macro risk dashboard that tracks and visualizes early signs of market instability across multiple key indicators—presented in a clean, professional layout with a real-time thermometer-style danger gauge.
🔍 Included Macro Signals:
Yield Curve Inversion: 10Y-2Y and 10Y-3M spreads
Credit Spreads: High-yield (HYG) vs Investment Grade (LQD)
Volatility Structure: VIX/VXV ratio
Breadth Estimate: SPY vs 50-day MA (as a proxy)
🔥 Features:
Real-time Danger Score: 0 (Safe) to 100 (Extreme Risk)
Descriptive warnings for each signal
Color-coded thermometer gauge
Alert conditions for each macro risk
Background shifts on rising systemic risk
⚠️ This dashboard can save your portfolio by alerting you to macro trouble before it hits the headlines—ideal for swing traders, long-term investors, and anyone who doesn’t want to get blindsided by systemic risk.
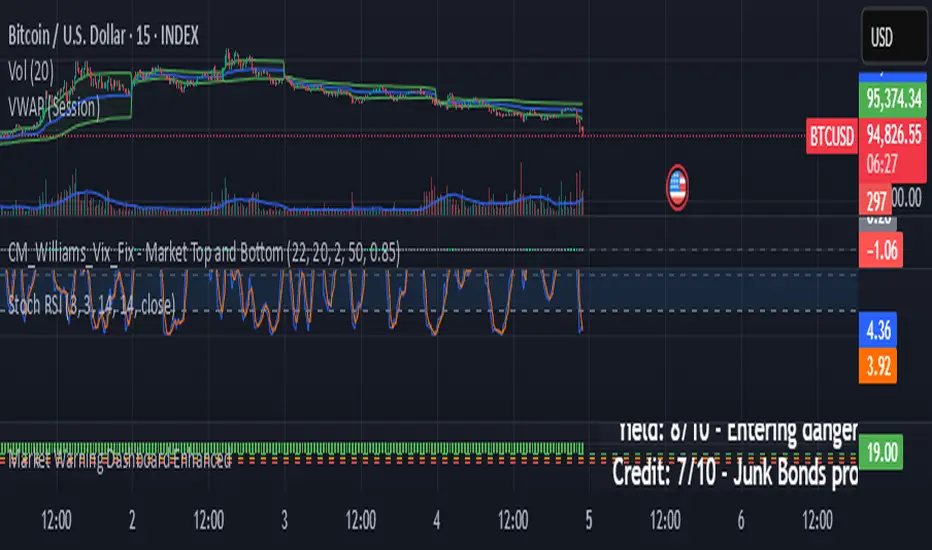
Stochastics + CM Williams VixFix (Simple Buy Signal)📈 Stochastics + CM Williams VixFix (Simple Buy Signal)
This indicator combines two powerful tools to detect potential bottoming opportunities:
✅ Stochastics: Looks for momentum reversals. A signal is triggered when both %K and %D are below the oversold threshold (default: 20), suggesting the asset is deeply oversold.
✅ CM Williams Vix Fix: A volatility-based fear detector. When it spikes above its dynamic threshold, it indicates potential panic selling — often preceding a market bounce.
💡 Buy Signal is generated when:
%K and %D are both below 20
VixFix shows a volatility spike (green condition)
Use this script to identify high-probability reversal setups, especially during market corrections or panic phases.
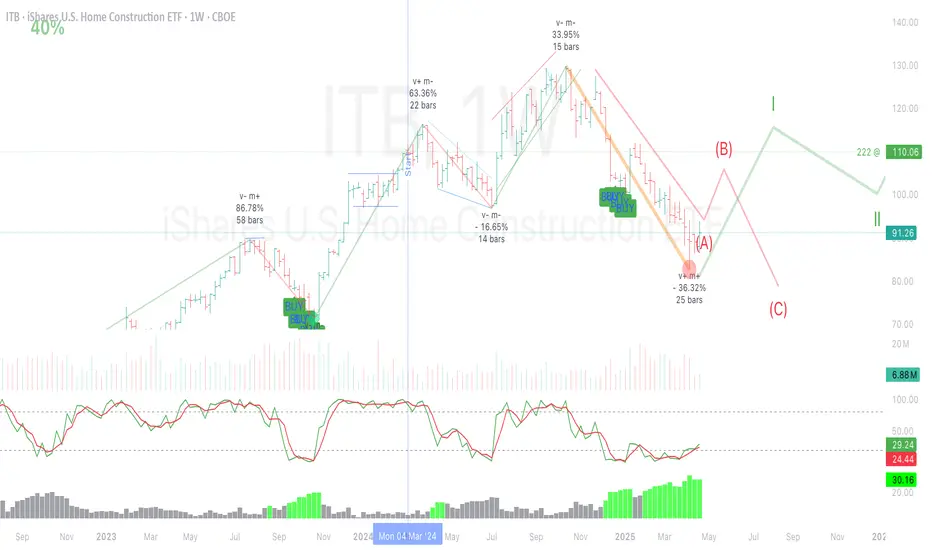
Live Risk On/Off Sentiment Big Basket🔥 Live Risk On/Off Sentiment Indicator 🔥
This indicator provides a clear and immediate assessment of global market risk sentiment by combining multiple key financial instruments across various asset classes. It helps traders quickly gauge whether the market is currently in a risk-on or risk-off environment.
📈 Included Assets:
- Risk-off indicators:** VIX, Gold, US Dollar Index (DXY), US10Y Treasury Yields, TLT (Treasury Bonds)
- Risk-on indicators:** S&P 500 (SPY), Bitcoin (BTC), High Yield Bonds (HYG), AUD/JPY (Forex), Copper/Gold ratio, and Oil (WTI)
🛠️ How it Works:
The indicator calculates a weighted Z-score for each asset, dynamically capturing its performance relative to recent history. Positive values (green) indicate a risk-on sentiment, while negative values (red) suggest a risk-off sentiment.
🚨 Features:
- Fully customizable asset selection and weighting
- Easy-to-understand visual signals
- Adaptable lookback period for short-term and long-term market analysis
💡 How to Use:
- Identify market phases quickly (bullish or bearish sentiment).
- Enhance your decision-making for entries and exits based on broader market conditions.
- Incorporate into any trading strategy to improve alignment with global risk sentiment.
Harness the power of macro analysis and elevate your trading performance!
Enjoy and trade smart! 📊📈
Riseofatrader

Risk-On vs Risk-Off Meter (Pro)Risk-On vs Risk-Off Meter (Pro)
This macro-based tool analyzes capital flows across key assets to gauge overall market risk sentiment. It does not use ES, SPY, or stock data directly—making it a powerful confirmation tool for ES traders looking to align with macro forces.
🔹 Core Idea:
Tracks capital rotation between copper/gold, bonds, dollar, crude oil, VIX, and yield spreads to generate a normalized risk score (0–1). This score reflects whether macro money is flowing into risk or safety.
🔹 Use:
Use this indicator as confirmation of directional bias when scalping or day trading ES.
– Green Zone (>0.75): Risk-On environment. Favor long setups.
– Red Zone (<0.45): Risk-Off. Favor short setups or stand aside.
– Yellow Zone: Neutral, use caution.
– Divergence Alerts: Signals when ES price disagrees with macro risk trend—potential reversals or exhaustion zones.
HOT TO USE
– Combine with your existing price action or order flow signals
– Avoid trading against the macro sentiment unless strong setup
– Use divergence as a heads-up for fading or exiting trades
This gives you a macro-informed lens to validate or filter your entries.