ZoneBand (@Mido_yuiya)Bollinger band is converted to EMA , and support and resistance bands are made into regions
Wyszukaj w skryptach "usdjpy"

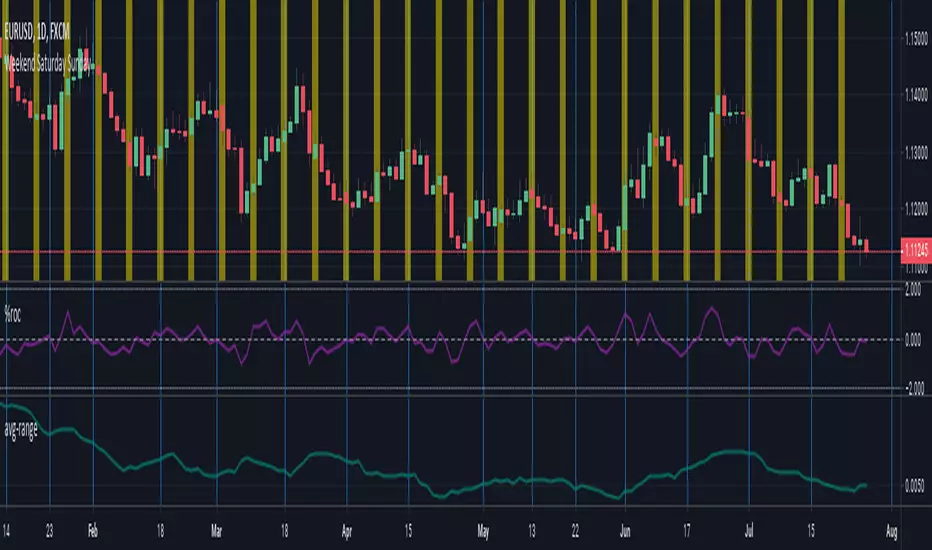
ka66: Average RangePlots the average range of current symbol, in a particular resolution (daily by default) averaged across a configurable period (20 by default). Increase or decrease precision through the UI to make it better applicable to your instrument. The default precision is set to 4, useful for most forex pairs pip counting (multiply by 10,000 to get the pip value). But for USDJPY, you might change it to 2 (multiply by 1,00 to get the pip value). Range is defined as (high - low).
For different measures of ticks, you can set the Scale Multiplier input to adjust the scale by some factor. Deliberately allowing floats. In the Forex example, if you did not wish to mentally calculate pips, you would set the multiplier to 10,000 for 4-decimal place pairs and 100 for 2-decimal place pairs. Defaults to 1.
Inputs:
Resolution, the timeframe to use
Averaging Period, no. of past bars to average over. Just using a simple moving average.
Scale Multiplier, a positive integer value to multiply the scale by
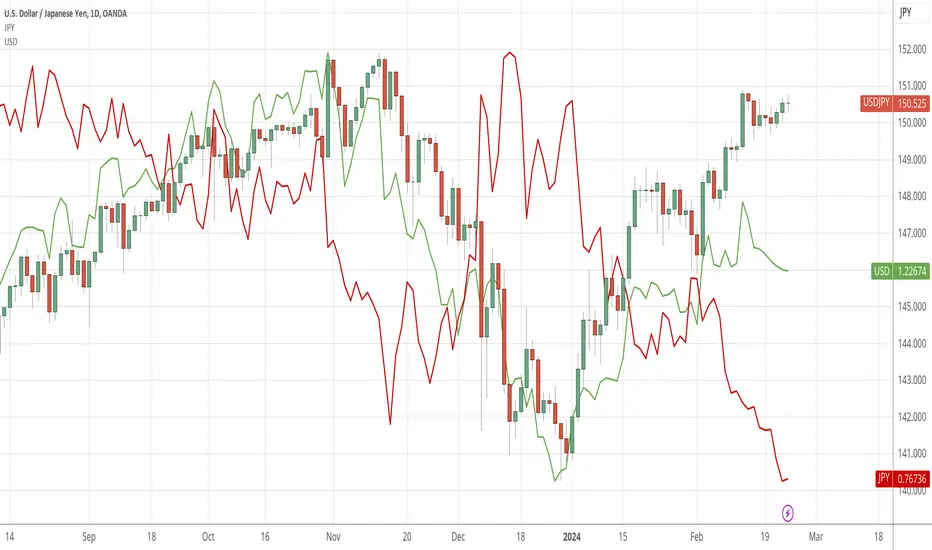
JPY RSCJPY Relative Strength Comparison to the basket of other major currencies.
jpy = (1/usdjpy + 1/cadjpy + 1/chfjpy + 1/eurjpy + 1/gbpjpy + 1/audjpy + 1/nzdjpy)/0.07

USD Relative Strength Comparison (RSC)Simple indicator implementing relative strength against the equally weighted basket of major currencies. Perhaps I will coin it the Equally Weighted Index (EWI) and trademark it like ICE did with DXY.
usd = (usdjpy/100 + usdcad + 1/gbpusd + 1/eurusd + usdchf + 1/audusd + 1/nzdusd)/7
DXY is hard to compare against other indices because of it's weightening. Secondly it does not compare against all majors and includes SEK which is not a major currency. Source: Wikipedia .
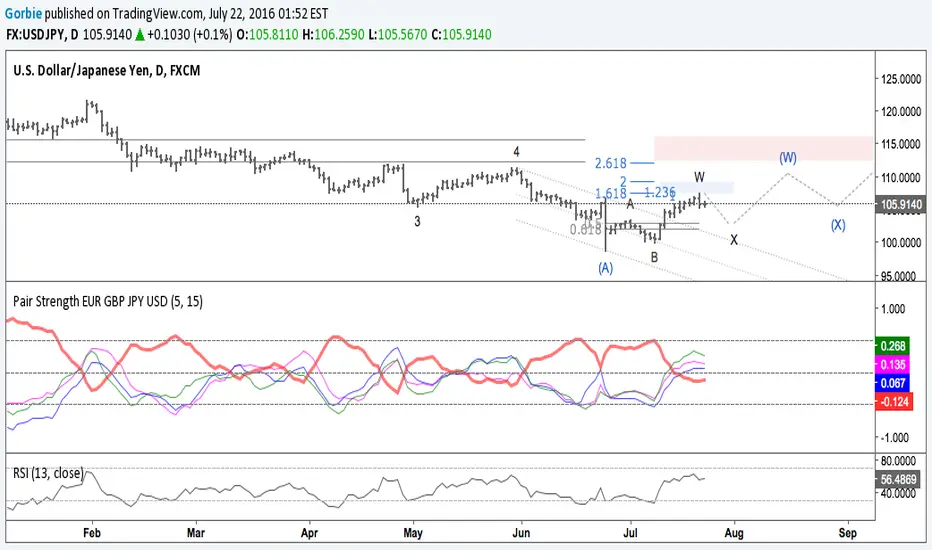
In this chart it becomes more clear why GU is in an uptrend. From April 25th USD has been consolidating against the basket of majors while GBP has gained in strength against the same basket.
gbp = (gbpusd + gbpjpy/100 + gbpcad + 1/eurgbp + gbpchf + gbpaud + gbpnzd)/7

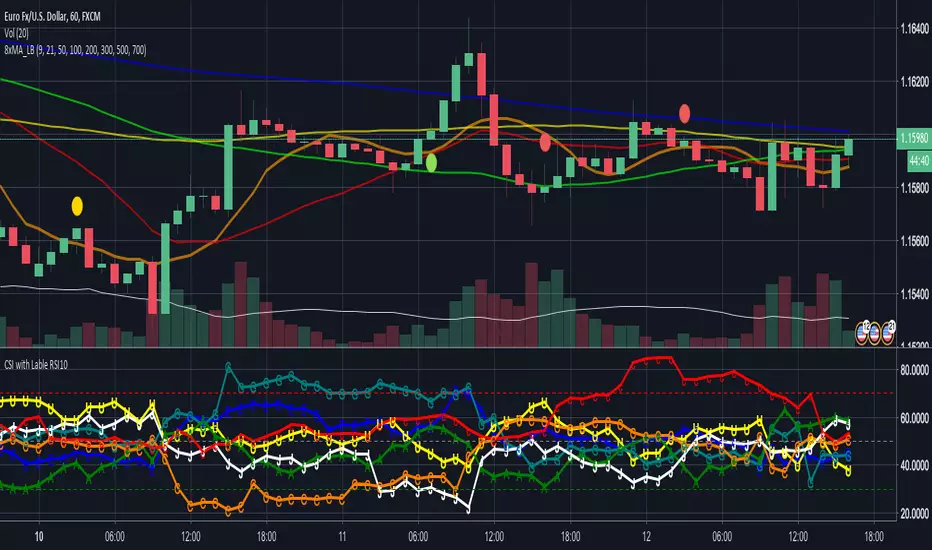
CSI - Currency strength indicator RSI 10This Indicator shows you the strength of the Currency in comparison for all other Main Currencys at the timeframe you choose.
The Currencys in this Indicator is: EUR, USD, GBP, CHF, AUD, CAD, JPY
The Base is the RSI (relative strength Indicator) with the following Currency pairs:
eurusd, eurgbp, euraud, eurjpy, eurcad, eurchf
usdeur, usdgbp, usdaud, usdjpy, usdcad, usdchf
gbpeur, gbpusd, gbpaud, gbpjpy, gbpcad, gbpchf
audeur, audusd, audgbp, audjpy, audcad, audchf
jpyeur, jpyusd, jpyaud, jpygbp, jpycad, jpychf
cadeur, cadusd, cadaud, cadgbp, cadjpy, cadchf
chfeur, chfusd, chfaud, chfgbp, chfjpy, chfcad
The letters in the LineChart:
EUR = E
USD = U
GBP = G
CHF = C
AUD = A
CAD = C
JPY = J
The CSI can help to see, if your trading pair have the potential to breakout on the support and resistance or if it more likely go back.
Some people say that the banks use this indicator.
NZD is missing there because Tradingview only support 6 variables.
If you have a solution for than, please let me know.
Thanks
quit your bullshit! Heikin-Ashi Backtest with Real Candle ValuesMade in a few minutes to debunk all the bullshit going around tradingview and everywhere about "heikin-ashi" being a holy grail trend indicator.
Do not be deceived.
Heikin-Ashi is a beautiful way to remove much of the noise in markets, and is light on the eyes. (nice and smooth!)
I personally use heikin-ashi as a way to remove a lot of the clutter in the markets, allowing me to trade with less emotion.
While heikin-ashi is a great way to visualize trends, it is NOT a good trend indicator because its displayed values do not align with actual trading values.
Therefore, entry and exit points for many of the ideas published about heikin-ashi for trade are inaccurate.
::: When Heikin-Ashi changes colour for x candles, a new trade is created on the open of the following real candle.
In practice, Heikin-Ashi is much closer to break even.
As tested, Heikin-Ashi trend trading works better on pairs that have clearer definitions of trends and are less often in consolidation. (ex. USDJPY)
Usage:
Switch to normal candlestick chart.
Features:
Change the period for new trades. (For example: x amount of red candles after a green candle to signify short trade)

FX Risk Position Calculator (USD)FX Risk Position Calculator (USD)
Automatic calculation
AUDCAD, AUDCHF, AUDJPY, AUDNZD, AUDUSD, CADJPY, CHFJPY, EURAUD, EURCAD, EURCHF, EURGBP, EURJPY, EURUSD, GBPAUD, GBPCAD, GBPCHF, GBPJPY, GBPNZD, GBPUSD, HKDJPY, MXNJPY, NOKJPY, NZDJPY, NZDUSD, PLNJPY, SEKJPY, SGDJPY, TRYJPY, USDCAD, USDCHF, USDJPY, USDTRY, USDZAR, ZARJPY, CHNJPY

FX Risk Position CalculatorFX Risk Position Calculator
ストップロスPipsに対して投資資金の何%までを許容し何枚数まででトレードをするかを計算し表示するインジケータです。
デフォルトで100万円の投資資金に対してストップロス30pips、リスク2%で、千通貨で取引するときの枚数が表示されます。
自動で計算できる通貨ペアは、
AUDCAD、AUDCHF、AUDJPY、AUDNZD、AUDUSD、CADJPY、CHFJPY、EURAUD、EURCAD、EURCHF、EURGBP、EURJPY、EURUSD、GBPAUD、GBPCAD、GBPCHF、GBPJPY、GBPNZD、GBPUSD、HKDJPY、MXNJPY、NOKJPY、NZDJPY、NZDUSD、PLNJPY、SEKJPY、SGDJPY、TRYJPY、USDCAD、USDCHF、USDJPY、USDTRY、USDZAR、ZARJPY、CHNJPY
が対応し、動作確認を行っています。表示までに若干時間がかかります。
それ以外の通貨ペアは、[決済通貨]で「yyy/xxx」のx部の通貨を選択することで算出できます。
[四捨五入桁位置]で算出後の枚数に対して四捨五入して指定された桁数にします。
《設定例》
(計算結果23.78枚に対して)
「0」を設定:23.00
「1」を設定:23.80
「-1」を設定:20.00

BTC World Price: Multi-Exchange VWAPBTC World Price: Multi-Exchange VWAP
__________________________
WHAT IT DOES
What you see above are not Bitmex candles, but this indicator's.
Bitcoin is listed on multiple exchanges. Many people have called for a single global index that would quote BTC price and volume across all exchanges: this script is such a virtual aggregate (formerly: Multi-Listed , Volume-Weighted Average Price ).
It will, independently for each tick, for any time-frame:
- Quote the price (O, H, L, C) and volume from Bitfinex (USD), Binance (USDT), bitFlyer (Yen), Bithumb (S. Korean Won), Coinbase (USD), Kraken (EUR) and even Bitmex (USD Contracts).
- Weight each price with the corresponding volume of the exchange.
- Quote the FOREX conversion rate in USD for each currency (USDJPY etc.)
- Finally return global average price (candles) in USD.
- Additionally provide (H+L)/2 etc. values.
No more "on Coinbase this" or "on Bitstamp that", you've now got a global overview!
See CoinMarketCap: Markets for reference. I've included alternative exchanges in the comments at the top of the script.
__________________________
HOW TO USE IT
Basically just add it to your chart and use the indicator's candles instead of the chart's main ticker.
By default, BTC World Price will display candles only, but you can also display OHLC & averages (in whichever style you want).
You may indeed want to hide the main symbol (top-left corner, click the 'eye' button next to its name), or switch it to something else than candles/bars (e.g. line).
Make sure "Scale Price Chart Only" is disabled if you want to use the auto-zoom feature. (if other indicators are messing your zoom, you can try to select "Line with Breaks" or "Area with Breaks" to allow these to overflow from the main window)
By clicking the triangle next to the indicator's name, you can select "Visual Order" (e.g "Bring to Front").
You can select regular Candles or Heikin-Ashi in Options.
In the Format > Inputs tab, you can select which exchanges to quote. By default, all of them are enabled.
The script also exposes the following typical values to the backend, which you can use as Price Source for other indicators: (e.g. MA, RSI, in their "Format > Input" tab)
Open Price (grey)
High Price (green)
Low Price (red)
Close Price (white)
(H + L)/2 (light blue)
(H + L + C)/3 (blue)
(O + H + L + C)/4 (purple)
They are all hidden by default (by means of maximum transparency).
In the Format > Style tab, you can change their color, transparency and style (line, area, etc), as well as uncheck Candles and Wicks to hide these.
If you are using "Indicator Last Value" and want to clear the clutter from all these values, simply uncheck them in Style. They will still be available as Price Source for other indicators.
You can also choose to scale it to the left, right (default) or "screen" (no scaling).
Once you're satisfied with your Style, you may click "Default"> "Save as default" in the botton-left. Everytime you load the indicator, it will look the same. ("Reset Settings" will reset to the script's defaults)
__________________________
Please leave feedback below in comments or pm me directly for bugs and suggestions.

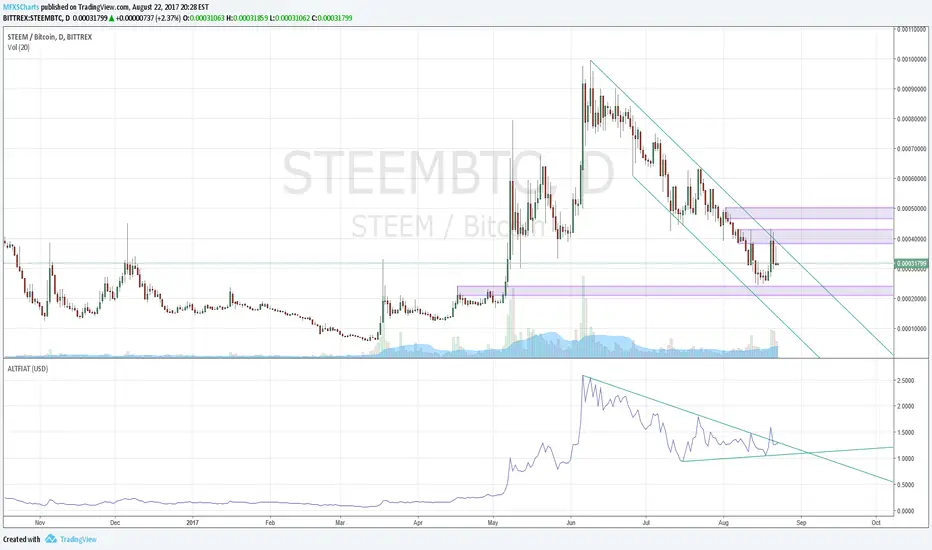
ALTFIATHandy indicator that shows you historical price of alt-coins in user-defined currency. Default is USD. Change input setting 'Currency' to relevant USD pair to get alt-price in desired currency ie to see historical price data in Australian dollars, you would enter 'AUDUSD'; to see price data in Euros or Yen, you would enter "EURUSD" or "USDJPY".
Currencies supported:
All xxxUSD pairs + CHF, CAD, JPY and CNH
Issues:
User has to input full currency pair ie AUDUSD - User should just be able to enter AUD. My string + string fix for this breaks default USD setting.
Support for USDxxx pairs currently hardcoded
Solutions to the above welcome and encouraged.
Cowabunga System from babypips.comPlease do read the information below as well, especially if you are new to Forex.
The Cowabunga System is a type of Mechanical Trading System that filters trades based on the trend of the 4 hour chart with EMAs and some other familiar indicators (RSI, Stochastics and MACD) while entering trades base on 15 minute chart.
I have coded (quite amateurishly) the basic system onto a 15 minute chart (the 4 hour settings are coded as well). The author says the system is to be traded off the 15 minute chart with the 4 hour chart only as a reference for trend direction.
4 Hour Chart Settings
5 EMA
10 EMA
Stochastics (10,3,3)
RSI (9)
Then we move onto the 15 minute chart, where he gives us the trade entry rules.
15 Minute Chart Settings
5 EMA
10 EMA
Stochastics (10,3,3)
RSI (9)
MACD (12,26,9)
Entry Rules - long entry rules used, obviously reverse these for shorting.
1. EMA must cross above the 10 EMA.
2. RSI must be greater than 50 and not overbought.
3. Stochastic must be headed up and not be in overbought territory.
4. MACD histogram must go from negative to positive OR be negative and start to increase in value.
What I did.
1. Set the RSI and Stochastic levels to avoid entries when they indicate overbought conditions for long and oversold conditions for short (80 and 20 levels).
2. Users can input specific times they want to backtest.
3. User's can configure profit targets, trailing stops and stops. Default is set it to was 100 pips profit target with a 40 pip trailing stop. (Note, when you are changing these values, please note that each pip is worth 10, so 100 pips is entered as 1000.)
The Cowabunga System from babypips.com is another popular and active system. The author, Pip Surfer, continues to post wins and losses with this system. It shows there is a lot of honesty and integrity with this system if the author keeps up to date even 10 years later and is not afraid of sharing the times the system causes losses.
As an example of this, here is post he shared just last week . It's almost like a journal, he gives specific times and reasons why he entered, lets the readers know when he was stopped out, etc. I think that what he does is equally important as his system.
To read more about this system, visit the thread on babypips.com, click here.

HL2 - 22 EMA Cross for RenkoEURUSD
This is a simple strategy to use for those who like Renko bars. I ONLY use it on Renko.
Basic idea is that when the Renko bar closes above or below the 22 EMA, you go long or short.
However, some of the frustrations I've had with any strategy shared in Tradingview is so few folks put in the ability to set a stop or a profit target or the ability to set a specific time to trade. I have added those to this strategy. (And I for the life of me can not remember where I got the code for the the time, I need to find you!).
Special note: If you have never used the Renko bars in Tradingview, make sure you click the Format option next to whatever pair you are looking at and change it from Traditional to ATR. You can set it for a static pip amount if you want. But ATR at first will help you decide which amount of pips you should throw in.
This is my first published strategy so if I screwed up on anything or didn't explain it very well, please let me know!!

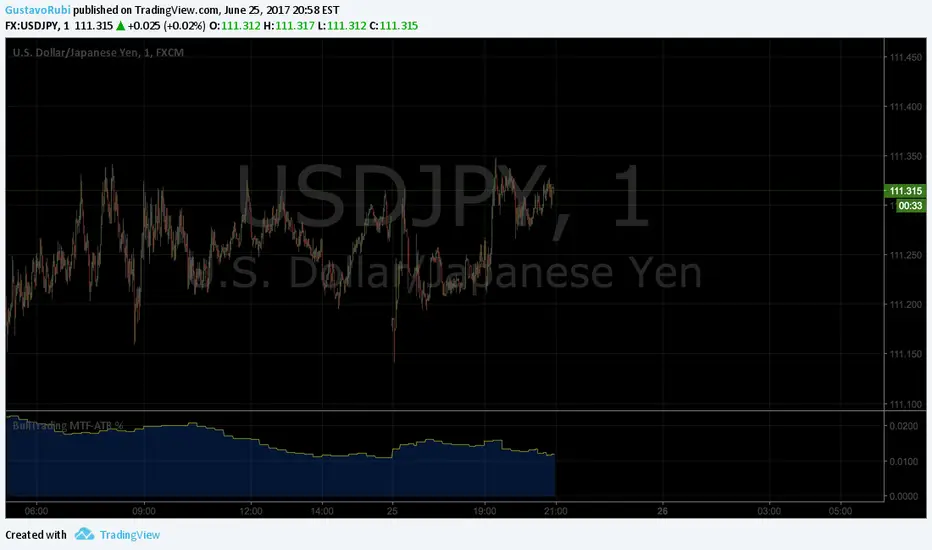
BullTrading MultiTimeFrame ATR %Good afternoon traders.
Have you ever got trapped on the middle of a consolidation? Well, it just happened to me trading the 1 minute chart last friday!
So, I coded this script to display a percentage of ATR for a given resolution.
Now, how can you benefit using this information?
For example:
Using the standard settings (resolution is calibrated 15 minutes in order to trade 1minute charts), just draw your prefered support and resistance. Then measure the number of pips between support and resistance. This number should be approximately the same the indicator is displaying. If the indicator is displaying a lower value, maybe it will be a good idea to tighten your support/resistance levels (if the price goes against you, you will have confidence and probability on your side to open an opposite position and reach your Take profit before a new reversal take place.
Change colors and resolution for your desired timeframe until you find your particular "sweet spot"
Have a nice trading week.
Forex strength meterCalculates the strength of a particular currency taking into account it's rate of change (% price change in a period) in all correlated and anti-correlated pairs. For instance, when looking for USD strength we will add ROC for USDCAD, USDCHF and USDJPY while subtract AUDUSD, EURUSD, GBPUSD and NZDUSD.
After ROC step, one can smooth the result using EMA, or MACD.
As the script needs to fetch values from multiple currencies it isn't the fastest one, but it gets its job done.
Important: Only major currencies (AUD, CAD, CHF, EUR, GBP, JPY, NZD and USD) are considered.

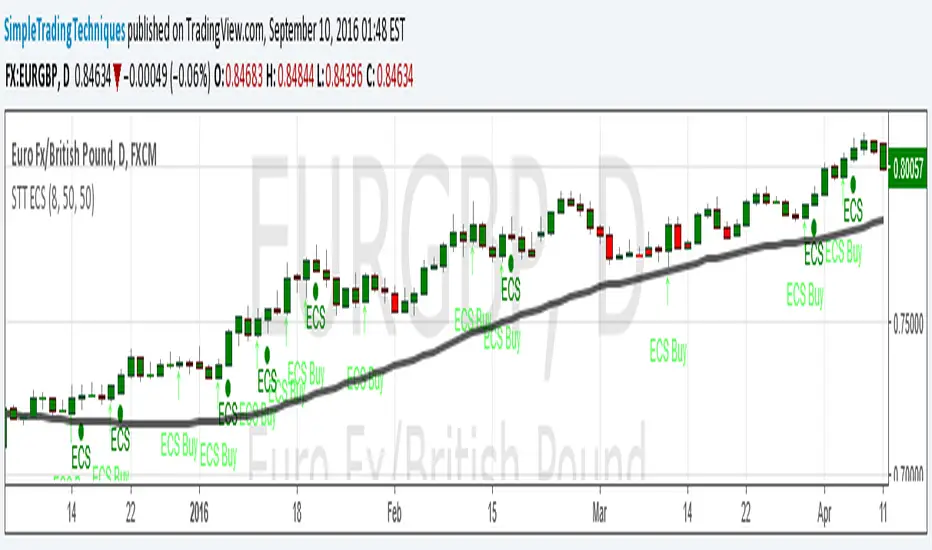
ENGULFING CANDLESTICK STRATEGY(i) Arrow represent trade setup
(ii) Circle represent triggering of the trade
--------------------------------------------------------------------
1. Where to place stop loss?
2. Where to exit the trade?
3. How to protect gains in your trade?
4. How to apply money management rule?
5. How to trade gap opening?
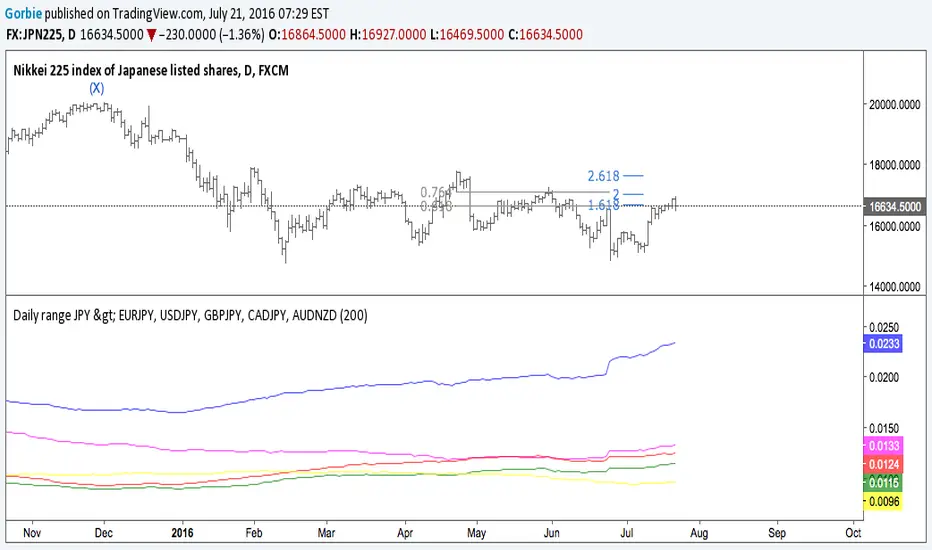
Pairs Volume FXCM mini accountScript shows the volume of the currency pairs in the FXCM mini account. I set it daily or weekly to see which pair is picking up in activity. My style of currency trading is short holds on the highest volatility. This helps me determine which pairs have the highest volume (or tick activity since there is no true exchange for currency). I use this in conjunction with the other script I wrote, "Pairs Range" which shows which pairs have the highest daily range. This script has a built in 5-sma on each pair. High daily range and high volume is volatility and liquidity. **** This does not include currencies in CHF ****


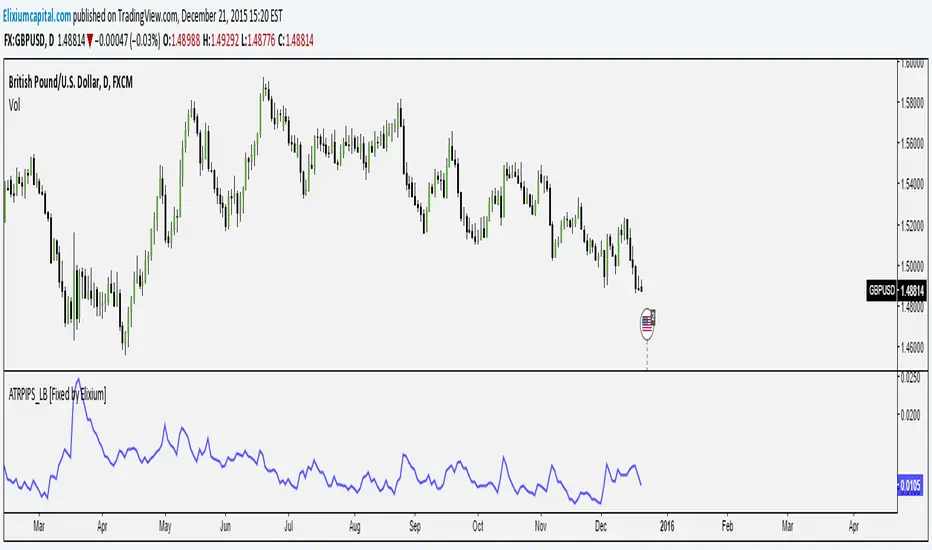
ATR Pips [LazyBear] [Fixed by Elixium]This is ATR in pips. This was requested by user @ElixiumCapital on Twitter. ATRPIPs in his words:
How to use: Change the chart to the Daily time frame. The indicators value e.g. 0.0105 means that the average daily range of the past 5 trading days is 105 pips. (On standard pairs like EURUSD, GBPUSD)
"ATR PIPs is useful for finding markets with your desired amount of volatility, for example I prefer to trade forex pairs with the highest amount of volatility in the past 5 days, setting the length parameter to 5 days. And setting my stop loss at 25% to 33% of the the indicators value."
Fixed: Default parameters and a critical bug.
VDUB_BINARY_PRO_3NEW UPDATED BINARY PRO 3_V2 HERE -
VDUB_BINARY_PRO_3_V1 UPGRADE from binary PRO 1 / testing/ / experimental / Trade the curves / Highs -Lows / Band cross over/ Testing using heikin ashi
//Linear Regression Curve
//Centre band
//CM_Gann Swing HighLow V2/Modified////// MA input NOT WORKING ! - I broke it :s
//Vdub_Tetris_V2/ Modified
*Update Tip /Optional
Set the centre band to '34 to run centre line
