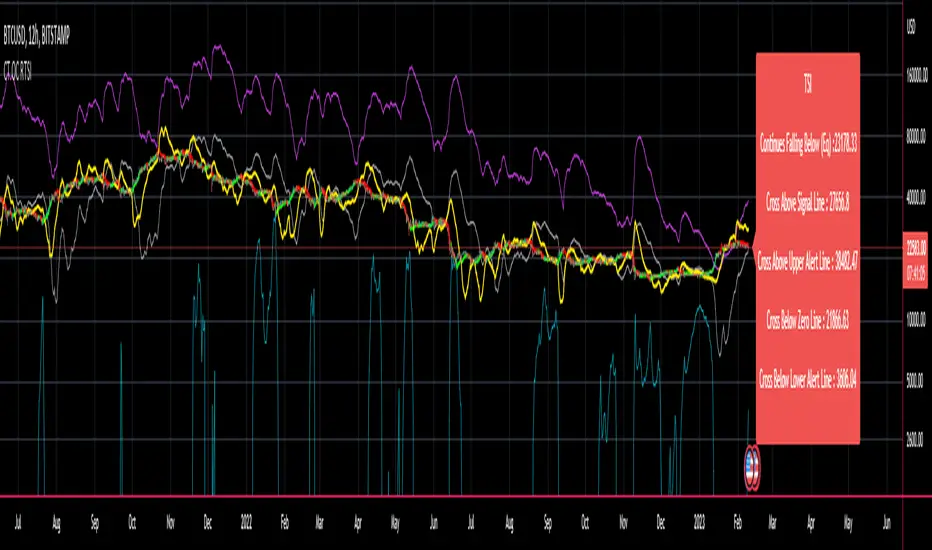
Time Segmented Volume, TSV Cipher + TSITHE IDEA:
TSV is a leading indicator based on the Volume, so it can be used to dectect price movements even before other indicators.
You can read about the Time Segmented Volume and the concept how to use it here:
From my observations, it seems like you can use this indicator in the similar way to "oscilators" as well.
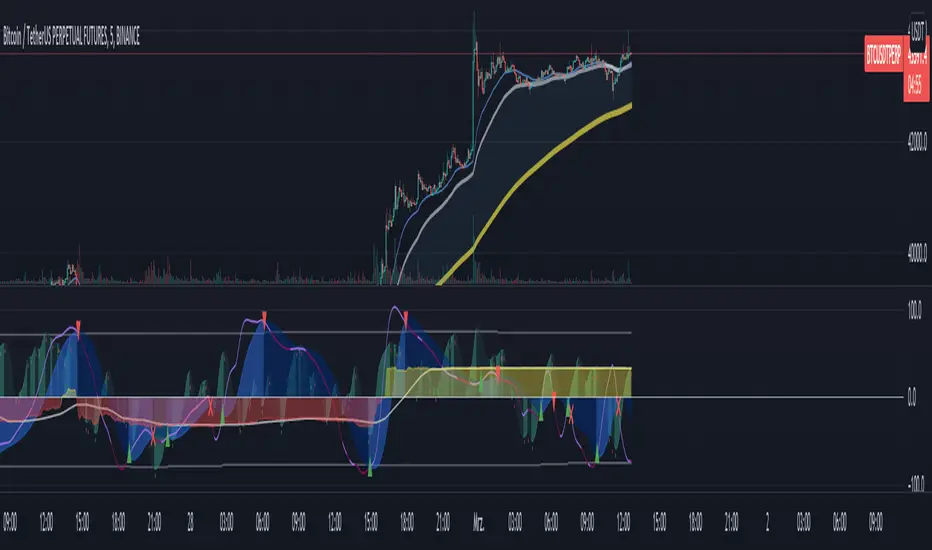
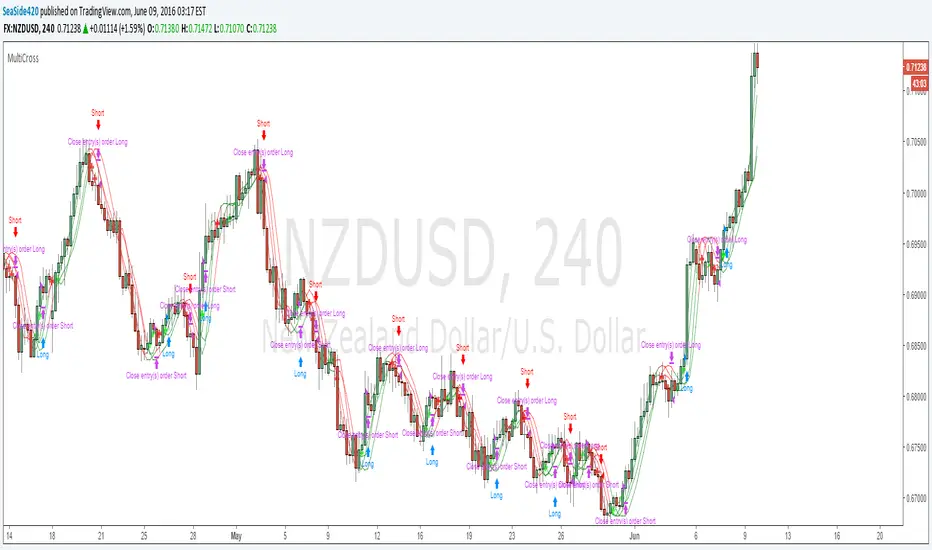
So the idea is to use the signal and run in trough:
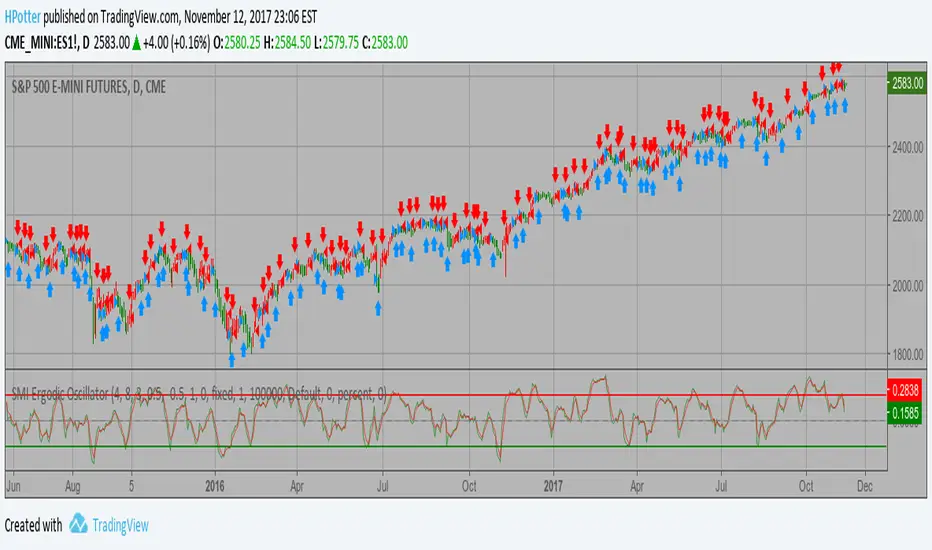
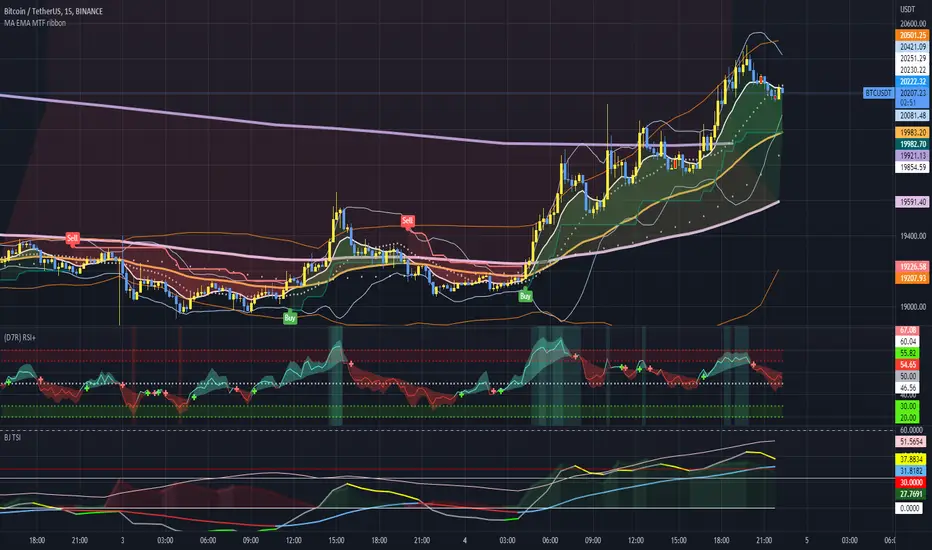
1) WaveTrend - to produce "green" and "red" dots.
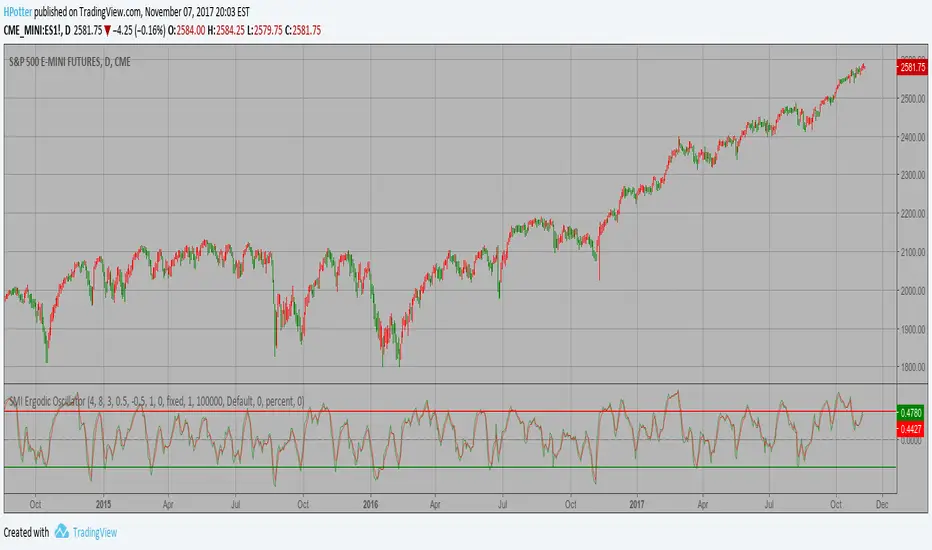
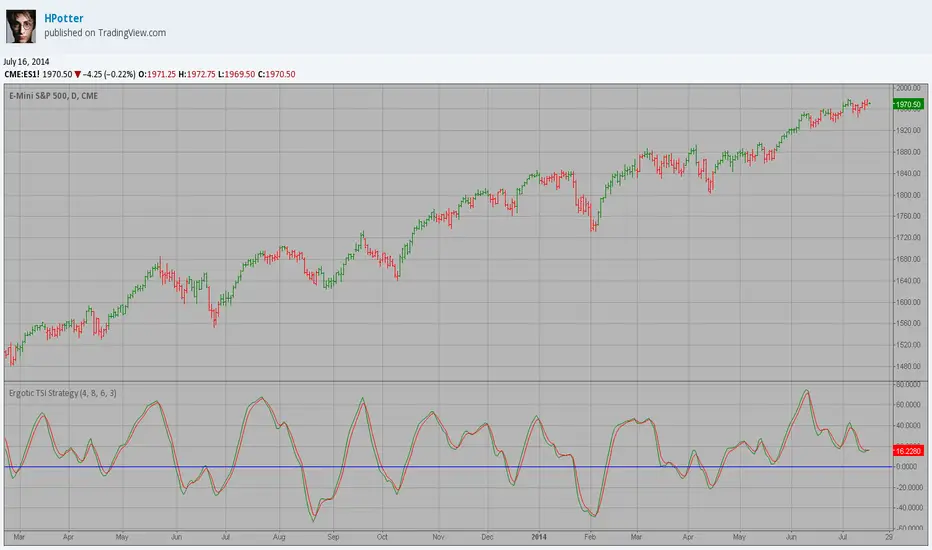
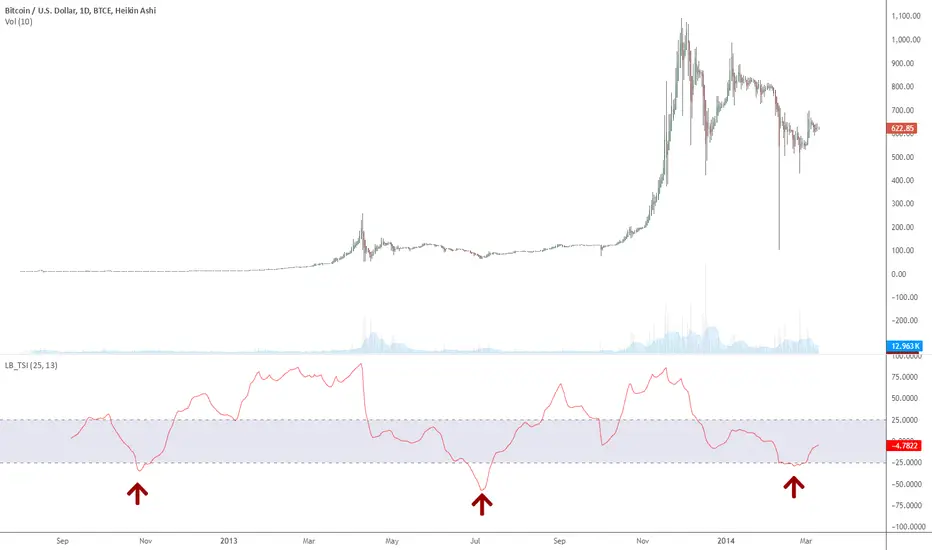
2) TSI
Both oscillators produce two signals that when crossed might be a buy/sell signal.
Hope you like the idea.
WARNING: Use the indicator for your own risk, it was released for educational purposes.
Wyszukaj w skryptach "tsi"
Library_All_In_OneLibrary "Library_All_In_One"
fnRSI()
fnTSI()
Discription:
Contains several functions of Pinescript all in one Library. This reduce your coding.
How to use:
import Wilson-IV/Library_All_In_One/1 as _lib
Examples of plotting the RSI and TSI:
plot(_lib.fnRSI(close, 14))
plot(_lib.fnTSI(close, 25, 14))
Markets:
It can be used to all markets.
NOTE:
It will expands with more function during time.
Bjorgum TSI Arrows
This script is intended to help the viewer identify potential turning points with momentum "headwinds" or "tailwinds" with a visual que at the bar level. The presence of arrows indicates that the TSI indicator is either "curling" up under the signal line, or "curling" down over the signal line. This can help to anticipate reversals, or moves in favor of trend direction.
Multiple script overlays can be used for "Multi-timeframe analysis" by altering the "resolution" feature.
eg: Viewer could enable 2 "Arrow" scripts while watching the daily timeframe, and setting one of them to indicate weekly conditions. This can help identify prevailing trend strength when using smaller timeframes.
Ichimoku with MACD/ CMF/ TSI This is a strategy made from ichimoku cloud , together with MACD, Chaiking Money FLOW and True Strenght Index.
It can be adapted to any timeframe and any type of financial markets.
The idea behind its very simple,
We combine the long / short strategy from ichimoku, like cross between lines and below/above cloud together with histogram from MACD for positive/negative level. We use the same criteria for TSI and CMF, to check if its above or below 0 level.
Based on that we have a long or a short entry. The exit happens when the next options triggers, like for example we had long signal, we exit when we receive the short signal and viceversa.
It can be adapted with a risk management to apply a tp/sl level.
For any suggestion or details , let me know.
Vortex with TSI strategyStrategy Terms
Indicator: Vortex
Indicator: True Strength Indicator
As you will see, the indicators have red and blue lines. To buy an option for a price increase, you need to wait for the simultaneous intersection of the lines of both indicators when the blue lines are at the top and the red ones go down. And vice versa, to buy an option with a forecast of a fall in prices, the blue lines should go down and the red lines up.
Ergodic OscillatorErgodic Oscillator indicator script.
Ergodic Oscillator is based on True Strength Index (TSI) by William Blau.
Bitcoin Momentum TSIChart based on True Strength Indicator
It was improved to show same information as Squeeze Momentum Indicator by LazyBear,
but it seems to have better and quicker response to changes and was tested on Bitcoin mainly.
Enjoy it!
BITFINEX:BTCUSD
SMI Ergodic Oscillator Backtest ver.2 The SMI Ergodic Indicator is the same as the True Strength Index (TSI) developed by
William Blau, except the SMI includes a signal line. The SMI uses double moving averages
of price minus previous price over 2 time frames. The signal line, which is an EMA of the
SMI, is plotted to help trigger trading signals. Adjustable guides are also given to fine
tune these signals. The user may change the input (close), method (EMA), period lengths
and guide values.
You can use in the xPrice any series: Open, High, Low, Close, HL2, HLC3, OHLC4 and ect...
WARNING:
- For purpose educate only
SMI Ergodic Oscillator Strategy ver.2 The SMI Ergodic Indicator is the same as the True Strength Index (TSI) developed by
William Blau, except the SMI includes a signal line. The SMI uses double moving averages
of price minus previous price over 2 time frames. The signal line, which is an EMA of the
SMI, is plotted to help trigger trading signals. Adjustable guides are also given to fine
tune these signals. The user may change the input (close), method (EMA), period lengths
and guide values.
You can use in the xPrice any series: Open, High, Low, Close, HL2, HLC3, OHLC4 and ect...
WARNING:
- For purpose educate only
SMI Ergodic Oscillator Backtest The SMI Ergodic Indicator is the same as the True Strength Index (TSI) developed by
William Blau, except the SMI includes a signal line. The SMI uses double moving averages
of price minus previous price over 2 time frames. The signal line, which is an EMA of the
SMI, is plotted to help trigger trading signals. Adjustable guides are also given to fine
tune these signals. The user may change the input (close), method (EMA), period lengths
and guide values.
You can use in the xPrice any series: Open, High, Low, Close, HL2, HLC3, OHLC4 and ect...
You can change long to short in the Input Settings
WARNING:
- For purpose educate only
- This script to change bars colors.
SMI Ergodic Oscillator Strategy The SMI Ergodic Indicator is the same as the True Strength Index (TSI) developed by
William Blau, except the SMI includes a signal line. The SMI uses double moving averages
of price minus previous price over 2 time frames. The signal line, which is an EMA of the
SMI, is plotted to help trigger trading signals. Adjustable guides are also given to fine
tune these signals. The user may change the input (close), method (EMA), period lengths
and guide values.
You can use in the xPrice any series: Open, High, Low, Close, HL2, HLC3, OHLC4 and ect...
WARNING:
- This script to change bars colors.
MultiCross v4.20Quad-HullMA-cross & VWMA & MacD & TSI combination
Version 4.20
added script for strategy settings to be already correct when strategy loads onto chart:
calc_on_order_fills= true, calc_on_every_tick=true, default_qty_type=strategy.percent_of_equity, default_qty_value=100, pyramiding=0
MultiCrossQuad-HullMA-cross & VWMA & MacD & TSI combination
Made for 4H - other timeframes unkown result.
Ergotic TSI Strategy r - Length of first EMA smoothing of 1 day momentum
s - Length of second EMA smoothing of 1 day smoothing
u- Length of third EMA smoothing of 1 day momentum
Length of EMA signal line
This is one of the techniques described by William Blau in his book "Momentum,
Direction and Divergence" (1995). If you like to learn more, we advise you to
read this book. His book focuses on three key aspects of trading: momentum,
direction and divergence. Blau, who was an electrical engineer before becoming
a trader, thoroughly examines the relationship between price and momentum in
step-by-step examples. From this grounding, he then looks at the deficiencies
in other oscillators and introduces some innovative techniques, including a
fresh twist on Stochastics. On directional issues, he analyzes the intricacies
of ADX and offers a unique approach to help define trending and non-trending periods.
You can use in the xPrice any series: Open, High, Low, Close, HL2, HLC3, OHLC4 and ect...
Ergotic TSI r - Length of first EMA smoothing of 1 day momentum
s - Length of second EMA smoothing of 1 day smoothing
u- Length of third EMA smoothing of 1 day momentum
Length of EMA signal line
This is one of the techniques described by William Blau in his book "Momentum,
Direction and Divergence" (1995). If you like to learn more, we advise you to
read this book. His book focuses on three key aspects of trading: momentum,
direction and divergence. Blau, who was an electrical engineer before becoming
a trader, thoroughly examines the relationship between price and momentum in
step-by-step examples. From this grounding, he then looks at the deficiencies
in other oscillators and introduces some innovative techniques, including a
fresh twist on Stochastics. On directional issues, he analyzes the intricacies
of ADX and offers a unique approach to help define trending and non-trending periods.
You can use in the xPrice any series: Open, High, Low, Close, HL2, HLC3, OHLC4 and ect...
TSI - ADX HISTOGRAM MTFThis is my hybrid indicator to recognize overbought-oversold ranges, the strong of the movement and the direction.
Thanks to Bjorgum and Rave 444 for develop this two indicators.
TSI (Trend Strong Index) I use LazyBear's WT_cross indicator to confirm signal. I thing your should use this indicator with Divergence or Fibonacci to open order.
TSI CCI HullUsed for a trend following strategy. Not going to explain the indicator its basically self explanatory. Only trade LOW VOLATILITY (USE ATR (average true range) TO GAUGE)! It only wokrs well in low volatility!
TSI Spread - false move indicatorYellow on top during an upward slope = false move
Confirmation @ Vertex to push slope from up to down, with yellow on top
Credit to the worst fund manager east of the Mississippi ;)
Indicator: True Strength IndexTSI is a "double smoothed" indicator. It is used just like RSI. Overbought and oversold levels differ. They are marked by the indicator.
BTCe shows only 3 oversold conditions so far, the last one being just days ago.


