Smart Margin Zone
SMART MARGIN ZONE - CME-BASED SUPPORT & RESISTANCE INDICATOR
TITLE FOR PUBLICATION:
Smart Margin Zone - CME Margin-Based Support and Resistance
CATEGORY:
Support and Resistance
SHORT DESCRIPTION (for preview):
Automatically plots margin zones based on CME Group requirements. These zones represent critical price levels where leveraged traders face margin calls, creating natural support and resistance through forced liquidations.
═══════════════════════════════════════════════════════════════
FULL DESCRIPTION FOR TRADINGVIEW:
═══════════════════════════════════════════════════════════════
📊 Smart Margin Zone - Professional Trading Zones Based on CME Data
This indicator automatically calculates and displays margin zones derived from official CME Group margin requirements. These zones represent critical price levels where traders using leverage receive margin calls, triggering forced position closures that create natural support and resistance levels.
═══════════════════════════════════════════════════════════════
🎯 CORE CONCEPT
═══════════════════════════════════════════════════════════════
When price reaches calculated margin zones, traders using 2:1 or 4:1 leverage on CME futures receive margin calls. Brokers automatically liquidate these positions, creating waves of buying or selling pressure that form strong support and resistance levels.
This is not theoretical - it's based on actual margin requirements from CME Group, the world's largest derivatives marketplace.
═══════════════════════════════════════════════════════════════
📐 CALCULATION METHODOLOGY
═══════════════════════════════════════════════════════════════
The indicator uses the following formula to calculate zone sizes:
Zone Size = (Margin Requirement / Tick Value) × Tick Size × 1.10
Where:
• Margin Requirement = Official CME initial margin (updated November 2024)
• Tick Value = Dollar value of minimum price movement
• Tick Size = Minimum price increment
• 1.10 = 10% buffer for realistic zone width
SUPPORTED INSTRUMENTS WITH CME DATA:
Currency Pairs:
• EURUSD: $2,100 margin → 0.0168 zone size
• GBPUSD: $1,800 margin → 0.0144 zone size
• AUDUSD: $1,300 margin → 0.0065 zone size
• NZDUSD: $1,100 margin → 0.0055 zone size
• USDJPY: $3,200 margin → custom calculation
• USDCAD: $950 margin → calculated
• USDCHF: $1,650 margin → calculated
Commodities:
• Gold (XAUUSD): $8,000 margin → 80 points zone size
• Silver (XAGUSD): $6,500 margin → calculated
• WTI Crude Oil: $4,500 margin → calculated
═══════════════════════════════════════════════════════════════
🔍 HOW IT WORKS
═══════════════════════════════════════════════════════════════
1. SWING POINT DETECTION
The indicator automatically identifies swing highs and swing lows using a configurable lookback period (default 10 bars). These become anchor points for zone calculations.
2. FIVE ZONE LEVELS
From each swing point, five zone levels are calculated:
• Zone 1/4 (25%) - First correction level
• Zone 1/2 (50%) - KEY ZONE for trend determination
• Zone 3/4 (75%) - Intermediate level
• Zone 1/1 (100%) - Full margin zone (strongest level)
• Zone 5/4 (125%) - Extended zone
3. TREND IDENTIFICATION
• Close above Zone 1/2 resistance = Bullish trend
• Close below Zone 1/2 support = Bearish trend
• Between zones = Range/consolidation
4. HISTORICAL CONTEXT
Current zones are displayed prominently with fills and labels. Historical zones appear as thin, semi-transparent lines for context without cluttering the chart.
═══════════════════════════════════════════════════════════════
⚙️ FEATURES
═══════════════════════════════════════════════════════════════
AUTOMATED CALCULATION:
✅ Auto-detection of swing highs and lows
✅ Real-time zone updates as new swings form
✅ CME margin data built-in for major instruments
✅ Manual override option for custom calculations
VISUAL CLARITY:
✅ Color-coded zones (red=resistance, green=support)
✅ Adjustable transparency for fills and lines
✅ Current zones bold with fills and price labels
✅ Historical zones thin and transparent
✅ Swing point markers show calculation origins
CUSTOMIZATION:
✅ Show/hide individual zone levels (1/4, 1/2, 3/4, 1/1, 5/4)
✅ Toggle historical zones on/off
✅ Adjustable lookback period (5-50 bars)
✅ Customizable colors for all elements
✅ Line width and transparency controls
✅ Zone extension options (none/right/both)
TREND ANALYSIS:
✅ Optional trend background coloring
✅ Customizable trend colors and transparency
✅ Real-time trend identification display
STATISTICS:
✅ Live statistics table showing:
- Current instrument
- Active zone size
- Calculation mode
- Current trend direction
- Number of zones displayed
ALERTS:
✅ Zone 1/2 breakout (up/down)
✅ Full margin zone 1/1 reached
✅ Customizable alert messages
═══════════════════════════════════════════════════════════════
📈 TRADING APPLICATIONS
═══════════════════════════════════════════════════════════════
ENTRY SIGNALS:
• Bounces from zone levels = potential entry points
• Zone 1/2 breakouts = trend continuation entries
• Zone rejections = reversal opportunities
RISK MANAGEMENT:
• Zone levels = logical stop-loss placement
• Zone 1/1 = maximum risk level
• Zone spacing = position sizing guide
PROFIT TARGETS:
• Next zone level = first target
• Zone 1/1 = full profit target
• Zone breakouts = extended targets
TREND CONFIRMATION:
• Price above Zone 1/2 resistance = confirmed uptrend
• Price below Zone 1/2 support = confirmed downtrend
• Consolidation between zones = wait for breakout
═══════════════════════════════════════════════════════════════
📚 USAGE INSTRUCTIONS
═══════════════════════════════════════════════════════════════
GETTING STARTED:
1. Add indicator to chart of any supported instrument
2. Zones automatically calculate and display
3. Adjust swing detection period if needed (default 10 works well)
4. Customize colors and visibility to your preference
OPTIMAL SETTINGS:
• Best timeframes: H1, H4, Daily, Weekly
• Default swing length (10) suitable for most markets
• Show 2-3 historical zones for context
• Enable swing point markers to see calculation origins
INTERPRETATION:
• Watch for price reactions at zone boundaries
• Strong bounces = respect for margin level
• Clean breaks = momentum continuation
• Multiple touches = zone strength confirmation
SET ALERTS:
• Zone 1/2 breakouts for trend entries
• Zone 1/1 reaches for profit-taking
• Custom alerts for your specific strategy
═══════════════════════════════════════════════════════════════
⚠️ IMPORTANT NOTES
═══════════════════════════════════════════════════════════════
DATA ACCURACY:
• CME margin requirements updated November 2024
• Margins change periodically - check CME Group website
• Manual mode available for latest margin data
• Indicator provides analysis tool, not financial advice
STATISTICAL PERFORMANCE:
• Historical data shows >60% probability of continued movement after Zone 1/2 breakout
• Zone effectiveness varies by market conditions
• Best results in trending markets with clear swings
LIMITATIONS:
• Margin requirements change - monitor CME updates
• Works best on liquid instruments with clear swings
• Not a standalone trading system
• Should be combined with additional analysis
═══════════════════════════════════════════════════════════════
🔧 METHODOLOGY CREDIT
═══════════════════════════════════════════════════════════════
This indicator is based on the margin zones concept developed by Alexander Bazylev (BTrade indicator for MetaTrader platforms).
The TradingView implementation has been completely rewritten with original enhancements:
• Multiple zone levels instead of single level
• Automatic swing point detection algorithm
• Direct CME data integration
• Historical zone visualization
• Advanced customization options
• Comprehensive statistics and alerts
All code is original and specifically designed for TradingView's Pine Script v5 environment.
═══════════════════════════════════════════════════════════════
💡 BEST PRACTICES
═══════════════════════════════════════════════════════════════
COMBINE WITH:
• Volume analysis for confirmation
• Trend indicators for direction bias
• Price action patterns at zones
• Higher timeframe analysis
AVOID:
• Trading against strong trends at minor zones
• Over-leveraging based solely on zone placement
• Ignoring broader market context
• Expecting perfect bounces every time
OPTIMIZE:
• Adjust swing length for different timeframes
• Shorter period (5-7) for intraday trading
• Longer period (15-20) for swing trading
• Test historical effectiveness on your instruments
═══════════════════════════════════════════════════════════════
📖 EDUCATIONAL VALUE
═══════════════════════════════════════════════════════════════
This indicator helps traders understand:
• How institutional margin requirements affect price
• Where forced liquidations create pressure
• Natural support and resistance formation
• Relationship between leverage and price levels
• Market structure and key technical levels
═══════════════════════════════════════════════════════════════
🔄 VERSION HISTORY
═══════════════════════════════════════════════════════════════
Version 1.0 (Initial Release):
• CME-based zone calculation for 10 instruments
• Automatic swing high/low detection
• 5 zone levels with customizable display
• Historical zones with transparency control
• Swing point markers
• Trend background indicator
• Live statistics table
• Multiple alert conditions
• Fully customizable colors and styles
• English language interface
═══════════════════════════════════════════════════════════════
📞 SUPPORT & FEEDBACK
═══════════════════════════════════════════════════════════════
Questions or suggestions? Leave a comment below!
If you find this indicator useful:
⭐ Please leave a like
💬 Share your experience in comments
🔔 Follow for updates and new indicators
═══════════════════════════════════════════════════════════════
⚖️ DISCLAIMER
═══════════════════════════════════════════════════════════════
This indicator is provided for educational and analytical purposes only. It is not financial advice and should not be the sole basis for trading decisions.
• Past performance does not guarantee future results
• Trading involves substantial risk of loss
• CME margin requirements subject to change
• Always do your own research and risk management
• Consult a financial advisor for investment advice
The creator is not responsible for any trading losses incurred through use of this indicator.
Wyszukaj w skryptach "tradingview+金龙指数"

Range Oscillator Strategy + Stoch Confirm🔹 Short summary
This is a free, educational long-only strategy built on top of the public “Range Oscillator” by Zeiierman (used under CC BY-NC-SA 4.0), combined with a Stochastic timing filter, an EMA-based exit filter and an optional risk-management layer (SL/TP and R-multiple exits). It is NOT financial advice and it is NOT a magic money machine. It’s a structured framework to study how range-expansion + momentum + trend slope can be combined into one rule-based system, often with intentionally RARE trades.
────────────────────────
0. Legal / risk disclaimer
────────────────────────
• This script is FREE and public. I do not charge any fee for it.
• It is for EDUCATIONAL PURPOSES ONLY.
• It is NOT financial advice and does NOT guarantee profits.
• Backtest results can be very different from live results.
• Markets change over time; past performance is NOT indicative of future performance.
• You are fully responsible for your own trades and risk.
Please DO NOT use this script with money you cannot afford to lose. Always start in a demo / paper trading environment and make sure you understand what the logic does before you risk any capital.
────────────────────────
1. About default settings and risk (very important)
────────────────────────
The script is configured with the following defaults in the `strategy()` declaration:
• `initial_capital = 10000`
→ This is only an EXAMPLE account size.
• `default_qty_type = strategy.percent_of_equity`
• `default_qty_value = 100`
→ This means 100% of equity per trade in the default properties.
→ This is AGGRESSIVE and should be treated as a STRESS TEST of the logic, not as a realistic way to trade.
TradingView’s House Rules recommend risking only a small part of equity per trade (often 1–2%, max 5–10% in most cases). To align with these recommendations and to get more realistic backtest results, I STRONGLY RECOMMEND you to:
1. Open **Strategy Settings → Properties**.
2. Set:
• Order size: **Percent of equity**
• Order size (percent): e.g. **1–2%** per trade
3. Make sure **commission** and **slippage** match your own broker conditions.
• By default this script uses `commission_value = 0.1` (0.1%) and `slippage = 3`, which are reasonable example values for many crypto markets.
If you choose to run the strategy with 100% of equity per trade, please treat it ONLY as a stress-test of the logic. It is NOT a sustainable risk model for live trading.
────────────────────────
2. What this strategy tries to do (conceptual overview)
────────────────────────
This is a LONG-ONLY strategy designed to explore the combination of:
1. **Range Oscillator (Zeiierman-based)**
- Measures how far price has moved away from an adaptive mean.
- Uses an ATR-based range to normalize deviation.
- High positive oscillator values indicate strong price expansion away from the mean in a bullish direction.
2. **Stochastic as a timing filter**
- A classic Stochastic (%K and %D) is used.
- The logic requires %K to be below a user-defined level and then crossing above %D.
- This is intended to catch moments when momentum turns up again, rather than chasing every extreme.
3. **EMA Exit Filter (trend slope)**
- An EMA with configurable length (default 70) is calculated.
- The slope of the EMA is monitored: when the slope turns negative while in a long position, and the filter is enabled, it triggers an exit condition.
- This acts as a trend-protection exit: if the medium-term trend starts to weaken, the strategy exits even if the oscillator has not yet fully reverted.
4. **Optional risk-management layer**
- Percentage-based Stop Loss and Take Profit (SL/TP).
- Risk/Reward (R-multiple) exit based on the distance from entry to SL.
- Implemented as OCO orders that work *on top* of the logical exits.
The goal is not to create a “holy grail” system but to serve as a transparent, configurable framework for studying how these concepts behave together on different markets and timeframes.
────────────────────────
3. Components and how they work together
────────────────────────
(1) Range Oscillator (based on “Range Oscillator (Zeiierman)”)
• The script computes a weighted mean price and then measures how far price deviates from that mean.
• Deviation is normalized by an ATR-based range and expressed as an oscillator.
• When the oscillator is above the **entry threshold** (default 100), it signals a strong move away from the mean in the bullish direction.
• When it later drops below the **exit threshold** (default 30), it can trigger an exit (if enabled).
(2) Stochastic confirmation
• Classic Stochastic (%K and %D) is calculated.
• An entry requires:
- %K to be below a user-defined “Cross Level”, and
- then %K to cross above %D.
• This is a momentum confirmation: the strategy tries to enter when momentum turns up from a pullback rather than at any random point.
(3) EMA Exit Filter
• The EMA length is configurable via `emaLength` (default 70).
• The script monitors the EMA slope: it computes the relative change between the current EMA and the previous EMA.
• If the slope turns negative while the strategy holds a long position and the filter is enabled, it triggers an exit condition.
• This is meant to help protect profits or cut losses when the medium-term trend starts to roll over, even if the oscillator conditions are not (yet) signalling exit.
(4) Risk management (optional)
• Stop Loss (SL) and Take Profit (TP):
- Defined as percentages relative to average entry price.
- Both are disabled by default, but you can enable them in the Inputs.
• Risk/Reward Exit:
- Uses the distance from entry to SL to project a profit target at a configurable R-multiple.
- Also optional and disabled by default.
These exits are implemented as `strategy.exit()` OCO orders and can close trades independently of oscillator/EMA conditions if hit first.
────────────────────────
4. Entry & Exit logic (high level)
────────────────────────
A) Time filter
• You can choose a **Start Year** in the Inputs.
• Only candles between the selected start date and 31 Dec 2069 are used for backtesting (`timeCondition`).
• This prevents accidental use of tiny cherry-picked windows and makes tests more honest.
B) Entry condition (long-only)
A long entry is allowed when ALL the following are true:
1. `timeCondition` is true (inside the backtest window).
2. If `useOscEntry` is true:
- Range Oscillator value must be above `entryLevel`.
3. If `useStochEntry` is true:
- Stochastic condition (`stochCondition`) must be true:
- %K < `crossLevel`, then %K crosses above %D.
If these filters agree, the strategy calls `strategy.entry("Long", strategy.long)`.
C) Exit condition (logical exits)
A position can be closed when:
1. `timeCondition` is true AND a long position is open, AND
2. At least one of the following is true:
- If `useOscExit` is true: Oscillator is below `exitLevel`.
- If `useMagicExit` (EMA Exit Filter) is true: EMA slope is negative (`isDown = true`).
In that case, `strategy.close("Long")` is called.
D) Risk-management exits
While a position is open:
• If SL or TP is enabled:
- `strategy.exit("Long Risk", ...)` places an OCO stop/limit order based on the SL/TP percentages.
• If Risk/Reward exit is enabled:
- `strategy.exit("RR Exit", ...)` places an OCO order using a projected R-multiple (`rrMult`) of the SL distance.
These risk-based exits can trigger before the logical oscillator/EMA exits if price hits those levels.
────────────────────────
5. Recommended backtest configuration (to avoid misleading results)
────────────────────────
To align with TradingView House Rules and avoid misleading backtests:
1. **Initial capital**
- 10 000 (or any value you personally want to work with).
2. **Order size**
- Type: **Percent of equity**
- Size: **1–2%** per trade is a reasonable starting point.
- Avoid risking more than 5–10% per trade if you want results that could be sustainable in practice.
3. **Commission & slippage**
- Commission: around 0.1% if that matches your broker.
- Slippage: a few ticks (e.g. 3) to account for real fills.
4. **Timeframe & markets**
- Volatile symbols (e.g. crypto like BTCUSDT, or major indices).
- Timeframes: 1H / 4H / **1D (Daily)** are typical starting points.
- I strongly recommend trying the strategy on **different timeframes**, for example 1D, to see how the behaviour changes between intraday and higher timeframes.
5. **No “caution warning”**
- Make sure your chosen symbol + timeframe + settings do not trigger TradingView’s caution messages.
- If you see warnings (e.g. “too few trades”), adjust timeframe/symbol or the backtest period.
────────────────────────
5a. About low trade count and rare signals
────────────────────────
This strategy is intentionally designed to trade RARELY:
• It is **long-only**.
• It uses strict filters (Range Oscillator threshold + Stochastic confirmation + optional EMA Exit Filter).
• On higher timeframes (especially **1D / Daily**) this can result in a **low total number of trades**, sometimes WELL BELOW 100 trades over the whole backtest.
TradingView’s House Rules mention 100+ trades as a guideline for more robust statistics. In this specific case:
• The **low trade count is a conscious design choice**, not an attempt to cherry-pick a tiny, ultra-profitable window.
• The goal is to study a **small number of high-conviction long entries** on higher timeframes, not to generate frequent intraday signals.
• Because of the low trade count, results should NOT be interpreted as statistically strong or “proven” – they are only one sample of how this logic would have behaved on past data.
Please keep this in mind when you look at the equity curve and performance metrics. A beautiful curve with only a handful of trades is still just a small sample.
────────────────────────
6. How to use this strategy (step-by-step)
────────────────────────
1. Add the script to your chart.
2. Open the **Inputs** tab:
- Set the backtest start year.
- Decide whether to use Oscillator-based entry/exit, Stochastic confirmation, and EMA Exit Filter.
- Optionally enable SL, TP, and Risk/Reward exits.
3. Open the **Properties** tab:
- Set a realistic account size if you want.
- Set order size to a realistic % of equity (e.g. 1–2%).
- Confirm that commission and slippage are realistic for your broker.
4. Run the backtest:
- Look at Net Profit, Max Drawdown, number of trades, and equity curve.
- Remember that a low trade count means the statistics are not very strong.
5. Experiment:
- Tweak thresholds (`entryLevel`, `exitLevel`), Stochastic settings, EMA length, and risk params.
- See how the metrics and trade frequency change.
6. Forward-test:
- Before using any idea in live trading, forward-test on a demo account and observe behaviour in real time.
────────────────────────
7. Originality and usefulness (why this is more than a mashup)
────────────────────────
This script is not intended to be a random visual mashup of indicators. It is designed as a coherent, testable strategy with clear roles for each component:
• Range Oscillator:
- Handles mean vs. range-expansion states via an adaptive, ATR-normalized metric.
• Stochastic:
- Acts as a timing filter to avoid entering purely on extremes and instead waits for momentum to turn.
• EMA Exit Filter:
- Trend-slope-based safety net to exit when the medium-term direction changes against the position.
• Risk module:
- Provides practical, rule-based exits: SL, TP, and R-multiple exit, which are useful for structuring risk even if you modify the core logic.
It aims to give traders a ready-made **framework to study and modify**, not a black box or “signals” product.
────────────────────────
8. Limitations and good practices
────────────────────────
• No single strategy works on all markets or in all regimes.
• This script is long-only; it does not short the market.
• Performance can degrade when market structure changes.
• Overfitting (curve fitting) is a real risk if you endlessly tweak parameters to maximise historical profit.
Good practices:
- Test on multiple symbols and timeframes.
- Focus on stability and drawdown, not only on how high the profit line goes.
- View this as a learning tool and a basis for your own research.
────────────────────────
9. Licensing and credits
────────────────────────
• Core oscillator idea & base code:
- “Range Oscillator (Zeiierman)”
- © Zeiierman, licensed under CC BY-NC-SA 4.0.
• Strategy logic, Stochastic confirmation, EMA Exit Filter, and risk-management layer:
- Modifications by jokiniemi.
Please respect both the original license and TradingView House Rules if you fork or republish any part of this script.
────────────────────────
10. No payments / no vendor pitch
────────────────────────
• This script is completely FREE to use on TradingView.
• There is no paid subscription, no external payment link, and no private signals group attached to it.
• If you have questions, please use TradingView’s comment system or private messages instead of expecting financial advice.
Use this script as a tool to learn, experiment, and build your own understanding of markets.
────────────────────────
11. Example backtest settings used in screenshots
────────────────────────
To avoid any confusion about how the results shown in screenshots were produced, here is one concrete example configuration:
• Symbol: BTCUSDT (or similar major BTC pair)
• Timeframe: 1D (Daily)
• Backtest period: from 2018 to the most recent data
• Initial capital: 10 000
• Order size type: Percent of equity
• Order size: 2% per trade
• Commission: 0.1%
• Slippage: 3 ticks
• Risk settings: Stop Loss and Take Profit disabled by default, Risk/Reward exit disabled by default
• Filters: Range Oscillator entry/exit enabled, Stochastic confirmation enabled, EMA Exit Filter enabled
If you change any of these settings (symbol, timeframe, risk per trade, commission, slippage, filters, etc.), your results will look different. Please always adapt the configuration to your own risk tolerance, market, and trading style.

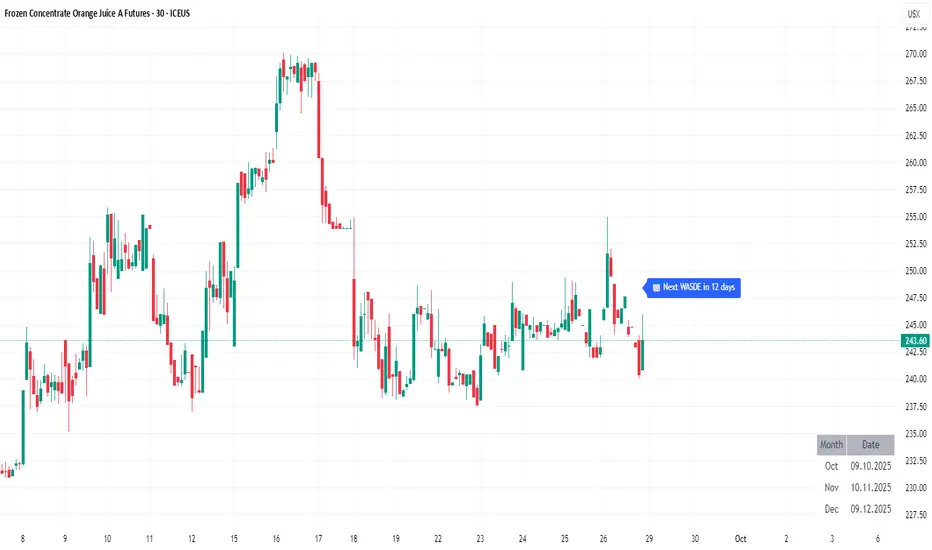
WASDE DatesOverview
WASDE Dates — a small, focused event indicator that displays confirmed USDA WASDE release dates for 2025 on the chart and marks each release day. The indicator is designed to be a lightweight timing tool for traders who want clean visual reminders and optional alerts around USDA WASDE publications.
Features
• Shows official WASDE release dates for 2025 in a compact chart table.
• Draws on-chart markers and a dotted vertical line on WASDE release days.
• Two alert conditions you can enable in TradingView: "WASDE Day Alert" and "WASDE 24h Reminder".
• Simple table position control (Top/Bottom, Left/Right) in the indicator settings.
• Minimal, self-contained code — no external data feeds or permissions required.
How to use
1. Apply the indicator to any chart and timeframe.
2. Use the indicator settings to choose table position.
3. Enable Alerts (if desired) via TradingView Alerts → choose “WASDE Day Alert” or “WASDE 24h Reminder”.
4. This version contains 2025 confirmed dates only — verify dates for live trading and enable alerts as needed.
Design & rationale
This indicator is intentionally not a technical trading signal. It is an event scheduler focused on clarity and low overhead: combine it with your existing setup to avoid being surprised by WASDE publications and to quickly inspect price action around these event dates.
Limitations & disclaimer
• This script shows **confirmed 2025** WASDE dates only. It does not provide trading advice or entry/exit signals. Use at your own risk.
• Double-check official USDA publishing times before executing trades.
• No external links or contact information are included in this description to comply with TradingView publishing rules.
Feature outlook (V2)
Planned V2 (future release): enhanced countdown (days → hours/minutes), optional inclusion of estimated 2026 dates marked as (TBC), and an invite-only/protected advanced version with reaction overlays (T+1/T+3) and extended alert options. V2 will be announced on this script page when ready.
Changelog
v1 — public release: 2025 confirmed dates, release markers, alerts, table position control.
Hilly 3.0 Advanced Crypto Scalping Strategy - 1 & 5 Min ChartsHow to Use
Copy the Code: Copy the script above.
Paste in TradingView: Open TradingView, go to the Pine Editor (bottom of the chart), paste the code, and click “Add to Chart.”
Check for Errors: Verify no errors appear in the Pine Editor console. The script uses Pine Script v5 (@version=5).
Select Timeframe:
1-Minute Chart: Use defaults (emaFastLen=7, emaSlowLen=14, rsiLen=10, rsiOverbought=80, rsiOversold=20, slPerc=0.5, tpPerc=1.0, useCandlePatterns=false, patternLookback=10).
5-Minute Chart: Adjust to emaFastLen=9, emaSlowLen=21, rsiLen=14, rsiOverbought=75, rsiOversold=25, slPerc=0.8, tpPerc=1.5, useCandlePatterns=true, patternLookback=10.
Apply to Chart: Use a liquid crypto pair (e.g., BTC/USDT, ETH/USDT on Binance or Coinbase).
Verify Signals:
Green “BUY” or “EMA BUY” labels and triangle-up arrows below candles for bullish signals (EMA crossovers, bullish engulfing, hammer, doji, morning star, three white soldiers, double bottom).
Red “SELL” or “EMA SELL” labels and triangle-down arrows above candles for bearish signals (EMA crossovers, bearish engulfing, shooting star, doji, evening star, three black crows, double top).
Green/red background highlights for signal candles.
Backtest: Use TradingView’s Strategy Tester to evaluate performance over 1–3 months, checking Net Profit, Win Rate, and Drawdown.
Demo Test: Run on a demo account to confirm signal visibility and performance before trading with real funds.

Hilly 2.0 Advanced Crypto Scalping Strategy - 1 & 5 Min ChartsHow to Use
Copy the Code: Copy the script above.
Paste in TradingView: Open TradingView, go to the Pine Editor (bottom of the chart), paste the code, and click “Add to Chart.”
Check for Errors: Verify no errors appear in the Pine Editor console. The script uses Pine Script v5 (@version=5).
Select Timeframe:
1-Minute Chart: Use defaults (emaFastLen=7, emaSlowLen=14, rsiLen=10, rsiOverbought=80, rsiOversold=20, slPerc=0.5, tpPerc=1.0, useCandlePatterns=false).
5-Minute Chart: Adjust to emaFastLen=9, emaSlowLen=21, rsiLen=14, rsiOverbought=75, rsiOversold=25, slPerc=0.8, tpPerc=1.5, useCandlePatterns=true.
Apply to Chart: Use a liquid crypto pair (e.g., BTC/USDT, ETH/USDT on Binance or Coinbase).
Verify Signals:
Green “BUY” or “EMA BUY” labels and triangle-up arrows below candles.
Red “SELL” or “EMA SELL” labels and triangle-down arrows above candles.
Green/red background highlights for signal candles.
Arrows use size.normal for consistent visibility.
Backtest: Use TradingView’s Strategy Tester to evaluate performance over 1–3 months, checking Net Profit, Win Rate, and Drawdown.
Demo Test: Run on a demo account to confirm signal visibility and performance before trading with real funds.

Volume Profile AnalysisThe Volume Profile Dashboard is a professional-grade analysis tool built for TradingView. It focuses on displaying a comprehensive volume profile breakdown within a dashboard format directly on the chart. The purpose of this tool is to help traders quickly assess buy versus sell volume dynamics, momentum, and sentiment in order to support informed trading decisions.
Instead of plotting simple bars, this indicator uses a detailed table and visual progress bar to summarize live and historical market activity. By condensing key metrics into a structured format, traders can analyse market behaviour without manually calculating or switching between multiple indicators.
________________________________________
How the Script Works
1. Data Gathering
The script uses lower-timeframe price and volume data to calculate buy volume, sell volume, and total traded volume for the current and previous candles.
2. Volume Allocation
Buy and sell volumes are estimated by looking at the candle’s range (high to low) and how the closing price aligns within that range. The closer the close is to the high, the stronger the buying pressure. The closer the close is to the low, the stronger the selling pressure.
3. Delta and Momentum
o Delta measures the difference between buy and sell volume.
o Volume momentum compares the current candle’s activity to the previous one, showing if interest is rising or fading.
4. Point of Control (POC)
An average of high, low, and close is calculated to give an approximate “point of control” level—an area of balance where buyers and sellers previously agreed on price.
5. Dashboard Visualization
All these calculations are displayed inside a clean dashboard table with separate rows for the current candle, previous candle, and a summary row. Icons, colors, and progress bars make it visually intuitive.
6. On-Chart Progress Indicator
A dynamic horizontal progress bar is plotted on the chart above price, showing the balance between buy and sell volume for the latest activity.
7. Alerts
Built-in alerts trigger when strong buying or selling pressure is detected or when there is a significant spike in total traded volume.
________________________________________
How This Tool Can Be Used
• Intraday Trading: Quickly gauge whether buyers or sellers are in control of the market at any moment.
• Swing Trading: Compare momentum shifts between candles to identify early trend reversals.
• Risk Management: Use delta and sentiment signals to confirm whether to hold or reduce exposure.
• Confirmation: Align the volume profile dashboard with other indicators (such as RSI, MACD, or trendlines) for stronger trading conviction.
________________________________________
Using Mixed Indicators for Decisions
This dashboard alone provides volume insights, but better decisions come when it is combined with other tools:
• Pairing it with an RSI can show whether heavy buying is happening in overbought conditions.
• Combining with a SuperTrend or moving averages can confirm if volume momentum aligns with the price trend.
• Overlaying support/resistance levels can identify whether strong buy/sell signals occur at critical levels.
Mixed indicators prevent relying on one signal alone, reducing false trades.
________________________________________
Importance of This Tool
• Clarity: Condenses complex volume data into a simple, visual format.
• Speed: Traders can react faster with pre-calculated buy/sell percentages.
• Precision: Highlights hidden imbalances that are not obvious from candles alone.
• Professional-grade dashboard: Offers an institutional-style view of market behavior directly within TradingView.
________________________________________
Parameters in the Dashboard Table
• Period: Shows whether the row is for the current or previous candle, along with trend arrows.
• Price Range: The high–low range of the candle.
• Total Volume: The sum of buy and sell activity.
• Buy Volume / Sell Volume: Separated distribution of transactions leaning bullish or bearish.
• Delta: The net difference between buy and sell volumes, highlighting pressure imbalance.
• Buy % / Sell %: The percentage contribution of each side to total volume.
• POC: An average reference level where market consensus was strongest.
• Progress: A graphical bar showing buy vs sell dominance.
• Signal: Simplified output like Strong Buy, Buy, Strong Sell, Sell, Neutral.
• Summary Row: Compares changes between the current and previous candles and gives overall market sentiment.
________________________________________
Stock Market Disclaimer
This tool is for educational and informational purposes only. It does not constitute financial advice, investment advice, or trading recommendations. The stock market and cryptocurrency markets involve high risk. Traders and investors should do their own research and consult licensed financial advisors before making investment decisions. Past performance is not indicative of future results.
________________________________________
Misuse Disclaimer
This script has been developed as per TradingView’s rules and is intended for responsible trading analysis only. Any misuse, redistribution, or modification outside of TradingView’s policies is discouraged. The author and platform are not responsible for financial losses, misinterpretation of signals, or misuse of the code.
________________________________________
Disclaimer
Training & Educational Only — This material and the indicator are provided for educational purposes only. Nothing here is investment advice or a solicitation to buy or sell financial instruments. Past simulated or historical performance does not predict future results. Always perform full back testing and risk management, and consider seeking advice from a qualified financial professional before trading with real capital.
________________________________________

Breakout Volume Momentum [5m]Breakout Volume Momentum Indicator (Pine Script v5)
This TradingView Pine Script v5 indicator plots a green dot below a 5-minute price bar whenever all the breakout and volume conditions are met. It is optimized for live intraday trading (not backtesting) and includes customizable inputs for thresholds and trading session times. Key features and conditions of this indicator:
Gap Up Threshold: Current price is up at least X% (default 20%) from the previous day’s close (uses higher-timeframe daily data) before any signal can trigger.
Relative Volume (RVOL): Current bar’s volume is at least Y× (default 2×) the average volume of the last 20 bars. This ensures unusually high volume is present, indicating strong interest.
Trend Alignment: Price is trading above the VWAP (Volume-Weighted Average Price) and above a fast EMA. In addition, the fast EMA (default 9) is above the slower EMA (default 20) to confirm bullish momentum
tradingview.com
tradingview.com
. These filters ensure the stock is in an intraday uptrend (above the average price and rising EMAs).
Intraday Breakout (optional): Optionally require the price to break above the recent intraday high (default last 30 bars). If enabled, a signal only occurs when the stock exceeds its prior range high, confirming a breakout. This can be toggled on/off in the settings.
Avoid Parabolic Spikes: The script skips any bar with an excessively large range (default >12% from low to high), to avoid triggering on spiky or unsustainable parabolic candles.
Time Window Filter: Signals are restricted to a specific session window (by default 09:30 – 11:00 exchange time, typically the morning session) and will not trigger outside these hours. The session window is adjustable via inputs
stackoverflow.com
.
Alerts: An alert condition is provided so you can set a Trading View alert to send a push notification when a green dot signal fires. The alert message includes the ticker and price at the time of signal.

Cycle Phase & ETA Tracker [Robust v4]
Cycle Phase & ETA Tracker
Description
The Cycle Phase & ETA Tracker is a powerful tool for analyzing market cycles and predicting the completion of the current cycle (Estimated Time of Arrival, or ETA). It visualizes the cycle phase (0–100%) using a smoothed signal and displays the forecasted completion date with an optional confidence band based on cycle length variability. Ideal for traders looking to time their trades based on cyclical patterns, this indicator offers flexible settings for robust cycle analysis.
Key Features
Cycle Phase Visualization: Tracks the current cycle phase (0–100%) with color-coded zones: green (0–33%), blue (33–66%), orange (66–100%).
ETA Forecast: Shows a vertical line and label indicating the estimated date of cycle completion.
Confidence Band (±σ): Displays a band around the ETA to reflect uncertainty, calculated using the standard deviation of cycle lengths.
Multiple Averaging Methods: Choose from three methods to calculate average cycle length:
Median (Robust): Uses the median for resilience against outliers.
Weighted Mean: Prioritizes recent cycles with linear or quadratic weights.
Simple Mean: Applies equal weights to all cycles.
Adaptive Cycle Length: Automatically adjusts cycle length based on the timeframe or allows a fixed length.
Debug Histogram: Optionally displays the smoothed signal for diagnostic purposes.
Setup and Usage
Add the Indicator:
Search for "Cycle Phase & ETA Tracker " in TradingView’s indicator library and apply it to your chart.
Configure Parameters:
Core Settings:
Track Last N Cycles: Sets the number of recent cycles used to calculate the average cycle length (default: 20). Higher values provide stability but may lag market shifts.
Source: Selects the data source for analysis (e.g., close, open, high; default: close price).
Use Adaptive Cycle Length?: Enables automatic cycle length adjustment based on timeframe (e.g., shorter for intraday, longer for daily) or uses a fixed length if disabled.
Fixed Cycle Length: Defines the cycle length in bars when adaptive mode is off (default: 14). Smaller values increase sensitivity to short-term cycles.
Show Debug Histogram: Enables a histogram of the smoothed signal for debugging signal behavior.
Cycle Length Estimation:
Average Mode: Selects the method for calculating average cycle length: "Median (Robust)", "Weighted Mean", or "Simple Mean".
Weights (for Weighted Mean): For "Weighted Mean", chooses "linear" (moderate emphasis on recent cycles) or "quadratic" (strong emphasis on recent cycles).
ETA Visualization:
Show ETA Line & Label: Toggles the display of the ETA line and date label.
Show ETA Confidence Band (±σ): Toggles the confidence band around the ETA, showing the uncertainty range.
Band Transparency: Adjusts the transparency of the confidence band (0 = fully transparent, 100 = fully opaque; default: 85).
ETA Color: Sets the color for the ETA line, label, and confidence band (default: orange).
Interpretation:
The cycle phase (0–100%) indicates progress: green for the start, blue for the middle, and orange for the end of the cycle.
The ETA line and label show the predicted cycle completion date.
The confidence band reflects the uncertainty range (±1 standard deviation) of the ETA.
If a warning "Insufficient cycles for ETA" appears, wait for the indicator to collect at least 3 cycles.
Limitations
Requires at least 3 cycles for reliable ETA and confidence band calculations.
On low timeframes or low-volatility markets, zero-crossings may be infrequent, delaying ETA updates.
Accuracy depends on proper cycle length settings (adaptive or fixed).
Notes
Test the indicator across different assets and timeframes to optimize settings.
Use the debug histogram to troubleshoot if the ETA appears inaccurate.
For feedback or suggestions, contact the author via TradingView.
Cycle Phase & ETA Tracker
Описание
Индикатор Cycle Phase & ETA Tracker предназначен для анализа рыночных циклов и прогнозирования времени завершения текущего цикла (ETA — Estimated Time of Arrival). Он отслеживает фазы цикла (0–100%) на основе сглаженного сигнала и отображает предполагаемую дату завершения цикла с опциональной доверительной полосой, основанной на стандартном отклонении длин циклов. Индикатор идеально подходит для трейдеров, которые хотят выявлять циклические закономерности и планировать свои действия на основе прогнозируемого времени.
Ключевые особенности
Фазы цикла: Визуализирует текущую фазу цикла (0–100%) с цветовой кодировкой: зеленый (0–33%), синий (33–66%), оранжевый (66–100%).
Прогноз ETA: Показывает вертикальную линию и метку с предполагаемой датой завершения цикла.
Доверительная полоса (±σ): Отображает зону неопределенности вокруг ETA, основанную на стандартном отклонении длин циклов.
Гибкие методы усреднения: Поддерживает три метода расчета средней длины цикла:
Median (Robust): Медиана, устойчивая к выбросам.
Weighted Mean: Взвешенное среднее, где недавние циклы имеют больший вес (линейный или квадратичный).
Simple Mean: Простое среднее с равными весами.
Адаптивная длина цикла: Автоматически подстраивает длину цикла под таймфрейм или позволяет задать фиксированную длину.
Отладочная гистограмма: Опционально отображает сглаженный сигнал для анализа.
Настройка и использование
Добавьте индикатор:
Найдите "Cycle Phase & ETA Tracker " в библиотеке индикаторов TradingView и добавьте его на график.
Настройте параметры:
Core Settings:
Track Last N Cycles: Количество последних циклов для расчета средней длины (по умолчанию 20). Большие значения дают более стабильные результаты, но могут запаздывать.
Source: Источник данных (по умолчанию цена закрытия).
Use Adaptive Cycle Length?: Включите для автоматической настройки длины цикла по таймфрейму или отключите для использования фиксированной длины.
Fixed Cycle Length: Длина цикла в барах, если адаптивная длина отключена (по умолчанию 14).
Show Debug Histogram: Включите для отображения сглаженного сигнала (полезно для отладки).
Cycle Length Estimation:
Average Mode: Выберите метод усреднения: "Median (Robust)", "Weighted Mean" или "Simple Mean".
Weights (for Weighted Mean): Для режима "Weighted Mean" выберите "linear" (умеренный вес для новых циклов) или "quadratic" (сильный вес для новых циклов).
ETA Visualization:
Show ETA Line & Label: Включите для отображения линии и метки ETA.
Show ETA Confidence Band (±σ): Включите для отображения доверительной полосы.
Band Transparency: Прозрачность полосы (0 — полностью прозрачная, 100 — полностью непрозрачная, по умолчанию 85).
ETA Color: Цвет для линии, метки и полосы (по умолчанию оранжевый).
Интерпретация:
Фаза цикла (0–100%) показывает прогресс текущего цикла: зеленый — начало, синий — середина, оранжевый — конец.
Линия и метка ETA указывают предполагаемую дату завершения цикла.
Доверительная полоса показывает диапазон неопределенности (±1 стандартное отклонение).
Если отображается предупреждение "Insufficient cycles for ETA", дождитесь, пока индикатор соберет минимум 3 цикла.
Ограничения
Требуется минимум 3 цикла для надежного расчета ETA и доверительной полосы.
На низких таймфреймах или рынках с низкой волатильностью пересечения нуля могут быть редкими, что замедляет обновление ETA.
Эффективность зависит от правильной настройки длины цикла (fixedL или адаптивной).
Примечания
Протестируйте индикатор на разных таймфреймах и активах, чтобы подобрать оптимальные параметры.
Используйте отладочную гистограмму для анализа сигнала, если ETA кажется неточным.
Для вопросов или предложений по улучшению свяжитесь через TradingView.

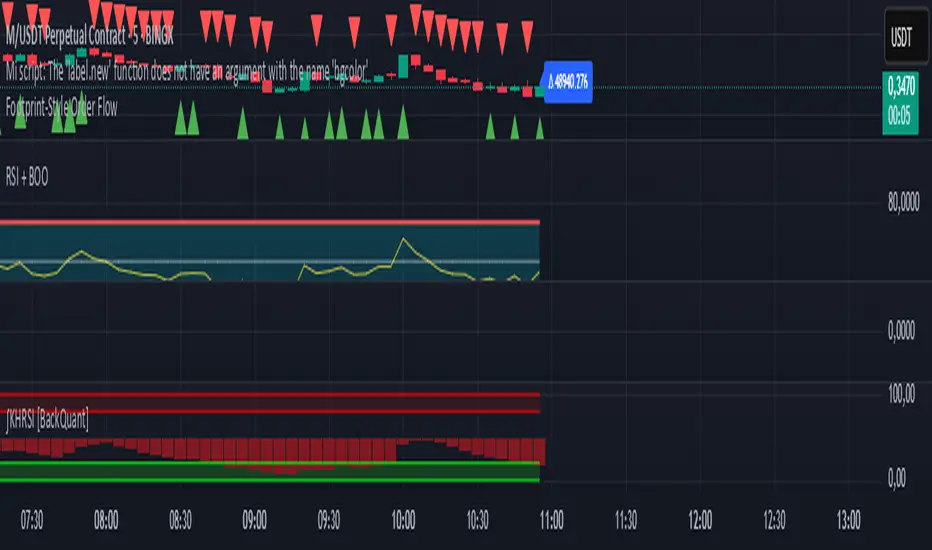
Footprint-Style Order Flow by Kalibea📊 Indicator: "Footprint-Style Order Flow by Kalibea"
Simplified Order Flow Analysis for TradingView
This indicator was created by Kalibea to bring you the power of Order Flow analysis in a clear, practical way—without technical complexity and fully compatible with TradingView.
While TradingView doesn’t support traditional footprint charts, this tool simulates institutional market reading using a smart calculation of estimated volume delta, helping you make more informed trading decisions.
🔍 What does this indicator do?
Estimated Delta: Calculates the difference between buying and selling pressure per candle, based on price movement and volume.
Smart Visual Signals:
🔼 Green Triangle: Potential buy entry (buyer dominance).
🔽 Red Triangle: Potential sell entry (seller dominance).
Delta Histogram: Displays whether each candle was driven more by buyers or sellers.
Live Labels: Shows real-time delta values above each candle for quick interpretation.
🧠 How does it help your trading?
Detects real-time market imbalances (who's in control: buyers or sellers).
Improves entry and exit timing, especially on lower timeframes.
Helps you confirm other strategies such as supply/demand zones, support/resistance, or candlestick patterns.
Provides an institutional-style reading simplified for use within TradingView.
⚙️ Fully Customizable to Your Style
Adjust the delta sensitivity to suit any market: Forex, Crypto, Indices, and more.
Turn on/off visual signals and histogram as needed.
🔑 Recommended by Kalibea for:
✅ Intraday traders and scalpers
✅ Traders looking to take the next step into institutional-style analysis
✅ Those seeking precise entries without overcomplicating their charts
💬 “Order Flow is the market’s internal voice. This indicator helps you hear it—no expensive footprint software required.”
— Kalibea
Fibonacci retracementHi all!
This indicator will show you the most recent Fibonacci retracement in the current trend. So if the trend is bullish the Fibonacci retracement will be drawn from swing low to high and from swing high to low in a bearish trend.
The uniqueness in this script lies in the adaptation to trend. To only plot the Fibonacci retracements according to the current market trend.
The trend is determined through break of structures (BOS) and change of characters (CHoCH). A change of character can be of type change of character plus (with a failed swing) and will then be shown as CHoCH+. This is possible through my library 'MarketStructure' (). It only uses break of structures and change of characters to be able to determine the trend, if you want a more detailed picture of the market structure you can use my script 'Market structure' ().
History and what to look for
Fibonacci retracement levels are used by many traders and are levels that are not Fibonacci sequence numbers themselves but they deriver from them. Some examples are:
23,6% - Divide a number by one three places ahead (e.g. 13/55)
38,2% - Divide a number by the one two places ahead (e.g. 21/55)
50% - Not from the Fibonacci sequence, but it's a number that price has reacted from in the past. Markets tend to retrace half a move before continuing
61,8% - The "golden retracement level". It derives from the "golden ratio" and is a core component of the Fibonacci sequence. The further you go in the Fibonacci sequence the preceding number divided by the current number will get closer and closer to this "golden ratio". This level is considered the most important Fibonacci retracement level by many traders
78,6% - Square root of 61.8%. This is often considered a deep correction (but not a trend reversal) and are often used for late entries
These levels are considered "key" and most significant. You want to look for a retracement of the price (down in a bullish trend and up in a bearish trend) to give you good entries.
Settings
For the trend you can set the pivot/swing lengths (right and left) and use the checkbox if you want these pivots to have labels. This can be done in the 'Market strucure' section.
In the 'Fibonacci retracement' section there is settings for the actual Fibonacci retracement. You can enable the trendline, set the color and the style of it. You can select which levels that should be shown by the indicator. There are 11 levels enabled by default, they are; 0-4.236. All settings in this section tries to be as similar to the "Fib Retracement" tool in Tradingview. You can also select the style of these lines (solid, dashed or dotted) and if you want them to extend to the right or not.
After this you can select if the Fibonacci retracement should be reversed or not, if prices should be displayed, if levels should be displayed and if to show the decimal levels or percentages and lastly the font size of these labels.
All defaults are based on the "Fib Retracement" tool by Tradingview.
Visualization
This indicator aims to be as visually similar to the default ("Fib Retracement") tool here on Tradingview. It will plot the Fibonacci retracement (called Auto Fibonacci/Auto fib) according to the trend from the library 'MarketStrucure'. The big differences from the "Fib Retracement" tool by Tradingview is that it's automatic (that adapts to trend), the market structure is visualized through lines and labels (showing 'BOS' for break of structures and 'CHoCH'/'CHoCH+' for change of characters) and that the labels showing information about the levels are positioned to be highly visible (left if <50% otherwise right if in a bullish trend, vice versa in a bearish trend or if reversed).
Don't hesitate if you have any feedback or nice feature suggestions!
Best of trading luck!

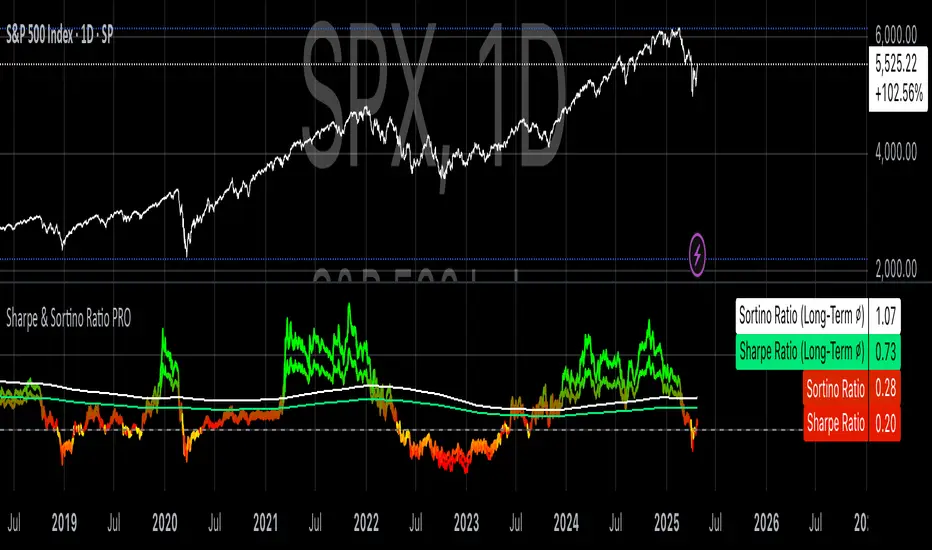
Sharpe & Sortino Ratio PROSharpe & Sortino Ratio PRO offers an advanced and more precise way to calculate and visualize the Sharpe and Sortino Ratios for financial assets on TradingView. Its main goal is to provide a scientifically accurate method for assessing the risk-adjusted performance of assets, both in the short and long term. Unlike TradingView’s built-in metrics, this script correctly handles periodic returns, uses optional logarithmic returns, properly annualizes both returns and volatility, and adjusts for the risk-free rate — all critical factors for truly meaningful Sharpe and Sortino calculations.
Users can customize the rolling analysis window (e.g., 252 periods for one year on daily data) and the long-term smoothing period (e.g., 1260 periods for five years). There’s also an option to select between linear and logarithmic returns and to manually input a risk-free rate if real-time data from FRED (the 3-Month T-Bill Rate via FRED:DGS3MO) is unavailable. Based on the chart’s timeframe (daily, weekly, or monthly), the script automatically adjusts the risk-free rate to a per-period basis.
The Sharpe Ratio is calculated by first determining the asset’s excess returns (returns after subtracting the risk-free return per period), then computing the average and standard deviation of those excess returns over the specified window, and finally annualizing these figures separately — in line with best scientific practices (Sharpe, 1994). The Sortino Ratio follows a similar approach but only considers negative returns, focusing specifically on downside risk (Sortino & Van der Meer, 1991).
To enhance readability, the script visualizes the ratios using a color gradient: strong negative values are shown in red, neutral values in yellow, and strong positive values in green. Additionally, the long-term averages for both Sharpe and Sortino are plotted with steady colors (teal and orange, respectively), making it easier to spot enduring performance trends.
Why calculating Sharpe and Sortino Ratios manually on TradingView is necessary?
While TradingView provides basic Sharpe and Sortino Ratios, they come with significant methodological flaws that can lead to misleading conclusions about an asset’s true risk-adjusted performance.
First, TradingView often computes volatility based on the standard deviation of price levels rather than returns (TradingView, 2023). This method is problematic because it causes the volatility measure to be directly dependent on the asset’s absolute price. For instance, a stock priced at $1,000 will naturally show larger absolute daily price moves than a $10 stock, even if their percentage changes are similar. This artificially inflates the measured standard deviation and, as a result, depresses the calculated Sharpe Ratio.
Second, TradingView frequently neglects to adjust for the risk-free rate. By treating all returns as risky returns, the computed Sharpe Ratio may significantly underestimate risk-adjusted performance, especially when interest rates are high (Sharpe, 1994).
Third, and perhaps most critically, TradingView doesn’t properly annualize the mean excess return and the standard deviation separately. In correct financial math, the mean excess return should be multiplied by the number of periods per year, while the standard deviation should be multiplied by the square root of the number of periods per year (Cont, 2001; Fabozzi et al., 2007). Incorrect annualization skews the Sharpe and Sortino Ratios and can lead to under- or overestimating investment risk.
These flaws lead to three major issues:
• Overstated volatility for high-priced assets.
• Incorrect scaling between returns and risk.
• Sharpe Ratios that are systematically biased downward, especially in high-price or high-interest environments.
How to properly calculate Sharpe and Sortino Ratios in Pine Script?
To get accurate results, the Sharpe and Sortino Ratios must be calculated using the correct methodology:
1. Use returns, not price levels, to calculate volatility. Ideally, use logarithmic returns for better mathematical properties like time additivity (Cont, 2001).
2. Adjust returns by subtracting the risk-free rate on a per-period basis to obtain true excess returns.
3. Annualize separately:
• Multiply the mean excess return by the number of periods per year (e.g., 252 for daily data).
• Multiply the standard deviation by the square root of the number of periods per year.
4. Finally, divide the annualized mean excess return by the annualized standard deviation to calculate the Sharpe Ratio.
The Sortino Ratio follows the same structure but uses downside deviations instead of standard deviations.
By following this scientifically sound method, you ensure that your Sharpe and Sortino Ratios truly reflect the asset’s real-world risk and return characteristics.
References
• Cont, R. (2001). Empirical properties of asset returns: stylized facts and statistical issues. Quantitative Finance, 1(2), pp. 223–236.
• Fabozzi, F.J., Gupta, F. and Markowitz, H.M. (2007). The Legacy of Modern Portfolio Theory. Journal of Investing, 16(3), pp. 7–22.
• Sharpe, W.F. (1994). The Sharpe Ratio. Journal of Portfolio Management, 21(1), pp. 49–58.
• Sortino, F.A. and Van der Meer, R. (1991). Downside Risk: Capturing What’s at Stake in Investment Situations. Journal of Portfolio Management, 17(4), pp. 27–31.
• TradingView (2023). Help Center - Understanding Sharpe and Sortino Ratios. Available at: www.tradingview.com (Accessed: 25 April 2025).
ICT FVG & Swing Detector Basic by Trader RiazICT FVG & Swing Detector Basic by Trader Riaz
Unlock Precision Trading with the Ultimate Fair Value Gap (FVG) and Swing Detection Tool!
Developed by Trader Riaz , the ICT FVG and Swing Detector Basic is a powerful Pine Script indicator designed to help traders identify key market structures with ease. Whether you're a day trader, swing trader, or scalper, this indicator provides actionable insights by detecting Bullish and Bearish Fair Value Gaps (FVGs) and Swing Highs/Lows on any timeframe. Perfect for trading forex, stocks, crypto, and more on TradingView!
Key Features:
1: Bullish and Bearish FVG Detection
- Automatically identifies Bullish FVGs (highlighted in green) and Bearish FVGs (highlighted in red) to spot potential reversal or continuation zones.
- Displays FVGs as shaded boxes with a dashed midline at 70% opacity, making it easy to see the midpoint of the gap for precise entries and exits.
- Labels are placed inside the FVG boxes at the extreme right for clear visibility.
2: Customizable FVG Display
- Control the number of Bullish and Bearish FVGs displayed on the chart with user-defined inputs (fvg_bull_count and fvg_bear_count).
- Toggle the visibility of Bullish and Bearish FVGs with simple checkboxes (show_bull_fvg and show_bear_fvg) to declutter your chart.
3: Swing High and Swing Low Detection
- Detects Swing Highs (blue lines) and Swing Lows (red lines) to identify key market turning points.
- Labels are positioned at the extreme right edge of the lines for better readability and alignment.
- Customize the number of Swing Highs and Lows displayed (swing_high_count and swing_low_count) to focus on the most recent market structures.
4: Fully Customizable Display
- Toggle visibility for Swing Highs and Lows (show_swing_high and show_swing_low) to suit your trading style.
- Adjust the colors of Swing High and Low lines (swing_high_color and swing_low_color) to match your chart preferences.
5: Clean and Efficient Design
- Built with Pine Script v6 for optimal performance on TradingView.
- Automatically removes older FVGs and Swing points when the user-defined count is exceeded, keeping your chart clean and focused.
- Labels are strategically placed to avoid clutter while providing clear information.
Why Use This Indicator?
Precision Trading: Identify high-probability setups with FVGs and Swing points, commonly used in Smart Money Concepts (SMC) and Institutional Trading strategies.
User-Friendly: Easy-to-use inputs allow traders of all levels to customize the indicator to their needs.
Versatile: Works on any market (Forex, Stocks, Crypto, Commodities) and timeframe (1M, 5M, 1H, 4H, Daily, etc.).
Developed by Trader Riaz: Backed by the expertise of Trader Riaz, a seasoned trader dedicated to creating tools that empower the TradingView community.
How to Use:
- Add the Custom FVG and Swing Detector to your chart on TradingView.
- Adjust the input settings to control the number of FVGs and Swing points displayed.
- Toggle visibility for Bullish/Bearish FVGs and Swing Highs/Lows as needed.
- Use the identified FVGs and Swing points to plan your trades, set stop-losses, and target key levels.
Ideal For:
- Traders using Smart Money Concepts (SMC), Price Action, or Market Structure strategies.
- Those looking to identify liquidity grabs, imbalances, and trend reversals.
- Beginners and advanced traders seeking a reliable tool to enhance their technical analysis.
Happy trading!

Footprint Chart by Th16rryDescription of the "Footprint Chart" Indicator
This indicator is an approximation of a true **Footprint Chart** adapted for TradingView, which does not provide access to tick-by-tick data or detailed order book information. It relies on **heuristics** to estimate the distribution of volume between buyers and sellers for each candlestick.
Key Features:
- Estimation of Buy/Sell Volume:
The indicator splits the total volume of a candlestick into two parts based on the candle's nature:
- For a bullish candle (close > open), it assumes that **60% of the volume** is executed on the ask (buys) and **40% on the bid** (sells).
- For a bearish candle (close < open), the estimation is reversed (40% buys, 60% sells).
- For a neutral candle (close = open), the volume is evenly distributed at 50% for each side.
- Calculation of a Simplified Delta:
The delta is defined as the difference between the estimated buy volume and sell volume. This delta helps quickly identify the dominant market pressure—positive for buyer dominance and negative for seller dominance.
- Visual Display:
- A label is placed on each candlestick displaying the delta value, with a green background for a positive delta (indicating buying pressure) and red for a negative delta (indicating selling pressure).
- A table in the top-right corner of the chart summarizes the estimated volumes for the current candle: buy volume, sell volume, and total volume.
#### How to Use the Indicator:
- Analyzing Buy/Sell Pressure:
By observing the label's color and the delta value, a trader can quickly assess whether the market shows a dominant buying or selling pressure during a given candle.
- Complementing Other Tools:
This indicator can be used alongside other technical analysis tools, such as the Volume Profile or trend indicators, to gain a more comprehensive understanding of market behavior.
- Supporting Decision Making:
By providing a visual estimate of the volume distribution, it can help identify divergences between price movement and volume activity, which may signal potential reversals or confirm ongoing trends.
Limitations:
- Heuristic Approximation:
The method of volume distribution is based on simple assumptions and does not reflect the actual order flow, which would require tick-by-tick data to be accurately represented.
- Data Limitations on TradingView:
Due to TradingView’s restrictions on accessing detailed order book data, this indicator can only approximate a Footprint Chart and does not replace specialized tools.
In summary, the "Footprint Chart" indicator provides a visual and quick estimation of the volume distribution between buyers and sellers for each candlestick, offering valuable insights into order flow dynamics while remaining aware of its heuristic limitations.

Dual Keltner ChannelsDual Keltner Channels (DKC) Indicator 📊
🔹 About This Indicator
This indicator is an enhanced version of the original Keltner Channel available in TradingView. The Keltner Channel was initially designed as a volatility-based envelope around a moving average, helping traders identify trends, breakouts, and potential reversal zones.
💡 Original Creator: The Keltner Channel concept is based on the work of Chester W. Keltner and was later implemented in various trading platforms, including TradingView’s built-in Keltner Channel indicator.
This script builds upon the TradingView version of the Keltner Channel, adding:
✅ Dual Keltner Bands (Inner & Outer) for better trend and volatility analysis.
✅ Customizable Moving Averages (EMA/SMA) for flexibility.
✅ Multiple Band Calculation Methods (ATR, True Range, Range) for improved accuracy.
✅ Shaded Zones Between the Bands for enhanced visual clarity.
⚡ Credit: This indicator is an enhancement of the original Keltner Channel Indicator in TradingView. All improvements and modifications are made to provide deeper market insights while maintaining the core principles of the original Keltner concept.
🔹 Overview
The Dual Keltner Channels (DKC) indicator overlays two Keltner Channels on the price chart, helping traders spot trends, breakouts, and reversals with greater precision.
Inner Keltner Band (Multiplier 1): Captures normal price movements.
Outer Keltner Band (Multiplier 2): Highlights extreme price movements and potential breakouts.
🔹 Features & Inputs
📌 Main Inputs:
Keltner Channel Length: Defines the lookback period for the moving average calculation.
Source Price: Selects the price type (close, open, high, low) to calculate the bands.
Exponential Moving Average (EMA) Option: Choose between Exponential (EMA) or Simple (SMA) as the basis for calculations.
Bands Style: Selects how the volatility is measured:
Average True Range (ATR) (default)
True Range (TR)
Range (High - Low)
ATR Length: Determines the length of ATR calculations.
Enable Multiplier 1 & 2: Toggle to display/hide inner (multiplier 1) and outer (multiplier 2) bands.
📌 Keltner Channels Calculation:
Moving Average (MA): Uses either EMA or SMA for the midline.
Volatility Band Calculation:
Upper Band 1 (Inner Band): MA + (Multiplier 1 × Volatility Measure)
Lower Band 1 (Inner Band): MA - (Multiplier 1 × Volatility Measure)
Upper Band 2 (Outer Band): MA + (Multiplier 2 × Volatility Measure)
Lower Band 2 (Outer Band): MA - (Multiplier 2 × Volatility Measure)
📌 Visuals & Plotting:
Inner Bands (Multiplier 1): Blue upper & lower lines.
Outer Bands (Multiplier 2): Darker blue upper & lower lines.
Basis Line: White moving average.
Shaded Areas:
Between Upper 1 & Upper 2 (Light Brown Area): Identifies the upper Keltner region.
Between Lower 1 & Lower 2 (Light Brown Area): Identifies the lower Keltner region.
🔹 How to Use the Dual Keltner Channels Indicator
✅ 1. Trend Identification
Price above the upper outer band (Multiplier 2): Strong uptrend – potential continuation.
Price below the lower outer band (Multiplier 2): Strong downtrend – potential continuation.
Price within the inner bands (Multiplier 1): Sideways market – possible consolidation.
✅ 2. Breakout Trading
Break above outer upper band: Indicates a bullish breakout – consider long trades.
Break below outer lower band: Indicates a bearish breakdown – consider short trades.
✅ 3. Overbought & Oversold Conditions
Price touching/exceeding outer bands (Multiplier 2): Potential reversal zones.
Reversal confirmation: Look for candlestick patterns (e.g., Doji, Engulfing) or divergence signals.
✅ 4. Pullback & Entry Zones
Price bouncing from inner bands (Multiplier 1): Good re-entry point in trend direction.
Inner band as support/resistance: Helps in setting stop-loss and profit targets.
🔹 Effective Trading Strategies Using DKC
📌 1. Trend Following Strategy (Using Moving Average & Bands)
✅ Look for price staying above/below the basis line (MA) within the outer bands.
✅ Use pullbacks to the inner bands as re-entry points for trend continuation.
✅ Confirm trend strength with momentum indicators like RSI, MACD.
📌 2. Breakout Trading Strategy
✅ Identify a tight consolidation phase within the inner Keltner bands.
✅ Wait for a strong breakout beyond the outer bands.
✅ Enter long/short trades based on breakout direction.
✅ Place stop-loss at the previous inner band to manage risk.
📌 3. Reversal Strategy (Mean Reversion)
✅ When price extends beyond the outer band (Multiplier 2), look for reversal signals (candlestick patterns, RSI divergence).
✅ Enter counter-trend trades with tight stop-loss beyond the band.
✅ Target the moving average (basis line) as take-profit.
🔹 Final Thoughts 💡
The Dual Keltner Channels (DKC) is a powerful upgrade to the standard Keltner Channel, providing:
✅ Greater clarity on trend strength
✅ More precise breakout & reversal signals
✅ Better visual insights for dynamic market conditions
📌 Best Used With: RSI, MACD, Volume Profile, Price Action Signals.
📌 Works on: Stocks, Forex, Crypto, Commodities, Indices.

Poisson Projection of Price Levels### **Poisson Projection of Price Levels**
**Overview:**
The *Poisson Projection of Price Levels* is a cutting-edge technical indicator designed to identify and visualize potential support and resistance levels based on historical price interactions. By leveraging the Poisson distribution, this tool dynamically adjusts the significance of each price level's past "touches" to project future interactions with varying degrees of probability. This probabilistic approach offers traders a nuanced view of where price levels may hold or react in upcoming bars, enhancing both analysis and trading strategies.
---
**🔍 **Math & Methodology**
1. **Strata Levels:**
- **Definition:** Strata are horizontal lines spaced evenly around the current closing price.
- **Calculation:**
\
where \(i\) ranges from 0 to \(\text{Strata Count} - 1\).
2. **Forecast Iterations:**
- **Structure:** The indicator projects five forecast iterations into the future, each spaced by a Fibonacci sequence of bars: 2, 3, 5, 8, and 13 bars ahead. This spacing is inspired by the Fibonacci sequence, which is prevalent in financial market analysis for identifying key levels.
- **Purpose:** Each iteration represents a distinct forecast point where the price may interact with the strata, allowing for a multi-step projection of potential price levels.
3. **Touch Counting:**
- **Definition:** A "touch" occurs when the closing price of a bar is within half the increment of a stratum level.
- **Process:** For each stratum and each forecast iteration, the indicator counts the number of touches within a specified lookback window (e.g., 80 bars), offset by the forecasted position. This ensures that each iteration's touch count is independent and contextually relevant to its forecast horizon.
- **Adjustment:** Each forecast iteration analyzes a unique segment of the lookback window, offset by its forecasted position to ensure independent probability calculations.
4. **Poisson Probability Calculation:**
- **Formula:**
\
\
- **Interpretation:** \(p(k=1)\) represents the probability of exactly one touch occurring within the lookback window for each stratum and iteration.
- **Application:** This probability is used to determine the transparency of each stratum line, where higher probabilities result in more opaque (less transparent) lines, indicating stronger historical significance.
5. **Transparency Mapping:**
- **Calculation:**
\
- **Purpose:** Maps the Poisson probability to a visual transparency level, enhancing the readability of significant strata levels.
- **Outcome:** Strata with higher probabilities (more historical touches) appear more opaque, while those with lower probabilities appear fainter.
---
**📊 **Comparability to Standard Techniques**
1. **Support and Resistance Levels:**
- **Traditional Approach:** Traders identify support and resistance based on historical price reversals, pivot points, or psychological price levels.
- **Poisson Projection:** Automates and quantifies this process by statistically analyzing the frequency of price interactions with specific levels, providing a probabilistic measure of significance.
2. **Statistical Modeling:**
- **Standard Models:** Techniques like Moving Averages, Bollinger Bands, or Fibonacci Retracements offer dynamic and rule-based levels but lack direct probabilistic interpretation.
- **Poisson Projection:** Introduces a discrete event probability framework, offering a unique blend of statistical rigor and visual clarity that complements traditional indicators.
3. **Event-Based Analysis:**
- **Financial Industry Practices:** Event studies and high-frequency trading models often use Poisson processes to model order arrivals or price jumps.
- **Indicator Application:** While not identical, the use of Poisson probabilities in this indicator draws inspiration from event-based modeling, applying it to the context of price level interactions.
---
**💡 **Strengths & Advantages**
1. **Innovative Visualization:**
- Combines statistical probability with traditional support/resistance visualization, offering a fresh perspective on price level significance.
2. **Dynamic Adaptability:**
- Parameters like strata increment, lookback window, and probability threshold are user-defined, allowing customization across different markets and timeframes.
3. **Independent Probability Calculations:**
- Each forecast iteration calculates its own Poisson probability, ensuring that projections are contextually relevant and independent of other iterations.
4. **Clear Visual Cues:**
- Transparency-based coloring intuitively highlights significant price levels, making it easier for traders to identify key areas of interest at a glance.
---
**⚠️ **Limitations & Considerations**
1. **Poisson Assumptions:**
- Assumes that touches occur independently and at a constant average rate (\(\lambda\)), which may not always align with market realities characterized by trends and volatility clustering.
2. **Computational Intensity:**
- Managing multiple iterations and strata can be resource-intensive, potentially affecting performance on lower-powered devices or with very high lookback windows.
3. **Interpretation Complexity:**
- While transparency offers visual clarity, understanding the underlying probability calculations requires a basic grasp of Poisson statistics, which may be a barrier for some traders.
---
**📢 **How to Use It**
1. **Add to TradingView:**
- Open TradingView and navigate to the Pine Script Editor.
- Paste the script above and click **Add to Chart**.
2. **Configure Inputs:**
- **Strata Increment:** Set the desired price step between strata (e.g., `0.1` for 10 cents).
- **Lookback Window:** Define how many past bars to consider for calculating Poisson probabilities (e.g., `80`).
- **Probability Transparency Threshold (%):** Set the threshold percentage to map probabilities to line transparency (e.g., `25%`).
3. **Understand the Forecast Iterations:**
- The indicator projects five forecast points into the future at bar spacings of 2, 3, 5, 8, and 13 bars ahead.
- Each iteration independently calculates its Poisson probability based on the touch counts within its specific lookback window offset by its forecasted position.
4. **Interpret the Visualization:**
- **Opaque Lines:** Indicate higher Poisson probabilities, suggesting historically significant price levels that are more likely to interact again.
- **Fainter Lines:** Represent lower probabilities, indicating less historically significant levels that may be less likely to interact.
- **Forecast Spacing:** The spacing of 2, 3, 5, 8, and 13 bars ahead aligns with Fibonacci principles, offering a natural progression in forecast horizons.
5. **Apply to Trading Strategies:**
- **Support/Resistance Identification:** Use the opaque lines as potential support and resistance levels for placing trades.
- **Entry and Exit Points:** Anticipate price interactions at forecasted levels to plan strategic entries and exits.
- **Risk Management:** Utilize the transparency mapping to determine where to place stop-loss and take-profit orders based on the probability of price interactions.
6. **Customize as Needed:**
- Adjust the **Strata Increment** to fit different price ranges or volatility levels.
- Modify the **Lookback Window** to capture more or fewer historical touches, adapting to different timeframes or market conditions.
- Tweak the **Probability Transparency Threshold** to control the sensitivity of transparency mapping to Poisson probabilities.
**📈 **Practical Applications**
1. **Identifying Key Levels:**
- Quickly visualize which price levels have historically had significant interactions, aiding in the identification of potential support and resistance zones.
2. **Forecasting Price Reactions:**
- Use the forecast iterations to anticipate where price may interact in the near future, assisting in planning entry and exit points.
3. **Risk Management:**
- Determine areas of high probability for price reversals or consolidations, enabling better placement of stop-loss and take-profit orders.
4. **Market Analysis:**
- Assess the strength of market levels over different forecast horizons, providing a multi-layered understanding of market structure.
---
**🔗 **Conclusion**
The *Poisson Projection of Price Levels* bridges the gap between statistical modeling and traditional technical analysis, offering traders a sophisticated tool to quantify and visualize the significance of price levels. By integrating Poisson probabilities with dynamic transparency mapping, this indicator provides a unique and insightful perspective on potential support and resistance zones, enhancing both analysis and trading strategies.
---
**📞 **Contact:**
For support or inquiries, please contact me on TradingView!
---
**📢 **Join the Conversation!**
Have questions, feedback, or suggestions for further enhancements? Feel free to comment below or reach out directly. Your input helps refine and evolve this tool to better serve the trading community.
---
**Happy Trading!** 🚀

Backtesting ModuleDo you often find yourself creating new 'strategy()' scripts for each trading system? Are you unable to focus on generating new systems due to fatigue and time loss incurred in the process? Here's a potential solution: the 'Backtesting Module' :)
INTRODUCTION
Every trading system is based on four basic conditions: long entry, long exit, short entry and short exit (which are typically defined as boolean series in Pine Script).
If you can define the conditions generated by your trading system as a series of integers, it becomes possible to use these variables in different scripts in efficient ways. (Pine Script is a convenient language that allows you to use the integer output of one indicator as a source in another.)
The 'Backtesting Module' is a dynamic strategy script designed to adapt to your signals. It boasts two notable features:
⮞ It produces a backtest report using the entry and exit variables you define.
⮞ It not only serves for system testing but also to combine independent signals into a single system. (This functionality enables to create complex strategies and report on their success!)
The module tests Golden and Death cross signals by default, when you enter your own conditions the default signals will be neutralized. The methodology is described below.
PREPARATION
There are three simple steps to connect your own indicator to the Module.
STEP 1
Firstly, you must define entry and exit variables in your own script. Let's elucidate it with a straightforward example. Consider a system generating long and short signals based on the intersections of two moving averages. Consequently, our conditions would be as follows:
// Signals
long = ta.crossover(ta.sma(close, 14), ta.sma(close, 28))
short = ta.crossunder(ta.sma(close, 14), ta.sma(close, 28))
Now, the question is: How can we convert boolean variables into integer variables? The answer is conditional ternary block, defined as follows:
// Entry & Exit
long_entry = long ? 1 : 0
long_exit = short ? 1 : 0
short_entry = short ? 1 : 0
short_exit = long ? 1 : 0
The mechanics of the Entry & Exit variables are simple. The variable takes on a value of 1 when your trading system generates the signal and if your system does not produce any signal, variable returns 0. In this example, you see how exit signals can be generated in a trading system that only contains entry signals. If you have a system with original exit signals, you can also use them directly. (Please mind the NOTES section below).
STEP 2
To utilize the Entry & Exit variables as source in another script, they must be plotted on the chart. Therefore, the final detail to include in the script containing your trading system would be as follows:
// Plot The Output
plot(long_entry, "Long Entry", display=display.data_window, editable=false)
plot(long_exit, "Long Exit", display=display.data_window, editable=false)
plot(short_entry, "Short Entry", display=display.data_window, editable=false)
plot(short_exit, "Short Exit", display=display.data_window, editable=false)
STEP 3
Now, we are ready to test the system! Load the Backtesting Module indicator onto the chart along with your trading system/indicator. Then set the outputs of your system (Long Entry, Long Exit, Short Entry, Short Exit) as source in the module. That's it.
FEATURES & ORIGINALITY
⮞ Primarily, this script has been created to provide you with an easy and practical method when testing your trading system.
⮞ I thought it might be nice to visualize a few useful results. The Backtesting Module provides insights into the outcomes of both long and short trades by computing the number of trades and the success percentage.
⮞ Through the 'Trade' parameter, users can specify the market direction in which the indicator is permitted to initiate positions.
⮞ Users have the flexibility to define the date range for the test.
⮞ There are optional features allowing users to plot entry prices on the chart and customize bar colors.
⮞ The report and the test date range are presented in a table on the chart screen. The entry price can be monitored in the data window.
⮞ Note that results are based on realized returns, and the open trade is not included in the displayed results. (The only exception is the 'Unrealized PNL' result in the table.)
STRATEGY SETTINGS
The default parameters are as follows:
⮞ Initial Balance : 10000 (in units of currency)
⮞ Quantity : 10% of equity
⮞ Commission : 0.04%
⮞ Slippage : 0
⮞ Dataset : All bars in the chart
For a realistic backtest result, you should size trades to only risk sustainable amounts of equity. Do not risk more than 5-10% on a trade. And ALWAYS configure your commission and slippage parameters according to pessimistic scenarios!
NOTES
⮞ This script is intended solely for development purposes. And it'll will be available for all the indicators I publish.
⮞ In this version of the module, all order types are designed as market orders. The exit size is the sum of the entry size.
⮞ As your trading conditions grow more intricate, you might need to define the outputs of your system in alternative ways. The method outlined in this description is tailored for straightforward signal structures.
⮞ Additionally, depending on the structure of your trading system, the backtest module may require further development. This encompasses stop-loss, take-profit, specific exit orders, quantity, margin and risk management calculations. I am considering releasing improvements that consider these options in future versions.
⮞ An example of how complex trading signals can be generated is the OTT Collection. If you're interested in seeing how the signals are constructed, you can use the link below.
THANKS
Special thanks to PineCoders for their valuable moderation efforts.
I hope this will be a useful example for the TradingView community...
DISCLAIMER
This is just an indicator, nothing more. It is provided for informational and educational purposes exclusively. The utilization of this script does not constitute professional or financial advice. The user solely bears the responsibility for risks associated with script usage. Do not forget to manage your risk. And trade as safely as possible. Best of luck!

TradingView.To Strategy Template (with Dyanmic Alerts)Hello traders,
If you're tired of manual trading and looking for a solid strategy template to pair with your indicators, look no further.
This Pine Script v5 strategy template is engineered for maximum customization and risk management.
Best part?
This Pine Script v5 template facilitates the dynamic construction of TradingView.TO alerts, sparing users the time and effort of mastering the TradingView.TO syntax and manually create alert commands.
This powerful tool gives much power to those who don't know how to code in Pinescript and want to automate their indicators' signals via TradingView.TO bot.
IMPORTANT NOTES
TradingView.TO is a trading bot software that forwards TradingView alerts to your brokers (examples: Binance, Oanda, Coinbase, Bybit, Metatrader 4/5, ...) for automating trading.
Many traders don't know how to create TradingView.TO dynamically-compatible alerts using the data from their TradingView scripts.
Traders using trading bots want their alerts to reflect the stop-loss/take-profit/trailing-stop/stop-loss to break options from your script and then create the orders accordingly.
This script showcases how to create TradingView.TO alerts dynamically.
TRADINGVIEW ALERTS
1) You'll have to create one alert per asset X timeframe = 1 chart.
Example: 1 alert for BTC/USDT on the 5 minutes chart, 1 alert for BTC/USDT on the 15-minute chart (assuming you want your bot to trade the BTC/USDT on the 5 and 15-minute timeframes)
2) Select the Order fills and alert() function calls condition
3) For each alert, the alert message is pre-configured with the text below
{{strategy.order.alert_message}}
Please leave it as it is.
It's a TradingView native variable that will fetch the alert text messages built by the script.
4) TradingView.TO uses webhook technology - setting a webhook URL from the alerts notifications tab is required.
KEY FEATURES
I) Modular Indicator Connection
* plug your existing indicator into the template.
* Only two lines of code are needed for full compatibility.
Step 1: Create your connector
Adapt your indicator with only 2 lines of code and then connect it to this strategy template.
To do so:
1) Find in your indicator where the conditions print the long/buy and short/sell signals.
2) Create an additional plot as below
I'm giving an example with a Two moving averages cross.
Please replicate the same methodology for your indicator, whether a MACD , ZigZag, Pivots , higher-highs, lower-lows or whatever indicator with clear buy and sell conditions.
//@version=5
indicator("Supertrend", overlay = true, timeframe = "", timeframe_gaps = true)
atrPeriod = input.int(10, "ATR Length", minval = 1)
factor = input.float(3.0, "Factor", minval = 0.01, step = 0.01)
= ta.supertrend(factor, atrPeriod)
supertrend := barstate.isfirst ? na : supertrend
bodyMiddle = plot(barstate.isfirst ? na : (open + close) / 2, display = display.none)
upTrend = plot(direction < 0 ? supertrend : na, "Up Trend", color = color.green, style = plot.style_linebr)
downTrend = plot(direction < 0 ? na : supertrend, "Down Trend", color = color.red, style = plot.style_linebr)
fill(bodyMiddle, upTrend, color.new(color.green, 90), fillgaps = false)
fill(bodyMiddle, downTrend, color.new(color.red, 90), fillgaps = false)
buy = ta.crossunder(direction, 0)
sell = ta.crossunder(direction, 0)
//////// CONNECTOR SECTION ////////
Signal = buy ? 1 : sell ? -1 : 0
plot(Signal, title = "Signal", display = display.data_window)
//////// CONNECTOR SECTION ////////
Important Notes
🔥 The Strategy Template expects the value to be exactly 1 for the bullish signal and -1 for the bearish signal
Now, you can connect your indicator to the Strategy Template using the method below or that one.
Step 2: Connect the connector
1) Add your updated indicator to a TradingView chart
2) Add the Strategy Template as well to the SAME chart
3) Open the Strategy Template settings, and in the Data Source field, select your 🔌Connector🔌 (which comes from your indicator)
Note it doesn’t have to be named 🔌Connector🔌 - you can name it as you want - however, I recommend an explicit name you can easily remember.
From then, you should start seeing the signals and plenty of other stuff on your chart.
🔥 Note that whenever you update your indicator values, the strategy statistics and visuals on your chart will update in real-time
II) BOT Risk Management:
- Max Drawdown:
Mode: Select whether the max drawdown is calculated in percentage (%) or USD.
Value: If the max drawdown reaches this specified value, set a value to halt the bot.
- Max Consecutive Days:
Use Max Consecutive Days BOT Halt: Enable/Disable halting the bot if the max consecutive losing days value is reached.
- Max Consecutive Days: Set the maximum number of consecutive losing days allowed before halting the bot.
- Max Losing Streak:
Use Max Losing Streak: Enable/Disable a feature to prevent the bot from taking too many losses in a row.
- Max Losing Streak Length: Set the maximum length of a losing streak allowed.
Margin Call:
- Use Margin Call: Enable/Disable a feature to exit when a specified percentage away from a margin call to prevent it.
Margin Call (%): Set the percentage value to trigger this feature.
- Close BOT Total Loss:
Use Close BOT Total Loss: Enable/Disable a feature to close all trades and halt the bot if the total loss is reached.
- Total Loss ($): Set the total loss value in USD to trigger this feature.
Intraday BOT Risk Management:
- Intraday Losses:
Use Intraday Losses BOT Halt: Enable/Disable halting the bot on reaching specified intraday losses.
Mode: Select whether the intraday loss is calculated in percentage (%) or USD.
- Max Intraday Losses (%): Set the value for maximum intraday losses.
Limit Intraday Trades:
- Use Limit Intraday Trades: Enable/Disable a feature to limit the number of intraday trades.
- Max Intraday Trades: Set the maximum number of intraday trades allowed.
Restart Intraday EA:
III) Order Types and Position Sizing
- Choose between market or limit orders.
- Set your position size directly in the template.
Please use the position size from the “Inputs” and not the “Properties” tab.
I know it's redundant. - the template needs this value from the "Inputs" tab to build the alerts, and the Backtester needs it from the "Properties" tab.
IV) Advanced Take-Profit and Stop-Loss Options
- Choose to set your SL/TP in either USD or percentages.
- Option for multiple take-profit levels and trailing stop losses.
- Move your stop loss to break even +/- offset in USD for “risk-free” trades.
V) Miscellaneous:
Retry order openings if they fail.
Order Types:
Select and specify order type and price settings.
Position Size:
Define the type and size of positions.
Leverage:
Leverage settings, including margin type and hedge mode.
Session:
Limit trades to specific sessions.
Dates:
Limit trades to a specific date range.
Trades Direction:
Direction: Specify the market direction for opening positions.
VI) Logger
The TradingView.TO commands are logged in the TradingView logger.
You'll find more information about it in this TradingView blog post .
WHY YOU MIGHT NEED THIS TEMPLATE
1) Transform your indicator into a TradingView.TO trading bot more easily than before
Connect your indicator to the template
Create your alerts
Set your EA settings
2) Save Time
Auto-generated alert messages for TradingView.TO.
I tested them all and checked with the support team what could/couldn’t be done.
3) Be in Control
Manage your trading risks with advanced features.
4) Customizable
Fits various trading styles and asset classes.
REQUIREMENTS
* Make sure you have your TradingView.TO account
* If there is any issue with the template, ask me in the comments section - I’ll answer quickly.
BACKTEST RESULTS FROM THIS POST
1) I connected this strategy template to a dummy Supertrend script.
I could have selected any other indicator or concept for this script post.
I wanted to share an example of how you can quickly upgrade your strategy, making it compatible with TradingView.TO.
2) The backtest results aren't relevant for this educational script publication.
I used realistic backtesting data but didn't look too much into optimizing the results, as this isn't the point of why I'm publishing this script.
This strategy is a template to be connected to any indicator - the sky is the limit. :)
3) This template is made to take 1 trade per direction at any given time.
Pyramiding is set to 1 on TradingView.
The strategy default settings are:
* Initial Capital: 100000 USD
* Position Size: 1%
* Commission Percent: 0.075%
* Slippage: 1 tick
* No margin/leverage used

ProfitView Strategy TemplateHello traders,
This script took me a full week of coding/testing, sweat, and tears - and I’m too nice as I’m giving it for free to the community.
If you're tired of manual trading and looking for a solid strategy template to pair with your indicators, look no further.
This Pine Script v5 strategy template is engineered for maximum customization and risk management.
Best part?
This Pine Script v5 template facilitates the dynamic construction of ProfitView alerts, sparing users the time and effort of mastering the ProfitView syntax and manually creating alert commands.
This powerful tool gives much power to those who don't know how to code in Pinescript and want to automate their indicators' signals via the ProfitView Chrome extension.
IMPORTANT NOTES
ProfitView is a trading bot software that forwards TradingView alerts to your brokers (examples: Binance, Oanda, Coinbase, Bybit, etc.) for automating trading.
Many traders don't know how to dynamically create ProfitView-compatible alerts using the data from their TradingView scripts.
Traders using trading bots want their alerts to reflect the stop-loss/take-profit/trailing-stop/stop-loss to break options from your script and then create the orders accordingly.
This script showcases how to create ProfitView alerts dynamically.
TRADINGVIEW ALERTS
1) You'll have to create one alert per asset X timeframe = 1 chart.
Example: 1 alert for EUR/USD on the 5 minutes chart, 1 alert for EUR/USD on the 15-minute chart (assuming you want your bot to trade the EUR/USD on the 5 and 15-minute timeframes)
2) Select the Order fills and alert() function calls condition
3) For each alert, the alert message is pre-configured with the text below
{{strategy.order.alert_message}}
Please leave it as it is.
It's a TradingView native variable that will fetch the alert text messages built by the script.
4) ProfitView doesn't use webhook technology, so setting a webhook URL from the alerts notifications tab is unnecessary.
KEY FEATURES
I) Modular Indicator Connection
* plug your existing indicator into the template.
* Only two lines of code are needed for full compatibility.
Step 1: Create your connector
Adapt your indicator with only 2 lines of code and then connect it to this strategy template.
To do so:
1) Find in your indicator where the conditions print the long/buy and short/sell signals.
2) Create an additional plot as below
I'm giving an example with a Two moving averages cross.
Please replicate the same methodology for your indicator, whether a MACD , ZigZag, Pivots , higher-highs, lower-lows or whatever indicator with clear buy and sell conditions.
//@version=5
indicator("Supertrend", overlay = true, timeframe = "", timeframe_gaps = true)
atrPeriod = input.int(10, "ATR Length", minval = 1)
factor = input.float(3.0, "Factor", minval = 0.01, step = 0.01)
= ta.supertrend(factor, atrPeriod)
supertrend := barstate.isfirst ? na : supertrend
bodyMiddle = plot(barstate.isfirst ? na : (open + close) / 2, display = display.none)
upTrend = plot(direction < 0 ? supertrend : na, "Up Trend", color = color.green, style = plot.style_linebr)
downTrend = plot(direction < 0 ? na : supertrend, "Down Trend", color = color.red, style = plot.style_linebr)
fill(bodyMiddle, upTrend, color.new(color.green, 90), fillgaps = false)
fill(bodyMiddle, downTrend, color.new(color.red, 90), fillgaps = false)
buy = ta.crossunder(direction, 0)
sell = ta.crossunder(direction, 0)
//////// CONNECTOR SECTION ////////
Signal = buy ? 1 : sell ? -1 : 0
plot(Signal, title = "Signal", display = display.data_window)
//////// CONNECTOR SECTION ////////
Important Notes
🔥 The Strategy Template expects the value to be exactly 1 for the bullish signal and -1 for the bearish signal
Now, you can connect your indicator to the Strategy Template using the method below or that one.
Step 2: Connect the connector
1) Add your updated indicator to a TradingView chart
2) Add the Strategy Template as well to the SAME chart
3) Open the Strategy Template settings, and in the Data Source field, select your 🔌Connector🔌 (which comes from your indicator)
Note it doesn’t have to be named 🔌Connector🔌 - you can name it as you want - however, I recommend an explicit name you can easily remember.
From then, you should start seeing the signals and plenty of other stuff on your chart.
🔥 Note that whenever you update your indicator values, the strategy statistics and visuals on your chart will update in real-time
II) BOT Risk Management:
- Max Drawdown:
Mode: Select whether the max drawdown is calculated in percentage (%) or USD.
Value: If the max drawdown reaches this specified value, set a value to halt the bot.
- Max Consecutive Days:
Use Max Consecutive Days BOT Halt: Enable/Disable halting the bot if the max consecutive losing days value is reached.
- Max Consecutive Days: Set the maximum number of consecutive losing days allowed before halting the bot.
- Max Losing Streak:
Use Max Losing Streak: Enable/Disable a feature to prevent the bot from taking too many losses in a row.
- Max Losing Streak Length: Set the maximum length of a losing streak allowed.
Margin Call:
- Use Margin Call: Enable/Disable a feature to exit when a specified percentage away from a margin call to prevent it.
Margin Call (%): Set the percentage value to trigger this feature.
- Close BOT Total Loss:
Use Close BOT Total Loss: Enable/Disable a feature to close all trades and halt the bot if the total loss is reached.
- Total Loss ($): Set the total loss value in USD to trigger this feature.
Intraday BOT Risk Management:
- Intraday Losses:
Use Intraday Losses BOT Halt: Enable/Disable halting the bot on reaching specified intraday losses.
Mode: Select whether the intraday loss is calculated in percentage (%) or USD.
- Max Intraday Losses (%): Set the value for maximum intraday losses.
Limit Intraday Trades:
- Use Limit Intraday Trades: Enable/Disable a feature to limit the number of intraday trades.
- Max Intraday Trades: Set the maximum number of intraday trades allowed.
Restart Intraday EA:
- Use Restart Intraday EA: Enable/Disable a feature to restart the bot at the first bar of the next day if it has been stopped with an intraday risk management safeguard.
III) Order Types and Position Sizing
- Choose between market, limit, or stop orders.
- Set your position size directly in the template.
Please use the position size from the “Inputs” and not the “Properties” tab.
I know it's redundant. - the template needs this value from the "Inputs" tab to build the alerts, and the Backtester needs it from the "Properties" tab.
IV) Advanced Take-Profit and Stop-Loss Options
- Choose to set your SL/TP in either pips or percentages.
- Option for multiple take-profit levels and trailing stop losses.
- Move your stop loss to break even +/- offset in pips for “risk-free” trades.
V) Miscellaneous
Retry order openings if they fail.
Order Types:
Select and specify order type and price settings.
Position Size:
Define the type and size of positions.
Leverage:
Leverage settings, including margin type and hedge mode.
Session:
Limit trades to specific sessions.
Dates:
Limit trades to a specific date range.
Trades Direction:
Direction: Specify the market direction for opening positions.
VI) Notifications (Telegram/Discord/Email/IFTTT/Twilio/SMS)
Customize notifications sent to Telegram, Discord, Email, IFTTT, Twilio, and ProfitView Logger.
VII) Logger
The ProfitView commands are logged in the TradingView logger.
You'll find more information about it in this TradingView blog post .
WHY YOU MIGHT NEED THIS TEMPLATE
1) Transform your indicator into a ProfitView trading bot more easily than before
Connect your indicator to the template
Create your alerts
Set your EA settings
2) Save Time
Auto-generated alert messages for ProfitView.
I tested them all and checked with the support team what could/couldn’t be done.
3) Be in Control
Manage your trading risks with advanced features.
4) Customizable
Fits various trading styles and asset classes.
REQUIREMENTS
* Make sure you have your ProfitView account and do the settings correctly in your Chrome extension. If you don't know how to do it, read the documentation + ask for help in the ProfitView Discord support channel.
* If there is any issue with the template, ask me in the comments section - I’ll answer quickly.
BACKTEST RESULTS FROM THIS POST
1) I connected this strategy template to a dummy Supertrend script.
I could have selected any other indicator or concept for this script post.
I wanted to share an example of how you can quickly upgrade your strategy, making it compatible with ProfitView.
2) The backtest results aren't relevant for this educational script publication.
I used realistic backtesting data but didn't look too much into optimizing the results, as this isn't the point of why I'm publishing this script.
This strategy is a template to be connected to any indicator - the sky is the limit. :)
3) This template is made to take 1 trade per direction at any given time.
Pyramiding is set to 1 on TradingView.
The strategy default settings are:
* Initial Capital: 100000 USD
* Position Size: 1%
* Commission Percent: 0.075%
* Slippage: 1 tick
* No margin/leverage used
Best regards,
Dave

PineUnitPineUnit by Guardian667
A comprehensive testing framework for Pine Script on TradingView. Built with well-known testing paradigms like Assertions, Units and Suites. It offers the ability to log test results in TradingView's built-in Pine Protocol view, as well as displaying them in a compact table directly on your chart, ensuring your scripts are both robust and reliable.
Unit testing Pine Script indicators, libraries, and strategies becomes seamless, ensuring the precision and dependability of your TradingView scripts. Beyond standard function testing based on predefined input values, PineUnit supports series value testing. This means a test can run on every bar, taking into account its specific values. Moreover, you can specify the exact conditions under which a test should execute, allowing for series-based testing only on bars fitting a designated scenario.
Detailed Guide & Source Code
Quick Start
To get started swiftly with PineUnit, follow this minimalistic example.
import Guardian667/PineUnit/1 as PineUnit
var testSession = PineUnit.createTestSession()
var trueTest = testSession.createSimpleTest("True is always True")
trueTest.assertTrue(true)
testSession.report()
After running your script, you'll notice a table on your chart displaying the test results. For a detailed log output, you can also utilize the Pine Protocol view in TradingView.
--------------------------------------------------------------
T E S T S
--------------------------------------------------------------
Running Default Unit
Tests run: 1, Failures: 0, Not executed: 0, Skipped: 0
To further illustrate, let's introduce a test that's destined to fail:
var bullTest = testSession.createSeriesTest("It's allways Bull Market")
bullTest.assertTrue(close > open, "Uhoh... it's not always bullish")
After executing, the test results will reflect this intentional discrepancy:
--------------------------------------------------------------
T E S T S
--------------------------------------------------------------
Running Default Unit
Tests run: 2, Failures: 1, Not executed: 0, Skipped: 0 <<< FAILURE! - in
It's allways Bull Market
Uhoh... it's not always bullish ==> expected: , but was
This shows how PineUnit efficiently captures and reports discrepancies in test expectations.
It's important to recognise the difference between `createSimpleTest()` and `createSeriesTest()`. In contrast to a simple test, a series-based test is executed on each bar, making assertions on series values.
License
This source code is subject to the terms of the Mozilla Public License 2.0 at mozilla.org
@ Guardian667
A Personal Note
As a software developer experienced in OO-based languages, diving into Pine Script is a unique journey. While many aspects of it are smooth and efficient, there are also notable gaps, particularly in the realm of testing. We've all been there: using `plotchar()` for debugging, trying to pinpoint those elusive issues in our scripts. I've come to appreciate the value of writing tests, which often obviates the need for such debugging. My hope is that this Testing Framework serves you well and saves you a significant amount of time, more that I invested into developing this "baby."

Pineconnector Strategy Template (Connect Any Indicator)Hello traders,
If you're tired of manual trading and looking for a solid strategy template to pair with your indicators, look no further.
This Pine Script v5 strategy template is engineered for maximum customization and risk management.
Best part?
It’s optimized for Pineconnector, allowing seamless integration with MetaTrader 4 and 5.
This powerful tool gives a lot of power to those who don't know how to code in Pinescript and are looking to automate their indicators' signals on Metatrader 4/5.
IMPORTANT NOTES
Pineconnector is a trading bot software that forwards TradingView alerts to your Metatrader 4/5 for automating trading.
Many traders don't know how to dynamically create Pineconnector-compatible alerts using the data from their TradingView scripts.
Traders using trading bots want their alerts to reflect the stop-loss/take-profit/trailing-stop/stop-loss to break options from your script and then create the orders accordingly.
This script showcases how to create Pineconnector alerts dynamically.
Pineconnector doesn't support alerts with multiple Take Profits.
As a workaround, for 2 TPs, I had to open two trades.
It's not optimal, as we end up paying more spreads for that extra trade - however, depending on your trading strategy, it may not be a big deal.
TRADINGVIEW ALERTS
1) You'll have to create one alert per asset X timeframe = 1 chart.
Example: 1 alert for EUR/USD on the 5 minutes chart, 1 alert for EUR/USD on the 15-minute chart (assuming you want your bot to trade the EUR/USD on the 5 and 15-minute timeframes)
2) Select the Order fills and alert() function calls condition
3) For each alert, the alert message is pre-configured with the text below
{{strategy.order.alert_message}}
Please leave it as it is.
It's a TradingView native variable that will fetch the alert text messages built by the script.
4) Don't forget to set the Pineconnector webhook URL in the Notifications tab of the TradingView alerts UI.
You’ll find the URL on the Pineconnector documentation website.
EA CONFIGURATION
1) The Pyramiding in the EA on Metatrader must be set to 2 if you want to trade with 2 TPs => as it's opening 2 trades.
If you only want 1 TP, set the EA Pyramiding to 1.
Regarding the other EA settings, please refer to the Pineconnector documentation on their website.
2) In the EA, you can set a risk (= position size type) in %/lots/USD, as in the TradingView backtest settings.
KEY FEATURES
I) Modular Indicator Connection
* plug in your existing indicator into the template.
* Only two lines of code are needed for full compatibility.
Step 1: Create your connector
Adapt your indicator with only 2 lines of code and then connect it to this strategy template.
To do so:
1) Find in your indicator where the conditions print the long/buy and short/sell signals.
2) Create an additional plot as below
I'm giving an example with a Two moving averages cross.
Please replicate the same methodology for your indicator, whether it's a MACD , ZigZag , Pivots , higher-highs, lower-lows, or whatever indicator with clear buy and sell conditions.
//@version=5
indicator("Supertrend", overlay = true, timeframe = "", timeframe_gaps = true)
atrPeriod = input.int(10, "ATR Length", minval = 1)
factor = input.float(3.0, "Factor", minval = 0.01, step = 0.01)
= ta.supertrend(factor, atrPeriod)
supertrend := barstate.isfirst ? na : supertrend
bodyMiddle = plot(barstate.isfirst ? na : (open + close) / 2, display = display.none)
upTrend = plot(direction < 0 ? supertrend : na, "Up Trend", color = color.green, style = plot.style_linebr)
downTrend = plot(direction < 0 ? na : supertrend, "Down Trend", color = color.red, style = plot.style_linebr)
fill(bodyMiddle, upTrend, color.new(color.green, 90), fillgaps = false)
fill(bodyMiddle, downTrend, color.new(color.red, 90), fillgaps = false)
buy = ta.crossunder(direction, 0)
sell = ta.crossunder(direction, 0)
//////// CONNECTOR SECTION ////////
Signal = buy ? 1 : sell ? -1 : 0
plot(Signal, title = "Signal", display = display.data_window)
//////// CONNECTOR SECTION ////////
Important Notes
🔥 The Strategy Template expects the value to be exactly 1 for the bullish signal and -1 for the bearish signal
Now, you can connect your indicator to the Strategy Template using the method below or that one.
Step 2: Connect the connector
1) Add your updated indicator to a TradingView chart
2) Add the Strategy Template as well to the SAME chart
3) Open the Strategy Template settings, and in the Data Source field, select your 🔌Connector🔌 (which comes from your indicator)
Note it doesn’t have to be named 🔌Connector🔌 - you can name it as you want - however, I recommend an explicit name you can easily remember.
From then, you should start seeing the signals and plenty of other stuff on your chart.
🔥 Note that whenever you update your indicator values, the strategy statistics and visuals on your chart will update in real-time
II) Customizable Risk Management
- Choose between percentage or USD modes for maximum drawdown.
- Set max consecutive losing days and max losing streak length.
- I used the code from my friend @JosKodify for the maximum losing streak. :)
Will halt the EA and backtest orders fill whenever either of the safeguards above are “broken”
III) Intraday Risk Management
- Limit the maximum intraday losses both in percentage or USD.
- Option to set a maximum number of intraday trades.
- If your EA gets halted on an intraday chart, auto-restart it the next day.
IV) Spread and Account Filters
- Trade only if the spread is below a certain pip value.
- Set requirements based on account balance or equity.
V) Order Types and Position Sizing
- Choose between market, limit, or stop orders.
- Set your position size directly in the template.
Please use the position size from the “Inputs” and not the “Properties” tab.
Reason : The template sends the order on the same candle as the entry signals - at those entry signals candles, the position size isn’t computed yet, and the template can’t then send it to Pineconnector.
However, you can use the position size type (USD, contracts, %) from the “Properties” tab for backtesting.
In the EA, you can define the position size type for your orders in USD or lots or %.
VI) Advanced Take-Profit and Stop-Loss Options
- Choose to set your SL/TP in either pips or percentages.
- Option for multiple take-profit levels and trailing stop losses.
- Move your stop loss to break even +/- offset in pips for “risk-free” trades.
VII) Logger
The Pineconnector commands are logged in the TradingView logger.
You'll find more information about it in this TradingView blog post .
WHY YOU MIGHT NEED THIS TEMPLATE
1) Transform your indicator into a Pineconnector trading bot more easily than before
Connect your indicator to the template
Create your alerts
Set your EA settings
2) Save Time
Auto-generated alert messages for Pineconnector.
I tested them all, and I checked with the support team what could/can’t be done
3) Be in Control
Manage your trading risks with advanced features.
4) Customizable
Fits various trading styles and asset classes.
REQUIREMENTS
* Make sure you have your Pineconnector license ID.
* Create your alerts with the Pineconnector webhook URL
* If there is any issue with the template, ask me in the comments section - I’ll answer quickly.
BACKTEST RESULTS FROM THIS POST
1) I connected this strategy template to a dummy Supertrend script.
I could have selected any other indicator or concept for this script post.
I wanted to share an example of how you can quickly upgrade your strategy, making it compatible with Pineconnector.
2) The backtest results aren't relevant for this educational script publication.
I used realistic backtesting data but didn't look too much into optimizing the results, as this isn't the point of why I'm publishing this script.
This strategy is a template to be connected to any indicator - the sky is the limit. :)
3) This template is made to take 1 trade per direction at any given time.
Pyramiding is set to 1 on TradingView.
The strategy default settings are:
* Initial Capital: 100000 USD
* Position Size: 1 contract
* Commission Percent: 0.075%
* Slippage: 1 tick
* No margin/leverage used
WHAT’S COMING NEXT FOR YOU GUYS?
I’ll make the same template for ProfitView, then for AutoView, and then for Alertatron.
All of those are free and open-source.
I have no affiliations with any of those companies - I'm publishing those templates as they will be useful to many of you.
Dave

Heatmap MACD Strategy - Pineconnector (Dynamic Alerts)Hello traders
This script is an upgrade of this template script.
Heatmap MACD Strategy
Pineconnector
Pineconnector is a trading bot software that forwards TradingView alerts to your Metatrader 4/5 for automating trading.
Many traders don't know how to dynamically create Pineconnector-compatible alerts using the data from their TradingView scripts.
Traders using trading bots want their alerts to reflect the stop-loss/take-profit/trailing-stop/stop-loss to breakeven options from your script and then create the orders accordingly.
This script showcases how to create Pineconnector alerts dynamically.
Pineconnector doesn't support alerts with multiple Take Profits.
As a workaround, for 2 TPs, I had to open two trades.
It's not optimal, as we end up paying more spreads for that extra trade - however, depending on your trading strategy, it may not be a big deal.
TradingView Alerts
1) You'll have to create one alert per asset X timeframe = 1 chart.
Example : 1 alert for EUR/USD on the 5 minutes chart, 1 alert for EUR/USD on the 15-minute chart (assuming you want your bot to trade the EUR/USD on the 5 and 15-minute timeframes)
2) For each alert, the alert message is pre-configured with the text below
{{strategy.order.alert_message}}
Please leave it as it is.
It's a TradingView native variable that will fetch the alert text messages built by the script.
3) Don't forget to set the webhook URL in the Notifications tab of the TradingView alerts UI.
EA configuration
The Pyramiding in the EA on Metatrader must be set to 2 if you want to trade with 2 TPs => as it's opening 2 trades.
If you only want 1 TP, set the EA Pyramiding to 1.
Regarding the other EA settings, please refer to the Pineconnector documentation on their website.
Logger
The Pineconnector commands are logged in the TradingView logger.
You'll find more information about it from this TradingView blog post
Important Notes
1) This multiple MACDs strategy doesn't matter much.
I could have selected any other indicator or concept for this script post.
I wanted to share an example of how you can quickly upgrade your strategy, making it compatible with Pineconnector.
2) The backtest results aren't relevant for this educational script publication.
I used realistic backtesting data but didn't look too much into optimizing the results, as this isn't the point of why I'm publishing this script.
3) This template is made to take 1 trade per direction at any given time.
Pyramiding is set to 1 on TradingView.
The strategy default settings are:
Initial Capital: 100000 USD
Position Size: 1 contract
Commission Percent: 0.075%
Slippage: 1 tick
No margin/leverage used
For example, those are realistic settings for trading CFD indices with low timeframes but not the best possible settings for all assets/timeframes.
Concept
The Heatmap MACD Strategy allows selecting one MACD in five different timeframes.
You'll get an exit signal whenever one of the 5 MACDs changes direction.
Then, the strategy re-enters whenever all the MACDs are in the same direction again.
It takes:
long trades when all the 5 MACD histograms are bullish
short trades when all the 5 MACD histograms are bearish
You can select the same timeframe multiple times if you don't need five timeframes.
For example, if you only need the 30min, the 1H, and 2H, you can set your timeframes as follow:
30m
30m
30m
1H
2H
Risk Management Features
All the features below are pips-based.
Stop-Loss
Trailing Stop-Loss
Stop-Loss to Breakeven after a certain amount of pips has been reached
Take Profit 1st level and closing X% of the trade
Take Profit 2nd level and close the remaining of the trade
Custom Exit
I added the option ON/OFF to close the opened trade whenever one of the MACD diverges with the others.
Help me help the community
If you see any issue when adding your strategy logic to that template regarding the orders fills on your Metatrader, please let me know in the comments.
I'll use your feedback to make this template more robust. :)
What's next?
I'll publish a more generic template built as a connector so you can connect any indicator to that Pineconnector template.
Then, I'll publish a template for Capitalise AI, ProfitView, AutoView, and Alertatron.
Thank you
Dave

HTF Oscillators RSI/ROC/MFI/CCI/AO - Dynamic SmoothingThe Interplay of Time Frames: A Balanced View
Navigating the markets often involves interpreting trends from multiple angles. The HTF Oscillators with Dynamic Smoothing indicator enables you to do just that. This tool provides the option to integrate smoothed oscillator readings from Higher Time Frames (HTF) into lower time frame charts, such as a 1-minute chart. By doing so, the indicator offers a balanced viewpoint that bridges the gap between micro and macro perspectives, helping you make informed decisions without losing sight of the broader market context.
Features
Multi-Oscillator Support
Choose from a range of popular oscillators like the Relative Strength Index (RSI), Rate of Change (ROC), Money Flow Index (MFI), Commodity Channel Index (CCI), and Awesome Oscillator (AO). These oscillators are commonly used as foundational building blocks in trading strategy scripts by traders worldwide. Switch effortlessly between them, depending on your trading strategy and requirements. To maintain consistency and a familiar user experience, our script adopts the same visual aesthetics that you'll find in Pine Script indicators on TradingView: a sleek purple line for the oscillator and a transparent band filling. These visual elements are not only pleasing to the eye but also widely appreciated by the trading community.
Dynamic Smoothing
The unique dynamic smoothing feature calculates a smoothing factor based on the ratio of minutes between the Higher Time Frame (HTF) and your current time frame. This provides a sleek and responsive oscillator line that still holds the weight of the longer trend. One of the significant advantages of this feature is user experience; when you change your time frame, the HTF-values in your settings will remain consistent. This ensures that you can easily switch between different time frames without losing the insights provided by your selected HTF.
Visual Aids
Visual cues are an essential part of any trading strategy. The indicator not only plots signals to mark overbought and oversold conditions based on the dynamically smoothed oscillator but also provides you with the flexibility to customize your visual experience. You have the option to toggle on/off the display of these signals depending on your specific needs. Additionally, bands can be displayed at overbought and oversold levels, along with a reference middle line. If you switch between different oscillators (available in the parameter settings), remember to manually adjust the bands in the input settings to ensure signals matches with the type of oscillator to your liking.
User-Friendly Settings
We've grouped related settings together, making it easier for you to find what you're looking for. Adjust the oscillator type, length of bars, smoothing settings, and more with just a few clicks.
Information Table
A standout feature of this indicator is the real-time information table, which displays the values of all selected oscillators based on your specified Higher Time Frame (HTF) settings. This can be particularly useful for traders who depend on multiple indicators for their decision-making process. The data presented in the table is synchronized with the HTF options you've configured in the input settings, allowing for a more efficient and quick scan of values from higher time frames.
Educational Corner: The Power of the Information Table and Customization
The table incorporated into this indicator isn't just eye-candy; it's a practical tool designed to elevate your trading strategy. It dynamically displays real-time values of various oscillators for the HTF you've chosen. This is an exemplary use of TradingView's scripting capabilities to blend multiple indicators into a single visual panel, streamlining your analysis and decision-making process.
But here's the best part: You're not limited to what we've created. With some basic understanding of TradingView's scripting language, Pine Script, you can easily adapt this table to include different indicators that suit your unique trading style. The logic in the script is modular and can serve as a foundation for your own customized trading dashboard. So, go ahead, get creative and explore new combinations of indicators that will help you excel in your trading endeavors!
You no longer have to toggle between different charts or indicators to get the information you need; it's all there in one neatly organized table. We encourage you to tap into this feature and make it your own, empowering your trading like never before.
By doing so, you not only gain a more comprehensive toolset, but you also engage more deeply with your trading strategy, understanding its nuances and, ultimately, making more informed decisions.
Conclusion
The HTF Oscillators with Dynamic Smoothing is a versatile and powerful tool that brings together the best of both worlds: the perspective of higher time frames and the granularity of shorter ones. Its feature-rich setting options and real-time information table make it a potential useful addition to your trading toolkit.
Remember, while this indicator offers a comprehensive and smarter way to look at the markets, it is not a foolproof method for predicting market movements. Always use it in conjunction with other analysis methods and risk management strategies.
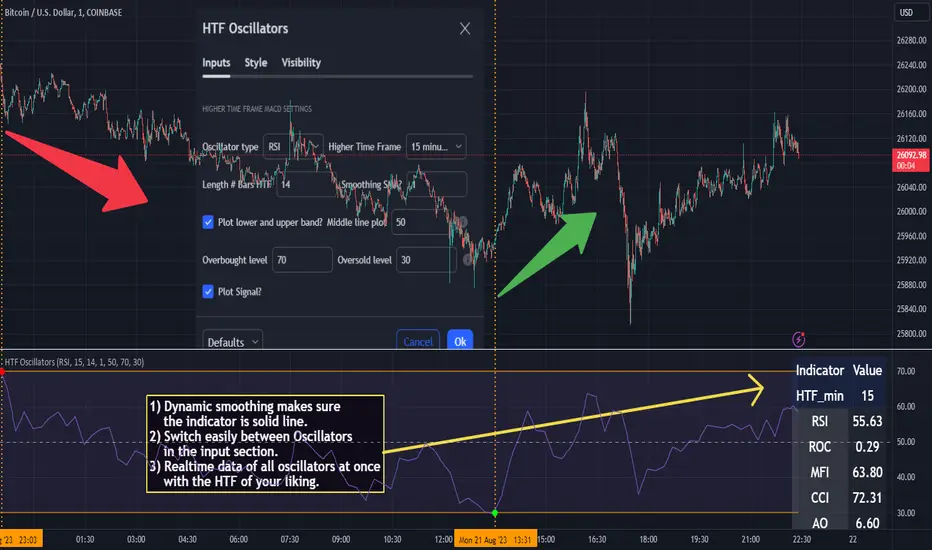
ATR+ Advanced Sessions ATR for DaterangeATR+ Advanced Sessions ATR for Daterange
The ATR+ adds the following additional filters to the stock ATR indicator by Tradingview:
- Calculates the overall average ATR for a user defined daterange, optionally filtered by trading session and selected weekdays, presented as a secondary line over the standard ATR line.
- Basic ATR line, with colour highlight to indicate the selected sessions, days and timeframe being calculated by the average ATR+ line.
- Average ATR+ line indicating the average of all ATRs within the defined timeframe, optionally filtered by instances of a selected trading session and selected weekdays.
- Customisable appearance.
- The ATR+ also includes the basic ATR configuration options typically found in the standard ATR by Tradingview, including period length and smoothing type. Defaults are set to the factory standards: 14 length, RMA smoothing type.
What Is the Average True Range (ATR)?
The ATR is a technical analysis tool that measures market volatility by decomposing the entire range asset price for that period. Investopedia describes the ATR as follows:
"The average true range (ATR) is a technical analysis indicator, introduced by market technician J. Welles Wilder Jr. in his book New Concepts in Technical Trading Systems, that measures market volatility by decomposing the entire range of an asset price for that period.
The true range indicator is taken as the greatest of the following: current high less the current low; the absolute value of the current high less the previous close; and the absolute value of the current low less the previous close. The ATR is then a moving average, generally using 14 days, of the true ranges."
For more information on the ATR and its calculations and use cases, see here:
Investopedia link here.
Tradingview link here.
Note
The indicator may time out if the number of bars being calculated is too long. If this happens, you will need to reduce the datetime range, or increase the chart timeframe in order to reduce the number of bars being calculated and the indicator will attempt to recalculate.
