Divergence for Many [Dimkud - v5]Strategy is based on "Divergence for Many Indicators v4 ST" strategy by CannyTolany01
which is based on "Divergence for Many Indicator" indicator by LonesomeTheBlue
This strategy is searching for divergences on 18 indicators which you can select and optimise one by one.
Additionally you can connect any other External Indicator value. (just add this indicator the the chart and select option in settings)
To the original indicator/strategy I have added 9 additional indicators:
( Money Flow Index, Williams_Vix, Stochastic RSI , SMI Ergodic Oscillator, Volume Weighted MACD , Bull Bear Power, Balance of Power , Relative Volatility Index , Logistic Settings).
Converted strategy to v5 of Pine Script.
Added Static SL/TP in percents (%).
Added filters to filter enters:
1. Volume Weighted MACD - Multi-TimeFrame Filter
(It checks for histogram to falling or rising for a set periods of bars)
2. Money Flow Index - Multi-TimeFrame Filter
(It checks if MFI Oscillator is in the set diapason.
Also It checks if MFI is falling or rising for a set periods of bars )
3. ATR filter
(check changes in fast ATR to slow ATR )
Strategy shows good backtest results on many crypto tokens on 45m - 1h periods. (with parameters optimisation for every indicator)
To find best parameters - you can enable indicators one-by one, and optimise best parameters for each of them.
Then enable all indicators with successful results.
Optimise SL/TP.
Then try to enable and optimise filters (channels etc.)
The better is to optimise parameters separately for Short and Long trading. And run two separate bots (in settings enable only Long or only Short.)
Updates:
- Added visualisation for open trades (SL/TP)
- Added Volatility filter by ATR with many options for tests.
- Fixed some small bugs.
- Added second RSI filter (you can use two RSIs with different TF or settings)
- Updated ATR volatility and MFI filter. Removed non-effective options
- Added CCI filter
- Added option to Enable/Disable visualisation of TP/SL on chart
- Fixed one small quick bug. ("ATR filter short" was not working)
- Added Super Trend filter
- Added Momentum filter
- Added Volume Filter
- All "request.security" MultiTimeFrame calls changed to 100% non-repait function "f_security()"
Wyszukaj w skryptach "tp"

Strategy Multiple Orders + Statistics Template - EducationalHello traders
It's been a while
We're back in a bear market so I have a bit more time to publish new Pine scripts for the TradingView community
Special thanks to @fikira for his Multiple Orders script () and to @carnagecain for allowing me to publish this script we worked together on
I got widely inspired by @fikira's script for that one
This script is for educational purposes only - I wanted to show how we can add multiple TPs/SL + a table with custom statistics
In this Strategy template, users can define multiple take-profit and multiple stop-loss levels.
Basically, we have 4 trades per trend and each trade has its own SL/TP
Statistics
Stats are split per trade direction (Long, Short) and then consolidated
I put custom stats in that table such as:
- Probability of Win
- Probability of Loss
- Avg Profit/Loss per Trade
- APPT: (Probability of Win * Average Gross Profit) - (Probability of Loss * Average Loss)
- Number of times each TP/SL has been hit
I'm catching up with all recent pinescript features as we speak - more educational scripts template to come soon
Best Regards
Dave

Cipher B divergencies for Crypto (Finandy support)Hello Traders!
In times of high volatility, it is important to follow a market-neutral strategy to protect your hard-earned assets. The simple script employs common buy/sell and/or divergencies signals from the VuManChu Cipher B indicator with fixed stop losses and takes profits. The signals are filtered by a local trend of a coin of interest and the global trend of Bitcoin. These trends-filtered signals demonstrated better performance on most of the back- and forward- tests for USDT cryptocurrency futures. The strategy is based on my real experience, it's a diamond I want to share with you.
In terms of visualization if the background is red and the price is below the yellow line then only a short position can be opened. Conversely, if the price is above the yellow line AND the background is green only a long position can be opened.
Inputs from VuManChu you can find on the top. Frankly, I do not know how they can help you to improve the performance of the strategy. My inputs of the script you can find in "Trend Settings" and "TP/SL Settings" at the bottom.
The checkbox "Only divergencies" lets to broadcast only more reliable buy/sell signals for a cost of rare deals.
The checkbox "Cancel all positions if price crosses local sma?" makes additional trailing stop loss. Usually, this function increases the win rate by "smoothing" the risk/reward ratio, as a usual stop loss does.
You can tune SL/TP based on backtesting.
To connect the script to Finandy just edit "name" and "secret" to connect your webhook (see the bottom of the script).
The rule of thumb for the strategy is "only divergencies" - ON, high reward/risk (TP/SL) ratio, 5 min timeframe on chart help with performance.
Finally, I am looking forward to feedback from you. If you have some cool features for my script in your mind, do not hesitate to leave them in the comments.
Good luck!

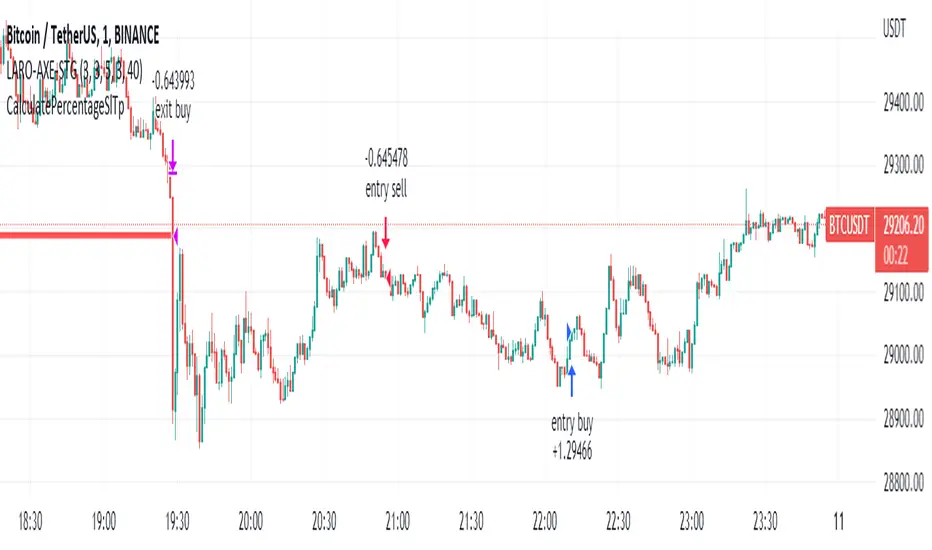
CalculatePercentageSlTpLibrary "CalculatePercentageSlTp"
This Library calculate the sl and tp amount in percentage
sl_percentage(entry_price, sl_price)
this function calculates the sl value in percentage
Parameters:
entry_price : indicates the entry level
sl_price : indicates the stop loss level
Returns: stop loss in percentage
tp_percentage(entry_price, tp_price)
this function calculates the tp value in percentage
Parameters:
entry_price : indicates the entry level
tp_price : indicates the take profit level
Returns: take profit in percentage
sl_level(entry_price, sl_percentage)
this function calculates the sl level price
Parameters:
entry_price : indicates the entry level
sl_percentage : indicates the stop loss percentage
Returns: stop loss price in $
tp_level(entry_price, tp_percentage)
this function calculates the tp level price
Parameters:
entry_price : indicates the entry level
tp_percentage : indicates the take profit percentage
Returns: take profit price in $
FX Profit CalculatorWith this indicator, you will be able to see how much you earn in forex in dollar terms.
It asks you 3 things when adding the indicator.
TP point
SL point
Position Entry point
If you have selected the TP point above, the entry zone below it, and the SL point below it, the indicator will automatically understand that there is a BUY order and will make the calculations accordingly.
The same is true for the opposite.
When you use the indicator in any parity, you will have problems switching to other parities.
So either use it only in one parity, or update your targets from the indicator settings at every parity change.
You will get the same error if:
Your trading entry point should be between your TP and SL points. If you do not set it this way, the indicator will warn that please fix it.
If you are in the trade, tick the settings and show the dollar-based profit of your position according to the instant closing price.
The percentage variable works like this:
When you adjust for one parity, shifts occur in the chart when you switch to the other parity. When switching to non-circulating graphics at the same prices, the user is prompted to re-enter so that the graphic does not deteriorate.
BONUS : You can move these lines up and down with your mouse on the graphic :)

Gap Absorption StrategyLike the nature, markets don't like the void, and this is something we can take advantage of by trading gaps on some markets.
This technique is well known, so I wanted to write a tiny script based on this strategy to get a bit more comfortable with it.
IMPORTANT: Default parameters wont give you good trades on every markets, you need to modify these parameters to see which proportions correspond to the stock you're trading.
This script triggers signals on predefined variation of a stock price after a gap, and allows its user to configure TP and SL prices corresponding to a specific percentage of this gap movement.
Note: We can observe that opening gaps are often the most interesting.
Options
Trigger: the price variation you want to trigger on (in % of the price)
Stop Loss : in % of the gap
Take profit : in % of the gap
A small table is displayed in the top right corner of the chart to give you TP/SL/Signal prices for each opportunity
SL (red line) and TP (green line) are also displayed on the chart when a signal is triggered
Information concerning the current opportunity is given at the bottom of the chart
Note: This script is based on the Gap-Size-Indicator that I published a few weeks ago.

Lot Size by doclribeiroThis script calculate which values should LOT, SL and TP be to trade the pair selected on TM
By default SL and TP are calculated using ATR: timeframe 1H for SL and timeframe 15min for TP.The user can also specify the SL and also the TP, or the amount of pipets to calculate SL or TP.
Kind Regrads
Miguel Campos

Zendog V3 backtest DCA bot 3commasMAJOR UPDATE:
- Update to Pinescript v5
- MAJOR refactor for the logic of how orders are placed. BO order is placed when the condition is first encountered and we are not in a deal.
The extra SO orders (if based on price movement) are all placed on the next candle after BO order, instead of each being placed one after another.
Take profit (if percentage) and Stop loss are placed on the first candle after BO order because if BO and TP are on the same candle TV does not execute properly.
These changes should improve strategy accuracy when multiple prices are hit by the same candle.
- NEW FEATURE: Support to Stop deal using an external indicator (i.e. stop long deal when RSI > 80)
- NEW FEATURE: Support to trigger Safety orders using an external indicator (i.e. trigger each additional SO when RSI < 10, regardless of price movement)
The price movement logic may be implemented in the indicator that plots start / end signals. The SO size is calculated using the configuration of steps.
- NEW FEATURE: Safety order command for 3commas bot. This is implemented using Add funds in the quote currency (for pair BTCUSDT the quote currency is USDT)
The SO size is calculated using the configuration of steps, for exact order size (and price) use the built-in Steps table.
- NEW FEATURE: Addition of extra columns to the steps table: Required price for TP, Required % change for TP, Required % change for BEP (Breakeven point)
- Update to steps table to remove prices when Safety orders are not based on % price change
- The code is opensource. I will not be able to sustain merges for the script, but feel free to use and develop your own version and ping me on discord to review them
and maybe include in the original script

Bagheri IG Ether v2In this version, the winning ratio has been decreased, but the Risk to Reward Ratio (RRR) has been set to be better than the previous version.
This is a technical trading strategy for Ethereum ( BINANCE:ETHUSDT ). We built and developed it on MetaEditor and optimized it with MetaTrader optimizer.
The main indicators are Donchian Channel, Oscillator of ROC , Bears Power, Balance of Power , and Simple Moving Average ( SMA ). Default values in the input panel are the best combination of these indicators, but you can change any of them and try it for better results.
Please notice that this strategy has been optimized on the 1-minute chart of Ethereum .
For each position, you can see the Take Profit (TP) and Stop Loss (SL) levels. Also, you can find the values of mentioned TP and SL in points from the input panel of the script.
Attention: The price of Ethereum has 2 decimal places.
Therefore, 3000 points for TP means 30 USDT for trading 1 BINANCE:ETHUSDT .

Bagheri IG EtherThis is a technical trading strategy for Ethereum ( BINANCE:ETHUSDT ). We built and developed it on MetaEditor and optimized it with MetaTrader optimizer.
The main indicators are Donchian Channel, Oscillator of ROC, Bears Power, Balance of Power, and Simple Moving Average (SMA). Default values in the input panel are the best combination of these indicators, but you can change any of them and try it for better results.
Please notice that this strategy has been optimized on the 1-minute chart of Ethereum.
For each position, you can see the Take Profit (TP) and Stop Loss (SL) levels. Also, you can find the values of mentioned TP and SL in points from the input panel of the script.
Attention: The price of Ethereum has 2 decimal places.
Therefore, 3000 points for TP means 30 USDT for trading 1 BINANCE:ETHUSDT .

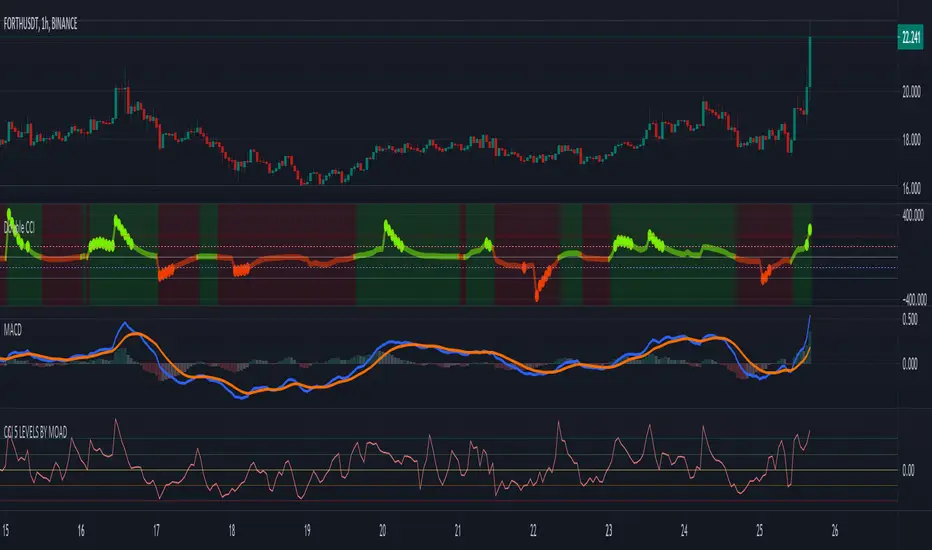
CCI 5 LEVELS BY MOADThe Commodity Channel Index ( CCI ) is a momentum oscillator used in technical analysis primarily to identify overbought and oversold levels by measuring an instrument's variations away from its statistical mean. Besides overbought/oversold levels, CCI is often used to find reversals as well as divergences. Originally, the indicator was designed to be used for identifying trends in commodities , however it is now used in a wide range of financial instruments.
There are several steps involved in calculating the CCI . The following example is for a typical 14 Period CCI:
CCI = (Typical Price - 14 Period SMA of TP) / (.015 x Mean Deviation)
Typical Price (TP) = (High + Low + Close)/3
Constant = .015
The Constant is set at .015 for scaling purposes. By including the constant, the majority of CCI values will fall within the 100 to -100 range.
Mean Deviation:
1) Subtract the most recent 14 Period Simple Moving from each typical price (TP) for the Period.
2) Sum these numbers strictly using absolute values.
3) Divide the value generated in step 2 by the total number of Periods (14 in this case).
Overbought and Oversold conditions can be used in their more traditional sense to identify future reversals. Remember true overbought/oversold thresholds values can and often do vary between instruments.
During a Bullish Trend, price crossing above the overbought threshold may indicate strong confidence in the move and price will continue to rise.
During a Bearish Trend, price crossing below the oversold threshold may indicate strong confidence in the move and price will continue to fall.
The first option is a modified CCI indicator that uses the "Arnaud Legoux Moving Average" instead of the SMA , and the source uses the VWAP instead of the HLC3. Added to this version an option to calculate CCI with different types of moving averages:
Green dots mean they are overbought
Orange dots mean they are oversold
Added a "SuperTrend Background" based on the modified CCI indicator:
Bull event = CCI crossing over the 0 line
Bear event = CCI crossing below the 0 line
Added a signal as EMA (modified CCI , signal length)
The second option is a standard CCI indicator that shows a coloured histogram of important levels, giving a good visual of the CCI levels. Added to this version is an extra coloured level +/-200 and an option to use Traditional CCI calculations according to user @JustUncleL
LEVELS:
Aqua: Greater than 200.
Lavender: Greater than 100 and less than 200.
Dark Lavender: Greater than 0 and less than 100.
Dark Coral: Less than 0 and greater than -100.
Coral: Less than -100 and greater than -200.
Light Red: Less than -200.
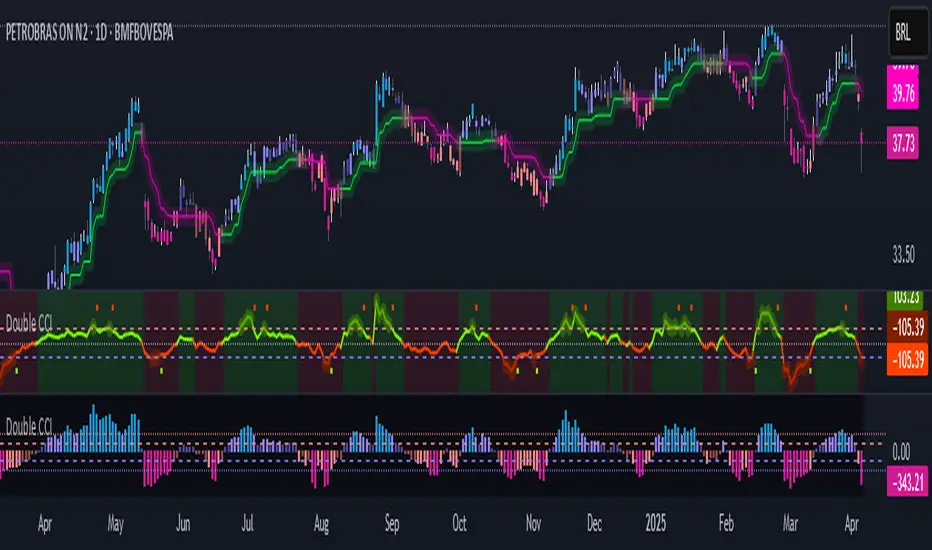
Double CCIThe Commodity Channel Index (CCI) is a momentum oscillator used in technical analysis primarily to identify overbought and oversold levels by measuring an instrument's variations away from its statistical mean. Besides overbought/oversold levels, CCI is often used to find reversals as well as divergences. Originally, the indicator was designed to be used for identifying trends in commodities, however it is now used in a wide range of financial instruments.
There are several steps involved in calculating the CCI. The following example is for a typical 14 Period CCI:
CCI = (Typical Price - 14 Period SMA of TP) / (.015 x Mean Deviation)
Typical Price (TP) = (High + Low + Close)/3
Constant = .015
The Constant is set at .015 for scaling purposes. By including the constant, the majority of CCI values will fall within the 100 to -100 range.
Mean Deviation:
1) Subtract the most recent 14 Period Simple Moving from each typical price (TP) for the Period.
2) Sum these numbers strictly using absolute values.
3) Divide the value generated in step 2 by the total number of Periods (14 in this case).
Overbought and Oversold conditions can be used in their more traditional sense to identify future reversals . Remember true overbought/oversold thresholds values can and often do vary between instruments.
During a Bullish Trend , price crossing above the overbought threshold may indicate strong confidence in the move and price will continue to rise.
During a Bearish Trend , price crossing below the oversold threshold may indicate strong confidence in the move and price will continue to fall.
The first option is a modified CCI indicator that uses the "Arnaud Legoux Moving Average" instead of the SMA, and the source uses the VWAP instead of the HLC3. Added to this version an option to calculate CCI with different types of moving averages:
Green dots mean they are overbought
Orange dots mean they are oversold
Added a "SuperTrend Background" based on the modified CCI indicator:
Bull event = CCI crossing over the 0 line
Bear event = CCI crossing below the 0 line
Added a signal as EMA (modified CCI, signal length)
The second option is a standard CCI indicator that shows a coloured histogram of important levels, giving a good visual of the CCI levels. Added to this version is an extra coloured level +/-200 and an option to use Traditional CCI calculations according to user @JustUncleL
LEVELS:
Aqua: Greater than 200.
Lavender: Greater than 100 and less than 200.
Dark Lavender: Greater than 0 and less than 100.
Dark Coral: Less than 0 and greater than -100.
Coral: Less than -100 and greater than -200.
Light Red: Less than -200.
money managementthis indicator has been designed to make your calculations easier and faster.
you can use this indicator to set tp and sl prices based on your entry price, balance,risk and leverage.
it has been designed only for cryptocurrency market and it is not recommended to use it in other markets!
1- enter your balance in the setting of the indicator.
2- enter risk percentage of your balance.
3- enter your sl percentage.
4- enter your tp percentage.
5- set your leverage if you are trading in futures market.
6- and at last set your entry price.
your position size both in spot market and futures market and the exact price of tp and sl , will be shown top right of the screen.
caution: before using this indicator in real market, please make sure that you understand this indicator's behavior and test it.
--------------------------------------------------------------------
این اندیکاتور برای تسریع محاسبات مدیریت سرمایه و سهولت رعایت آن طراحی شده است.
شما میتوانید با وارد کردن پارامترهاقیمت ورودی، سرمایه کل، ریسک و اهرم، قیمت حد سود و ضرر خود را محاسبه کنید.
همچنین اندازه حجم معاملات شما توسط این اندیکاتور محاسبه خواهد شد.
این اندیکاتور برای بازار کریپتوکارنسی طراحی شده است و استفاده از آن در سایر بازارها پیشنهاد نمیشود.
از بخش تنظیمات اندیکاتورمراحل زیر را انجام دهید:
1- میزان سرمایه خود را در قسمت بالانس وارد کنید
2- میزان ریسک سرمایه در هر معامله را مشخص کنید (به درصد)
3- میزان حد ضرر خود را مشخص کنید (به درصد)
4- میزان حد سود خود را مشخص کنید (به درصد)
5- عدد اهرم خود را وارد کنید
6- قیمت ورود به معامله را وارد کنید
توجه: قبل از استفاده این اندیکاتور در بازار لایو لطفا آن را تست کنید و از کارکرد صحیح آن با مدیریت سرمایه خود اطمینان حاصل فرمایید.

[fareid] Quick Backtest Framework█ OVERVIEW
This Framework allows Pine Coders to quickly code Study() based signal/strategy and validate its viability before proceed to code with more advance/complex customized rules for entry, exit, trailstop, risk management etc..
This is somewhat an upgraded version of my earlier personal template with different strategy used, cleaner code
and additional features.
█ USE CASES
- You have an idea for trade signal and need a quick way to verify its potential before writing lengthy/complicated code
- You found a study script for trading signal in public library and want to validate it profitability with minimum effort before including it in your trading playbook
█ FEATURES
- Alert: Ready to use alert function based on signals from your custom indicator.
- Visual Backtest: Auto-plot entry, stop-loss and take profit for simple strategy performance analysis
- Backtest Statistic: Provide basic key metrics based on backtest strategy
- BTE External Signal Protocol: Ready to use code that will supply required state to PineCoders Backtesting & Trading Engine if you wish to have more advance and sophisticated backtesting engine
Notes: All of the above features have On/Off toggle
█ Description & How To Use
This Framework consist of 5 Modules but you only need to edit the first 2 Modules:
Module1: Indicator
Module2: Framework Input Protocol
Module3: Alert
Module4: Backtest
Module5: Backtest & Trading Engine
Tips: The source-code includes collapsible block by module for easy navigating
Module1: Indicator:
-----------------------------------------------------------------------------------
Main Module. Place custom indicator input parameter/calculation/indicator plotting here
Sample Strategy: Double MACD Crossover
MACD Signal: 1st MACD Cross above signal line indicate Buy Signal
1st MACD Cross below signal line indicate Sell Signal
MACD Filter: 2nd MACD is above 0 line indicate Uptrend
2nd MACD is below 0 line indicate Downtrend
Module2: Framework Input Protocol:
-----------------------------------------------------------------------------------
Use this module to connect main indicator/signal calculated in Module1 to the rest of the framework's module
4 variables needed to be defined here:
1. Uptrend
2. Dntrend
3. BuySignal
4. SellSignal
i'm not sure how to place a code snippet here to show you example so in the source code i already put a comment in Module2 on which part u need to edit. I hope its pretty simple to use.
Module3: Alert Module Description:
-----------------------------------------------------------------------------------
As long as the variables in Module2 properly defined, the alert module is ready to use without any further modification.
Input:
Enable Alert --> Enable TV's alert and plot signal to chart
Alert Type --> Set to take Buy only, Sell only or Both alert
Module4: Backtest Module Description:
-----------------------------------------------------------------------------------
As long as the variables in Module2 properly defined, the backtest module is ready to use without any further modification.
Input:
Backtest Stat --> Enable Backtest Statistic Label
Backtest Visual --> Enable Backtest visual simulation
Backtest Type --> Set to take Buy only or Sell only or both
SL Type -->
ATR : Set SL in ATR times Multiplier below entry price
Fixed : Set SL in fixed point below entry point (in 'Dollar'). e.g. for Stocks -> 0.5 equals to 50cent while for EURUSD currency -> 0.005 equal to 50 pips
HiLo Bar: Set SL at highest/lowest wick of previous bar plus/minus Fixed point. e.g. EURUSD HiLo=3 and Fixed Point = 0.0005, buy trade will place SL 5 Pips below lowest of previous 3 bar
SL ATR Multi --> Set Lookback Period used for SL's ATR calculation
SL ATR Multi --> Set ATR Multiplier for SL
SL Fixed --> Set Fixed Level for SL
SL Bar --> Set Number of previous bar to check for SL placement
TP RR Ratio --> Set TP based on RR multiplier. e.g. 2 means TP level will be twice further from entry point compared to Entry-SL distance.
Notes: The point is for preliminary testing, so it only supports 1 trade at a time and no Trailing Stop
Module5: Backtest & Trading Engine Description:
-----------------------------------------------------------------------------------
As long as the variables in Module2 properly defined, the Pinecoders BTE module is ready to use without any further modification.
Input:
External Signal Protocol --> Set ESP State to send to "Backtesting & Trading Engine "
Signal With Filter --> Use this to send entry signal that already filtered by this study indicator (without stoploss level)
Signal Without Filter --> Use this to send raw entry signal that are NOT YET FILTERED by this study indicator (without stoploss level)
Signal and Stop With Filter --> Use this to send entry signal WITH StopLoss that already filtered by this study indicator (with stoploss level)
Signal and Stop Without Filter --> Use this to send raw entry signal WITH StopLoss that are NOT YET FILTERED by this study indicator (with stoploss level)
Notes: Backtesting & Trading Engine already have built-in Filter, Entries and Stop Level. e.g. Unselect all their filter state if only want to use custom filter and make sure send Signal with Filter (with or without SL level)
█ DISCLAIMER:
This framework main objective is to create my personal indicator template so that i just have to modify the indicator module for preliminary testing in future.
The sample strategy included are for educational purpose only. Use at your own risk
credit: LucF/PineCoders for a lot of his scripts that i use as a guide to complete this

MACD With Trend Filter: Visual Backtest Module TemplateSample Strategy: MACD Crossover with trend filter options
MA Filter : Price Close Above MA, Search for Buy, Price Close Below MA, Search for Sell
ADX Filter : Take trade only when ADX is above certain treshold
MACD Signal : MACD Cross above signal line while under 0 line indicate Buy Signal
MACD Cross below signal line while above 0 line indicate Sell Signal
-----------------------------
Using Alert Module:
Enable Alert --> Enable TV's alert and plot signal to chart
Alert Type --> Set to take Buy only, Sell only or Both alert
----------------------------
Using Backtest Module:
Enable Backtest --> Enable Backtest simulation
Backtest Type --> Set to take Buy only, Sell only or Both
SL Type -->
ATR : Set SL in ATR times Multiplier below/above entry price
Fixed : Set SL in fixed point below entry point (in 'Dollar'). e.g. for Stocks -> 0.5 equals to 50cent while for EURUSD currency -> 0.005 equal to 50 pips
HiLo Bar : Set SL at highest/lowest wick of previous bar plus/minus Fixed point. e.g. EURUSD HiLo=3 and Fixed Point = 0.0005, buy trade will place SL 5 Pips below lowest of previous 3 bar
SL ATR Period --> Set Lookback Period used for SL's ATR calculation
SL ATR Multi --> Set ATR Multiplier for SL
SL Fixed --> Set Fixed Level for SL (Use when SL Type is either Fixed or HiLo Bar)
SL Bar --> Set Number of previous bar to check for SL placement
TP RR Ratio --> Set TP based on RR multiplier. e.g. 2 means TP level will be twice further from entry point compared to Entry-SL distance.
Notes: The point is for preliminary testing, so it only supports 1 trade at a time and no Trailing Stop
----------------------------
Disclaimer:
This script main objective is to create my personal indicator template so that i just have to modify the indicator module for preliminary testing in future.
Testing Alert Module so i can re-use it as template in future study/indicator
Testing Visual Backtest Module so i can re-use it as template in future study/indicator
i believe using Strategy function is a better approach for this but the entry/exit level seems to be hit n miss (at least for me, still trying to figure what i did wrong)
also, i rather code the strategy in other platform where i can use the more accurate tick data if i want to validate backtest statistics.
My study scripts was built only to test/visualize an idea to see its viability and if it can be used to optimize existing strategy.
credit: ADX code are originally from "ADX and DI" by @BeikabuOyaji although i re-wrote so i can have cleaner read and use RMA instead of SMA

Stepped trailing strategy exampleThis is a stepped trailing exit example for educational purpose .
Short brief.
There are 1 stop loss and 3 profit levels.
When first tp is reached we move stop loss to break-even.
When second tp is reached we move stop loss to first tp.
When third tp is reached we exit by profit.

Position Size CalculatorThis is a script to make calculating position size easier. It calculates position size as a percentage of account balance and Risk/Reward based on input values of entry, exit, stoploss and shows the R/R box similar to tradingview's R/R tool. There is an option to toggle showing label and choosing of label text color.
Have to enter the following inputs in order for it to work properly
1. Account Balance : Account balance in either whatever is base currency of account
2. Risk % : Percentage of account balance to lose if stop is hit.
3. Entry
4. Stoploss
5. Target Price
Notes:
- Target Price is required for calculating R/R but is not necessary to calculate position size.
- Formula to calculate position size is : Balance * Risk % / SL %
- Formula to calculate R/R is : TP % / SL %
- SL % = ( Entry - SL ) / Entry * 100
- TP % = (TP - Entry ) / Entry * 100
Thanks to u/Chonky_ for help with feedback.

Point and Figure (PnF) CCIThis is live and non-repainting Point and Figure Chart Commodity Channel Index - CCI tool. The script has it’s own P&F engine and not using integrated function of Trading View.
Point and Figure method is over 150 years old. It consist of columns that represent filtered price movements. Time is not a factor on P&F chart but as you can see with this script P&F chart created on time chart.
P&F chart provide several advantages, some of them are filtering insignificant price movements and noise, focusing on important price movements and making support/resistance levels much easier to identify.
Commodity Channel Index – CCI was developed by Donalt Lambert. CCI can be used to identify overbought or oversold, a new trend or warn of extreme conditions. CCI measures the difference between a security's price change and its average price change. High positive readings indicate that prices are well above their average, which is a show of strength. Low negative readings indicate that prices are well below their average, which is a show of weakness.
The Formula for the Commodity Channel Index ( CCI ) Is:
CCI = (Typical Price – L-period SMA of TP) / (0.015 * Mean Deviation)
Mean Deviation = (SumOf 1->L ( |TP – MA| )) / L
L = Length
TP = Typical Price
If you are new to Point & Figure Chart then you better get some information about it before using this tool. There are very good web sites and books. Please PM me if you need help about resources.
Options in the Script
Box size is one of the most important part of Point and Figure Charting. Chart price movement sensitivity is determined by the Point and Figure scale. Large box sizes see little movement across a specific price region, small box sizes see greater price movement on P&F chart. There are four different box scaling with this tool: Traditional, Percentage, Dynamic (ATR), or User-Defined
4 different methods for Box size can be used in this tool.
User Defined: The box size is set by user. A larger box size will result in more filtered price movements and fewer reversals. A smaller box size will result in less filtered price movements and more reversals.
ATR: Box size is dynamically calculated by using ATR, default period is 20.
Percentage: uses box sizes that are a fixed percentage of the stock's price. If percentage is 1 and stock’s price is $100 then box size will be $1
Traditional: uses a predefined table of price ranges to determine what the box size should be.
Price Range Box Size
Under 0.25 0.0625
0.25 to 1.00 0.125
1.00 to 5.00 0.25
5.00 to 20.00 0.50
20.00 to 100 1.0
100 to 200 2.0
200 to 500 4.0
500 to 1000 5.0
1000 to 25000 50.0
25000 and up 500.0
Default value is “ATR”, you may use one of these scaling method that suits your trading strategy.
If ATR or Percentage is chosen then there is rounding algorithm according to mintick value of the security. For example if mintick value is 0.001 and box size (ATR/Percentage) is 0.00124 then box size becomes 0.001.
And also while using dynamic box size (ATR or Percentage), box size changes only when closing price changed.
Reversal : It is the number of boxes required to change from a column of Xs to a column of Os or from a column of Os to a column of Xs. Default value is 3 (most used). For example if you choose reversal = 2 then you get the chart similar to Renko chart.
Source: Closing price or High-Low prices can be chosen as data source for P&F charting.
Upper Band : as default, Upper band is 100
Lower Band : as default, Lower band is -100
There are alerts when P&F CCI moves above Upper Band or moves below Lower Band.

Bollinger MTFSo this is a Bollinger resistance and support map, I just convert it to v4 and add info for current upper and lower levels
The length is 60 (instead of regular 20) and we make it to be MTF
Ok , so how this system work
we choose TF and I normaly use 3x or 4X of the MTF (you can choose your own)
then we need to decide if we want to long or short
if we go long then the buy point will be the lower value and TP will be TP in green -
If we go short then our entry value will be upper and TP (take profit) will be in red
so one can put few tweeks and make this system to be more automatic , but I just show this as a easy concept for trade system
the main issue in such system is properly to decide when to go short or when to go long
that why you need to add other indicators in order to make this call and make this system effective

Smart MACD Crossover█ OVERVIEW
Smart MACD Crossover is an indicator designed for traders who trade based on MACD line crossovers. It significantly reduces the number of false crossover signals by adding a breakout-box confirmation mechanism. Price must close outside the box created at the moment of the MACD crossover for a signal to trigger. The script also includes optional scaled MACD lines on the price chart, candle coloring, multi-layer “fog” visualization, fully customizable entry signals, automatic Take Profit / Stop Loss levels and a real-time table.
█ CONCEPTS
Standard MACD crossovers frequently produce noise, especially in ranging markets. Smart MACD Crossover attempts to solve this issue: a horizontal box is drawn at the exact bar where the crossover occurs, and a trade signal is generated only when price actually breaks out of that box. By default, the show_only_matching filter is enabled — signals are shown only when the breakout direction matches the original MACD crossover direction (bullish box → long only, bearish box → short only).
█ FEATURES
Fully configurable classic MACD (default 12/26/9)
Optional MACD & Signal lines scaled and plotted directly on the price chart (show_macd_overlay)
Trend-based candle coloring
One-Side Histogram Fog:
- 6 layers above and 6 layers below hl2
- layer height based on average candle size × offset_mult (default 0.7)
- increasing transparency (base 80 + increment 4) for depth effect
- fully customizable colors
Breakout Boxes:
- created on every MACD crossover
- default height = high-low of the signal candle
- optional extension using average candle size × box_multiplier
- semi-transparent fill (85) with colored borders, extended right until breakout
Signals:
- Triangles or “BUY” / “SELL” labels
- show_only_matching filter (enabled by default) — only direction-consistent breakouts generate signals
- when disabled, every box breakout generates a signal according to breakout direction
- Built-in alerts: BUY and SELL
Take Profit / Stop Loss:
- TP1, TP2, TP3 and SL levels drawn automatically after each confirmed signal
- two modes: Candle Multiplier (based on average candle size) or Percentage
- all multipliers/percentages fully adjustable in “Risk Management Settings”
- real-time table in the top-right corner showing current TP/SL prices
█ HOW TO USE
Add via Pine Editor → paste code → Add to Chart.
Settings overview:
- MACD Settings: lengths and source
- Risk Management Settings: TP/SL mode, multipliers/percentages, average candle period
- MACD Overlay Lines: toggle scaled MACD lines on price chart
- Fog: enable/disable, adjust height and transparency
- Visual Settings: candle coloring
- Boxes: optional size multiplier (use_box_multiplier)
- Signals: choose Triangles or Labels, enable/disable direction filter
Signal meaning:
- Triangle below bar / “BUY” label → upward breakout from a box created after bullish MACD crossover
- Triangle above bar / “SELL” label → downward breakout from a box created after bearish MACD crossover
- Open boxes = pending breakout zones
- Fog below price = bullish pressure, fog above price = bearish pressure
█ APPLICATIONS
The indicator reduces false signals coming from plain MACD crossovers. For additional trend confirmation, the scaled MACD lines can be enabled.
Entry into a position is triggered by the BUY/SELL signal generated after the breakout. The TP1–TP3 and SL levels are drawn automatically only for convenience and as a quick reference – they are fully optional and traders can (and usually should) use their own preferred exit strategies, trailing stops, partial closes, or other money-management methods.
█ NOTES
- Due to MACD line scaling onto the price chart, classic MACD divergences cannot be identified

CRT + SMC MY//@version=5
indicator("CRT + SMC MultiTF (Fixed Requests)", overlay=true, max_labels_count=500, max_boxes_count=200)
// ---------------- INPUTS ----------------
htfTF = input.string("60", title="HTF timeframe (60=1H, 240=4H)")
midTF = input.string("5", title="Mid timeframe (5 or 15)")
execTF = input.string("1", title="Exec timeframe (1 for sniper)")
useMAfilter = input.bool(true, "Require HTF MA filter")
htf_ma_len = input.int(50, "HTF MA length")
showOB = input.bool(true, "Show Order Blocks (midTF)")
showFVG = input.bool(true, "Show Fair Value Gaps (execTF)")
showEntries = input.bool(true, "Show Entry arrows & SL/TP")
slBuffer = input.int(3, "SL buffer (ticks)")
rrTarget = input.float(4.0, "Default R:R target")
useKillzone = input.bool(false, "Use London/NY Killzone (approx NY-5 timezone)")
// ---------------- REQUESTS (ALL at top-level) ----------------
// HTF series
htf_open = request.security(syminfo.tickerid, htfTF, open)
htf_high = request.security(syminfo.tickerid, htfTF, high)
htf_low = request.security(syminfo.tickerid, htfTF, low)
htf_close = request.security(syminfo.tickerid, htfTF, close)
htf_ma = request.security(syminfo.tickerid, htfTF, ta.sma(close, htf_ma_len))
htf_prev_high = request.security(syminfo.tickerid, htfTF, high )
htf_prev_low = request.security(syminfo.tickerid, htfTF, low )
// midTF series for OB detection
mid_open = request.security(syminfo.tickerid, midTF, open)
mid_high = request.security(syminfo.tickerid, midTF, high)
mid_low = request.security(syminfo.tickerid, midTF, low)
mid_close = request.security(syminfo.tickerid, midTF, close)
mid_median_body = request.security(syminfo.tickerid, midTF, ta.median(math.abs(close - open), 8))
// execTF series for FVG and micro structure
exec_high = request.security(syminfo.tickerid, execTF, high)
exec_low = request.security(syminfo.tickerid, execTF, low)
exec_open = request.security(syminfo.tickerid, execTF, open)
exec_close = request.security(syminfo.tickerid, execTF, close)
// Also get shifted values needed for heuristics (all top-level)
exec_high_1 = request.security(syminfo.tickerid, execTF, high )
exec_high_2 = request.security(syminfo.tickerid, execTF, high )
exec_low_1 = request.security(syminfo.tickerid, execTF, low )
exec_low_2 = request.security(syminfo.tickerid, execTF, low )
mid_low_1 = request.security(syminfo.tickerid, midTF, low )
mid_high_1 = request.security(syminfo.tickerid, midTF, high )
// ---------------- HTF logic ----------------
htf_ma_bias_long = htf_close > htf_ma
htf_ma_bias_short = htf_close < htf_ma
htf_sweep_high = (htf_high > htf_prev_high) and (htf_close < htf_prev_high)
htf_sweep_low = (htf_low < htf_prev_low) and (htf_close > htf_prev_low)
htf_final_long = htf_sweep_low and (not useMAfilter or htf_ma_bias_long)
htf_final_short = htf_sweep_high and (not useMAfilter or htf_ma_bias_short)
// HTF label (single label updated)
var label htf_label = na
if barstate.islast
label.delete(htf_label)
if htf_final_long
htf_label := label.new(bar_index, high, "HTF BIAS: LONG", style=label.style_label_left, color=color.green, textcolor=color.white)
else if htf_final_short
htf_label := label.new(bar_index, low, "HTF BIAS: SHORT", style=label.style_label_left, color=color.red, textcolor=color.white)
// ---------------- midTF OB detection (heuristic) ----------------
mid_body = math.abs(mid_close - mid_open)
is_bear_mid = (mid_open > mid_close) and (mid_body >= mid_median_body)
is_bull_mid = (mid_open < mid_close) and (mid_body >= mid_median_body)
mid_bear_disp = is_bear_mid and (mid_low < mid_low_1)
mid_bull_disp = is_bull_mid and (mid_high > mid_high_1)
// Store last OB values (safe top-level assignments)
var float last_bear_ob_top = na
var float last_bear_ob_bot = na
var int last_bear_ob_time = na
var float last_bull_ob_top = na
var float last_bull_ob_bot = na
var int last_bull_ob_time = na
if mid_bear_disp
last_bear_ob_top := mid_open
last_bear_ob_bot := mid_close
last_bear_ob_time := timenow
if mid_bull_disp
last_bull_ob_top := mid_close
last_bull_ob_bot := mid_open
last_bull_ob_time := timenow
// Draw OB boxes (draw always but can be toggled)
if showOB
if not na(last_bear_ob_top)
box.new(bar_index - 1, last_bear_ob_top, bar_index + 1, last_bear_ob_bot, border_color=color.new(color.red,0), bgcolor=color.new(color.red,85))
if not na(last_bull_ob_top)
box.new(bar_index - 1, last_bull_ob_top, bar_index + 1, last_bull_ob_bot, border_color=color.new(color.green,0), bgcolor=color.new(color.green,85))
// ---------------- execTF FVG detection (top-level logic) ----------------
// simple 3-candle gap heuristic
bull_fvg_local = exec_low_2 > exec_high_1
bear_fvg_local = exec_high_2 < exec_low_1
// Compute FVG box coords at top-level
fvg_bull_top = exec_high_1
fvg_bull_bot = exec_low_2
fvg_bear_top = exec_high_2
fvg_bear_bot = exec_low_1
if showFVG
if bull_fvg_local
box.new(bar_index - 2, fvg_bull_top, bar_index, fvg_bull_bot, border_color=color.new(color.green,0), bgcolor=color.new(color.green,85))
if bear_fvg_local
box.new(bar_index - 2, fvg_bear_top, bar_index, fvg_bear_bot, border_color=color.new(color.red,0), bgcolor=color.new(color.red,85))
// ---------------- micro structure on execTF ----------------
micro_high = exec_high
micro_low = exec_low
micro_high_1 = exec_high_1
micro_low_1 = exec_low_1
micro_bos_long = micro_high > micro_high_1
micro_bos_short = micro_low < micro_low_1
// ---------------- killzone check (top-level) ----------------
kill_ok = true
if useKillzone
hh = hour(time('GMT-5'))
mm = minute(time('GMT-5'))
// London approx
inLondon = (hh > 2 or (hh == 2 and mm >= 45)) and (hh < 5 or (hh == 5 and mm <= 0))
inNY = (hh > 8 or (hh == 8 and mm >= 20)) and (hh < 11 or (hh == 11 and mm <= 30))
kill_ok := inLondon or inNY
// ---------------- Entry logic (top-level boolean decisions) ----------------
hasBullOB = not na(last_bull_ob_top)
hasBearOB = not na(last_bear_ob_top)
entryLong = htf_final_long and hasBullOB and micro_bos_long and bull_fvg_local and kill_ok
entryShort = htf_final_short and hasBearOB and micro_bos_short and bear_fvg_local and kill_ok
// ---------------- SL / TP suggestions and plotting ----------------
var label lastEntryLabel = na
if entryLong or entryShort
entryPrice = close
suggestedSL = entryLong ? (htf_low - slBuffer * syminfo.mintick) : (htf_high + slBuffer * syminfo.mintick)
slDist = math.abs(entryPrice - suggestedSL)
suggestedTP = entryLong ? (entryPrice + slDist * rrTarget) : (entryPrice - slDist * rrTarget)
if showEntries
label.delete(lastEntryLabel)
lastEntryLabel := label.new(bar_index, entryPrice, entryLong ? "ENTRY LONG" : "ENTRY SHORT", style=label.style_label_center, color=entryLong ? color.green : color.red, textcolor=color.white)
line.new(bar_index, suggestedSL, bar_index + 20, suggestedSL, color=color.orange, style=line.style_dashed)
line.new(bar_index, suggestedTP, bar_index + 40, suggestedTP, color=color.aqua, style=line.style_dashed)
plotshape(entryLong, title="Entry Long", location=location.belowbar, color=color.green, style=shape.triangleup, size=size.small)
plotshape(entryShort, title="Entry Short", location=location.abovebar, color=color.red, style=shape.triangledown, size=size.small)
alertcondition(entryLong, title="CRT SMC Entry Long", message="Entry Long — HTF bias + midTF OB + execTF confirmation")
alertcondition(entryShort, title="CRT SMC Entry Short", message="Entry Short — HTF bias + midTF OB + execTF confirmation")

Superior-Range Bound Renko - Strategy - 11-29-25 - SignalLynxSuperior-Range Bound Renko Strategy with Advanced Risk Management Template
Signal Lynx | Free Scripts supporting Automation for the Night-Shift Nation 🌙
1. Overview
Welcome to Superior-Range Bound Renko (RBR) — a volatility-aware, structure-respecting swing-trading system built on top of a full Risk Management (RM) Template from Signal Lynx.
Instead of relying on static lookbacks (like “14-period RSI”) or plain MA crosses, Superior RBR:
Adapts its range definition to market volatility in real time
Emulates Renko Bricks on a standard, time-based chart (no Renko chart type required)
Uses a stack of Laguerre Filters to detect genuine impulse vs. noise
Adds an Adaptive SuperTrend powered by a small k-means-style clustering routine on volatility
Under the hood, this script also includes the full Signal Lynx Risk Management Engine:
A state machine that separates “Signal” from “Execution”
Layered exit tools: Stop Loss, Trailing Stop, Staged Take Profit, Advanced Adaptive Trailing Stop (AATS), and an RSI-style stop (RSIS)
Designed for non-repainting behavior on closed candles by basing execution-critical logic on previous-bar data
We are publishing this as an open-source template so traders and developers can leverage a professional-grade RM engine while integrating their own signal logic if they wish.
2. Quick Action Guide (TL;DR)
Best Timeframe:
4 Hours (H4) and above. This is a high-conviction swing-trading system, not a scalper.
Best Assets:
Volatile instruments that still respect market structure:
Bitcoin, Ethereum, Gold (XAUUSD), high-volatility Forex pairs (e.g., GBPJPY), indices with clean ranges.
Strategy Type:
Volatility-Adaptive Trend Following + Impulse Detection.
It hunts for genuine expansion out of ranges, not tiny mean-reversion nibbles.
Key Feature:
Renko Emulation on time-based candles.
We mathematically model Renko Bricks and overlay them on your standard chart to define:
“Equilibrium” zones (inside the brick structure)
“Breakout / impulse” zones (when price AND the impulse line depart from the bricks)
Repainting:
Designed to be non-repainting on closed candles.
All RM execution logic uses confirmed historical data (no future bars, no security() lookahead). Intrabar flicker during formation is allowed, but once a bar closes the engine’s decisions are stable.
Core Toggles & Filters:
Enable Longs and Shorts independently
Optional Weekend filter (block trades on Saturday/Sunday)
Per-module toggles: Stop Loss, Trailing Stop, Staged Take Profits, AATS, RSIS
3. Detailed Report: How It Works
A. The Strategy Logic: Superior RBR
Superior RBR builds its entry signal from multiple mathematical layers working together.
1) Adaptive Lookback (Volatility Normalization)
Instead of a fixed 100-bar or 200-bar range, the script:
Computes ATR-based volatility over a user-defined period.
Normalizes that volatility relative to its recent min/max.
Maps the normalized value into a dynamic lookback window between a minimum and maximum (e.g., 4 to 100 bars).
High Volatility:
The lookback shrinks, so the system reacts faster to explosive moves.
Low Volatility:
The lookback expands, so the system sees a “bigger picture” and filters out chop.
All the core “Range High/Low” and “Range Close High/Low” boundaries are built on top of this adaptive window.
2) Range Construction & Quick Ranges
The engine constructs several nested ranges:
Outer Range:
rangeHighFinal – dynamic highest high
rangeLowFinal – dynamic lowest low
Inner Close Range:
rangeCloseHighFinal – highest close
rangeCloseLowFinal – lowest close
Quick Ranges:
“Half-length” variants of those, used to detect more responsive changes in structure and volatility.
These ranges define:
The macro box price is trading inside
Shorter-term “pressure zones” where price is coiling before expansion
3) Renko Emulation (The Bricks)
Rather than using the Renko chart type (which discards time), this script emulates Renko behavior on your normal candles:
A “brick size” is defined either:
As a standard percentage move, or
As a volatility-driven (ATR) brick, optionally inhibited by a minimum standard size
The engine tracks a base value and derives:
brickUpper – top of the emulated brick
brickLower – bottom of the emulated brick
When price moves sufficiently beyond those levels, the brick “shifts”, and the directional memory (renkoDir) updates:
renkoDir = +2 when bricks are advancing upward
renkoDir = -2 when bricks are stepping downward
You can think of this as a synthetic Renko tape overlaid on time-based candles:
Inside the brick: equilibrium / consolidation
Breaking away from the brick: momentum / expansion
4) Impulse Tracking with Laguerre Filters
The script uses multiple Laguerre Filters to smooth price and brick-derived data without traditional lag.
Key filters include:
LagF_1 / LagF_W: Based on brick upper/lower baselines
LagF_Q: Based on HLCC4 (high + low + 2×close)/4
LagF_Y / LagF_P: Complex averages combining brick structures and range averages
LagF_V (Primary Impulse Line):
A smooth, high-level impulse line derived from a blend of the above plus the outer ranges
Conceptually:
When the impulse line pushes away from the brick structure and continues in one direction, an impulse move is underway.
When its direction flips and begins to roll over, the impulse is fading, hinting at mean reversion back into the range.
5) Fib-Based Structure & Swaps
The system also layers in Fib levels derived from the adaptive ranges:
Standard levels (12%, 23.6%, 38.2%, 50%, 61%, 76.8%, 88%) from the main range
A secondary “swap” set derived from close-range dynamics (fib12Swap, fib23Swap, etc.)
These Fibs are used to:
Bucket price into structural zones (below 12, between 23–38, etc.)
Detect breakouts when price and Laguerre move beyond key Fib thresholds
Drive zSwap logic (where a secondary Fib set becomes the active structure once certain conditions are met)
6) Adaptive SuperTrend with K-Means-Style Volatility Clustering
Under the hood, the script uses a small k-means-style clustering routine on ATR:
ATR is measured over a fixed period
The range of ATR values is split into Low, Medium, High volatility centroids
Current ATR is assigned to the nearest centroid (cluster)
From that, a SuperTrend variant (STK) is computed with dynamic sensitivity:
In quiet markets, SuperTrend can afford to be tighter
In wild markets, it widens appropriately to avoid constant whipsaw
This SuperTrend-based oscillator (LagF_K and its signals) is then combined with the brick and Laguerre stack to confirm valid trend regimes.
7) Final Baseline Signals (+2 / -2)
The “brain” of Superior RBR lives in the Baseline & Signal Generation block:
Two composite signals are built: B1 and B2:
They combine:
Fib breakouts
Renko direction (renkoDir)
Expansion direction (expansionQuickDir)
Multiple Laguerre alignments (LagF_Q, LagF_W, LagF_Y, LagF_Z, LagF_P, LagF_V)
They also factor in whether Fib structures are expanding or contracting.
A user toggle selects the “Baseline” signal:
finalSig = B2 (default) or B1 (alternate baseline)
finalSig is then filtered through the RM state machine and only when everything aligns, we emit:
+2 = Long / Buy signal
-2 = Short / Sell signal
0 = No new trade
Those +2 / -2 values are what feed the Risk Management Engine.
B. The Risk Management (RM) Engine
This script features the Signal Lynx Risk Management Engine, a proprietary state machine built to separate Signal from Execution.
Instead of firing orders directly on indicator conditions, we:
Convert the raw signal into a clean integer (Fin = +2 / -2 / 0)
Feed it into a Trade State Machine that understands:
Are we flat?
Are we in a long or short?
Are we in a closing sequence?
Should we permit re-entry now or wait?
Logic Injection / Template Concept:
The RM engine expects a simple integer:
+2 → Buy
-2 → Sell
Everything else (0) is “no new trade”
This makes the script a template:
You can remove the Superior RBR block
Drop in your own logic (RSI, MACD, price action, etc.)
As long as you output +2 or -2 into the same signal channel, the RM engine can drive all exits and state transitions.
Aggressive vs Conservative Modes:
The input AgressiveRM (Aggressive RM) governs how we interpret signals:
Conservative Mode (Aggressive RM = false):
Uses a more filtered internal signal (AF) to open trades
Effectively waits for a clean trend flip / confirmation before new entries
Minimizes whipsaw at the cost of fewer trades
Aggressive Mode (Aggressive RM = true):
Reacts directly to the fresh alert (AO) pulses
Allows faster re-entries in the same direction after RM-based exits
Still respects your pyramiding setting; this script ships with pyramiding = 0 by default, so it will not stack multiple positions unless you change that parameter in the strategy() call.
The state machine enforces discipline on top of your signal logic, reducing double-fires and signal spam.
C. Advanced Exit Protocols (Layered Defense)
The exit side is where this template really shines. Instead of a single “take profit or stop loss,” it uses multiple, cooperating layers.
1) Hard Stop Loss
A classic percentage-based Stop Loss (SL) relative to the entry price.
Acts as a final “catastrophic protection” layer for unexpected moves.
2) Standard Trailing Stop
A percentage-based Trailing Stop (TS) that:
Activates only after price has moved a certain percentage in your favor (tsActivation)
Then trails price by a configurable percentage (ts)
This is a straightforward, battle-tested trailing mechanism.
3) Staged Take Profits (Three Levels)
The script supports three staged Take Profit levels (TP1, TP2, TP3):
Each stage has:
Activation percentage (how far price must move in your favor)
Trailing amount for that stage
Position percentage to close
Example setup:
TP1:
Activate at +10%
Trailing 5%
Close 10% of the position
TP2:
Activate at +20%
Trailing 10%
Close another 10%
TP3:
Activate at +30%
Trailing 5%
Close the remaining 80% (“runner”)
You can tailor these quantities for partial scaling out vs. letting a core position ride.
4) Advanced Adaptive Trailing Stop (AATS)
AATS is a sophisticated volatility- and structure-aware stop:
Uses Hirashima Sugita style levels (HSRS) to model “floors” and “ceilings” of price:
Dungeon → Lower floors → Mid → Upper floors → Penthouse
These levels classify where current price sits within a long-term distribution.
Combines HSRS with Bollinger-style envelopes and EMAs to determine:
Is price extended far into the upper structure?
Is it compressed near the lower ranges?
From this, it computes an adaptive factor that controls how tight or loose the trailing level (aATS / bATS) should be:
High Volatility / Penthouse areas:
Stop loosens to avoid getting wicked out by inevitable spikes.
Low Volatility / compressed structure:
Stop tightens to lock in and protect profit.
AATS is designed to be the “smart last line” that responds to context instead of a single fixed percentage.
5) RSI-Style Stop (RSIS)
On top of AATS, the script includes a RSI-like regime filter:
A McGinley Dynamic mean of price plus ATR bands creates a dynamic channel.
Crosses above the top band and below the lower band change a directional state.
When enabled (UseRSIS):
RSIS can confirm or veto AATS closes:
For longs: A shift to bearish RSIS can force exits sooner.
For shorts: A shift to bullish RSIS can do the same.
This extra layer helps avoid over-reactive stops in strong trends while still respecting a regime change when it happens.
D. Repainting Protection
Many strategies look incredible in the Strategy Tester but fail in live trading because they rely on intrabar values or future-knowledge functions.
This template is built with closed-candle realism in mind:
The Risk Management logic explicitly uses previous bar data (open , high , low , close ) for the key decisions on:
Trailing stop updates
TP triggers
SL hits
RM state transitions
No security() lookahead or future-bar access is used.
This means:
Backtest behavior is designed to match what you can actually get with TradingView alerts and live automation.
Signals may “flicker” intrabar while the candle is forming (as with any strategy), but on closed candles, the RM decisions are stable and non-repainting.
4. For Developers & Modders
We strongly encourage you to mod this script.
To plug your own strategy into the RM engine:
Look for the section titled:
// BASELINE & SIGNAL GENERATION
You will see composite logic building B1 and B2, and then selecting:
baseSig = B2
altSig = B1
finalSig = sigSwap ? baseSig : altSig
You can replace the content used to generate baseSig / altSig with your own logic, for example:
RSI crosses
MACD histogram flips
Candle pattern detectors
External condition flags
Requirements are simple:
Your final logic must output:
2 → Buy signal
-2 → Sell signal
0 → No new trade
That output flows into the RM engine via finalSig → AlertOpen → state machine → Fin.
Once you wire your signals into finalSig, the entire Risk Management system (Stops, TPs, AATS, RSIS, re-entry logic, weekend filters, long/short toggles) becomes available for your custom strategy without re-inventing the wheel.
This makes Superior RBR not just a strategy, but a reference architecture for serious Pine dev work.
5. About Signal Lynx
Automation for the Night-Shift Nation 🌙
Signal Lynx focuses on helping traders and developers bridge the gap between indicator logic and real-world automation. The same RM engine you see here powers multiple internal systems and templates, including other public scripts like the Super-AO Strategy with Advanced Risk Management.
We provide this code open source under the Mozilla Public License 2.0 (MPL-2.0) to:
Demonstrate how Adaptive Logic and structured Risk Management can outperform static, one-layer indicators
Give Pine Script users a battle-tested RM backbone they can reuse, remix, and extend
If you are looking to automate your TradingView strategies, route signals to exchanges, or simply want safer, smarter strategy structures, please keep Signal Lynx in your search.
License: Mozilla Public License 2.0 (Open Source).
If you make beneficial modifications, please consider releasing them back to the community so everyone can benefit.

new_youtube_strategy//@version=5
strategy("Dow + Homma 1m Scalper (15m filter)", overlay=true, margin_long=100, margin_short=100, initial_capital=10000)
//===== INPUTS =====
maLen = input.int(50, "Trend SMA Length", minval=5)
htf_tf = input.timeframe("15", "Higher TF")
priceTolPct = input.float(0.05, "SR tolerance %", step=0.01)
wickFactor = input.float(2.0, "Hammer/ShootingStar wick factor", step=0.1)
dojiThresh = input.float(0.1, "Doji body % of range", step=0.01)
risk_RR = input.float(2.0, "Reward:Risk", step=0.1)
capitalRiskPct = input.float(1.0, "Risk % of equity per trade", step=0.1)
//===== 1m TREND (SMA) =====
sma1 = ta.sma(close, maLen)
sma1Up = sma1 > sma1
sma1Down = sma1 < sma1
uptrend1 = close > sma1 and sma1Up
downtrend1 = close < sma1 and sma1Down
//===== 15m TREND VIA request.security =====
sma15 = request.security(syminfo.tickerid, htf_tf, ta.sma(close, maLen), lookahead=barmerge.lookahead_off)
sma15Up = sma15 > sma15
sma15Down = sma15 < sma15
uptrend15 = close > sma15 and sma15Up
downtrend15 = close < sma15 and sma15Down
//===== SWING HIGHS/LOWS (LOCAL EXTREMA) =====
var int left = 3
var int right = 3
swHigh = ta.pivothigh(high, left, right)
swLow = ta.pivotlow(low, left, right)
//===== SR FLIP LEVELS =====
var float srSupport = na
var float srResistance = na
// when a swing high is broken -> new support
if not na(swHigh)
if close > swHigh
srSupport := swHigh
// when a swing low is broken -> new resistance
if not na(swLow)
if close < swLow
srResistance := swLow
//===== CANDLE METRICS =====
body = math.abs(close - open)
cRange = high - low
upperW = high - math.max(open, close)
lowerW = math.min(open, close) - low
isBull() => close > open
isBear() => close < open
bullHammer() =>
cRange > 0 and
isBull() and
lowerW >= wickFactor * body and
upperW <= body
bearShootingStar() =>
cRange > 0 and
isBear() and
upperW >= wickFactor * body and
lowerW <= body
isDoji() =>
cRange > 0 and body <= dojiThresh * cRange
bullEngulfing() =>
isBear() and isBull() and
open <= close and close >= open
bearEngulfing() =>
isBull() and isBear() and
open >= close and close <= open
//===== SR PROXIMITY =====
tol = priceTolPct * 0.01 * close
nearSupport = not na(srSupport) and math.abs(close - srSupport) <= tol
nearResistance = not na(srResistance) and math.abs(close - srResistance) <= tol
//===== SIGNAL CONDITIONS =====
bullCandle = bullHammer() or isDoji() or bullEngulfing()
bearCandle = bearShootingStar() or isDoji() or bearEngulfing()
longTrendOK = uptrend1 and uptrend15
shortTrendOK = downtrend1 and downtrend15
longSignal = longTrendOK and nearSupport and bullCandle
shortSignal = shortTrendOK and nearResistance and bearCandle
//===== POSITION SIZING (IN RISK UNITS) =====
var float lastEquity = strategy.equity
riskCapital = strategy.equity * (capitalRiskPct * 0.01)
//===== ENTRY / EXIT PRICES =====
longStop = math.min(low, nz(srSupport, low))
longRisk = close - longStop
longTP = close + risk_RR * longRisk
shortStop = math.max(high, nz(srResistance, high))
shortRisk = shortStop - close
shortTP = close - risk_RR * shortRisk
// qty in contracts (approx; assumes price * qty ≈ capital used)
longQty = longRisk > 0 ? riskCapital / longRisk : 0.0
shortQty = shortRisk > 0 ? riskCapital / shortRisk : 0.0
//===== EXECUTION =====
if longSignal and longRisk > 0 and longQty > 0
strategy.entry("Long", strategy.long, qty=longQty)
strategy.exit("Long TP/SL", from_entry="Long", stop=longStop, limit=longTP)
if shortSignal and shortRisk > 0 and shortQty > 0
strategy.entry("Short", strategy.short, qty=shortQty)
strategy.exit("Short TP/SL", from_entry="Short", stop=shortStop, limit=shortTP)
//===== PLOTS =====
plot(sma1, color=color.orange, title="SMA 1m")
plot(sma15, color=color.blue, title="HTF SMA (15m)")
plot(srSupport, "SR Support", color=color.new(color.green, 50), style=plot.style_linebr)
plot(srResistance,"SR Resistance",color=color.new(color.red, 50), style=plot.style_linebr)
// Visual debug for signals
plotshape(longSignal, title="Long Signal", style=shape.triangleup, location=location.belowbar, color=color.lime, size=size.tiny)
plotshape(shortSignal, title="Short Signal", style=shape.triangledown, location=location.abovebar, color=color.red, size=size.tiny)
