SMPivot Gaussian Trend Strategy [Js.K]This open-source strategy combines a Gaussian-weighted moving average with “Smart Money” swing-pivot breaks (BoS = Break-of-Structure) to capture trend continuations and early reversals. It is intended for educational and research purposes only and must not be interpreted as financial advice.
How the logic works
-------------------
1. Gaussian Moving Average (GMA)
• A custom Gaussian kernel (length = 30 by default) smooths price while preserving turning points.
• A second pass (“Smoothed GMA”) further filters noise; only its direction is used for bias.
2. Swing-Pivot detection
• High/Low pivots are found with a symmetric look-back/forward window (Pivot Length = 20).
• The most recent confirmed pivot creates a dynamic structure level (UpdatedHigh / UpdatedLow).
3. Entry rules
Long
• Price closes above the most recent pivot high **and** above Smoothed GMA.
Short
• Price closes below the most recent pivot low **and** below Smoothed GMA.
4. Exit rules
• Fixed stop-loss and take-profit in percent of current price (user-defined).
• Separate parameters and on/off switches for longs and shorts.
5. Visuals
• GMA (dots) and Smoothed GMA (line).
• Structure break lines plus “BoS PH/PL” labels at the midpoint between pivot and break.
Inputs
------
Gaussian
• Gaussian Length (default 30) – smoothing window.
• Gaussian Scatterplot – toggle GMA dots.
Smart-Money Pivot
• Pivot Length (default 20).
• Bull / Bear colors.
Risk settings
• Long / Short enable.
• Individual SL % and TP % (default 1 % SL, 30 % TP).
• Strategy uses percent-of-equity sizing; initial capital defaults to 10 000 USD.
Adjust these to reflect your own account size, realistic commission and slippage.
Best practice & compliance notes
--------------------------------
• Test on a data sample that yields ≥ 100 trades to obtain statistically relevant results.
• Keep risk per trade below 5–10 % of equity; the default values comply with this guideline.
• Explain any custom settings you publish that differ from the defaults.
• Do **not** remove the code header or licence notice (MPL-2.0).
• Include realistic commission and slippage in your back-test before publishing.
• The script does **not** repaint; orders are processed on bar close.
Usage
-----
1. Add the script to any symbol / timeframe; intraday and swing timeframes both work—adjust lengths accordingly.
2. Configure SL/TP and position size to match your personal risk management.
3. Run “List of trades” and the performance summary to evaluate expectancy; forward-test before live use.
Disclaimer
----------
Trading involves substantial risk. Past performance based on back-testing is not necessarily indicative of future results. The author is **not** responsible for any financial losses arising from the use of this script.
Wyszukaj w skryptach "tp"

[blackcat] L3 Hull SeekerOVERVIEW
The L3 Hull Seeker is a comprehensive trading indicator that combines Hull Moving Average (HMA) analysis with robust position management and risk control features. This script is designed to help traders identify potential entry and exit points while maintaining strict risk management protocols.
KEY FEATURES
• Hull MA Analysis:
Advanced Hull Moving Average calculations
Separate Hull MA lines for Close and Open prices
Visual color coding for trend direction
Customizable length parameter for flexibility
• Position Tracking:
Real-time monitoring of long and short positions
Maximum position limit control
Clear position status indicators on chart
• Risk Management System:
User-defined Take Profit percentage
User-defined Stop Loss percentage
Optional activation of TP/SL features
Dynamic label markers for important levels
• Alert System:
Buy/Sell entry alerts
Take Profit/Stop Loss exit alerts
Position status changes
HOW TO USE
Setup Initial Parameters:
Hull MA Length: Adjust based on your trading timeframe
Take Profit Percentage: Set according to your risk tolerance
Stop Loss Percentage: Define your maximum acceptable loss
Enable/Disable Features:
Toggle Take Profit/Stop Loss options as needed
Adjust alert conditions for your trading style
Monitor Trading Signals:
Watch for crossover/crossunder signals
Track position status through labels
Monitor entry and exit alerts
Manage Risk:
Use TP/SL features to control position size
Monitor pyramiding limits
Review position status regularly
TRADE MANAGEMENT
• Entry Conditions:
Long Entry: HullMA_close crosses above HullMA_open
Short Entry: HullMA_close crosses below HullMA_open
• Exit Conditions:
Take Profit: Price reaches defined percentage above/below entry
Stop Loss: Price reaches defined percentage below/above entry
• Position Control:
Limited to one position at a time
Automatic position tracking
Clear visual indication of current trades
TECHNICAL DETAILS
• Hull MA Calculation:
Uses WMA (Weighted Moving Average) for precise calculations
Optimized for trend-following strategies
Smoothed Hull MA lines for better readability
• Label System:
Clear buy/sell markers
Take Profit and Stop Loss indicators
Real-time position status updates
• Alert Configuration:
Customizable alert messages
Multiple alert conditions
Option to enable/disable specific alerts
LIMITATIONS
⚠️ Important Considerations:
Results may vary across different market conditions
Historical performance does not guarantee future results
Always backtest strategy before live trading
Consider complementing with additional analysis tools
BEST PRACTICES
• Recommended Timeframes:
Daily charts for long-term strategies
4-hour charts for swing trading
1-hour charts for short-term trading
• Risk Management Tips:
Start with small position sizes
Always use TP/SL in live trading
Monitor market volatility before entering trades
TROUBLESHOOTING
• Common Issues:
Ensure proper chart resolution
Verify alert conditions are enabled
Check for conflicting indicators
• Performance Optimization:
Use appropriate timeframe for your strategy
Adjust indicator parameters based on market conditions
Monitor for potential overfitting

RSI Divergence Strategy - AliferCryptoStrategy Overview
The RSI Divergence Strategy is designed to identify potential reversals by detecting regular bullish and bearish divergences between price action and the Relative Strength Index (RSI). It automatically enters positions when a divergence is confirmed and manages risk with configurable stop-loss and take-profit levels.
Key Features
Automatic Divergence Detection: Scans for RSI pivot lows/highs vs. price pivots using user-defined lookback windows and bar ranges.
Dual SL/TP Methods:
- Swing-based: Stops placed a configurable percentage beyond the most recent swing high/low.
- ATR-based: Stops placed at a multiple of Average True Range, with a separate risk/reward multiplier.
Long and Short Entries: Buys on bullish divergences; sells short on bearish divergences.
Fully Customizable: Input groups for RSI, divergence, swing, ATR, and general SL/TP settings.
Visual Plotting: Marks divergences on chart and plots stop-loss (red) and take-profit (green) lines for active trades.
Alerts: Built-in alert conditions for both bullish and bearish RSI divergences.
Detailed Logic
RSI Calculation: Computes RSI of chosen source over a specified period.
Pivot Detection:
- Identifies RSI pivot lows/highs by scanning a lookback window to the left and right.
- Uses ta.barssince to ensure pivots are separated by a minimum/maximum number of bars.
Divergence Confirmation:
- Bullish: Price makes a lower low while RSI makes a higher low.
- Bearish: Price makes a higher high while RSI makes a lower high.
Entry:
- Opens a Long position when bullish divergence is true.
- Opens a Short position when bearish divergence is true.
Stop-Loss & Take-Profit:
- Swing Method: Computes the recent swing high/low then adjusts by a percentage margin.
- ATR Method: Uses the current ATR × multiplier applied to the entry price.
- Take-Profit: Calculated as entry price ± (risk × R/R ratio).
Exit Orders: Uses strategy.exit to place bracket orders (stop + limit) for both long and short positions.
Inputs and Configuration
RSI Settings: Length & price source for the RSI.
Divergence Settings: Pivot lookback parameters and valid bar ranges.
SL/TP Settings: Choice between Swing or ATR method.
Swing Settings: Swing lookback length, margin (%), and risk/reward ratio.
ATR Settings: ATR length, stop multiplier, and risk/reward ratio.
Usage Notes
Adjust the Pivot Lookback and Range values to suit the volatility and timeframe of your market.
Use higher ATR multipliers for wider stops in choppy conditions, or tighten swing margins in trending markets.
Backtest different R/R ratios to find the balance between win rate and reward.
Disclaimer
This script is for educational purposes only and does not constitute financial advice. Trading carries significant risk and you may lose more than your initial investment. Always conduct your own research and consider consulting a professional before making any trading decisions.

Range Filter Buy and Sell 5min## **Enhanced Range Filter Strategy: A Comprehensive Overview**
### **1. Introduction**
The **Enhanced Range Filter Strategy** is a powerful technical trading system designed to identify high-probability trading opportunities while filtering out market noise. It utilizes **range-based trend filtering**, **momentum confirmation**, and **volatility-based risk management** to generate precise entry and exit signals. This strategy is particularly useful for traders who aim to capitalize on trend-following setups while avoiding choppy, ranging market conditions.
---
### **2. Key Components of the Strategy**
#### **A. Range Filter (Trend Determination)**
- The **Range Filter** smooths price fluctuations and helps identify clear trends.
- It calculates an **adjusted price range** based on a **sampling period** and a **multiplier**, ensuring a dynamic trend-following approach.
- **Uptrends:** When the current price is above the range filter and the trend is strengthening.
- **Downtrends:** When the price falls below the range filter and momentum confirms the move.
#### **B. RSI (Relative Strength Index) as Momentum Confirmation**
- RSI is used to **filter out weak trades** and prevent entries during overbought/oversold conditions.
- **Buy Signals:** RSI is above a certain threshold (e.g., 50) in an uptrend.
- **Sell Signals:** RSI is below a certain threshold (e.g., 50) in a downtrend.
#### **C. ADX (Average Directional Index) for Trend Strength Confirmation**
- ADX ensures that trades are only taken when the trend has **sufficient strength**.
- Avoids trading in low-volatility, ranging markets.
- **Threshold (e.g., 25):** Only trade when ADX is above this value, indicating a strong trend.
#### **D. ATR (Average True Range) for Risk Management**
- **Stop Loss (SL):** Placed **one ATR below** (for long trades) or **one ATR above** (for short trades).
- **Take Profit (TP):** Set at a **3:1 reward-to-risk ratio**, using ATR to determine realistic price targets.
- Ensures volatility-adjusted risk management.
---
### **3. Entry and Exit Conditions**
#### **📈 Buy (Long) Entry Conditions:**
1. **Price is above the Range Filter** → Indicates an uptrend.
2. **Upward trend strength is positive** (confirmed via trend counter).
3. **RSI is above the buy threshold** (e.g., 50, to confirm momentum).
4. **ADX confirms trend strength** (e.g., above 25).
5. **Volatility is supportive** (using ATR analysis).
#### **📉 Sell (Short) Entry Conditions:**
1. **Price is below the Range Filter** → Indicates a downtrend.
2. **Downward trend strength is positive** (confirmed via trend counter).
3. **RSI is below the sell threshold** (e.g., 50, to confirm momentum).
4. **ADX confirms trend strength** (e.g., above 25).
5. **Volatility is supportive** (using ATR analysis).
#### **🚪 Exit Conditions:**
- **Stop Loss (SL):**
- **Long Trades:** 1 ATR below entry price.
- **Short Trades:** 1 ATR above entry price.
- **Take Profit (TP):**
- Set at **3x the risk distance** to achieve a favorable risk-reward ratio.
- **Ranging Market Exit:**
- If ADX falls below the threshold, indicating a weakening trend.
---
### **4. Visualization & Alerts**
- **Colored range filter line** changes based on trend direction.
- **Buy and Sell signals** appear as labels on the chart.
- **Stop Loss and Take Profit levels** are plotted as dashed lines.
- **Gray background highlights ranging markets** where trading is avoided.
- **Alerts trigger on Buy, Sell, and Ranging Market conditions** for automation.
---
### **5. Advantages of the Enhanced Range Filter Strategy**
✅ **Trend-Following with Noise Reduction** → Helps avoid false signals by filtering out weak trends.
✅ **Momentum Confirmation with RSI & ADX** → Ensures that only strong, valid trades are executed.
✅ **Volatility-Based Risk Management** → ATR ensures adaptive stop loss and take profit placements.
✅ **Works on Multiple Timeframes** → Effective for day trading, swing trading, and scalping.
✅ **Visually Intuitive** → Clearly displays trade signals, SL/TP levels, and trend conditions.
---
### **6. Who Should Use This Strategy?**
✔ **Trend Traders** who want to enter trades with momentum confirmation.
✔ **Swing Traders** looking for medium-term opportunities with a solid risk-reward ratio.
✔ **Scalpers** who need precise entries and exits to minimize false signals.
✔ **Algorithmic Traders** using alerts for automated execution.
---
### **7. Conclusion**
The **Enhanced Range Filter Strategy** is a powerful trading tool that combines **trend-following techniques, momentum indicators, and risk management** into a structured, rule-based system. By leveraging **Range Filters, RSI, ADX, and ATR**, traders can improve trade accuracy, manage risk effectively, and filter out unfavorable market conditions.
This strategy is **ideal for traders looking for a systematic, disciplined approach** to capturing trends while **avoiding market noise and false breakouts**. 🚀

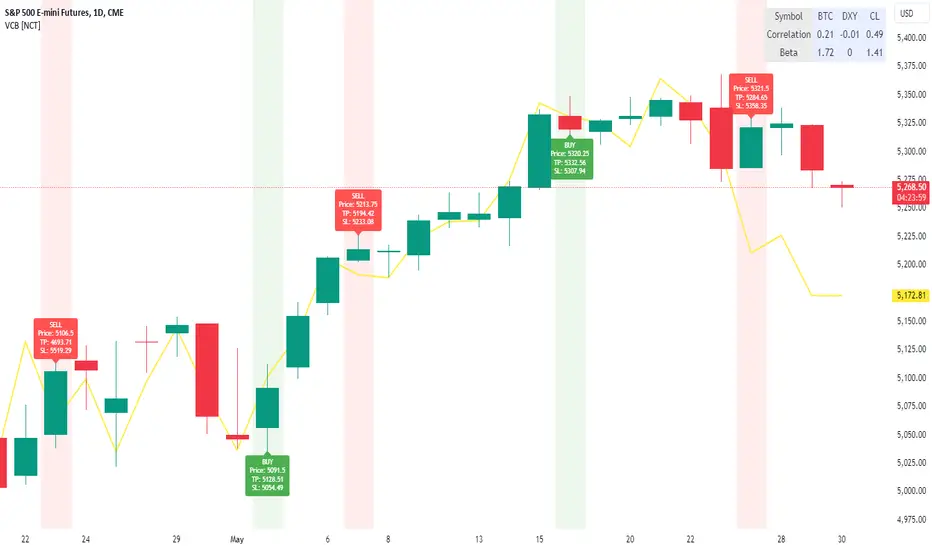
MACD Volume Strategy (BBO + MACD State, Reversal Type)Overview
MACD Volume Strategy (BBO + MACD State, Reversal Type) is a momentum-based reversal system that combines MACD crossover logic with volume filtering to enhance signal accuracy and minimize noise. It aims to identify structural trend shifts and manage risk using predefined parameters.
※This strategy is for educational and research purposes only. All results are based on historical simulations and do not guarantee future performance.
Strategy Objectives
Identify early trend transitions with high probability
Filter entries using volume dynamics to validate momentum
Maintain continuous exposure using a reversal-style model
Apply a consistent 1:1.5 risk-to-reward ratio per trade
Key Features
Integrated MACD and volume oscillator filtering
Zero repainting (all signals confirmed on closed candles)
Automatic position flipping for seamless direction shifts
Stop-loss and take-profit based on recent structural highs/lows
Trading Rules
Long Entry Conditions
MACD crosses above the zero line (BBO Buy arrow)
Volume oscillator is positive (short EMA > long EMA)
MACD is above the signal line
Close any existing short and enter a new long
Short Entry Conditions
MACD crosses below the zero line (BBO Sell arrow)
Volume oscillator is positive
MACD is below the signal line
Close any existing long and enter a new short
Exit Rules
Take Profit (TP) = Entry ± (risk distance × 1.5)
Stop Loss (SL) = Recent swing low (for long) or high (for short)
Early Exit = Triggered when a reversal signal appears (flip logic)
Risk Management Parameters
Pair: ETH/USD
Timeframe: 10-minute
Starting Capital: $3,000
Commission: 0.02%
Slippage: 2 pip
Risk per Trade: 5% of account equity (adjusted for sustainable practice)
Total Trades: 312 (backtest on selected dataset)
※Risk parameters are fully configurable and should be adjusted to suit each trader's personal setup and broker conditions.
Parameters & Configurations
Volume Short Length: 6
Volume Long Length: 12
MACD Fast Length: 11
MACD Slow Length: 21
Signal Smoothing: 10
Oscillator MA Type: SMA
Signal Line MA Type: SMA
Visual Support
Green arrow = Long entry
Red arrow = Short entry
MACD lines, signal line, and histogram
SL/TP markers plotted directly on the chart
Strategic Advantages & Uniqueness
Volume filtering eliminates low-participation, weak signals
Structurally aligned SL/TP based on recent market pivots
No repainting — decisions are made only on closed candles
Always in the market due to the reversal-style framework
Inspirations & Attribution
This strategy is inspired by the excellent work of:
Bitcoinblockchainonline – “BBO_Roxana_Signals MACD + vol”
Leveraging MACD zero-line cross and volume oscillator for intuitive signal generation.
HasanRifat – “MACD Fake Filter ”
Introduced a signal filter using MACD wave height averaging to reduce false positives.
This strategy builds upon those ideas to create a more automated, risk-aware, and technically adaptive system.
Summary
MACD Volume Strategy is a clean, logic-first automated trading system built for precision-seeking traders. It avoids discretionary bias and provides consistent signal logic under backtested historical conditions.
100% mechanical — no discretionary input required
Designed for high-confidence entries
Can be extended with filters, alerts, or trailing stops
※Strategy performance depends on market context. Past performance is not indicative of future results. Use with proper risk management and careful configuration.

RSI Pro+ (Bear market, financial crisis and so on EditionIn markets defined by volatility, fear, and uncertainty – the battlegrounds of bear markets and financial crises – you need tools forged in resilience. Introducing RSI Pro+, a strategy built upon a legendary indicator born in 1978, yet engineered with modern visual clarity to remain devastatingly effective even in the chaotic financial landscapes of 3078.
This isn't about complex algorithms predicting the unpredictable. It's about harnessing the raw, time-tested power of the Relative Strength Index (RSI) to identify potential exhaustion points and capitalize on oversold conditions. RSI Pro+ cuts through the noise, providing clear, actionable signals when markets might be poised for a relief bounce or reversal.
Core Technology (The 1978 Engine):
RSI Crossover Entry: The strategy initiates a LONG position when the RSI (default period 11) crosses above a user-defined low threshold (default 30). This classic technique aims to enter when selling pressure may be waning, offering potential entry points during sharp downturns or periods of consolidation after a fall.
Modern Enhancements (The 3078 Cockpit):
RSI Pro+ isn't just about the signal; it's about providing a professional-grade visual experience directly on your chart:
Entry Bar Highlight: A subtle background flash on the chart signals the exact bar where the RSI crossover condition is met, alerting you to potential entry opportunities.
Trade Bar Coloring: Once a trade is active, the price bars are subtly colored, giving you immediate visual confirmation that the strategy is live in the market.
Entry Price Line: A clear, persistent line marks your exact average entry price for the duration of the trade, serving as a crucial visual anchor.
Take Profit Line: Your calculated Take Profit target is plotted as a distinct line, keeping your objective clearly in sight.
Custom Entry Marker: A precise shape (▲) appears below the bar where the trade entry was actually executed, pinpointing the start of the position.
On-Chart Info Table (HUD): A clean, customizable Heads-Up Display appears when a trade is active, showing vital information at a glance:
Entry Price: Your position's average cost basis.
TP Target: The calculated price level for your Take Profit exit.
Current PnL%: Real-time Profit/Loss percentage for the open trade.
Full Customization: Nearly every aspect is configurable via the settings menu:
RSI Period & Crossover Level
Take Profit Percentage
Toggle ALL visual enhancements on/off individually
Position the Info Table wherever you prefer on the chart.
How to Use RSI Pro+:
Add to Chart: Apply the "RSI Pro+ (Bear market...)" strategy to your TradingView chart. Ensure any previous versions are removed.
Access Settings: Click the cogwheel icon (⚙️) next to the strategy name on your chart.
Configure Inputs (Crucial Step):
RSI Crossover Level: This is key. The default (30) targets standard oversold conditions. In severe downturns, you might experiment with lower levels (e.g., 25, 20) or higher ones (e.g., 40) depending on the asset and timeframe. Observe where RSI(11) typically bottoms out on your chart.
Take Profit Percentage (%): Define your desired profit target per trade (e.g., enter 0.5 for 0.5%, 1.0 for 1%). The default is a very small 0.11%.
RSI Period: While default is 11, you can adjust this (e.g., the standard 14).
Visual Enhancements: Enable or disable the visual features (background highlights, bar coloring, lines, markers, table) according to your preference using the checkboxes. Adjust table position.
Observe & Backtest: Watch how the strategy behaves on your chosen asset and timeframe. Use TradingView's Strategy Tester to analyze historical performance based on your settings. No strategy works perfectly everywhere; testing is essential.
Important Considerations:
Risk Management: This specific script version focuses on a Take Profit exit. It does not include an explicit Stop Loss. You MUST manage risk through appropriate position sizing, potentially adding a Stop Loss manually, or by modifying the script.
Oversold ≠ Reversal: An RSI crossover is an indicator of potential exhaustion, not a guarantee of a price reversal.
Fixed TP: A fixed percentage TP ensures small wins but may exit before larger potential moves.
Backtesting Limitations: Past performance does not guarantee future results.
RSI Pro+ strips away complexity to focus on a robust, time-honored principle, enhanced with modern visuals for the discerning trader navigating today's (and tomorrow's) challenging markets

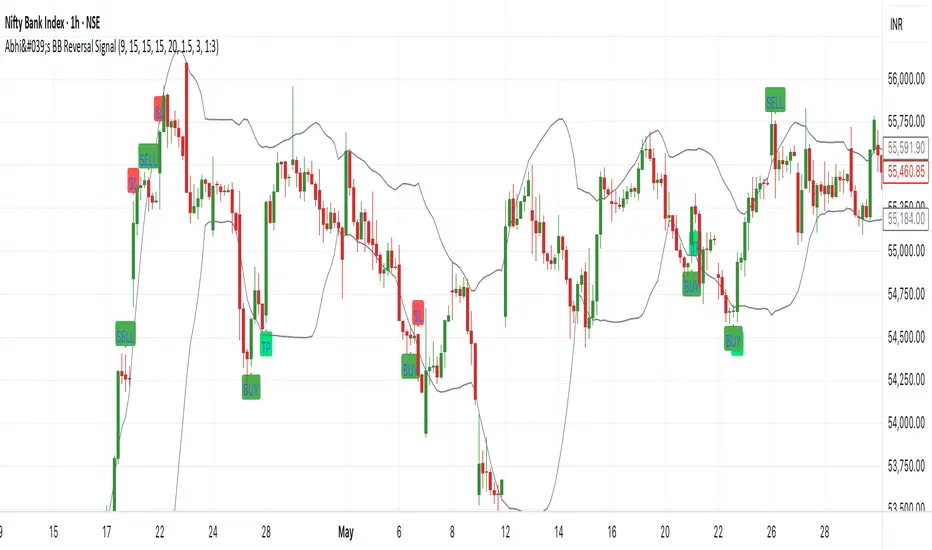
Abhi's Bollinger Band Reversal SignalThis Pine Script indicator is designed to detect reversal trade opportunities using Bollinger Band breakouts. It identifies both buy and sell setups with clearly defined entry, stop-loss (SL), and target (TP) conditions. It also manages trades visually with real-time signal plotting, and limits entries per trading day.
⚙️ How It Works
🔽 Sell Signal Conditions
- The previous candle must close above the upper Bollinger Band, and its entire body must be above the band
- The current candle must fail to break the previous high, and must break below the previous low
- Entry is taken at the previous candle’s low, with SL at its high
- Target is calculated based on a configurable Risk:Reward ratio
🔼 Buy Signal Conditions
- The previous candle must close below the lower Bollinger Band, and its entire body must be below the band
- The current candle must fail to break the previous low, and must break above the previous high
- Entry is at the previous candle’s high, with SL at its low
- Target is calculated using the same Risk:Reward ratio
⏰ Time-Based Exit
- If a trade is still active by a user-defined exit time (e.g. 15:15), the trade is closed
- Labels are plotted to show whether this exit was a profit or loss
🧩 User Inputs
- Start Time for signals
- Exit Time for open trades
- Bollinger Band Settings: Period and Std Dev
- Max Entries Per Day
- Risk:Reward Ratio: Dropdown for 1:1, 1:1.5, ..., 1:3
🎨 Visual Features
✅ BUY and SELL signals are plotted when valid conditions are detected
🟢 TP and 🔴 SL labels show trade outcome
🕒 TIME EXIT labels appear at user-set exit time with green/red coloring based on profitability
📉 Bollinger Bands plotted for visual context
📌 Notes:
- Designed for intraday trading, resets entry counter daily
- Uses bar_index > tradeBarIndex to avoid SL/TP being triggered on the same candle as entry
- Tracks only one trade at a time (tradeActive) — ensures clear, non-overlapping logic
Gold Scalping BOS & CHoCHThis strategy is designed for scalping gold (XAU/USD) on the 3-minute timeframe, utilizing Break of Structure (BOS) and Change of Character (CHoCH) to identify high-probability trade setups. Unlike traditional SMA crossover strategies, this method focuses purely on price action and market structure shifts, allowing for early entries and better risk management.
Core Concepts:
Break of Structure (BOS) – Confirms a continuation of the trend when price breaks the last swing high (bullish) or last swing low (bearish).
Change of Character (CHoCH) – Detects possible trend reversals by identifying a shift in market momentum.
Dynamic Support & Resistance – Uses the last 10-bar highs and lows to determine adaptive stop-loss (SL) and take-profit (TP) levels.
Risk-to-Reward Ratio (1:2 RR) – Ensures trades are executed with a favorable risk/reward ratio.
Entry Conditions:
Buy Entry:
BOS (Bullish) confirmed (price breaks the previous swing high).
CHoCH (Bullish) confirms trend shift.
Price crosses back above the last swing low (confirmation of support).
Sell Entry:
BOS (Bearish) confirmed (price breaks the previous swing low).
CHoCH (Bearish) confirms trend shift.
Price crosses back below the last swing high (confirmation of resistance).
Exit Conditions:
Stop Loss (SL): Set at the most recent dynamic support (for buys) or resistance (for sells).
Take Profit (TP): 2x the risk (1:2 risk-reward ratio).
Advantages of This Strategy:
✅ No lagging indicators – Uses price action for real-time entries.
✅ High probability setups – Focuses only on strong structural breaks.
✅ Adaptive SL/TP – Uses real market structure instead of fixed values.
✅ Optimized for Scalping – Best suited for quick in-and-out trades.
Best Time to Trade:
🔹 London & New York Sessions (High volatility for gold).

Rally Base Drop SND Pivots Strategy [LuxAlgo X PineIndicators]This strategy is based on the Rally Base Drop (RBD) SND Pivots indicator developed by LuxAlgo. Full credit for the concept and original indicator goes to LuxAlgo.
The Rally Base Drop SND Pivots Strategy is a non-repainting supply and demand trading system that detects pivot points based on Rally, Base, and Drop (RBD) candles. This strategy automatically identifies key market structure levels, allowing traders to:
Identify pivot-based supply and demand (SND) zones.
Use fixed criteria for trend continuation or reversals.
Filter out market noise by requiring structured price formations.
Enter trades based on breakouts of key SND pivot levels.
How the Rally Base Drop SND Pivots Strategy Works
1. Pivot Point Detection Using RBD Candles
The strategy follows a rigid market structure methodology, where pivots are detected only when:
A Rally (R) consists of multiple consecutive bullish candles.
A Drop (D) consists of multiple consecutive bearish candles.
A Base (B) is identified as a transition between Rallies and Drops, acting as a pivot point.
The pivot level is confirmed when the formation is complete.
Unlike traditional fractal-based pivots, RBD Pivots enforce stricter structural rules, ensuring that each pivot:
Has a well-defined bullish or bearish price movement.
Reduces false signals caused by single-bar fluctuations.
Provides clear supply and demand levels based on structured price movements.
These pivot levels are drawn on the chart using color-coded boxes:
Green zones represent bullish pivot levels (Rally Base formations).
Red zones represent bearish pivot levels (Drop Base formations).
Once a pivot is confirmed, the high or low of the base candle is used as the reference level for future trades.
2. Trade Entry Conditions
The strategy allows traders to select from three trading modes:
Long Only – Only takes long trades when bullish pivot breakouts occur.
Short Only – Only takes short trades when bearish pivot breakouts occur.
Long & Short – Trades in both directions based on pivot breakouts.
Trade entry signals are triggered when price breaks through a confirmed pivot level:
Long Entry:
A bullish pivot level is formed.
Price breaks above the bullish pivot level.
The strategy enters a long position.
Short Entry:
A bearish pivot level is formed.
Price breaks below the bearish pivot level.
The strategy enters a short position.
The strategy includes an optional mode to reverse long and short conditions, allowing traders to experiment with contrarian entries.
3. Exit Conditions Using ATR-Based Risk Management
This strategy uses the Average True Range (ATR) to calculate dynamic stop-loss and take-profit levels:
Stop-Loss (SL): Placed 1 ATR below entry for long trades and 1 ATR above entry for short trades.
Take-Profit (TP): Set using a Risk-Reward Ratio (RR) multiplier (default = 6x ATR).
When a trade is opened:
The entry price is recorded.
ATR is calculated at the time of entry to determine stop-loss and take-profit levels.
Trades exit automatically when either SL or TP is reached.
If reverse conditions mode is enabled, stop-loss and take-profit placements are flipped.
Visualization & Dynamic Support/Resistance Levels
1. Pivot Boxes for Market Structure
Each pivot is marked with a colored box:
Green boxes indicate bullish demand zones.
Red boxes indicate bearish supply zones.
These boxes remain on the chart to act as dynamic support and resistance levels, helping traders identify key price reaction zones.
2. Horizontal Entry, Stop-Loss, and Take-Profit Lines
When a trade is active, the strategy plots:
White line → Entry price.
Red line → Stop-loss level.
Green line → Take-profit level.
Labels display the exact entry, SL, and TP values, updating dynamically as price moves.
Customization Options
This strategy offers multiple adjustable settings to optimize performance for different market conditions:
Trade Mode Selection → Choose between Long Only, Short Only, or Long & Short.
Pivot Length → Defines the number of required Rally & Drop candles for a pivot.
ATR Exit Multiplier → Adjusts stop-loss distance based on ATR.
Risk-Reward Ratio (RR) → Modifies take-profit level relative to risk.
Historical Lookback → Limits how far back pivot zones are displayed.
Color Settings → Customize pivot box colors for bullish and bearish setups.
Considerations & Limitations
Pivot Breakouts Do Not Guarantee Reversals. Some pivot breaks may lead to continuation moves instead of trend reversals.
Not Optimized for Low Volatility Conditions. This strategy works best in trending markets with strong momentum.
ATR-Based Stop-Loss & Take-Profit May Require Optimization. Different assets may require different ATR multipliers and RR settings.
Market Noise May Still Influence Pivots. While this method filters some noise, fake breakouts can still occur.
Conclusion
The Rally Base Drop SND Pivots Strategy is a non-repainting supply and demand system that combines:
Pivot-based market structure analysis (using Rally, Base, and Drop candles).
Breakout-based trade entries at confirmed SND levels.
ATR-based dynamic risk management for stop-loss and take-profit calculation.
This strategy helps traders:
Identify high-probability supply and demand levels.
Trade based on structured market pivots.
Use a systematic approach to price action analysis.
Automatically manage risk with ATR-based exits.
The strict pivot detection rules and built-in breakout validation make this strategy ideal for traders looking to:
Trade based on market structure.
Use defined support & resistance levels.
Reduce noise compared to traditional fractals.
Implement a structured supply & demand trading model.
This strategy is fully customizable, allowing traders to adjust parameters to fit their market and trading style.
Full credit for the original concept and indicator goes to LuxAlgo.

EMA Sniper – Precision Trading with EMA 21/50Title: EMA Sniper – Precision Trading with EMA 21/50
Description:
🚀 EMA Sniper is a powerful trading tool designed to identify trend shifts with precision using the EMA 21/50 crossover, while also displaying Stop Loss (SL) and Take Profit (TP) levels directly on the chart.
🔹 Features:
✅ EMA 21/50 Crossover Signals – Buy signals appear when EMA 21 crosses above EMA 50, and sell signals appear when EMA 21 crosses below EMA 50.
✅ Smart Stop Loss & Take Profit – SL is dynamically placed below/above EMA 50 for optimized risk management, while TP follows a 2:1 risk/reward ratio.
✅ Clear Visual Alerts – The indicator plots SL and TP levels as lines on the chart, along with buy and sell markers for quick decision-making.
✅ Multi-Market & Multi-Timeframe – Works across forex, crypto, stocks, and indices on any timeframe.
🚀 Perfect for traders looking for a structured approach to trend-based trading!
Let me know if you’d like any modifications! 🔥

[3Commas] Turtle StrategyTurtle Strategy
🔷 What it does: This indicator implements a modernized version of the Turtle Trading Strategy, designed for trend-following and automated trading with webhook integration. It identifies breakout opportunities using Donchian channels, providing entry and exit signals.
Channel 1: Detects short-term breakouts using the highest highs and lowest lows over a set period (default 20).
Channel 2: Acts as a confirmation filter by applying an offset to the same period, reducing false signals.
Exit Channel: Functions as a dynamic stop-loss (wait for candle close), adjusting based on market structure (default 10 periods).
Additionally, traders can enable a fixed Take Profit level, ensuring a systematic approach to profit-taking.
🔷 Who is it for:
Trend Traders: Those looking to capture long-term market moves.
Bot Users: Traders seeking to automate entries and exits with bot integration.
Rule-Based Traders: Operators who prefer a structured, systematic trading approach.
🔷 How does it work: The strategy generates buy and sell signals using a dual-channel confirmation system.
Long Entry: A buy signal is generated when the close price crosses above the previous high of Channel 1 and is confirmed by Channel 2.
Short Entry: A sell signal occurs when the close price falls below the previous low of Channel 1, with confirmation from Channel 2.
Exit Management: The Exit Channel acts as a trailing stop, dynamically adjusting to price movements. To exit the trade, wait for a full bar close.
Optional Take Profit (%): Closes trades at a predefined %.
🔷 Why it’s unique:
Modern Adaptation: Updates the classic Turtle Trading Strategy, with the possibility of using a second channel with an offset to filter the signals.
Dynamic Risk Management: Utilizes a trailing Exit Channel to help protect gains as trades move favorably.
Bot Integration: Automates trade execution through direct JSON signal communication with your DCA Bots.
🔷 Considerations Before Using the Indicator:
Market & Timeframe: Best suited for trending markets; higher timeframes (e.g., H4, D1) are recommended to minimize noise.
Sideways Markets: In choppy conditions, breakouts may lead to false signals—consider using additional filters.
Backtesting & Demo Testing: It is crucial to thoroughly backtest the strategy and run it on a demo account before risking real capital.
Parameter Adjustments: Ensure that commissions, slippage, and position sizes are set accurately to reflect real trading conditions.
🔷 STRATEGY PROPERTIES
Symbol: BINANCE:ETHUSDT (Spot).
Timeframe: 4h.
Test Period: All historical data available.
Initial Capital: 10000 USDT.
Order Size per Trade: 1% of Capital, you can use a higher value e.g. 5%, be cautious that the Max Drawdown does not exceed 10%, as it would indicate a very risky trading approach.
Commission: Binance commission 0.1%, adjust according to the exchange being used, lower numbers will generate unrealistic results. By using low values e.g. 5%, it allows us to adapt over time and check the functioning of the strategy.
Slippage: 5 ticks, for pairs with low liquidity or very large orders, this number should be increased as the order may not be filled at the desired level.
Margin for Long and Short Positions: 100%.
Indicator Settings: Default Configuration.
Period Channel 1: 20.
Period Channel 2: 20.
Period Channel 2 Offset: 20.
Period Exit: 10.
Take Profit %: Disable.
Strategy: Long & Short.
🔷 STRATEGY RESULTS
⚠️Remember, past results do not guarantee future performance.
Net Profit: +516.87 USDT (+5.17%).
Max Drawdown: -100.28 USDT (-0.95%).
Total Closed Trades: 281.
Percent Profitable: 40.21%.
Profit Factor: 1.704.
Average Trade: +1.84 USDT (+1.80%).
Average # Bars in Trades: 29.
🔷 How to Use It:
🔸 Adjust Settings:
Select your asset and timeframe suited for trend trading.
Adjust the periods for Channel 1, Channel 2, and the Exit Channel to align with the asset’s historical behavior. You can visualize these channels by going to the Style tab and enabling them.
For example, if you set Channel 2 to 40 with an offset of 40, signals will take longer to appear but will aim for a more defined trend.
Experiment with different values, a possible exit configuration is using 20 as well. Compare the results and adjust accordingly.
Enable the Take Profit (%) option if needed.
🔸Results Review:
It is important to check the Max Drawdown. This value should ideally not exceed 10% of your capital. Consider adjusting the trade size to ensure this threshold is not surpassed.
Remember to include the correct values for commission and slippage according to the symbol and exchange where you are conducting the tests. Otherwise, the results will not be realistic.
If you are satisfied with the results, you may consider automating your trades. However, it is strongly recommended to use a small amount of capital or a demo account to test proper execution before committing real funds.
🔸Create alerts to trigger the DCA Bot:
Verify Messages: Ensure the message matches the one specified by the DCA Bot.
Multi-Pair Configuration: For multi-pair setups, enable the option to add the symbol in the correct format.
Signal Settings: Enable the option to receive long or short signals (Entry | TP | SL), copy and paste the messages for the DCA Bots configured.
Alert Setup:
When creating an alert, set the condition to the indicator and choose "alert() function call only".
Enter any desired Alert Name.
Open the Notifications tab, enable Webhook URL, and paste the Webhook URL.
For more details, refer to the section: "How to use TradingView Custom Signals".
Finalize Alerts: Click Create, you're done! Alerts will now be sent automatically in the correct format.
🔷 INDICATOR SETTINGS
Period Channel 1: Period of highs and lows to trigger signals
Period Channel 2: Period of highs and lows to filter signals
Offset: Move Channel 2 to the right x bars to try to filter out the favorable signals.
Period Exit: It is the period of the Donchian channel that is used as trailing for the exits.
Strategy: Order Type direction in which trades are executed.
Take Profit %: When activated, the entered value will be used as the Take Profit in percentage from the entry price level.
Use Custom Test Period: When enabled signals only works in the selected time window. If disabled it will use all historical data available on the chart.
Test Start and End: Once the Custom Test Period is enabled, here you select the start and end date that you want to analyze.
Check Messages: Check Messages: Enable this option to review the messages that will be sent to the bot.
Entry | TP | SL: Enable this options to send Buy Entry, Take Profit (TP), and Stop Loss (SL) signals.
Deal Entry and Deal Exit: Copy and paste the message for the deal start signal and close order at Market Price of the DCA Bot. This is the message that will be sent with the alert to the Bot, you must verify that it is the same as the bot so that it can process properly.
DCA Bot Multi-Pair: You must activate it if you want to use the signals in a DCA Bot Multi-pair in the text box you must enter (using the correct format) the symbol in which you are creating the alert, you can check the format of each symbol when you create the bot.
👨🏻💻💭 We hope this tool helps enhance your trading. Your feedback is invaluable, so feel free to share any suggestions for improvements or new features you'd like to see implemented.
__
The information and publications within the 3Commas TradingView account are not meant to be and do not constitute financial, investment, trading, or other types of advice or recommendations supplied or endorsed by 3Commas and any of the parties acting on behalf of 3Commas, including its employees, contractors, ambassadors, etc.

Iron Bot Statistical Trend Filter📌 Iron Bot Statistical Trend Filter
📌 Overview
Iron Bot Statistical Trend Filter is an advanced trend filtering strategy that combines statistical methods with technical analysis.
By leveraging Z-score and Fibonacci levels, this strategy quantitatively analyzes market trends to provide high-precision entry signals.
Additionally, it includes an optional EMA filter to enhance trend reliability.
Risk management is reinforced with Stop Loss (SL) and four Take Profit (TP) levels, ensuring a balanced approach to risk and reward.
📌 Key Features
🔹 1. Statistical Trend Filtering with Z-Score
This strategy calculates the Z-score to measure how much the price deviates from its historical mean.
Positive Z-score: Indicates a statistically high price, suggesting a strong uptrend.
Negative Z-score: Indicates a statistically low price, signaling a potential downtrend.
Z-score near zero: Suggests a ranging market with no strong trend.
By using the Z-score as a filter, market noise is reduced, leading to more reliable entry signals.
🔹 2. Fibonacci Levels for Trend Reversal Detection
The strategy integrates Fibonacci retracement levels to identify potential reversal points in the market.
High Trend Level (Fibo 23.6%): When the price surpasses this level, an uptrend is likely.
Low Trend Level (Fibo 78.6%): When the price falls below this level, a downtrend is expected.
Trend Line (Fibo 50%): Acts as a midpoint, helping to assess market balance.
This allows traders to visually confirm trend strength and turning points, improving entry accuracy.
🔹 3. EMA Filter for Trend Confirmation (Optional)
The strategy includes an optional 200 EMA (Exponential Moving Average) filter for trend validation.
Price above 200 EMA: Indicates a bullish trend (long entries preferred).
Price below 200 EMA: Indicates a bearish trend (short entries preferred).
Enabling this filter reduces false signals and improves trend-following accuracy.
🔹 4. Multi-Level Take Profit (TP) and Stop Loss (SL) Management
To ensure effective risk management, the strategy includes four Take Profit levels and a Stop Loss:
Stop Loss (SL): Automatically closes trades when the price moves against the position by a certain percentage.
TP1 (+0.75%): First profit-taking level.
TP2 (+1.1%): A higher probability profit target.
TP3 (+1.5%): Aiming for a stronger trend move.
TP4 (+2.0%): Maximum profit target.
This system secures profits at different stages and optimizes risk-reward balance.
🔹 5. Automated Long & Short Trading Logic
The strategy is built using Pine Script®’s strategy.entry() and strategy.exit(), allowing fully automated trading.
Long Entry:
Price is above the trend line & high trend level.
Z-score is positive (indicating an uptrend).
(Optional) Price is also above the EMA for stronger confirmation.
Short Entry:
Price is below the trend line & low trend level.
Z-score is negative (indicating a downtrend).
(Optional) Price is also below the EMA for stronger confirmation.
This logic helps filter out unnecessary trades and focus only on high-probability entries.
📌 Trading Parameters
This strategy is designed for flexible capital management and risk control.
💰 Account Size: $5000
📉 Commissions and Slippage: Assumes 94 pips commission per trade and 1 pip slippage.
⚖️ Risk per Trade: Adjustable, with a default setting of 1% of equity.
These parameters help preserve capital while optimizing the risk-reward balance.
📌 Visual Aids for Clarity
To enhance usability, the strategy includes clear visual elements for easy market analysis.
✅ Trend Line (Blue): Indicates market midpoint and helps with entry decisions.
✅ Fibonacci Levels (Yellow): Highlights high and low trend levels.
✅ EMA Line (Green, Optional): Confirms long-term trend direction.
✅ Entry Signals (Green for Long, Red for Short): Clearly marked buy and sell signals.
These features allow traders to quickly interpret market conditions, even without advanced technical analysis skills.
📌 Originality & Enhancements
This strategy is developed based on the IronXtreme and BigBeluga indicators,
combining a unique Z-score statistical method with Fibonacci trend analysis.
Compared to conventional trend-following strategies, it leverages statistical techniques
to provide higher-precision entry signals, reducing false trades and improving overall reliability.
📌 Summary
Iron Bot Statistical Trend Filter is a statistically-driven trend strategy that utilizes Z-score and Fibonacci levels.
High-precision trend analysis
Enhanced accuracy with an optional EMA filter
Optimized risk management with multiple TP & SL levels
Visually intuitive chart design
Fully customizable parameters & leverage support
This strategy reduces false signals and helps traders ride the trend with confidence.
Try it out and take your trading to the next level! 🚀

John Bob-Trading-BotDeveloped by Ayebale John Bob with the help of his bestie, this innovative strategy combines advanced Smart Money Concepts with practical risk management tools to help traders identify and capitalize on key market moves.
Key Features:
Smart Money Concepts & Fair Value Gaps (FVG):
The strategy monitors price action for fair value gaps, which are visualized as extremely faint horizontal lines on the chart. These FVGs signal potential areas where institutional traders might have entered or exited positions.
Dynamic Entry Signals:
Buy signals are triggered when the price crosses above the 50-bar lowest low or when a bullish FVG is detected. Conversely, sell signals are generated when the price falls below the 50-bar highest high or a bearish FVG is identified. Each signal is visually marked on the chart with clear buy (green) and sell (red) labels.
Multi-Level Order Execution:
Once an entry signal occurs, the strategy places five separate orders, each with its own take-profit (TP) level. The TP levels are calculated dynamically using the Average True Range (ATR) and a set of predefined multipliers. This allows traders to scale out of positions as the market moves favorably.
Dynamic Risk Management:
A stop-loss is automatically set at a distance determined by the ATR, ensuring that risk is managed in accordance with current market volatility.
Real-Time Trade Information Table:
In the bottom-right corner of the chart, a trade information table displays essential details about the current trade:
Side: Displays "BUY NOW" (with a dark green background) for long entries or "SELL NOW" (with a dark red background) for short entries.
Entry Price & Stop-Loss: Shows the entry price (highlighted in green) and the corresponding stop-loss level (highlighted in red).
Take-Profit Levels: Lists the five TP levels, each of which turns green once the market price reaches that target.
Timer: A live timer in minutes counts from the moment the current trade trigger started, helping traders track the duration of their active trades.
Visual Progress Bar:
A histogram-style progress bar is plotted on the chart, visually representing the percentage gain (or loss) relative to the entry price.
This strategy was meticulously designed to incorporate both technical analysis and smart risk management, offering a robust trading solution that adapts to changing market conditions. Whether you're a seasoned trader or just starting out, the AyebaleJohnBob Trading Bot equips you with the tools and visual cues needed to make well-informed trading decisions. Enjoy a seamless blend of strategy and style—crafted with passion by Ayebale John Bob and his bestie!

ATT Model with Buy/Sell SignalsIndicator Summary
This indicator is based on the ATT (Arithmetic Time Theory) model, using specific turning points derived from the ATT sequence (3, 11, 17, 29, 41, 47, 53, 59) to identify potential market reversals. It also integrates the RSI (Relative Strength Index) to confirm overbought and oversold conditions, triggering buy and sell signals when conditions align with the ATT sequence and RSI level.
Turning Points: Detected based on the ATT sequence applied to bar count. This suggests high-probability areas where the market could turn.
RSI Filter: Adds strength to the signals by ensuring buy signals occur when RSI is oversold (<30) and sell signals when RSI is overbought (>70).
Max Signals Per Session: Limits signals to two per session to reduce over-trading.
Entry Criteria
Buy Signal: Enter a buy trade if:
The indicator displays a green "BUY" marker.
RSI is below the oversold level (default <30), suggesting a potential upward reversal.
Sell Signal: Enter a sell trade if:
The indicator displays a red "SELL" marker.
RSI is above the overbought level (default >70), indicating a potential downward reversal.
Exit Criteria
Take Profit (TP):
Define TP as a fixed percentage or point value based on the asset's volatility. For example, set TP at 1.5-2x the risk, or a predefined point target (like 50-100 points).
Alternatively, exit the position when price approaches a key support/resistance level or the next significant swing high/low.
Stop Loss (SL):
Place the SL below the recent low (for buys) or above the recent high (for sells).
Set a fixed SL in points or percentage based on the asset’s average movement range, like an ATR-based stop, or limit it to a specific risk amount per trade (1-2% of account).
Trailing into Profit
Use a trailing strategy to lock in profits and let winning trades run further. Two main options:
ATR Trailing Stop:
Set the trailing stop based on the ATR (Average True Range), adjusting every time a new candle closes. This can help in volatile markets by keeping the stop at a consistent distance based on recent price movement.
Break-Even and Partial Profits:
When the price moves in your favor by a set amount (e.g., 1:1 risk/reward), move SL to the entry (break-even).
Take partial profit at intermediate levels (e.g., 50% at 1:1 RR) and trail the remainder.
Risk Management for Prop Firm Evaluation
Prop firms often have strict rules on daily loss limits, max drawdowns, and minimum profit targets. Here’s how to align your strategy with these:
Limit Risk per Trade:
Keep risk per trade to a conservative level (e.g., 1% or lower of your account balance). This allows for more room in case of a drawdown and aligns with most prop firm requirements.
Daily Loss Limits:
Set a daily stop-loss that ensures you don’t exceed the firm’s rules. For example, if the daily limit is 5%, stop trading once you reach a 3-4% drawdown.
Avoid Over-Trading:
Stick to the max signals per session rule (one or two trades). Taking only high-probability setups reduces emotional and reactive trades, preserving capital.
Stick to a Profit Target:
Aim to meet the evaluation’s profit goal efficiently but avoid risky or oversized trades to reach it faster.
Avoid Major Economic Events:
News events can disrupt technical setups. Avoid trading around significant releases (like FOMC or NFP) to reduce the chance of sudden losses due to high volatility.
Summary
Using this strategy with discipline, a structured entry/exit approach, and tight risk management can maximize your chances of passing a prop firm evaluation. The ATT model’s turning points, combined with the RSI, provide an edge by highlighting reversal zones, while limiting trades to 1-2 per session helps maintain controlled risk.

Price Movement Predictor (PMP)The Price Movement Predictor (PMP) is a versatile trading indicator designed to assist traders in identifying potential buy and sell opportunities in the market. This indicator utilizes a combination of technical analysis tools to generate signals based on the relative strength index (RSI) and moving averages, ensuring a robust and strategic approach to trading.
Key Features:
RSI-Based Signal Generation:
The indicator monitors the RSI to identify overbought and oversold conditions in the market.
A buy signal is generated when the RSI drops below a predefined oversold threshold, indicating potential upward price movement.
Conversely, a sell signal is triggered when the RSI exceeds a specified overbought level, suggesting a possible price decline.
Moving Average Confirmation:
The indicator employs two moving averages: a short-term and a long-term moving average.
Buy and sell signals are confirmed only after a crossover event occurs, ensuring that trades are entered in alignment with market trends.
The short moving average crossing above the long moving average confirms a buy signal, while a crossover below confirms a sell signal.
Take Profit and Stop Loss Management:
The PMP includes adjustable take profit and stop loss levels, which are automatically calculated based on user-defined percentages.
Labels indicating the take profit (TP) and stop loss (SL) levels are plotted on the chart, helping traders manage their risk effectively.
Alerts are available for both TP and SL conditions, allowing traders to stay informed about their trade outcomes.
User-Friendly Interface:
The indicator provides an intuitive setup with adjustable parameters for moving average lengths, RSI levels, and TP/SL ratios.
Clear buy and sell signals are displayed directly on the chart, making it easy for traders to act on potential opportunities.
Usage:
The Price Movement Predictor is ideal for traders who seek a systematic approach to identify trading opportunities and manage risk. By combining RSI signals with moving average crossovers, the indicator helps filter out false signals and enhances the accuracy of trade entries. It is suitable for various trading styles, including day trading, swing trading, and long-term investing.

Equilibrium Candles + Pattern [Honestcowboy]The Equilibrium Candles is a very simple trend continuation or reversal strategy depending on your settings.
How an Equilibrium Candle is created:
We calculate the equilibrium by measuring the mid point between highest and lowest point over X amount of bars back.
This now is the opening price for each bar and will be considered a green bar if price closes above equilibrium.
Bars get shaded by checking if regular candle close is higher than open etc. So you still see what the normal candles are doing.
Why are they useful?
The equilibrium is calculated the same as Baseline in Ichimoku Cloud. Which provides a point where price is very likely to retrace to. This script visualises the distance between close and equilibrium using candles. To provide a clear visual of how price relates to this equilibrium point.
This also makes it more straightforward to develop strategies based on this simple concept and makes the trader purely focus on this relationship and not think of any Ichimoku Cloud theories.
Script uses a very simple pattern to enter trades:
It will count how many candles have been one directional (above or below equilibrium)
Based on user input after X candles (7 by default) script shows we are in a trend (bg colors)
On the first pullback (candle closes on other side of equilibrium) it will look to enter a trade.
Places a stop order at the high of the candle if bullish trend or reverse if bearish trend.
If based on user input after X opposite candles (2 by default) order is not filled will cancel it and look for a new trend.
Use Reverse Logic:
There is a use reverse logic in the settings which on default is turned on. It will turn long orders into short orders making the stop orders become limit orders. It will use the normal long SL as target for the short. And TP as stop for the short. This to provide a means to reverse equity curve in case your pair is mean reverting by nature instead of trending.
ATR Calculation:
Averaged ATR, which is using ta.percentile_nearest_rank of 60% of a normal ATR (14 period) over the last 200 bars. This in simple words finds a value slightly above the mean ATR value over that period.
Big Candle Exit Logic:
Using Averaged ATR the script will check if a candle closes X times that ATR from the equilibrium point. This is then considered an overextension and all trades are closed.
This is also based on user input.
Simple trade management logic:
Checks if the user has selected to use TP and SL, or/and big candle exit.
Places a TP and SL based on averaged ATR at a multiplier based on user Input.
Closes trade if there is a Big Candle Exit or an opposite direction signal from indicator.
Script can be fully automated to MT5
There are risk settings in % and symbol settings provided at the bottom of the indicator. The script will send alert to MT5 broker trying to mimic the execution that happens on tradingview. There are always delays when using a bridge to MT5 broker and there could be errors so be mindful of that. This script sends alerts in format so they can be read by tradingview.to which is a bridge between the platforms.
Use the all alert function calls feature when setting up alerts and make sure you provide the right webhook if you want to use this approach.
There is also a simple buy and sell alert feature if you don't want to fully automate but still get alerts. These are available in the dropdown when creating an alert.
Almost every setting in this indicator has a tooltip added to it. So if any setting is not clear hover over the (?) icon on the right of the setting.
The backtest uses a 4% exposure per trade and a 10 point slippage. I did not include a commission cause I'm not personaly aware what the commissions are on most forex brokers. I'm only aware of minimal slippage to use in a backtest. Trading conditions vary per broker you use so always pay close attention to trading costs on your own broker. Use a full automation at your own risk and discretion and do proper backtesting.

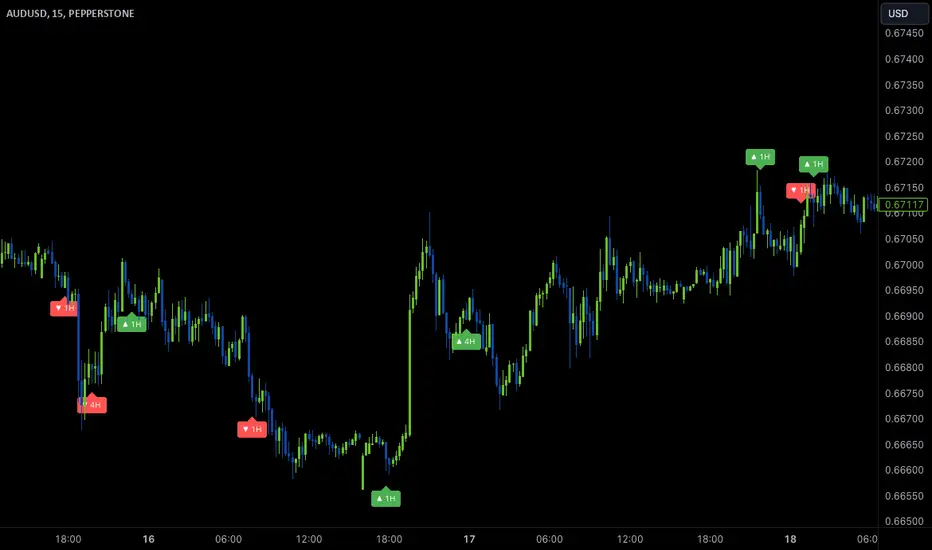
Wave Anchor IndicatorThe Wave Anchor Indicator is designed to mark the crossing of overbought and oversold levels of higher time frame momentum waves, based on the VuManChu Cipher B+Divergences Wave Trend Indicator. This tool is inspired by the TP Mint trading strategy, which relies heavily on the momentum waves of Market Cipher B or VuManChu Cipher B for identifying optimal entry and exit points.
Key Concept: Anchored Waves
In the TP Mint strategy, momentum waves in overbought (above 60) or oversold (below -60) conditions on higher time frames are considered "anchored." These anchored waves provide strong signals for entries and take-profit points when viewed on lower time frames. The Wave Anchor Indicator focuses on these anchor conditions to help traders make informed decisions by seeing higher time frame anchor states directly on the entry time frame chart.
How It Works
Labeling Signals:
- On lower time frames, such as the 15-minute chart, the indicator shows labels when higher
time frame momentum waves (1-hour and 4-hour) cross the overbought or oversold levels.
- Labels above price indicate overbought conditions, with green labels when the wave crosses
upward and red labels when crossing downward.
- Labels below price signal oversold conditions, with red for a downward cross and green for an
upward cross.
- Each label displays the time frame of the crossing momentum wave, providing context for
traders at a glance.
Time Frame Pairings:
- On the 15-minute time frame, the indicator tracks anchor conditions from the 1-hour and 4-
hour time frames.
- On the 1-hour chart, it monitors 4-hour and daily time frame anchor conditions.
Customization and Alerts
Flexible Display Options : Users can choose to display none, one, or both of the grouped higher time frame labels, depending on their strategy and preferences.
Alerts : The indicator also allows for custom alerts when a label appears, helping traders stay on top of key market movements without constantly monitoring the chart.
Use Cases
This indicator is ideal for traders who use momentum-based strategies across multiple time frames. It simplifies the process of identifying key entry and exit points by focusing on the anchor conditions from higher time frames, making it easier to execute the TP Mint strategy or similar methods.
Thank you to VuManChu and LazyBear for mamking the momentum wave code open source and allowing it’s use in this indicator.
ICT Master Suite [Trading IQ]Hello Traders!
We’re excited to introduce the ICT Master Suite by TradingIQ, a new tool designed to bring together several ICT concepts and strategies in one place.
The Purpose Behind the ICT Master Suite
There are a few challenges traders often face when using ICT-related indicators:
Many available indicators focus on one or two ICT methods, which can limit traders who apply a broader range of ICT related techniques on their charts.
There aren't many indicators for ICT strategy models, and we couldn't find ICT indicators that allow for testing the strategy models and setting alerts.
Many ICT related concepts exist in the public domain as indicators, not strategies! This makes it difficult to verify that the ICT concept has some utility in the market you're trading and if it's worth trading - it's difficult to know if it's working!
Some users might not have enough chart space to apply numerous ICT related indicators, which can be restrictive for those wanting to use multiple ICT techniques simultaneously.
The ICT Master Suite is designed to offer a comprehensive option for traders who want to apply a variety of ICT methods. By combining several ICT techniques and strategy models into one indicator, it helps users maximize their chart space while accessing multiple tools in a single slot.
Additionally, the ICT Master Suite was developed as a strategy . This means users can backtest various ICT strategy models - including deep backtesting. A primary goal of this indicator is to let traders decide for themselves what markets to trade ICT concepts in and give them the capability to figure out if the strategy models are worth trading!
What Makes the ICT Master Suite Different
There are many ICT-related indicators available on TradingView, each offering valuable insights. What the ICT Master Suite aims to do is bring together a wider selection of these techniques into one tool. This includes both key ICT methods and strategy models, allowing traders to test and activate strategies all within one indicator.
Features
The ICT Master Suite offers:
Multiple ICT strategy models, including the 2022 Strategy Model and Unicorn Model, which can be built, tested, and used for live trading.
Calculation and display of key price areas like Breaker Blocks, Rejection Blocks, Order Blocks, Fair Value Gaps, Equal Levels, and more.
The ability to set alerts based on these ICT strategies and key price areas.
A comprehensive, yet practical, all-inclusive ICT indicator for traders.
Customizable Timeframe - Calculate ICT concepts on off-chart timeframes
Unicorn Strategy Model
2022 Strategy Model
Liquidity Raid Strategy Model
OTE (Optimal Trade Entry) Strategy Model
Silver Bullet Strategy Model
Order blocks
Breaker blocks
Rejection blocks
FVG
Strong highs and lows
Displacements
Liquidity sweeps
Power of 3
ICT Macros
HTF previous bar high and low
Break of Structure indications
Market Structure Shift indications
Equal highs and lows
Swings highs and swing lows
Fibonacci TPs and SLs
Swing level TPs and SLs
Previous day high and low TPs and SLs
And much more! An ongoing project!
How To Use
Many traders will already be familiar with the ICT related concepts listed above, and will find using the ICT Master Suite quite intuitive!
Despite this, let's go over the features of the tool in-depth and how to use the tool!
The image above shows the ICT Master Suite with almost all techniques activated.
ICT 2022 Strategy Model
The ICT Master suite provides the ability to test, set alerts for, and live trade the ICT 2022 Strategy Model.
The image above shows an example of a long position being entered following a complete setup for the 2022 ICT model.
A liquidity sweep occurs prior to an upside breakout. During the upside breakout the model looks for the FVG that is nearest 50% of the setup range. A limit order is placed at this FVG for entry.
The target entry percentage for the range is customizable in the settings. For instance, you can select to enter at an FVG nearest 33% of the range, 20%, 66%, etc.
The profit target for the model generally uses the highest high of the range (100%) for longs and the lowest low of the range (100%) for shorts. Stop losses are generally set at 0% of the range.
The image above shows the short model in action!
Whether you decide to follow the 2022 model diligently or not, you can still set alerts when the entry condition is met.
ICT Unicorn Model
The image above shows an example of a long position being entered following a complete setup for the ICT Unicorn model.
A lower swing low followed by a higher swing high precedes the overlap of an FVG and breaker block formed during the sequence.
During the upside breakout the model looks for an FVG and breaker block that formed during the sequence and overlap each other. A limit order is placed at the nearest overlap point to current price.
The profit target for this example trade is set at the swing high and the stop loss at the swing low. However, both the profit target and stop loss for this model are configurable in the settings.
For Longs, the selectable profit targets are:
Swing High
Fib -0.5
Fib -1
Fib -2
For Longs, the selectable stop losses are:
Swing Low
Bottom of FVG or breaker block
The image above shows the short version of the Unicorn Model in action!
For Shorts, the selectable profit targets are:
Swing Low
Fib -0.5
Fib -1
Fib -2
For Shorts, the selectable stop losses are:
Swing High
Top of FVG or breaker block
The image above shows the profit target and stop loss options in the settings for the Unicorn Model.
Optimal Trade Entry (OTE) Model
The image above shows an example of a long position being entered following a complete setup for the OTE model.
Price retraces either 0.62, 0.705, or 0.79 of an upside move and a trade is entered.
The profit target for this example trade is set at the -0.5 fib level. This is also adjustable in the settings.
For Longs, the selectable profit targets are:
Swing High
Fib -0.5
Fib -1
Fib -2
The image above shows the short version of the OTE Model in action!
For Shorts, the selectable profit targets are:
Swing Low
Fib -0.5
Fib -1
Fib -2
Liquidity Raid Model
The image above shows an example of a long position being entered following a complete setup for the Liquidity Raid Modell.
The user must define the session in the settings (for this example it is 13:30-16:00 NY time).
During the session, the indicator will calculate the session high and session low. Following a “raid” of either the session high or session low (after the session has completed) the script will look for an entry at a recently formed breaker block.
If the session high is raided the script will look for short entries at a bearish breaker block. If the session low is raided the script will look for long entries at a bullish breaker block.
For Longs, the profit target options are:
Swing high
User inputted Lib level
For Longs, the stop loss options are:
Swing low
User inputted Lib level
Breaker block bottom
The image above shows the short version of the Liquidity Raid Model in action!
For Shorts, the profit target options are:
Swing Low
User inputted Lib level
For Shorts, the stop loss options are:
Swing High
User inputted Lib level
Breaker block top
Silver Bullet Model
The image above shows an example of a long position being entered following a complete setup for the Silver Bullet Modell.
During the session, the indicator will determine the higher timeframe bias. If the higher timeframe bias is bullish the strategy will look to enter long at an FVG that forms during the session. If the higher timeframe bias is bearish the indicator will look to enter short at an FVG that forms during the session.
For Longs, the profit target options are:
Nearest Swing High Above Entry
Previous Day High
For Longs, the stop loss options are:
Nearest Swing Low
Previous Day Low
The image above shows the short version of the Silver Bullet Model in action!
For Shorts, the profit target options are:
Nearest Swing Low Below Entry
Previous Day Low
For Shorts, the stop loss options are:
Nearest Swing High
Previous Day High
Order blocks
The image above shows indicator identifying and labeling order blocks.
The color of the order blocks, and how many should be shown, are configurable in the settings!
Breaker Blocks
The image above shows indicator identifying and labeling order blocks.
The color of the breaker blocks, and how many should be shown, are configurable in the settings!
Rejection Blocks
The image above shows indicator identifying and labeling rejection blocks.
The color of the rejection blocks, and how many should be shown, are configurable in the settings!
Fair Value Gaps
The image above shows indicator identifying and labeling fair value gaps.
The color of the fair value gaps, and how many should be shown, are configurable in the settings!
Additionally, you can select to only show fair values gaps that form after a liquidity sweep. Doing so reduces "noisy" FVGs and focuses on identifying FVGs that form after a significant trading event.
The image above shows the feature enabled. A fair value gap that occurred after a liquidity sweep is shown.
Market Structure
The image above shows the ICT Master Suite calculating market structure shots and break of structures!
The color of MSS and BoS, and whether they should be displayed, are configurable in the settings.
Displacements
The images above show indicator identifying and labeling displacements.
The color of the displacements, and how many should be shown, are configurable in the settings!
Equal Price Points
The image above shows the indicator identifying and labeling equal highs and equal lows.
The color of the equal levels, and how many should be shown, are configurable in the settings!
Previous Custom TF High/Low
The image above shows the ICT Master Suite calculating the high and low price for a user-defined timeframe. In this case the previous day’s high and low are calculated.
To illustrate the customizable timeframe function, the image above shows the indicator calculating the previous 4 hour high and low.
Liquidity Sweeps
The image above shows the indicator identifying a liquidity sweep prior to an upside breakout.
The image above shows the indicator identifying a liquidity sweep prior to a downside breakout.
The color and aggressiveness of liquidity sweep identification are adjustable in the settings!
Power Of Three
The image above shows the indicator calculating Po3 for two user-defined higher timeframes!
Macros
The image above shows the ICT Master Suite identifying the ICT macros!
ICT Macros are only displayable on the 5 minute timeframe or less.
Strategy Performance Table
In addition to a full-fledged TradingView backtest for any of the ICT strategy models the indicator offers, a quick-and-easy strategy table exists for the indicator!
The image above shows the strategy performance table in action.
Keep in mind that, because the ICT Master Suite is a strategy script, you can perform fully automatic backtests, deep backtests, easily add commission and portfolio balance and look at pertinent metrics for the ICT strategies you are testing!
Lite Mode
Traders who want the cleanest chart possible can toggle on “Lite Mode”!
In Lite Mode, any neon or “glow” like effects are removed and key levels are marked as strict border boxes. You can also select to remove box borders if that’s what you prefer!
Settings Used For Backtest
For the displayed backtest, a starting balance of $1000 USD was used. A commission of 0.02%, slippage of 2 ticks, a verify price for limit orders of 2 ticks, and 5% of capital investment per order.
A commission of 0.02% was used due to the backtested asset being a perpetual future contract for a crypto currency. The highest commission (lowest-tier VIP) for maker orders on many exchanges is 0.02%. All entered positions take place as maker orders and so do profit target exits. Stop orders exist as stop-market orders.
A slippage of 2 ticks was used to simulate more realistic stop-market orders. A verify limit order settings of 2 ticks was also used. Even though BTCUSDT.P on Binance is liquid, we just want the backtest to be on the safe side. Additionally, the backtest traded 100+ trades over the period. The higher the sample size the better; however, this example test can serve as a starting point for traders interested in ICT concepts.
Community Assistance And Feedback
Given the complexity and idiosyncratic applications of ICT concepts amongst its proponents, the ICT Master Suite’s built-in strategies and level identification methods might not align with everyone's interpretation.
That said, the best we can do is precisely define ICT strategy rules and concepts to a repeatable process, test, and apply them! Whether or not an ICT strategy is trading precisely how you would trade it, seeing the model in action, taking trades, and with performance statistics is immensely helpful in assessing predictive utility.
If you think we missed something, you notice a bug, have an idea for strategy model improvement, please let us know! The ICT Master Suite is an ongoing project that will, ideally, be shaped by the community.
A big thank you to the @PineCoders for their Time Library!
Thank you!

M & W Checklistindicator to Validate & Grade M & W Patterns.
Indicator Inputs
Table Color Palette
• Position Valid : Positions the Valid Trade table on the chart.
• Position Grade : Positions the Grade table on the chart, hover over the Column 1 Row 1 for a description of the bands.
• Size: Text size for all tables.
• Text Color : Sets text color.
• Border Color : Sets the table border color for all tables.
• Background Color : Sets table backgroud color for all tables.
Valid Trade Table
Checkboxes to indicate if the trade is valid. Fail is displayed if unchecked, Pass if checked.
Grade Table
• S/R Level 1: distance between neckline and 1st resistance area in % of the total distance between neckline and take profit. This is not for road blocks but pivot points etc before the initial run up/down in price. I have this set to 30% , this means that if there is a pivot point between the neckline and 30% of the TP level I weight it negatively.
• S/R Level 2: distance between neckline and 1st resistance area in % of the total distance between neckline and take profit. This is not for road blocks but pivot points etc before the initial run up/down in price. I have this set to 50% , this means that if there is a pivot point between the neckline and 50% of the TP level 2 weight it negatively but less so than level 1.
• S/R Level 3: distance between neckline and 1st resistance area in % of the total distance between neckline and take profit. This is not for road blocks but pivot points etc before the initial run up/down in price. I have this set to 70% , this means that if there is a pivot point between the neckline and 70% of the TP level 3 weight it negatively but less so than level 1 & level 2.
• Checkboxes are self explanatory, they are binary options, all are weighted negatively if checked and are weighted positively if unchecked. Divergence values for weighting are neutral if unckecked & weighted positively if checked.
• The select options are neutral weighting if set to neutral , if set to For its weighted positive and set to Against weighted negatively.
Technical Specification of the Scoring and Band System
Overview
The scoring system is designed to evaluate a set of technical trade conditions, assigning weights to various criteria that influence the quality of the trade. The system calculates a total score based on both positive and negative conditions. Based on the final score, the system assigns a grade or band (A, B, or C) for positive scores, and a "Negative" label for negative scores.
Scoring System
The system calculates the score by evaluating a set of 12 conditions (gradeCondition1 to gradeCondition12). These conditions are manually input by the user via checkboxes or dropdowns in a technical indicator (written in Pine Script for TradingView). The score weights vary according to the relative importance of each condition.
Condition Breakdown and Weighting:
1. Divergences (GradeCondition1 & GradeCondition2):
◦ 1H Divergence: +5 points if condition is true.
◦ 4H Divergence: +10 points if condition is true (stronger weight than 1H).
2. Support/Resistance at Neckline (GradeCondition3):
◦ Negative if present: -15 points if true (carries significant negative weight).
3. RB near Entry (GradeCondition4):
◦ Very Negative: -20 points if true (this is a critical negative condition).
4. RB can Manage (GradeCondition5):
◦ Slightly Negative: -5 points if true.
5. Institutional Value Zones (GradeCondition6 to GradeCondition8):
◦ For the trade: +5 points.
◦ Against the trade: -5 points.
◦ Neutral: 0 points.
6. S/R between Neckline & Targets (GradeCondition9 to GradeCondition11):
◦ Level 1: -10 points if true, +7 points if false.
◦ Level 2: -7 points if true, +7 points if false.
◦ Level 3: -5 points if true, +7 points if false.
◦ Use fib tool or Gann Box to measure any S/R levels setup according to your preferences.
7. News Timing (GradeCondition12):
◦ News within 3 hours: -20 points if true (strong negative factor).
◦ No upcoming news: +10 points if false.
Scoring Calculation Formula:
totalScore = score1 + score2 + score3 + score4 + score5 + score6 + score7 + score8 + score9 + score10 + score11 + score12
Where:
• score1 to score12 represent the points derived from the conditions described above.
Coloring and Visual Feedback:
• Positive Scores: Displayed in green.
• Negative Scores: Displayed in red.
Band System
The Band System classifies the total score into different grades, depending on the final value of totalScore. This classification provides an intuitive ranking for trades, helping users quickly assess trade quality.
Band Classification:
• Band A: If the totalScore is 41 or more.
◦ Represents a highly favorable trade setup.
• Band B: If the totalScore is between 21 and 40.
◦ Represents a favorable trade setup with good potential.
• Band C: If the totalScore is between 1 and 20.
◦ Represents a trade setup that is acceptable but may have risks.
• Negative: If the totalScore is 0 or less.
◦ Represents a poor trade setup with significant risks or unfavorable conditions.
Band Calculation Logic (in Pine Script):
var string grade = ""
if (totalScore >= 41)
grade := "Band A"
else if (totalScore >= 21)
grade := "Band B"
else if (totalScore >= 1)
grade := "Band C"
else
grade := "Negative"
Technical Key Points:
• Highly Negative Conditions:
◦ The system penalizes certain conditions more heavily, especially those that suggest significant risks (e.g., News in less than 3 hours, RB near Entry).
• Positive Trade Conditions:
◦ Divergences, Institutional Value Zones in favor of the trade, and lack of significant nearby resistance all contribute positively to the score.
• Flexible System:
◦ The system can be adapted or fine-tuned by adjusting the weights of individual conditions according to trading preferences.
Use Case Example:
• If a trade has 1H and 4H Divergence, RB near Entry (negative), and no upcoming news:
◦ 1H Divergence: +5 points.
◦ 4H Divergence: +10 points.
◦ RB near Entry: -20 points.
◦ No news: +10 points.
◦ Total Score: 5 + 10 - 20 + 10 = 5 → Band C.
This modular and flexible scoring system allows traders to systematically evaluate trades and quickly gauge the trade's potential based on technical indicators
Summary:
Maximum Score: 61
Minimum Score: -97
These are the bounds of the score range based on the current logic of the script.

Risk TrackerThis Risk Tracker Pine Script provides traders with a customizable tool for tracking and managing trade risk directly on their chart. The script is designed to accommodate both futures and crypto trades, allowing you to monitor risk and reward parameters, adjust contract sizes, and manage leverage in real-time.
Key Features:
1. Trade Direction and Risk-Reward Ratio:
• Select between Long or Short trade directions.
• Set a custom Risk-Reward Ratio (RRR) to calculate potential profit and loss levels based on your trade setup.
2. Customizable Parameters:
• Input fields for contract size, leverage, margin, and maximum drawdown allow you to adjust the risk settings depending on the market you are trading.
• You can toggle between using a dollar-based or percentage-based risk calculation depending on whether you’re trading futures (USD-based) or crypto.
3. Real-time Stop-Loss and Take-Profit Calculation:
• The script automatically calculates and draws the Stop-Loss (SL) and Take-Profit (TP) levels on the chart based on your entry price and selected risk settings.
• The color of the SL and TP lines is customizable, allowing you to visually distinguish profit and loss levels.
4. Historical Price Levels:
• If there is no active trade, the script scans historical price data to find the last instances when the price hit the predefined stop-loss or take-profit levels, helping you understand past price behavior.
5. Risk Management Table:
• A summary table is displayed on the chart, showing the key metrics of your trade, including:
• Tick value and Dollar value for futures.
• Margin and Leverage for crypto.
• Risk-Reward Ratio, Entry price, Risk and Profit in USD or percentage terms.
• The table dynamically updates based on the current trade status.
6. Extended Chart Visualization:
• Option to extend the SL and TP lines to the left of the chart, allowing you to easily view these levels across multiple timeframes and bars.
This script helps ensure you are always aware of your trade’s risk profile, providing a clear and visual representation of potential profit and loss, both in terms of percentage and dollar value. Ideal for futures and crypto traders who rely on precise risk management to maintain profitability.

ORB - Alerts, VWAP and MACD Checks, Extended Fib Levels
ORB Range Alerter with Shading, VWAP Check, MACD Check, and Extended Fibonacci Levels for TP – Fully Customizable
This indicator is designed to give you a comprehensive analysis of the Opening Range Breakout (ORB) combined with advanced conditions based on VWAP and MACD indicators, along with Extended Fibonacci Levels for both long and short TP positions.
Key Features:
Opening Range Breakout (ORB):
Defines the opening range at the market open (9:30 AM by default) based on your chart timeframe and shades it for visibility.
The high and low of the first candle after the open are plotted on the chart, creating a breakout range that traders can use to identify potential long or short positions.
VWAP Condition (Optional):
This indicator includes the option to enforce the VWAP (Volume-Weighted Average Price) as a condition for entering trades.
- Longs will only trigger if the price is above VWAP (when enabled).
- Shorts will only trigger if the price is below VWAP (when enabled).
Customizable : You can enable or disable the VWAP condition through a simple checkbox in the indicator’s settings.
MACD Condition (Optional):
Includes an optional MACD (Moving Average Convergence Divergence) condition.
- Longs will only trigger if the MACD line is above 0 and the signal line, providing confirmation of bullish momentum.
- Shorts will only trigger if the MACD line is below 0 and the signal line, indicating bearish momentum.
Customizable : You can enable or disable the MACD condition through a checkbox in the indicator’s settings, allowing you to trade with or without the MACD confirmation.
Fibonacci Extensions for Profit Targets:
Automatically calculates Fibonacci extension levels based on the ORB range for TP levels.
These levels provide key areas for potential profit-taking or reversal points.
Fibonacci extensions are plotted only after a confirmed breakout, either long or short.
The extensions include 127.2%, 161.8%, 200%, 261.8%, 423.6%, and 685.4%, offering a comprehensive set of targets for different trading strategies.
Shading of ORB Range:
The ORB high and low are visually emphasized on the chart with a shaded area for easy identification.
The shading is semi-transparent to help keep your chart clean and easy to read.
Customizable Timeframe:
The ORB range is defined based on the time of day (default is 9:30 AM to 4:00 PM), but you can adjust the timeframe to suit different trading sessions or markets.
Alerts for Breakouts:
Built-in alerts notify you when price crosses above or below the ORB high or low, along with the optional VWAP and MACD conditions.
Alerts can be used to create automated notifications or even execute automated trades based on your chosen settings.
How to Use:
Long Trade Example: When the price crosses above the ORB high, VWAP is above the price, and MACD shows bullish momentum (if these conditions are enabled), a potential long entry is triggered. You can use the Fibonacci extensions for profit targets.
Short Trade Example: When the price crosses below the ORB low, VWAP is below the price, and MACD confirms bearish momentum (if these conditions are enabled), a short entry is triggered. Fibonacci levels for the short position can guide your exit strategy.
Flexibility: You can enable or disable both VWAP and MACD conditions based on your trading style. This flexibility allows the indicator to adapt to different market conditions and strategies.
Customization Options:
Enable/Disable VWAP Condition: Decide if you want to include VWAP as a trade filter.
Enable/Disable MACD Condition: Choose whether to require MACD as confirmation for trade entries.
Adjust ORB Timeframe: Customize the time range for defining the ORB based on the market you're trading.
Fibonacci Extensions: Visualize key profit targets using Fibonacci extensions, which are automatically calculated and displayed after a breakout.

Candle Range Detector [UAlgo]The "Candle Range Detector " is a Pine Script™ indicator designed to identify trading opportunities based on the concept of price consolidation and breakout. It analyzes the price range of a specified number of previous candles and detects when subsequent candles stay within that range (consolidation). The indicator then highlights potential breakouts above or below the range and provides calculated Take Profit (TP) and Stop Loss (SL) levels based on your chosen method (percentage or Average True Range - ATR).
🔶 Key Features
Configurable Range: Define the minimum number of candles required to establish a valid price range.
Breakout Detection: Identify potential breakouts above or below the established range based on your selection (close price or wick).
Take Profit & Stop Loss Levels: The indicator calculates TP and SL levels based on your chosen method (percentage or ATR) and user-defined multipliers. The calculated TP and SL levels are visualized as horizontal lines with corresponding labels ("Take Profit" and "Stop Loss").
Optional Count Display: You can choose to display the number of candles currently within the range.
🔶 Disclaimer:
Not Financial Advice: This indicator is intended for educational and informational purposes only. It does not constitute financial advice or recommendations to buy, sell, or hold any financial instruments.
Use at Own Risk: Trading involves substantial risk of loss and is not suitable for all investors. Users of this indicator should exercise caution and conduct their own research and analysis before making any trading decisions.
Performance Not Guaranteed: Past performance is not indicative of future results. While the indicator aims to assist traders in analyzing market trends, there is no guarantee of accuracy or success in trading operations.
🔷 Related Scripts
Range Finder

VolCorrBeta [NariCapitalTrading]Indicator Overview: VolCorrBeta
The VolCorrBeta indicator is designed to analyze and interpret intermarket relationships. This indicator combines volatility, correlation, and beta calculations to provide a comprehensive view of how certain assets (BTC, DXY, CL) influence the ES futures contract (I tailored this indicator to the ES contract, but it will work for any symbol).
Functionality
Input Symbols
BTCUSD : Bitcoin to USD
DXY : US Dollar Index
CL1! : Crude Oil Futures
ES1! : S&P 500 Futures
These symbols can be customized according to user preferences. The main focus of the indicator is to analyze how the price movements of these assets correlate with and lead the price movements of the ES futures contract.
Parameters for Calculation
Correlation Length : Number of periods for calculating the correlation.
Standard Deviation Length : Number of periods for calculating the standard deviation.
Lookback Period for Beta : Number of periods for calculating beta.
Volatility Filter Length : Length of the volatility filter.
Volatility Threshold : Threshold for adjusting the lookback period based on volatility.
Key Calculations
Returns Calculation : Computes the daily returns for each input symbol.
Correlation Calculation : Computes the correlation between each input symbol's returns and the ES futures contract returns over the specified correlation length.
Standard Deviation Calculation : Computes the standard deviation for each input symbol's returns and the ES futures contract returns.
Beta Calculation : Computes the beta for each input symbol relative to the ES futures contract.
Weighted Returns Calculation : Computes the weighted returns based on the calculated betas.
Lead-Lag Indicator : Calculates a lead-lag indicator by averaging the weighted returns.
Volatility Filter : Smooths the lead-lag indicator using a simple moving average.
Price Target Estimation : Estimates the ES price target based on the lead-lag indicator (the yellow line on the chart).
Dynamic Stop Loss (SL) and Take Profit (TP) Levels : Calculates dynamic SL and TP levels using volatility bands.
Signal Generation
The indicator generates buy and sell signals based on the filtered lead-lag indicator and confirms them using higher timeframe analysis. Signals are debounced to reduce frequency, ensuring that only significant signals are considered.
Visualization
Background Coloring : The background color changes based on the buy and sell signals for easy visualization (user can toggle this on/off).
Signal Labels : Labels with arrows are plotted on the chart, showing the signal type (buy/sell), the entry price, TP, and SL levels.
Estimated ES Price Target : The estimated price target for ES futures is plotted on the chart.
Correlation and Beta Dashboard : A table displayed in the top right corner shows the current correlation and beta values for relative to the ES futures contract.
Customization
Traders can customize the following parameters to tailor the indicator to their specific needs:
Input Symbols : Change the symbols for BTC, DXY, CL, and ES.
Correlation Length : Adjust the number of periods used for calculating correlation.
Standard Deviation Length : Adjust the number of periods used for calculating standard deviation.
Lookback Period for Beta : Change the lookback period for calculating beta.
Volatility Filter Length : Modify the length of the volatility filter.
Volatility Threshold : Set a threshold for adjusting the lookback period based on volatility.
Plotting Options : Customize the colors and line widths of the plotted elements.