AI x Meme Impulse Tracker [QuantraSystems]AI x Meme Impulse Tracker
Quantra Systems guarantees that the information created and published within this document and on the Tradingview platform is fully compliant with applicable regulations, does not constitute investment advice, and is not exclusively intended for qualified investors.
Important Note!
The system equity curve presented here has been generated as part of the process of testing and verifying the methodology behind this script.
Crucially, it was developed after the system was conceptualized, designed, and created, which helps to mitigate the risk of overfitting to historical data. In other words, the system was built for robustness, not for simply optimizing past performance.
This ensures that the system is less likely to degrade in performance over time, compared to hyper-optimized systems that are tailored to past data. No tweaks or optimizations were made to this system post-backtest.
Even More Important Note!!
The nature of markets is that they change quickly and unpredictably. Past performance does not guarantee future results - this is a fundamental rule in trading and investing.
While this system is designed with broad, flexible conditions to adapt quickly to a range of market environments, it is essential to understand that no assumptions should be made about future returns based on historical data. Markets are inherently uncertain, and this system - like all trading systems - cannot predict future outcomes.
Introduction
The AI x Meme Impulse Tracker is a cutting-edge, fast-acting rotational algorithm designed to capitalize on the strength of assets within pre-selected categories. Using a custom function built on top of the RSI Pulsar, the system measures momentum through impulses rather than traditional trend following methods. This allows for swifter reallocations based on short bursts of strength.
This system focuses on precision and agility - making it highly adaptable in volatile markets. The strategy is built around three independent asset categories - with allocations only made to the strongest asset in each - ensuring that capital movement (in particular between blockchains) is kept to a minimum for efficiency purposes while maintaining exposure to the highest performing tokens.
Legend
Token Inputs:
The Impulse Tracker is designed with dynamic asset selection - allowing traders to customize the inputs for each category. This feature enables flexible system management, as the number of active tokens within each category can be adjusted at any time. Whether the user chooses the default of 13 tokens per category, or fewer, the system will automatically recalibrate. This ensures that all calculations, from relative strength to individual performance assessments, adjust as required. Disabled tokens are treated by the system as if they don’t exist - seamlessly updating performance metrics and the Impulse Tracker’s allocation behavior to maintain the highest level of efficiency and accuracy.
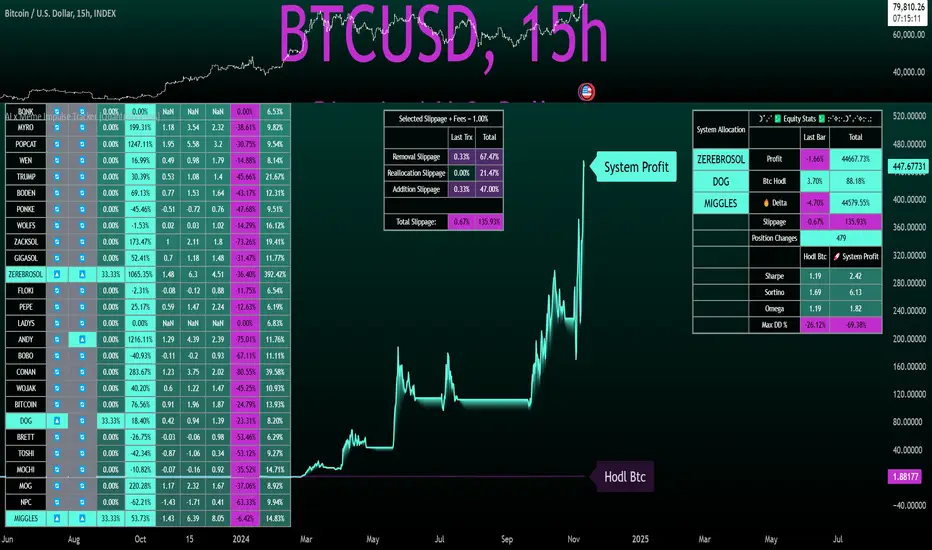
System Equity Curve:
The Impulse Tracker plots both the rotational system’s equity and the Buy-and-Hold (or ‘HODL’) benchmark of Bitcoin for comparison. While the HODL approach allocates the entire portfolio to Bitcoin and functions as an index to compare to, the Impulse Tracker dynamically allocates based on strength impulses within the chosen tokens and categories. The system equity curve is representative of adding an equal capital split between the strongest assets of each category. The relative strength system does handle ‘ties’ of strength - in this situation multiple tokens from a single category can be included in the final equity curve, with the allocated weight to that category split between the tied assets.
TABLES:
Equity Stats:
This table is held in Quantra System's typical UI design language. It offers a comprehensive snapshot of the system’s performance, with key metrics organized to help traders quickly assess both short-term and cumulative results. The left side provides details on individual asset performance, while the right side presents a comparison of the system’s risk-adjusted metrics against a simple BTC Hodl strategy.
The leftmost column of the Equity Stats table showcases performance indicators for the system’s current allocations. This provides quick identification of the current strongest tokens, based on confirmed and non-repainting data as soon as the current opens and the last bar closes.
The right-hand side compares the performance differences between the system and Hodl profits, both on a cumulative basis and analyzing only the previous bar. The total number of position changes is also tracked in this table - an important metric when calculating total slippage and should be used to determine how ‘hands-on’ the strategy will be on the current timeframe.
The lower part of the table highlights a direct comparison of the AI x Memes Impulse strategy with buy-and-hold Bitcoin. The risk adjusted performance ratios, Sharpe, Sortino and Omega, are shown side by side, as well as the maximum drawdown experienced by both strategies within the set testing window.
Screener Table:
This table provides a detailed breakdown of the performance for each asset that has been the strongest in its category at some point and thus received an allocation. The table tracks several key metrics for each asset - including returns, volatility, Sharpe ratio, Sortino ratio, Omega ratio, and maximum drawdown. It also displays the signals for both current and previous periods, as well as the assets weight in the theoretical portfolio. Assets that have never received a signal are also included, giving traders an overview of which assets have contributed to the portfolio's performance and which have not played a role so far.
The position changes cell also offers important insights, as it shows the frequency of not just total position changes, but also rebalancing events.
Detailed Slippage Table:
The Detailed Slippage Table provides a comprehensive breakdown of the calculated slippage and fees incurred throughout the strategy’s operations. It contains several key metrics that give traders a granular view of the costs associated with executing the system:
Selected Slippage - Displays the current slippage rate, as defined in the input menu.
Removal Slippage - This accounts for any slippage or fees incurred when removing an allocation from a token.
Reallocation Slippage - Tracks the slippage or fees when reallocating capital to existing positions.
Addition Slippage - Measures the slippage or fees incurred when allocating capital to new tokens.
Final Slippage - Is the sum of all the individual slippage points and provides a quick view of the total slippage accounted for by the system.
The table is also divided into two columns:
Last Transaction Slippage + Fees - Displays any slippage or fees incurred based on position changes within the current bar.
Total Slippage + Fees - Shows the cumulative slippage and fees incurred since the portfolio’s selected start date.
Visual Customization:
Several customizable features are included within the input menu to enhance user experience. These include custom color palettes, both preloaded and user-selectable. This allows traders to personalize the visual appearance of the tables, ensuring clarity and consistency with their preferred interface themes and background coloring.
Additionally, users can adjust both the position and sizes of all the tables - enabling complete tailoring to the trader’s layout and specific viewing preferences and screen configurations. This level of customization ensures a more intuitive and flexible interaction with the system’s data.
Core Features and Methodologies
Advanced Risk Management - A Unique Filtering Approach:
The Equity Curve Activation Filter introduces an innovative way to dynamically manage capital allocation, aligning with periods of market trend strength. This filter is rooted in the understanding that markets move cyclically - altering between periods trending and mean-reverting periods. This cycle is especially pronounced in the crypto markets, where strong uptrends are often followed by prolonged periods of sideways movements or corrections as participants take profits and momentum fades.
The Cyclical Nature of Markets and Trend Following:
Financial markets do not trend indefinitely. Each uptrend or downtrend, whether over high and low timeframes, tends to culminate in a phase where momentum exhausts - leading to the sideways or corrective phases. This cycle results from the natural dynamics of market participants: during extended trends, more participants jump in, riding the momentum until profit taking causes the trend to slow down or reverse. This cyclical behavior occurs across all timeframes and in all markets - making it essential to adapt trading strategies in attempt to minimize losses during less favorable conditions.
In a trend following system, profitability often mirrors this cyclical pattern. Trend following strategies thrive when markets are moving directionally, capturing gains as price moves with strength in a single direction. However in phases where the market chops sideways, trend following strategies will usually experience drawdowns and reduced returns due to the impersistent nature of any trends. This fluctuation in trend following profitability can actually serve as one of the best coincident indicators of broader market regime change - when profitability begins to fade, it often signals a transition to drawn out unfavorable trend trading conditions.
The Equity Curve as a Market Signal
Within the Impulse Tracker, a continuous equity curve is calculated based upon the system's allocation to the strongest tokens. This equity curve effectively tracks the system’s performance under all market conditions. However, instead of solely relying on the direct performance of the selected tokens, the system applies additional filters to analyze the trend strength of this equity curve itself.
In the same way you only want to purchase an asset that is moving up in price, you only want to allocate capital to a strategy whose equity curve is trending upwards!
The Equity Curve Activation Filter consistently monitors the trend of this equity curve through various filter indicators, such as the “Wave Pendulum Trend”, the “Quasar QSM” and the “MAQSM” (an aggregate of multiple types of averages). These filters help determine whether the equity curve is trending upwards, signaling a favorable period for trend following. When the equity curve is in a positive trend, capital is allocated to the system as normal - allowing it to capture gains during favorable market conditions, Conversely, when the trend weakens and the equity curves begins to stagnate or decline, the activation filter shifts the system into a “cash” positions - temporarily halting allocations in order to prevent market exposure during choppy or mean reverting phases.
Timing Allocation With Market Conditions
This unique filtering approach ensures that the system is primarily active during periods when market trends are most supportive. By aligning capital allocations with the uptrend in trend following profitability, the system is designed to enter during periods of strong momentum and move to cash when momentum with the equity curve wanes. This approach reduces the risk of overtrading in less favorable conditions and preserves capital for the next favorable trend.
In essence the Equity Curve Allocation Filter serves as a dynamic risk management layer that leverages the cyclicality of trend following profitability in order to navigate shifting market phases.
Sensitivity and Signal Responsiveness:
The Quasar Sensitivity Setting allows users to fine-tune the system’s responsiveness to asset signals. High sensitivity settings lead to quicker position changes, making the system highly reactive to short term strength impulses. This is especially useful in fast moving markets where token strength can shift rapidly. The Sensitive setting might be more applicable to higher volatility or lower market cap assets - as the increased volatility increases the necessity of faster position cutting in order to front run the crowd. Of course - a balanced approach is ideal, as if the signals are too fast there will be too many whips and false signals. (And extra fees + slippage!)
The benefit of this script is because of the advanced slippage calculations, false signals are sufficiently punished (unlike systems without fees or slippage) - so it will become immediately apparent if the false signals have a significantly detrimental impact on the system’s equity curve.
Asset specific signals within each category are re-evaluated after the close of each bar to ensure that capital is always allocated to the highest performing asset. If a token’s momentum begins to fade the system swiftly reallocates to the next strongest asset within that category.
Category Filter - Allocates only to the Strongest Asset per group
One of the core innovations of the AI x Meme Impulse Tracker is the customizable Category Filter, which ensures that only the strongest-performing asset within each predefined group receives capital allocation. This approach not only increases the precision of asset selection but also allows traders to tailor the system to specific token narratives or categories. Sectors can include trending themes such as high-attention meme tokens, AI-driven tokens, or even categorize assets by blockchain ecosystems like Ethereum, Solana, or Base chain. This flexibility enables users to align their strategies with the latest market narratives or to optimize for specific groups, focusing on high-beta tokens within well defined sectors for a more targeted exposure. By keeping the focus on category leaders, the system avoids diluting its impact across underperforming assets, thereby maximizing capital efficiency and reducing unnecessary trading costs.
Dynamic Asset Reallocation:
Dynamic reallocation ensures that the system remains nimble and adapts to changing market conditions. Unlike slower systems, the Quasar method continually monitors for changes in asset strength and reallocates capital accordingly - ensuring that the system is always positioned in the highest performing assets within each category.
Position Changes and Slippage:
The Impulse Tracker places a strong emphasis on realistic simulation, prioritizing accuracy over inflated backtest results. This approach ensures that slippage is accounted for in a more aggressive manner than what may be experienced in real-world execution.
Each position change within the system - whether it’s buying, selling, reallocating, or rebalancing between assets - incurs slippage. Slippage is applied to both ends of every transaction: when a position is entered and exited, and when reallocating capital from one token to another. This dynamic behavior is further enhanced by a customizable slippage/fees input, allowing users to simulate realistic transaction costs based on their own market conditions and execution behaviors.
The slippage model works by applying a weighted slippage to the equity curve, taking into account the actual amount of capital being moved. Slippage is not applied in a blanket manner but rather in proportion to the allocation changes. For example, if the system reallocates from a single 100% position to two 50% allocations, slippage will be applied to the 50% removed from the first asset and the 50% added to the new asset, resulting in a 1x slippage multiplier.
This process becomes more granular when multiple assets are involved. For instance, if reallocating from two 50% positions to three 33% positions, slippage will be incurred on each of the changes, but at a reduced rate (⅔ x slippage), reflecting the smaller percentage of portfolio equity being moved. The slippage model accounts for all types of allocation shifts, whether increasing or decreasing the number of tokens held, providing a realistic assessment of system costs.
Here are some detailed examples to illustrate how slippage is calculated based on different scenarios:
100% → 50% / 50%: 1x slippage applied to both position changes (2 allocation changes).
50% / 50% → 33% / 33% / 33%: ⅔ x slippage multiplier applied across 3 allocation changes.
33% / 33% / 33% → 100%: 4/3 x slippage multiplier applied across 3 allocation changes.
In practice, not every position change will be rebalanced perfectly, leading to a lower number of transactions and lower costs in practice. Additionally, with the use of limit orders, a trader can easily reduce the costs of entering a position, as well as ensuring a competitive entry price.
By simulating slippage in this granular manner, the system captures the absolute maximum level of fees and slippage, in order to ensure that backtest results lean towards an underrepresentation - opposed to inflated results compared with practical execution.
A Special Note on Slippage
In the image above, the system has been applied to four different timeframes - 20h, 15h, 10h, and 5h - using identical settings and a selected slippage amount of 2%. By isolating a recent trend leg, we can illustrate an important concept: while the 15h timeframe is more profitable than the 20h timeframe, this difference stems from a core trading principle. Lower timeframes typically provide more data points and allow for quicker entries and exits in a robust system. This often results in reduced downside and compounding of gains.
However, slippage, fees, and execution constraints are limiting factors, especially in volatile, low-cap cryptocurrencies. Although lower timeframes can improve performance by increasing trade frequency, each trade incurs heavy slippage costs that accumulate - impacting the portfolio’s capital at a compounding rate. In this example, the chosen slippage rate of 2% per trade is designed to reflect the realistic trading costs, emphasizing how lower timeframe trading comes at the cost of increased slippage and fees
Finding the optimal balance between timeframe and slippage impact requires careful consideration of factors such as portfolio size, liquidity of selected tokens, execution speed, and the fee rate of the exchange you execute trades on.
Equity Curve and Performance Calculations
To provide a benchmark, the script also generates a Buy-and-Hold (or "HODL") equity curve that represents a complete allocation to Bitcoin. This allows users to easily compare the performance of the dynamic rotation system with that more traditional benchmark strategy.
The script tracks key performance metrics for both the dynamic portfolio and the HODL strategy, including:
Sharpe Ratio
The Sharpe Ratio is a key metric that evaluates a portfolio’s risk-adjusted return by comparing its ‘excess’ return to its volatility. Traditionally, the Sharpe Ratio measures returns relative to a risk-free rate. However, in our system’s calculation, we omit the risk-free rate and instead measure returns above a benchmark of 0%. This adjustment provides a more universal comparison, especially in the context of highly volatile assets like cryptocurrencies, where a traditional risk-free benchmark, such as the usual 3-month T-bills, is often irrelevant or too distant from the realities of the crypto market.
By using 0% as the baseline, we focus purely on the strategy's ability to generate raw returns in the face of market risk, which makes it easier to compare performance across different strategies or asset classes. In an environment like cryptocurrency, where volatility can be extreme, the importance of relative return against a highly volatile backdrop outweighs comparisons to a risk-free rate that bears little resemblance to the risk profile of digital assets.
Sortino Ratio
The Sortino Ratio improves upon the Sharpe Ratio by specifically targeting downside risk and leaves the upside potential untouched. In contrast to the Sharpe Ratio (which penalizes both upside and downside volatility), the Sortino Ratio focuses only on negative return deviations. This makes it a more suitable metric for evaluating strategies like the AI x Meme Impulse Tracker - that aim to minimize drawdowns without restricting upside capture. By measuring returns relative to a 0% baseline, the Sortino ratio provides a clearer assessment of how well the system generates gains while avoiding substantial losses in highly volatile markets like crypto.
Omega Ratio
The Omega Ratio is calculated as the ratio of gains to losses across all return thresholds, providing a more complete view of how the system balances upside and downside risk even compared to the Sortino Ratio. While it achieves a similar outcome to the Sortino Ratio by emphasizing the system's ability to capture gains while limiting losses, it is technically a mathematically superior method. However, we include both the Omega and Sortino ratios in our metric table, as the Sortino Ratio remains more widely recognized and commonly understood by traders and investors of all levels.
Usage Summary:
While the backtests in this description are generated as if a trader held a portfolio of just the strongest tokens, this was mainly designed as a method of logical verification and not a recommended investment strategy. In practice, this system can be used in multiple ways.
It can be used as above, or as a factor in forming part of a broader asset selection system, or even a method of filtering tokens by strength in order to inform a day trader which tokens might be optimal to look for long-only trading setups on an intrabar timeframe.
Final Summary:
The AI x Meme Impulse Tracker is a powerful algorithm that leverages a unique strength and impulse based approach to asset allocation within high beta token categories. Built with a robust risk management framework, the system’s Equity Curve Activation Filter dynamically manages capital exposure based on the cyclical nature of market trends, minimizing exposure during weaker phases.
With highly customizable settings, the Impulse Tracker enables precise capital allocation to only the strongest assets, informed by real-time metrics and rigorous slippage modeling in order to provide the best view of historical profitability. This adaptable design, coupled with advanced performance analytics, makes it a versatile tool for traders seeking an edge in fast moving and volatile crypto markets.
Wyszukaj w skryptach "the strat"
Strategy: Candlestick Wick Analysis with Volume Conditions
This strategy focuses on analyzing the wicks (or shadows) of candlesticks to identify potential trading opportunities based on candlestick structure and volume. Based on these criteria, it places stop orders at the extremities of the wicks when certain conditions are met, thus increasing the chances of capturing significant price movements.
Trading Criteria
Volume Conditions:
The strategy checks if the volume of the current candle is higher than that of the previous three candles. This ensures that the observed price movement is supported by significant volume, increasing the probability that the price will continue in the same direction.
Wick Analysis:
Upper Wick:
If the upper wick of a candle represents more than 90% of its body size and is longer than the lower wick, this indicates that the price tested a resistance level before pulling back.
Order Placement: In this case, a Buy Stop order is placed at the upper extremity of the wick. This means that if the price rises back to this level, the order will be triggered, and the trader will take a buy position.
SL Management: A stop-loss is then placed below the lowest point of the same candle. This protects the trader by limiting losses if the price falls back after the order is triggered.
Lower Wick:
If the lower wick of a candle is longer than the upper wick and represents more than 90% of its body size, this indicates that the price tested a support level before rising.
Order Placement: In this case, a Sell Stop order is placed at the lower extremity of the wick. Thus, if the price drops back to this level, the order will be triggered, and the trader will take a sell position.
SL Management: A stop-loss is then placed above the highest point of the same candle. This ensures risk management by limiting losses if the price rebounds upward after the order is triggered.
Strategy Advantages
Responsiveness to Price Movements: The strategy is designed to detect significant price movements based on the market's reaction around support and resistance levels. By placing stop orders directly at the wick extremities, it allows capturing strong movements in the direction indicated by the candles.
Securing Positions: Using stop-losses positioned just above or below key levels (wicks) provides better risk management. If the market doesn't move as expected, the position is automatically closed with a limited loss.
Clear Visual Indicators: Symbols are displayed on the chart at the points where orders have been placed, making it easier to understand trading decisions. This helps to quickly identify the support or resistance levels tested by the price, as well as potential entry points.
Conclusion
The strategy is based on the idea that large wicks signal areas where buyers or sellers have tested significant price levels before temporarily retreating. By placing stop orders at the extremities of these wicks, the strategy allows capturing price movements when they confirm, while limiting risks through strategically placed stop-losses. It thus offers a balanced approach between capturing potential profit and managing risk.
This description emphasizes the idea of capturing significant market movements with stop orders while providing a clear explanation of the logic and risk management. It’s tailored for publication on TradingView and highlights the robustness of the strategy.

3-Bar (Outside Bar) Scanner with Table Display# 3-Bar (Outside Bar) Scanner with Table Display
## Overview
The **3-Bar (Outside Bar) Scanner with Table Display** is a custom TradingView indicator designed for traders who utilize **The Strat** methodology. This indicator scans for **3-bar (Outside Bar)** patterns across multiple symbols and displays the results in a convenient table format directly on your chart.
## Purpose
- **Efficient Multi-Symbol Scanning**: Monitor up to four symbols simultaneously for 3-bar patterns without the need to switch between charts.
- **Real-Time Updates**: The table dynamically updates with new price data, providing immediate insights into potential trading opportunities.
- **Visual Clarity**: Displays whether a 3-bar is bullish ("3 Up") or bearish ("3 Down"), helping you quickly interpret market sentiment.
## How It Works
- **Data Retrieval**: The indicator uses `request.security()` to fetch high, low, open, and close prices for the specified symbols and timeframe.
- **3-Bar Detection**:
- **Outside Bar Criteria**: Checks if the current candle's high is higher than the previous candle's high and the current low is lower than the previous low.
- **Direction Determination**:
- **"3 Up"**: If the candle closes higher than it opens (bullish candle).
- **"3 Down"**: If the candle closes lower than it opens (bearish candle).
- **Table Display**:
- The table shows the **Symbol**, **Timeframe**, and **State** ("3 Up", "3 Down", or blank if no pattern detected).
- Customizable colors and positioning to fit your chart's aesthetics.
## Best Use Cases
- **Rapid Market Analysis**: Ideal for traders needing a quick overview of multiple assets for potential 3-bar setups.
- **Strategic Decision-Making**: Helps identify key reversal or continuation patterns in alignment with **The Strat** principles.
- **Scalable Monitoring**: By utilizing TradingView's multi-chart layouts, you can expand monitoring beyond four symbols.
## Instructions for Use
### Adding the Indicator to Your Chart
1. **Copy the Code**: Use the provided Pine Script code for the indicator.
2. **Create a New Indicator**:
- In TradingView, click on **Pine Editor** at the bottom of the platform.
- Paste the code into the editor.
3. **Save and Add to Chart**:
- Click **Save** and give your indicator a name.
- Click **Add to Chart** to apply it.
### Customizing the Inputs
- **Symbols**:
- **Symbol 1**: Leave blank to use the current chart's symbol or enter a specific symbol (e.g., `AAPL`).
- **Symbol 2 to Symbol 4**: Enter additional symbols or leave them blank.
- **Timeframe**: Select your desired timeframe (e.g., `D` for Daily, `60` for 60-minute).
- **Table Colors**:
- Customize header and data colors for better visibility against your chart background.
### Interpreting the Table
- **Symbol**: Displays the symbol without the exchange prefix for clarity.
- **Timeframe**: Shows the timeframe applied to the analysis.
- **State**:
- **"3 Up"**: A bullish outside bar where the candle closed higher than it opened.
- **"3 Down"**: A bearish outside bar where the candle closed lower than it opened.
- **Blank**: No 3-bar pattern detected on the latest candle.
### Monitoring More Than Four Symbols
- **Multi-Chart Layout**:
- Use TradingView's multi-chart feature to display multiple charts within a single workspace.
- Apply the indicator to each chart. For example:
- **Four-Chart Grid**: Monitor up to 16 symbols by setting up four charts, each with the indicator tracking four symbols.
- **Steps**:
1. Arrange your workspace into a multi-chart layout.
2. Add the indicator to each chart.
3. Input different symbols into the indicator on each chart.
## Example Usage
Suppose you want to monitor the following symbols on a Daily timeframe:
- **Symbol 1**: *(Leave blank to use the current chart's symbol, e.g., `SPY`)*
- **Symbol 2**: `AAPL`
- **Symbol 3**: `TSLA`
- **Symbol 4**: `AMZN`
After adding the indicator and entering these symbols:
- **SPY**: The table shows "3 Up" in the State column, indicating a bullish outside bar.
- **AAPL**: No 3-bar pattern detected; the State column is blank.
- **TSLA**: The table shows "3 Down," indicating a bearish outside bar.
- **AMZN**: The table shows "3 Up," indicating another bullish outside bar.
This setup allows you to quickly assess which symbols are exhibiting significant patterns that may warrant further analysis or action.
## Notes
- **Customization**: Feel free to adjust the table's position and colors to suit your preferences.
- **Limitations**:
- Be aware of TradingView's limitations on `request.security()` calls, which may vary based on your subscription plan.
- The indicator is designed to monitor up to four symbols per instance due to these limitations.
- **Scalability**:
- By using multi-chart layouts, you can effectively monitor more symbols without overloading a single chart.
- This approach allows you to scale up your monitoring capabilities to fit your trading strategy.
## Conclusion
The **3-Bar (Outside Bar) Scanner with Table Display** is a valuable tool for traders who utilize **The Strat** methodology. It streamlines the process of identifying key 3-bar patterns across multiple symbols and timeframes, enhancing your ability to make informed trading decisions quickly.
By integrating this indicator into your trading routine, you can:
- Stay alert to significant market movements.
- Reduce the time spent manually scanning charts.
- Increase efficiency in executing your trading strategy.
---
Feel free to share this indicator with the Strat community. Feedback and suggestions are welcome to further enhance its functionality. Happy trading!

Strategy CheckListStrategy CheckList
Overview
The Strategy CheckList is a customizable TradingView indicator designed to help traders maintain consistency and discipline in their trading strategies. By providing a visual checklist directly on the chart, this tool ensures that traders can quickly review and confirm their strategy criteria before making trading decisions.
Key Features
- Customizable checklist with up to 6 items
- Adjustable position on the chart (top-right or bottom-right)
- Configurable background and text colors
- Selectable font sizes for optimal visibility
- Interactive checkboxes for each list item
How It Works
1. Users can input up to 6 checklist items representing key aspects of their trading strategy.
2. Each item can be toggled on or off using a checkbox.
3. The checklist is displayed as a table overlay on the chart, allowing for quick reference without obstructing the view of price action.
4. The position, colors, and font size of the checklist can be easily customized to suit individual preferences and chart setups.
Use Cases
- Pre-trade checklist: Ensure all strategy conditions are met before entering a trade
- Risk management: Include reminders about position sizing, stop-loss placement, etc.
- Strategy adherence: Keep key rules visible to avoid impulsive decisions
- Performance improvement: Track adherence to your trading plan over time
Customization Options
- Background color
- Text color
- Font size (small, normal, large, huge)
- Position on chart (top-right, bottom-right)
- Individual checklist items and their checked/unchecked status
Benefits
- Improves trading discipline
- Reduces emotional decision-making
- Enhances strategy consistency
- Serves as a quick reference for complex strategies
- Adaptable to various trading styles and timeframes
This Strategy CheckList indicator is an invaluable tool for traders looking to enhance their decision-making process and maintain consistency in their trading approach. By keeping crucial strategy elements visible and interactive, it promotes disciplined trading and can potentially improve overall trading performance.

Filtered MACD with Backtest [UAlgo]The "Filtered MACD with Backtest " indicator is an advanced trading tool designed for the TradingView platform. It combines the Moving Average Convergence Divergence (MACD) with additional filters such as Moving Average (MA) and Average Directional Index (ADX) to enhance trading signals. This indicator aims to provide more reliable entry and exit points by filtering out noise and confirming trends. Additionally, it includes a comprehensive backtesting module to simulate trading strategies and assess their performance based on historical data. The visual backtest module allows traders to see potential trades directly on the chart, making it easier to evaluate the effectiveness of the strategy.
🔶 Customizable Parameters :
Price Source Selection: Users can choose their preferred price source for calculations, providing flexibility in analysis.
Filter Parameters:
MA Filter: Option to use a Moving Average filter with types such as EMA, SMA, WMA, RMA, and VWMA, and a customizable length.
ADX Filter: Option to use an ADX filter with adjustable length and threshold to determine trend strength.
MACD Parameters: Customizable fast length, slow length, and signal smoothing for the MACD indicator.
Backtest Module:
Entry Type: Supports "Buy and Sell", "Buy", and "Sell" strategies.
Stop Loss Types: Choose from ATR-based, fixed point, or X bar high/low stop loss methods.
Reward to Risk Ratio: Set the desired take profit level relative to the stop loss.
Backtest Visuals: Display entry, stop loss, and take profit levels directly on the chart with
colored backgrounds.
Alerts: Configurable alerts for buy and sell signals.
🔶 Filtered MACD : Understanding How Filters Work with ADX and MA
ADX Filter:
The Average Directional Index (ADX) measures the strength of a trend. The script calculates ADX using the user-defined length and applies a threshold value.
Trading Signals with ADX Filter:
Buy Signal: A regular MACD buy signal (crossover of MACD line above the signal line) is only considered valid if the ADX is above the set threshold. This suggests a stronger uptrend to potentially capitalize on.
Sell Signal: Conversely, a regular MACD sell signal (crossunder of MACD line below the signal line) is only considered valid if the ADX is above the threshold, indicating a stronger downtrend for potential shorting opportunities.
Benefits: The ADX filter helps avoid whipsaws or false signals that might occur during choppy market conditions with weak trends.
MA Filter:
You can choose from various Moving Average (MA) types (EMA, SMA, WMA, RMA, VWMA) for the filter. The script calculates the chosen MA based on the user-defined length.
Trading Signals with MA Filter:
Buy Signal: A regular MACD buy signal is only considered valid if the closing price is above the MA value. This suggests a potential uptrend confirmed by the price action staying above the moving average.
Sell Signal: Conversely, a regular MACD sell signal is only considered valid if the closing price is below the MA value. This suggests a potential downtrend confirmed by the price action staying below the moving average.
Benefits: The MA filter helps identify potential trend continuation opportunities by ensuring the price aligns with the chosen moving average direction.
Combining Filters:
You can choose to use either the ADX filter, the MA filter, or both depending on your strategy preference. Using both filters adds an extra layer of confirmation for your signals.
🔶 Backtesting Module
The backtesting module in this script allows you to visually assess how the filtered MACD strategy would have performed on historical data. Here's a deeper dive into its features:
Backtesting Type: You can choose to backtest for buy signals only, sell signals only, or both. This allows you to analyze the strategy's effectiveness in different market conditions.
Stop-Loss Types: You can define how stop-loss orders are placed:
ATR (Average True Range): This uses a volatility measure (ATR) multiplied by a user-defined factor to set the stop-loss level.
Fixed Point: This allows you to specify a fixed dollar amount or percentage value as the stop-loss.
X bar High/Low: This sets the stop-loss at a certain number of bars (defined by the user) above/below the bar's high (for long positions) or low (for short positions).
Reward-to-Risk Ratio: Define the desired ratio between your potential profit and potential loss on each trade. The backtesting module will calculate take-profit levels based on this ratio and the stop-loss placement.
🔶 Disclaimer:
Use with Caution: This indicator is provided for educational and informational purposes only and should not be considered as financial advice. Users should exercise caution and perform their own analysis before making trading decisions based on the indicator's signals.
Not Financial Advice: The information provided by this indicator does not constitute financial advice, and the creator (UAlgo) shall not be held responsible for any trading losses incurred as a result of using this indicator.
Backtesting Recommended: Traders are encouraged to backtest the indicator thoroughly on historical data before using it in live trading to assess its performance and suitability for their trading strategies.
Risk Management: Trading involves inherent risks, and users should implement proper risk management strategies, including but not limited to stop-loss orders and position sizing, to mitigate potential losses.
No Guarantees: The accuracy and reliability of the indicator's signals cannot be guaranteed, as they are based on historical price data and past performance may not be indicative of future results.

Luxmi AI Ultimate 1 Min Option ScalperThe Luxmi AI Ultimate 1 Min Option Scalper is a specialized trading indicator designed for use in options trading. This tool is particularly focused on providing actionable signals to option buyers within a one-minute timeframe, making it highly suitable for scalping—a trading strategy aimed at profiting from small price changes. Below is an elaboration on how this indicator functions and its significance in trading decisions:
### Key Features of Luxmi AI Ultimate 1 Min Option Scalper
1. **Enter and Don't Signals:**
- **Enter Signals:** These signals indicate the optimal moments to enter a trade, suggesting when to buy an option. They are typically based on sophisticated algorithms that analyze price movements, volume, volatility, and other relevant market data.
- **Don't Signals:** These signals advise traders to refrain from entering a trade. This could be due to market conditions that are not conducive to profitable trading, such as high volatility, low liquidity, or unclear directional trends.
2. **Directional Trading Strategy:**
- The Luxmi AI Ultimate 1 Min Option Scalper focuses on directional trading, which involves making trades based on the expected direction of the market. For option buyers, this means taking positions that profit from upward (call options) or downward (put options) movements in the price of the underlying asset.
3. **Scalping Approach:**
- Scalping is a short-term trading strategy that involves making numerous trades over the course of a trading session, aiming to capitalize on small price changes. The one-minute timeframe is particularly suited for scalping, as it allows traders to quickly enter and exit positions to capture minimal but frequent profits.
### Functionality and Benefits
1. **Real-Time Analysis:**
- The indicator provides real-time analysis and signals, ensuring that traders receive timely information to make quick trading decisions. This is crucial in the fast-paced environment of scalping, where delays can significantly impact profitability.
2. **Automated Decision-Making Support:**
- By automating the signal generation process, the Luxmi AI Ultimate 1 Min Option Scalper helps reduce the cognitive load on traders. This automation can lead to more consistent trading performance, as it mitigates the impact of emotional and psychological factors that often influence human decision-making.
3. **Market Adaptability:**
- The indicator is designed to adapt to changing market conditions, adjusting its signals based on the latest data. This adaptability enhances its effectiveness in various market environments, whether trending, ranging, or highly volatile.
4. **Risk Management:**
- Incorporating "Don't" signals as part of the strategy helps traders avoid entering trades in unfavorable conditions, thereby managing risk more effectively. This feature is particularly valuable in preventing losses and preserving capital.
5. **Educational Value:**
- For less experienced traders, using the Luxmi AI Ultimate 1 Min Option Scalper can provide a learning experience. By observing the signals and their outcomes, traders can develop a better understanding of market dynamics and refine their trading strategies.
### Practical Application
- **Setup:** Traders integrate the Luxmi AI Ultimate 1 Min Option Scalper into their trading platforms. This setup typically involves installing the indicator and configuring it to monitor the specific options and market data relevant to the trader's strategy.
- **Monitoring:** During trading hours, traders monitor the signals provided by the indicator. They prepare to act quickly on "Enter" signals and heed "Don't" signals to avoid unnecessary risks.
- **Execution:** When an "Enter" signal is generated, traders execute the recommended trade, buying the corresponding option. They then manage their positions closely, ready to exit based on their predetermined profit targets or stop-loss levels.
In summary, the Luxmi AI Ultimate 1 Min Option Scalper is a powerful tool for option buyers, providing critical buy and hold signals in a highly time-sensitive manner. Its primary benefits include enhancing decision-making speed, improving trading consistency, and managing risk, all of which are essential for successful scalping in options trading.

GKD-BT Optimizer SCSC Backtest [Loxx]The Giga Kaleidoscope GKD-BT Optimizer SCSC Backtest (Solo Confirmation Super Complex) is a Backtest module included in AlgxTrading's "Giga Kaleidoscope Modularized Trading System." (see the section Giga Kaleidoscope (GKD) Modularized Trading System below for an explanation of the GKD trading system)
**the backtest data rendered to the chart above and all screenshots below use $5 commission per trade and 10% equity per trade with $1 million initial capital**
█ GKD-BT Optimizer SCSC Backtest
The GKD-BT Optimizer SCSC Backtest is a comprehensive backtesting module designed to optimize the combination of key GKD indicators within AlgxTrading's "Giga Kaleidoscope Modularized Trading System." This module facilitates precise strategy refinement by allowing traders to configure and optimize the following critical GKD indicators:
GKD-B Baseline
GKD-V Volatility/Volume
GKD-C Confirmation 1
GKD-C Continuation
Each indicator is equipped with an "Optimizer" mode, enabling dynamic feedback and iterative improvements directly into the backtesting environment. This integrated approach ensures that each component contributes effectively to the overall strategy, providing a robust framework for achieving optimized trading outcomes.
The GKD-BT Optimizer supports granular test configurations including a single take profit and stop loss setting, and allows for targeted testing within specified date ranges to simulate forward testing with historical data. This feature is essential for evaluating the resilience and effectiveness of trading strategies under various market conditions.
Furthermore, the module is designed with user-centric features such as:
Customizable Trading Panel: Displays critical backtest results and trade statistics, which can be shown or hidden as per user preference.
Highlighting Thresholds: Users can set thresholds for Total Percent Wins, Percent Profitable, and Profit Factor, which helps in quickly identifying the most relevant metrics for analysis.
The detailed setup ensures that traders can not only adjust their strategies based on historical performance but also fine-tune their approach to meet specific trading objectives.
🔶 To configure this indicator: ***all GKD indicators listed below are all included in the AlgxTrading trading system package***
1. Add GKD-C Confirmation, GKD-B Baseline, GKD-V Volatility/Volume, and GKD-C Continuation to your chart
2. In the GKD-B Baseline indicator, change "Baseline Type" to "Optimizer"
3. In the GKD-V Volatility/Volume indicator, change "Volatility/Volume Type" to "Optimizer"
4. In the GKD-C Confirmation 1 indicator, change "Confirmation Type" to "Optimizer"
5. In the GKD-C Continuation indicator, change "Confirmation Type" to "Optimizer"
An example of steps 2-5. In the screenshot example below, we change the value "Confirmation Type" in the GKD-C Fisher Transform indicator to "Optimizer"
6. In the GKD-BT Optimizer SCSC Backtest, import the value "Input into NEW GKD-BT Backtest" from the GKD-B Baseline indicator into the field "Import GKD-B Baseline indicator"
7. In the GKD-BT Optimizer SCSC Backtest, import the value "Input into NEW GKD-BT Backtest" from the GKD-V Volatility/Volume indicator into the field "Import GKD-V Volatility/Volume indicator"
8. In the GKD-BT Optimizer SCSC Backtest, import the value "Input into NEW GKD-BT Backtest" from the GKD-C Confirmation 1 indicator into the field "Import GKD-C Confirmation 1 indicator"
9. In the GKD-BT Optimizer SCSC Backtest, import the value "Input into NEW GKD-BT Backtest" from the GKD-C Continuation indicator into the field "Import GKD-C Continuation indicator"
An example of steps 6-9. In the screenshot example below, we import the value "Input into NEW GKD-BT Backtest" from the GKD-C Fisher Transform indicator into the GKD-BT Optimizer SCSC Backtest
10. Decide which of the 5 indicators you wish to optimize in first in the GKD-BT Optimizer SCSC Backtest. Change the value of the import from "Input into NEW GKD-BT Backtest" to "Input into NEW GKD-BT Optimizer Signals"
An example of step 10. In the screenshot example below, we chose to optimize the Confirmation 1 indicator, the GKD-C Fisher Transform. We change the value of the field "Import GKD-C Confirmation 1 indicator" from "Input into NEW GKD-BT Backtest" to "Input into NEW GKD-BT Optimizer Signals"
11. In the GKD-BT Optimizer SCSC Backtest and under the "Optimization Settings", use the dropdown menu "Optimization Indicator" to select the type of indicator you selected from step 12 above: "Baseline", "Volatility/Volume", "Confirmation 1", or "Continuation"
12. In the GKD-BT Optimizer SCSC Backtest and under the "Optimization Settings", import the value "Input into NEW GKD-BT Optimizer Start" from the indicator you selected to optimize in step 12 above into the field "Import Optimization Indicator Start"
13. In the GKD-BT Optimizer SCSC Backtest and under the "Optimization Settings", import the value "Input into NEW GKD-BT Optimizer Skip" from the indicator you selected to optimize in step 12 above into the field "Import Optimization Indicator Skip"
An example of step 11. In the screenshot example below, we select "Confirmation 1" from the "Optimization Indicator" dropdown menu
An example of steps 12 and 13. In the screenshot example below, we import "Import Optimization Indicator Start" and "Import Optimization Indicator Skip" from the GKD-C Fisher Transform indicator into their respective fields
🔶 This backtest includes the following metrics
Net profit: Overall profit or loss achieved.
Total Closed Trades: Total number of closed trades, both winning and losing.
Total Percent Wins: Total wins, whether long or short, for the selected time interval regardless of commissions and other profit-modifying addons.
Percent Profitable: Total wins, whether long or short, that are also profitable, taking commissions into account.
Profit Factor: The ratio of gross profits to gross losses, indicating how much money the strategy made for every unit of money it lost.
Average Profit per Trade: The average gain or loss per trade, calculated by dividing the net profit by the total number of closed trades.
Average Number of Bars in Trade: The average number of bars that elapsed during trades for all closed trades.
🔶 Summary of notable settings not already explained above
🔹 Backtest Properties
These settings define the financial and logistical parameters of the trading simulation, including:
Initial Capital: Specifies the starting balance for the backtest, setting the baseline for measuring profitability and loss.
Order Size: Determines the size of trades, which can be fixed or a percentage of the equity, affecting risk and return.
Order Type: Chooses between fixed contract sizes or a percentage-based order size, allowing for static or dynamic trading volumes.
Commission per Order: Accounts for trading costs, subtracting these from profits to provide a more accurate net performance result.
🔹 Signal Qualifiers
This group of settings establishes criteria related to the strategy's Baseline, and Volatility/Volume indicators in relation to the GKD-C Confirmation 1 indicator, which is crucial for validating trade signals. These include:
Maximum Allowable Post Signal Baseline Cross Bars Back: Sets the maximum number of bars that can elapse after a signal generated by a GKD-C Confirmation 1 indicator triggers. If the GKD-C Confirmation 1 indicator generates a long/short signal that doesn't yet agree with the trend position of the Baseline, then should the Baseline "catch-up" to the long/short trend of the GKD-C Confirmation 1 indicator within the number of bars specified by this setting, then a signal is generated.
Maximum Allowable Post Signal Volatility/Volume Cross Bars Back: Sets the maximum number of bars that can elapse after a signal generated by a GKD-C Confirmation 1 indicator triggers. If the GKD-C Confirmation 1 indicator generates a long/short signal that doesn't yet agree with the position of the Volatility/Volume, then should the Volatility/Volume "catch-up" with the long/short of the GKD-C Confirmation 1 indicator within the number of bars specified by this setting, then a signal is generated.
🔹 Signal Settings
Signal Options: These settings allow users to toggle the visibility of different types of entries based on the strategy criteria, such as standard entries, baseline entries, and continuation entries.
Standard Entry Rules Settings: Detailed criteria for standard entries can be customized here, including conditions on baseline agreement, price within specific zones, and agreement with other confirmation indicators.
1-Candle Rule Standard Entry Rules Settings: Similar to standard entries, but with a focus on conditions that must be met within a one-candle timeframe.
Baseline Entry Rules Settings: Specifies rules for entries based on the baseline, including conditions on confirmation agreement and price zones.
Volatility/Volume Entry Rules Settings: This includes settings for entries based on volatility or volume conditions, with specific rules on confirmation agreement and baseline agreement.
Continuation Entry Rules Settings: This group outlines the conditions for continuation entries, focusing on agreement with baseline and confirmation indicators since the entry signal trigger.
🔹 Volatility Settings
Volatility PnL Settings: Parameters for defining the type of volatility measure to use, its period, and multipliers for profit and stop levels.
Volatility Types Included
Standard Deviation of Logarithmic Returns: Quantifies asset volatility using the standard deviation applied to logarithmic returns, capturing symmetric price movements and financial returns' compound nature.
Exponential Weighted Moving Average (EWMA) for Volatility: Focuses on recent market information by applying exponentially decreasing weights to squared logarithmic returns, offering a dynamic view of market volatility.
Roger-Satchell Volatility Measure: Estimates asset volatility by analyzing the high, low, open, and close prices, providing a nuanced view of intraday volatility and market dynamics.
Close-to-Close Volatility Measure: Calculates volatility based on the closing prices of stocks, offering a streamlined but limited perspective on market behavior.
Parkinson Volatility Measure: Enhances volatility estimation by including high and low prices of the trading day, capturing a more accurate reflection of intraday market movements.
Garman-Klass Volatility Measure: Incorporates open, high, low, and close prices for a comprehensive daily volatility measure, capturing significant price movements and market activity.
Yang-Zhang Volatility Measure: Offers an efficient estimation of stock market volatility by combining overnight and intraday price movements, capturing opening jumps and overall market dynamics.
Garman-Klass-Yang-Zhang Volatility Measure: Merges the benefits of Garman-Klass and Yang-Zhang measures, providing a fuller picture of market volatility including opening market reactions.
Pseudo GARCH(2,2) Volatility Model: Mimics a GARCH(2,2) process using exponential moving averages of squared returns, highlighting volatility shocks and their future impact.
ER-Adaptive Average True Range (ATR): Adjusts the ATR period length based on market efficiency, offering a volatility measure that adapts to changing market conditions.
Adaptive Deviation: Dynamically adjusts its calculation period to offer a nuanced measure of volatility that responds to the market's intrinsic rhythms.
Median Absolute Deviation (MAD): Provides a robust measure of statistical variability, focusing on deviations from the median price, offering resilience against outliers.
Mean Absolute Deviation (MAD): Measures the average magnitude of deviations from the mean price, facilitating a straightforward understanding of volatility.
ATR (Average True Range): Finds the average of true ranges over a specified period, indicating the expected price movement and market volatility.
True Range Double (TRD): Offers a nuanced view of volatility by considering a broader range of price movements, identifying significant market sentiment shifts.
🔹 Other Settings
Backtest Dates: Users can specify the timeframe for the backtest, including start and end dates, as well as the acceptable entry time window.
Volatility Inputs: Additional settings related to volatility calculations, such as static percent, internal filter period for median absolute deviation, and parameters for specific volatility models.
UI Options: Settings to customize the user interface, including table activation, date panel visibility, and aesthetics like color and text size.
Export Options: Allows users to select the type of data to export from the backtest, focusing on metrics like net profit, total closed trades, and average profit per trade.
█ Giga Kaleidoscope (GKD) Modularized Trading System
The GKD Trading System is a comprehensive, algorithmic trading framework from AlgxTrading, designed to optimize trading strategies across various market conditions. It employs a modular approach, incorporating elements such as volatility assessment, trend identification through a baseline, multiple confirmation strategies for signal accuracy, and volume analysis. Key components also include specialized strategies for entry and exit, enabling precise trade execution. The system allows for extensive backtesting, providing traders with the ability to evaluate the effectiveness of their strategies using historical data. Aimed at reducing setup time, the GKD system empowers traders to focus more on strategy refinement and execution, leveraging a wide array of technical indicators for informed decision-making.
🔶 Core components of a GKD Algorithmic Trading System
Each GKD indicator is denoted with a module identifier of either: GKD-BT, GKD-B, GKD-C, GKD-V, GKD-M, or GKD-E. This allows traders to understand to which module each indicator belongs and where each indicator fits into the GKD system. The GKD algorithm is built on the principles of trend, momentum, and volatility. There are eight core components in the GKD trading algorithm:
🔹 Volatility - In the GKD trading system, volatility is used as a part of the system to help determine the appropriate stop loss and take profit levels for a trade. There are 17+ different types of volatility available in the GKD system including Average True Range (ATR), True Range Double (TRD), Close-to-Close, Garman-Klass, and more.
🔹 Baseline (GKD-B) - The baseline is essentially a moving average and is used to determine the overall direction of the market. The baseline in the GKD trading system is used to filter out trades that are not in line with the long-term trend of the market. The baseline is plotted on the chart along with other GKD indicators.
Trades are only taken when the price is in the same direction as the baseline. For example, if the baseline is sloping upwards or price is above the baseline, then only long trades are taken, and if the baseline is sloping downwards or price is below the baseline, then only short trades are taken. This approach helps to ensure that trades are in line with the overall trend of the market, and reduces the risk of entering trades that are likely to fail.
🔹 Confirmation 1, Confirmation 2, Continuation (GKD-C) - The GKD trading system incorporates technical confirmation indicators for the generation of its primary long and short signals, essential for its operation.
The GKD trading system distinguishes three specific categories. The first category, Confirmation 1 , encompasses technical indicators designed to identify trends and generate explicit trading signals. The second category, Confirmation 2 , a technical indicator used to identify trends; this type of indicator is primarily used to filter the Confirmation 1 indicator signals; however, this type of confirmation indicator also generates signals*. Lastly, the Continuation category includes technical indicators used in conjunction with Confirmation 1 and Confirmation 2 to generate a special type of trading signal called a "Continuation"
In a full GKD trading system all three categories generate signals. (see the section “GKD Trading System Signals” below)
🔹 Volatility/Volume (GKD-V) - Volatility/Volume indicators are used to measure the amount of buying and selling activity in a market. They are based on the trading Volatility/Volume of the market, and can provide information about the strength of the trend. In the GKD trading system, Volatility/Volume indicators are used to confirm trading signals generated by the various other GKD indicators. In the GKD trading system, Volatility is a proxy for Volume and vice versa.
Volatility/Volume indicators reduce the risk of false signals and improve the overall profitability of trades. These indicators can provide additional information about the market that is not captured by GKD-C confirmation and GKD-B baseline indicators.
🔹 Exit (GKD-E) - The exit indicator in the GKD system is an indicator that is deemed effective at identifying optimal exit points. The purpose of the exit indicator is to identify when a trend is likely to reverse or when the market conditions have changed, signaling the need to exit a trade. By using an exit indicator, traders can manage their risk and prevent significant losses.
🔹 Backtest (GKD-BT) - The GKD-BT backtest indicators link all other GKD-C, GKD-B, GKD-E, GKD-V, and GKD-M components together to create a GKD trading system. GKD-BT backtests generate signals (see the section “GKD Trading System Signals” below) from the confluence of various GKD indicators that are imported into the GKD-BT backtest. Backtest types include: GKD-BT solo and full GKD backtest strategies used for a single ticker; GKD-BT optimizers used to optimize a single indicator or the full GKD trading system; GKD-BT Multi-ticker used to backtest a single indicator or the full GKD trading system across up to ten tickers; GKD-BT exotic backtests like CC, Baseline, and Giga Stacks used to test confluence between GKD components to then be injected into a core GKD-BT Multi-ticker backtest or single ticker strategy.
🔹 Metamorphosis (GKD-M) ** - The concept of a metamorphosis indicator involves the integration of two or more GKD indicators to generate a compound signal. This is achieved by evaluating the accuracy of each indicator and selecting the signal from the indicator with the highest accuracy. As an illustration, let's consider a scenario where we calculate the accuracy of 10 indicators and choose the signal from the indicator that demonstrates the highest accuracy.
The resulting output from the metamorphosis indicator can then be utilized in a GKD-BT backtest by occupying a slot that aligns with the purpose of the metamorphosis indicator. The slot can be a GKD-B, GKD-C, GKD-E, or GKD-V slot, depending on the specific requirements and objectives of the indicator. This allows for seamless integration and utilization of the compound signal within the GKD-BT framework.
*see the section “GKD Trading System Signals” below
**not a required component of the GKD algorithm
🔶 What does the application of the GKD trading system look like?
Example trading system:
Volatility: Average True Range (ATR) (selectable in all backtests and other related GKD indicators)
GKD-B Baseline: GKD-B Multi-Ticker Baseline using Hull Moving Average
GKD-C Confirmation 1 : GKD-C Advance Trend Pressure
GKD-C Confirmation 2: GKD-C Dorsey Inertia
GKD-C Continuation: GKD-C Stochastic of RSX
GKD-V Volatility/Volume: GKD-V Damiani Volatmeter
GKD-E Exit: GKD-E MFI
GKD-BT Backtest: GKD-BT Multi-Ticker Full GKD Backtest
GKD-M Metamorphosis: GKD-M Baseline Optimizer
**all indicators mentioned above are included in the same AlgxTrading package**
Each module is passed to a GKD-BT backtest module. In the backtest module, all components are combined to formulate trading signals and statistical output. This chaining of indicators requires that each module conform to AlgxTrading's GKD protocol, therefore allowing for the testing of every possible combination of technical indicators that make up the various indictor types in the GKD algorithm.
🔶 GKD Trading System Signals
Standard Entry requires a sequence of conditions including a confirmation signal from GKD-C, baseline agreement, price criteria related to the Goldie Locks Zone, and concurrence from a second confirmation and volatility/volume indicators.
1-Candle Standard Entry introduces a two-phase process where initial conditions must be met, followed by a retraction in price and additional confirmations in the subsequent candle, including baseline, confirmations 1 and 2, and volatility/volume criteria.
Baseline Entry focuses on signals generated by the GKD-B Baseline, requiring agreement from confirmation signals, specific price conditions within the Goldie Locks Zone, and a timing condition related to the confirmation 1 signal.
1-Candle Baseline Entry mirrors the baseline entry but adds a requirement for a price retraction and subsequent confirmations in the following candle, maintaining the focus on the baseline's guidance.
Volatility/Volume Entry is predicated on signals from volatility/volume indicators, requiring support from confirmations, price criteria within the Goldie Locks Zone, baseline agreement, and a timing condition for the confirmation 1 signal.
1-Candle Volatility/Volume Entry adapts the volatility/volume entry to include a phase of initial signal and agreement, followed by a retracement phase that seeks further agreement from the system's components in the subsequent candle.
Confirmation 2 Entry is based on the second confirmation signal, requiring the first confirmation's agreement, specific price criteria, agreement from volatility/volume indicators, and baseline, with a timing condition for the confirmation 1 signal.
1-Candle Confirmation 2 Entry adds a retracement requirement to the confirmation 2 entry, necessitating additional agreements from the system's components in the candle following the signal.
PullBack Entry initiates with a baseline signal and agreement from the first confirmation, with a price condition related to volatility. It then looks for price to return within the Goldie Locks Zone and seeks further agreement from the system's components in the subsequent candle.
Continuation Entry allows for the continuation of an active position, based on a previously triggered entry strategy. It requires that the baseline hasn't crossed since the initial trigger, alongside ongoing agreements from confirmations and the baseline.
█ Conclusion
The GKD-BT Optimizer SCSC Backtest is a critical tool within the Giga Kaleidoscope Modularized Trading System, designed for precise strategy refinement and evaluation within the GKD framework. It enables the optimization and testing of various trading indicators and strategies under different market conditions. The module's design facilitates detailed analysis of individual trading components' performance, allowing for the optimization of indicators like Baseline, Volatility/Volume, Confirmation, and Continuation. This optimization process aids traders in identifying the most effective configurations, thereby enhancing trading outcomes and strategy efficiency within the GKD ecosystem.
█ How to Access
You can see the Author's Instructions below to learn how to get access.

GKD-BT Optimizer Full GKD Backtest [Loxx]The Giga Kaleidoscope GKD-BT Optimizer Full GKD Backtest is a Backtest module included in AlgxTrading's "Giga Kaleidoscope Modularized Trading System." (see the section Giga Kaleidoscope (GKD) Modularized Trading System below for an explanation of the GKD trading system)
**the backtest data rendered to the chart above and all screenshots below use $5 commission per trade and 10% equity per trade with $1 million initial capital**
█ GKD-BT Optimizer Full GKD Backtest
The GKD-BT Optimizer Full GKD Backtest is a comprehensive backtesting module designed to optimize the combination of key GKD indicators within AlgxTrading's "Giga Kaleidoscope Modularized Trading System." This module facilitates precise strategy refinement by allowing traders to configure and optimize the following critical GKD indicators:
GKD-B Baseline
GKD-V Volatility/Volume
GKD-C Confirmation 1
GKD-C Confirmation 2
GKD-C Continuation
Each indicator is equipped with an "Optimizer" mode, enabling dynamic feedback and iterative improvements directly into the backtesting environment. This integrated approach ensures that each component contributes effectively to the overall strategy, providing a robust framework for achieving optimized trading outcomes.
The GKD-BT Optimizer supports granular test configurations including a single take profit and stop loss setting, and allows for targeted testing within specified date ranges to simulate forward testing with historical data. This feature is essential for evaluating the resilience and effectiveness of trading strategies under various market conditions.
Furthermore, the module is designed with user-centric features such as:
Customizable Trading Panel: Displays critical backtest results and trade statistics, which can be shown or hidden as per user preference.
Highlighting Thresholds: Users can set thresholds for Total Percent Wins, Percent Profitable, and Profit Factor, which helps in quickly identifying the most relevant metrics for analysis.
The detailed setup ensures that traders can not only adjust their strategies based on historical performance but also fine-tune their approach to meet specific trading objectives.
🔶 To configure this indicator: ***all GKD indicators listed below are all included in the AlgxTrading trading system package***
1. Add GKD-C Confirmation, GKD-B Baseline, GKD-V Volatility/Volume, GKD-C Confirmation 2, and GKD-C Continuation to your chart
2. In the GKD-B Baseline indicator, change "Baseline Type" to "Optimizer"
3. In the GKD-V Volatility/Volume indicator, change "Volatility/Volume Type" to "Optimizer"
4. In the GKD-C Confirmation 1 indicator, change "Confirmation Type" to "Optimizer"
5. In the GKD-C Confirmation 2 indicator, change "Confirmation Type" to "Optimizer"
6. In the GKD-C Continuation indicator, change "Confirmation Type" to "Optimizer"
An example of steps 2-6. In the screenshot example below, we change the value "Confirmation Type" in the GKD-C Fisher Transform indicator to "Optimizer"
7. In the GKD-BT Optimizer Full GKD Backtest, import the value "Input into NEW GKD-BT Backtest" from the GKD-B Baseline indicator into the field "Import GKD-B Baseline indicator"
8. In the GKD-BT Optimizer Full GKD Backtest, import the value "Input into NEW GKD-BT Backtest" from the GKD-V Volatility/Volume indicator into the field "Import GKD-V Volatility/Volume indicator"
9. In the GKD-BT Optimizer Full GKD Backtest, import the value "Input into NEW GKD-BT Backtest" from the GKD-C Confirmation 1 indicator into the field "Import GKD-C Confirmation 1 indicator"
10. In the GKD-BT Optimizer Full GKD Backtest, import the value "Input into NEW GKD-BT Backtest" from the GKD-C Confirmation 2 indicator into the field "Import GKD-C Confirmation 2 indicator"
11. In the GKD-BT Optimizer Full GKD Backtest, import the value "Input into NEW GKD-BT Backtest" from the GKD-C Continuation indicator into the field "Import GKD-C Continuation indicator"
An example of steps 7-11. In the screenshot example below, we import the value "Input into NEW GKD-BT Backtest" from the GKD-C Coppock Curve indicator into the GKD-BT Optimizer Full GKD Backtest
12. Decide which of the 5 indicators you wish to optimize in first in the GKD-BT Optimizer Full GKD Backtest. Change the value of the import from "Input into NEW GKD-BT Backtest" to "Input into NEW GKD-BT Optimizer Signals"
An example of step 12. In the screenshot example below, we chose to optimize the Confirmation 1 indicator, the GKD-C Fisher Transform. We change the value of the field "Import GKD-C Confirmation 1 indicator" from "Input into NEW GKD-BT Backtest" to "Input into NEW GKD-BT Optimizer Signals"
13. In the GKD-BT Optimizer Full GKD Backtest and under the "Optimization Settings", use the dropdown menu "Optimization Indicator" to select the type of indicator you selected from step 12 above: "Baseline", "Volatility/Volume", "Confirmation 1", "Confirmation 2", or "Continuation"
14. In the GKD-BT Optimizer Full GKD Backtest and under the "Optimization Settings", import the value "Input into NEW GKD-BT Optimizer Start" from the indicator you selected to optimize in step 12 above into the field "Import Optimization Indicator Start"
15. In the GKD-BT Optimizer Full GKD Backtest and under the "Optimization Settings", import the value "Input into NEW GKD-BT Optimizer Skip" from the indicator you selected to optimize in step 12 above into the field "Import Optimization Indicator Skip"
An example of step 13. In the screenshot example below, we select "Confirmation 1" from the "Optimization Indicator" dropdown menu
An example of steps 14 and 15. In the screenshot example below, we import "Import Optimization Indicator Start" and "Import Optimization Indicator Skip" from the GKD-C Fisher Transform indicator into their respective fields
🔶 This backtest includes the following metrics
Net profit: Overall profit or loss achieved.
Total Closed Trades: Total number of closed trades, both winning and losing.
Total Percent Wins: Total wins, whether long or short, for the selected time interval regardless of commissions and other profit-modifying addons.
Percent Profitable: Total wins, whether long or short, that are also profitable, taking commissions into account.
Profit Factor: The ratio of gross profits to gross losses, indicating how much money the strategy made for every unit of money it lost.
Average Profit per Trade: The average gain or loss per trade, calculated by dividing the net profit by the total number of closed trades.
Average Number of Bars in Trade: The average number of bars that elapsed during trades for all closed trades.
🔶 Summary of notable settings not already explained above
🔹 Backtest Properties
These settings define the financial and logistical parameters of the trading simulation, including:
Initial Capital: Specifies the starting balance for the backtest, setting the baseline for measuring profitability and loss.
Order Size: Determines the size of trades, which can be fixed or a percentage of the equity, affecting risk and return.
Order Type: Chooses between fixed contract sizes or a percentage-based order size, allowing for static or dynamic trading volumes.
Commission per Order: Accounts for trading costs, subtracting these from profits to provide a more accurate net performance result.
🔹 Signal Qualifiers
This group of settings establishes criteria related to the strategy's Baseline, Volatility/Volume, and Confirmation 2 indicators in relation to the GKD-C Confirmation 1 indicator, which is crucial for validating trade signals. These include:
Maximum Allowable Post Signal Baseline Cross Bars Back: Sets the maximum number of bars that can elapse after a signal generated by a GKD-C Confirmation 1 indicator triggers. If the GKD-C Confirmation 1 indicator generates a long/short signal that doesn't yet agree with the trend position of the Baseline, then should the Baseline "catch-up" to the long/short trend of the GKD-C Confirmation 1 indicator within the number of bars specified by this setting, then a signal is generated.
Maximum Allowable Post Signal Volatility/Volume Cross Bars Back: Sets the maximum number of bars that can elapse after a signal generated by a GKD-C Confirmation 1 indicator triggers. If the GKD-C Confirmation 1 indicator generates a long/short signal that doesn't yet agree with the position of the Volatility/Volume, then should the Volatility/Volume "catch-up" with the long/short of the GKD-C Confirmation 1 indicator within the number of bars specified by this setting, then a signal is generated.
Maximum Allowable Post Signal Confirmation 2 Cross Bars Back: Sets the maximum number of bars that can elapse after a signal generated by a GKD-C Confirmation 1 indicator triggers. If the GKD-C Confirmation 1 indicator generates a long/short signal that doesn't yet agree with the trend position of the Confirmation 2, then should the Confirmation 2 "catch-up" to the long/short trend of the GKD-C Confirmation 1 indicator within the number of bars specified by this setting, then a signal is generated.
🔹 Signal Settings
Signal Options: These settings allow users to toggle the visibility of different types of entries based on the strategy criteria, such as standard entries, baseline entries, and continuation entries.
Standard Entry Rules Settings: Detailed criteria for standard entries can be customized here, including conditions on baseline agreement, price within specific zones, and agreement with other confirmation indicators.
1-Candle Rule Standard Entry Rules Settings: Similar to standard entries, but with a focus on conditions that must be met within a one-candle timeframe.
Baseline Entry Rules Settings: Specifies rules for entries based on the baseline, including conditions on confirmation agreement and price zones.
Volatility/Volume Entry Rules Settings: This includes settings for entries based on volatility or volume conditions, with specific rules on confirmation agreement and baseline agreement.
Confirmation 2 Entry Rules Settings: Settings here define the rules for entries based on a second confirmation indicator, detailing the required agreements and conditions.
Continuation Entry Rules Settings: This group outlines the conditions for continuation entries, focusing on agreement with baseline and confirmation indicators since the entry signal trigger.
🔹 Volatility Settings
Volatility PnL Settings: Parameters for defining the type of volatility measure to use, its period, and multipliers for profit and stop levels.
Volatility Types Included
Standard Deviation of Logarithmic Returns: Quantifies asset volatility using the standard deviation applied to logarithmic returns, capturing symmetric price movements and financial returns' compound nature.
Exponential Weighted Moving Average (EWMA) for Volatility: Focuses on recent market information by applying exponentially decreasing weights to squared logarithmic returns, offering a dynamic view of market volatility.
Roger-Satchell Volatility Measure: Estimates asset volatility by analyzing the high, low, open, and close prices, providing a nuanced view of intraday volatility and market dynamics.
Close-to-Close Volatility Measure: Calculates volatility based on the closing prices of stocks, offering a streamlined but limited perspective on market behavior.
Parkinson Volatility Measure: Enhances volatility estimation by including high and low prices of the trading day, capturing a more accurate reflection of intraday market movements.
Garman-Klass Volatility Measure: Incorporates open, high, low, and close prices for a comprehensive daily volatility measure, capturing significant price movements and market activity.
Yang-Zhang Volatility Measure: Offers an efficient estimation of stock market volatility by combining overnight and intraday price movements, capturing opening jumps and overall market dynamics.
Garman-Klass-Yang-Zhang Volatility Measure: Merges the benefits of Garman-Klass and Yang-Zhang measures, providing a fuller picture of market volatility including opening market reactions.
Pseudo GARCH(2,2) Volatility Model: Mimics a GARCH(2,2) process using exponential moving averages of squared returns, highlighting volatility shocks and their future impact.
ER-Adaptive Average True Range (ATR): Adjusts the ATR period length based on market efficiency, offering a volatility measure that adapts to changing market conditions.
Adaptive Deviation: Dynamically adjusts its calculation period to offer a nuanced measure of volatility that responds to the market's intrinsic rhythms.
Median Absolute Deviation (MAD): Provides a robust measure of statistical variability, focusing on deviations from the median price, offering resilience against outliers.
Mean Absolute Deviation (MAD): Measures the average magnitude of deviations from the mean price, facilitating a straightforward understanding of volatility.
ATR (Average True Range): Finds the average of true ranges over a specified period, indicating the expected price movement and market volatility.
True Range Double (TRD): Offers a nuanced view of volatility by considering a broader range of price movements, identifying significant market sentiment shifts.
🔹 Other Settings
Backtest Dates: Users can specify the timeframe for the backtest, including start and end dates, as well as the acceptable entry time window.
Volatility Inputs: Additional settings related to volatility calculations, such as static percent, internal filter period for median absolute deviation, and parameters for specific volatility models.
UI Options: Settings to customize the user interface, including table activation, date panel visibility, and aesthetics like color and text size.
Export Options: Allows users to select the type of data to export from the backtest, focusing on metrics like net profit, total closed trades, and average profit per trade.
█ Giga Kaleidoscope (GKD) Modularized Trading System
The GKD Trading System is a comprehensive, algorithmic trading framework from AlgxTrading, designed to optimize trading strategies across various market conditions. It employs a modular approach, incorporating elements such as volatility assessment, trend identification through a baseline, multiple confirmation strategies for signal accuracy, and volume analysis. Key components also include specialized strategies for entry and exit, enabling precise trade execution. The system allows for extensive backtesting, providing traders with the ability to evaluate the effectiveness of their strategies using historical data. Aimed at reducing setup time, the GKD system empowers traders to focus more on strategy refinement and execution, leveraging a wide array of technical indicators for informed decision-making.
🔶 Core components of a GKD Algorithmic Trading System
Each GKD indicator is denoted with a module identifier of either: GKD-BT, GKD-B, GKD-C, GKD-V, GKD-M, or GKD-E. This allows traders to understand to which module each indicator belongs and where each indicator fits into the GKD system. The GKD algorithm is built on the principles of trend, momentum, and volatility. There are eight core components in the GKD trading algorithm:
🔹 Volatility - In the GKD trading system, volatility is used as a part of the system to help determine the appropriate stop loss and take profit levels for a trade. There are 17+ different types of volatility available in the GKD system including Average True Range (ATR), True Range Double (TRD), Close-to-Close, Garman-Klass, and more.
🔹 Baseline (GKD-B) - The baseline is essentially a moving average and is used to determine the overall direction of the market. The baseline in the GKD trading system is used to filter out trades that are not in line with the long-term trend of the market. The baseline is plotted on the chart along with other GKD indicators.
Trades are only taken when the price is in the same direction as the baseline. For example, if the baseline is sloping upwards or price is above the baseline, then only long trades are taken, and if the baseline is sloping downwards or price is below the baseline, then only short trades are taken. This approach helps to ensure that trades are in line with the overall trend of the market, and reduces the risk of entering trades that are likely to fail.
🔹 Confirmation 1, Confirmation 2, Continuation (GKD-C) - The GKD trading system incorporates technical confirmation indicators for the generation of its primary long and short signals, essential for its operation.
The GKD trading system distinguishes three specific categories. The first category, Confirmation 1 , encompasses technical indicators designed to identify trends and generate explicit trading signals. The second category, Confirmation 2 , a technical indicator used to identify trends; this type of indicator is primarily used to filter the Confirmation 1 indicator signals; however, this type of confirmation indicator also generates signals*. Lastly, the Continuation category includes technical indicators used in conjunction with Confirmation 1 and Confirmation 2 to generate a special type of trading signal called a "Continuation"
In a full GKD trading system all three categories generate signals. (see the section “GKD Trading System Signals” below)
🔹 Volatility/Volume (GKD-V) - Volatility/Volume indicators are used to measure the amount of buying and selling activity in a market. They are based on the trading Volatility/Volume of the market, and can provide information about the strength of the trend. In the GKD trading system, Volatility/Volume indicators are used to confirm trading signals generated by the various other GKD indicators. In the GKD trading system, Volatility is a proxy for Volume and vice versa.
Volatility/Volume indicators reduce the risk of false signals and improve the overall profitability of trades. These indicators can provide additional information about the market that is not captured by GKD-C confirmation and GKD-B baseline indicators.
🔹 Exit (GKD-E) - The exit indicator in the GKD system is an indicator that is deemed effective at identifying optimal exit points. The purpose of the exit indicator is to identify when a trend is likely to reverse or when the market conditions have changed, signaling the need to exit a trade. By using an exit indicator, traders can manage their risk and prevent significant losses.
🔹 Backtest (GKD-BT) - The GKD-BT backtest indicators link all other GKD-C, GKD-B, GKD-E, GKD-V, and GKD-M components together to create a GKD trading system. GKD-BT backtests generate signals (see the section “GKD Trading System Signals” below) from the confluence of various GKD indicators that are imported into the GKD-BT backtest. Backtest types include: GKD-BT solo and full GKD backtest strategies used for a single ticker; GKD-BT optimizers used to optimize a single indicator or the full GKD trading system; GKD-BT Multi-ticker used to backtest a single indicator or the full GKD trading system across up to ten tickers; GKD-BT exotic backtests like CC, Baseline, and Giga Stacks used to test confluence between GKD components to then be injected into a core GKD-BT Multi-ticker backtest or single ticker strategy.
🔹 Metamorphosis (GKD-M) ** - The concept of a metamorphosis indicator involves the integration of two or more GKD indicators to generate a compound signal. This is achieved by evaluating the accuracy of each indicator and selecting the signal from the indicator with the highest accuracy. As an illustration, let's consider a scenario where we calculate the accuracy of 10 indicators and choose the signal from the indicator that demonstrates the highest accuracy.
The resulting output from the metamorphosis indicator can then be utilized in a GKD-BT backtest by occupying a slot that aligns with the purpose of the metamorphosis indicator. The slot can be a GKD-B, GKD-C, GKD-E, or GKD-V slot, depending on the specific requirements and objectives of the indicator. This allows for seamless integration and utilization of the compound signal within the GKD-BT framework.
*see the section “GKD Trading System Signals” below
**not a required component of the GKD algorithm
🔶 What does the application of the GKD trading system look like?
Example trading system:
Volatility: Average True Range (ATR) (selectable in all backtests and other related GKD indicators)
GKD-B Baseline: GKD-B Multi-Ticker Baseline using Hull Moving Average
GKD-C Confirmation 1 : GKD-C Advance Trend Pressure
GKD-C Confirmation 2: GKD-C Dorsey Inertia
GKD-C Continuation: GKD-C Stochastic of RSX
GKD-V Volatility/Volume: GKD-V Damiani Volatmeter
GKD-E Exit: GKD-E MFI
GKD-BT Backtest: GKD-BT Multi-Ticker Full GKD Backtest
GKD-M Metamorphosis: GKD-M Baseline Optimizer
**all indicators mentioned above are included in the same AlgxTrading package**
Each module is passed to a GKD-BT backtest module. In the backtest module, all components are combined to formulate trading signals and statistical output. This chaining of indicators requires that each module conform to AlgxTrading's GKD protocol, therefore allowing for the testing of every possible combination of technical indicators that make up the various indictor types in the GKD algorithm.
🔶 GKD Trading System Signals
Standard Entry requires a sequence of conditions including a confirmation signal from GKD-C, baseline agreement, price criteria related to the Goldie Locks Zone, and concurrence from a second confirmation and volatility/volume indicators.
1-Candle Standard Entry introduces a two-phase process where initial conditions must be met, followed by a retraction in price and additional confirmations in the subsequent candle, including baseline, confirmations 1 and 2, and volatility/volume criteria.
Baseline Entry focuses on signals generated by the GKD-B Baseline, requiring agreement from confirmation signals, specific price conditions within the Goldie Locks Zone, and a timing condition related to the confirmation 1 signal.
1-Candle Baseline Entry mirrors the baseline entry but adds a requirement for a price retraction and subsequent confirmations in the following candle, maintaining the focus on the baseline's guidance.
Volatility/Volume Entry is predicated on signals from volatility/volume indicators, requiring support from confirmations, price criteria within the Goldie Locks Zone, baseline agreement, and a timing condition for the confirmation 1 signal.
1-Candle Volatility/Volume Entry adapts the volatility/volume entry to include a phase of initial signal and agreement, followed by a retracement phase that seeks further agreement from the system's components in the subsequent candle.
Confirmation 2 Entry is based on the second confirmation signal, requiring the first confirmation's agreement, specific price criteria, agreement from volatility/volume indicators, and baseline, with a timing condition for the confirmation 1 signal.
1-Candle Confirmation 2 Entry adds a retracement requirement to the confirmation 2 entry, necessitating additional agreements from the system's components in the candle following the signal.
PullBack Entry initiates with a baseline signal and agreement from the first confirmation, with a price condition related to volatility. It then looks for price to return within the Goldie Locks Zone and seeks further agreement from the system's components in the subsequent candle.
Continuation Entry allows for the continuation of an active position, based on a previously triggered entry strategy. It requires that the baseline hasn't crossed since the initial trigger, alongside ongoing agreements from confirmations and the baseline.
█ Conclusion
The GKD-BT Optimizer Full GKD Backtest is a critical tool within the Giga Kaleidoscope Modularized Trading System, designed for precise strategy refinement and evaluation within the GKD framework. It enables the optimization and testing of various trading indicators and strategies under different market conditions. The module's design facilitates detailed analysis of individual trading components' performance, allowing for the optimization of indicators like Baseline, Volatility/Volume, Confirmation, and Continuation. This optimization process aids traders in identifying the most effective configurations, thereby enhancing trading outcomes and strategy efficiency within the GKD ecosystem.
█ How to Access
You can see the Author's Instructions below to learn how to get access.

Volume - Plus / Connectable [Azullian]The connectable volume plus indicator enhances your trading strategy by providing an in-depth analysis of volume data within the connectable indicator system . This tool extends beyond the scope of traditional volume analysis, enabling a comprehensive examination of market trends without the necessity for coding. As part of our range of connectable indicators , it effectively works with TradingView's input source as a signal connector , facilitating a synchronized and interactive approach. Each connectable indicator, including Volume - Plus, contributes signal weight , allowing for a detailed and nuanced analysis which then informs a connectable signal monitor, signal filter, or strategy.
█ DISTINCTIVE FEATURES
Volume - Plus is equipped with features that enhance market analysis:
• Advanced Volume Analysis: Select from sophisticated volume modes like Volume waves and Time segmented volume for comprehensive market insights.
• Customizable Periods & Sources: Adjust the volume calculation settings to align with your specific strategy, using adjustable periods and alternative data sources.
• Versatile Scoring Conditions: Utilize six different thresholds for scoring to create a tailored approach for volume-based signal generation.
• Intuitive Visual Representation: Clear visual cues on volume trends and conditions are displayed directly on your charts, aiding in decision-making.
█ UNIFORM SETTINGS AND A WAY OF WORK
Although connectable indicators may have specific weight scoring conditions, they all aim to follow a standardized general approach to weight scoring settings, as outlined below.
■ Connectable indicators - Settings
• 🗲 Energy: Energy applies an ATR multiplier to the plotted shapes on the chart. A higher value plots shapes farther away from the candle, enhancing visibility.
• ☼ Brightness: Brightness determines the opacity of the shape plotted on the chart, aiding visibility. Indicator weight also influences opacity.
• BC - Bar coloring: Color candles based on your volume settings.
• → Input: Use the input setting to specify a data source for the indicator. Here you can connect the indicator to other indicators.
• ⌥ Flow: Determine where you want to receive signals from:
○ Both: Weights from this indicator and the connected indicator will apply
○ Indicator only: Only weights from this indicator will apply
○ Input only: Only weights from the connected indicator will apply
• ⥅ Weight multiplier: Multiply all weights in the entire indicator by a given factor, useful for quickly testing different indicators in a granular setup.
• ⥇ Threshold: Set a threshold to indicate the minimum amount of weight it should receive to pass it through to the next indicator.
• ⥱ Limiter: Set a hard limit to the maximum amount of weight that can be fed through the indicator.
■ Connectable indicators - Weight scoring settings
▢ Weight scoring conditions
• SM – Signal mode: Enable specific conditions for weight scoring
○ Start: A new trend in volume starting will score
○ End: A new trend in volume ending will score
○ Zone: Continuous scoring for each candle between the start and the end.
• SP – Signal period: Defines a range of candles within which a signal can score.
• SC - Signal count: Specifies the number of bars to retrospectively examine and score.
○ Single: Score for a single occurrence
○ All occurrences: Score for all occurrences
○ Single + Threshold: Score for single occurrences within the signal period (SP)
○ Every + Threshold: Score for all occurrences within the signal period (SP)
▢ Weight scoring direction
• ES: Enter Short weight
• XL: Exit long weight
• EL: Enter Long weight
• XS: Exit Short weight
▢ Weight scoring values
• Weights can hold either positive or negative scores. Positive weights enhance a particular trading direction, while negative weights diminish it.
█ Volume - Plus - INDICATOR SETTINGS
■ Main settings
• Enable/Disable Indicator: Toggle the entire indicator on or off.
• V - Volume mode: Choose between Volume waves and Time segmented volume
• P - Period: Set a period on which the volume is calculated.
• S - Source: Choose an alternative data source for the Volume calculation.
• T - Timeframe: Select an alternative timeframe for the Volume calculation.
• C - Candletype: Choose a candletype for the alternative source.
• B - Scaling bottom: Scale volume to this bottom level
• T - Scaling top: Scale volume to this top level
• A - Moving average type: Filter and smooth with these moving average types (ALMA, EMA, HMA, RMA, SMA, SWMA, VWMA, WMA)
• L - Moving average length: Set the length for the moving average.
• M - Moving average mode: Set the moving average mode
○ Source: Set as source
○ Banded threshold: Make the threshold levels move with a moving average
■ Conditions
Set six thresholds for scoring and determine your own type of scoring mechanism
• Enable/Disable condition: Toggle a condition on or off
• Conditional direction: Choose a direction for scoring
○ Above: Volume breaches the threshold
○ Rising: Volume rises above the threshold
○ Falling: Volume falls under the threshold
○ Crossover: Volume crosses over the threshold
○ Crossunder: Volume crosses under the threshold
• TH: Set a threshold level
• BBN: Set a sentiment for your condition
○ Bullish
○ Bearish
○ Neutral
■ Scoring functionality
• For each threshold you are able to set a sentiment. Sentiment scoring is incorporated in the weight conditions as usual.
█ PLOTTING
• Standard: Symbols (EL, XS, ES, XL) Volume is plotted according to the volume mode in the seperate pane and also with bar coloring on the candle if this option is enabled.
• Conditional Settings: A larger icon appears if global conditions are met. For instance, with a Threshold(⥇) of 12, Signal Period (SP) of 3, and Scoring Condition (SC) set to "EVERY", a volume threshold signaling over two times in 3 candles (scoring 6 each) triggers a larger icon.
█ USAGE OF CONNECTABLE INDICATORS
■ Connectable chaining mechanism
Connectable indicators can be connected directly to the signal monitor, signal filter or strategy , or they can be daisy chained to each other while the last indicator in the chain connects to the signal monitor, signal filter or strategy. When using a signal filter you can chain the filter to the strategy input to make your chain complete.
• Direct chaining: Connect an indicator directly to the signal monitor, signal filter or strategy through the provided inputs (→).
• Daisy chaining: Connect indicators using the indicator input (→). The first in a daisy chain should have a flow (⌥) set to 'Indicator only'. Subsequent indicators use 'Both' to pass the previous weight. The final indicator connects to the signal monitor, signal filter, or strategy.
■ Set up this indicator with a signal filter and strategy
The indicator provides visual cues based on signal conditions. However, its weight system is best utilized when paired with a connectable signal filter, monitor, or strategy .
Let's connect the volume - plus to a connectable signal filter and a strategy :
1. Load all relevant indicators
• Load Volume - Plus / Connectable
• Load Signal filter / Connectable
• Load Strategy / Connectable
2. Signal Filter: Connect the Volume - Plus to the Signal Filter - Plus
• Open the signal filter settings
• Choose one of the five input dropdowns (1→, 2→, 3→, 4→, 5→) and choose : Volume - Plus / Connectable: Signal Connector
• Toggle the enable box before the connected input to enable the incoming signal
3. Signal Filter: Update the filter settings if needed
• The default filter mode for the trading direction is SWING, and is compatible with the default settings in the strategy and indicators.
4. Signal Filter: Update the weight threshold settings if needed
• All connectable indicators load by default with a score of 6 for each direction (EL, XL, ES, XS)
• By default, weight threshold is 'ABOVE' Threshold 1 (TH1) and Threshold 2 (TH2), both set at 5. This allows each occurrence to score, as the default score is 1 point above the threshold.
5. Strategy: Connect the strategy to the signal filter in the strategy settings
• Select a strategy input → and select the Signal filter: Signal connector
6. Strategy: Enable filter compatible directions
• As the default setting of the filter is SWING, we should also set the SM (Strategy mode) to SWING.
Now that everything is connected, you'll notice green spikes in the signal filter representing long signals, and red spikes indicating short signals. Trades will also appear on the chart, complemented by a performance overview. Your journey is just beginning: delve into different scoring mechanisms, merge diverse connectable indicators, and craft unique chains. Instantly test your results and discover the potential of your configurations. Dive deep and enjoy the process!
█ BENEFITS
• Adaptable Modular Design: Arrange indicators in diverse structures via direct or daisy chaining, allowing tailored configurations to align with your analysis approach.
• Streamlined Backtesting: Simplify the iterative process of testing and adjusting combinations, facilitating a smoother exploration of potential setups.
• Intuitive Interface: Navigate TradingView with added ease. Integrate desired indicators, adjust settings, and establish alerts without delving into complex code.
• Signal Weight Precision: Leverage granular weight allocation among signals, offering a deeper layer of customization in strategy formulation.
• Advanced Signal Filtering: Define entry and exit conditions with more clarity, granting an added layer of strategy precision.
• Clear Visual Feedback: Distinct visual signals and cues enhance the readability of charts, promoting informed decision-making.
• Standardized Defaults: Indicators are equipped with universally recognized preset settings, ensuring consistency in initial setups across different types like momentum or volatility.
• Reliability: Our indicators are meticulously developed to prevent repainting. We strictly adhere to TradingView's coding conventions, ensuring our code is both performant and clean.
█ COMPATIBLE INDICATORS
Each indicator that incorporates our open-source 'azLibConnector' library and adheres to our conventions can be effortlessly integrated and used as detailed above.
For clarity and recognition within the TradingView platform, we append the suffix ' / Connectable' to every compatible indicator.
█ COMMON MISTAKES, CLARIFICATIONS AND TIPS
• Removing an indicator from a chain: Deleting a linked indicator and confirming the "remove study tree" alert will also remove all underlying indicators in the object tree. Before removing one, disconnect the adjacent indicators and move it to the object stack's bottom.
• Point systems: The azLibConnector provides 500 points for each direction (EL: Enter long, XL: Exit long, ES: Enter short, XS: Exit short) Remember this cap when devising a point structure.
• Flow misconfiguration: In daisy chains the first indicator should always have a flow (⌥) setting of 'indicator only' while other indicator should have a flow (⌥) setting of 'both'.
• Hide attributes: As connectable indicators send through quite some information you'll notice all the arguments are taking up some screenwidth and cause some visual clutter. You can disable arguments in Chart Settings / Status line.
• Layout and abbreviations: To maintain a consistent structure, we use abbreviations for each input. While this may initially seem complex, you'll quickly become familiar with them. Each abbreviation is also explained in the inline tooltips.
• Inputs: Connecting a connectable indicator directly to the strategy delivers the raw signal without a weight threshold, meaning every signal will trigger a trade.
█ A NOTE OF GRATITUDE
Through years of exploring TradingView and Pine Script, we've drawn immense inspiration from the community's knowledge and innovation. Thank you for being a constant source of motivation and insight.
█ RISK DISCLAIMER
Azullian's content, tools, scripts, articles, and educational offerings are presented purely for educational and informational uses. Please be aware that past performance should not be considered a predictor of future results.

MA - Plus / Connectable [Azullian]
The Moving Average Plus indicator enhances trend analysis by offering refined calculations and a variety of moving average types for sharper insights. As a component of the connectable indicator system on TradingView, it's designed to simplify strategy testing, visualization, and construction, all without requiring coding skills. In line with our suite of connectable indicators , it integrates through TradingView's input source, serving as a signal connector that links different indicators. Each connectable indicator, including the Moving Average Plus, plays a role in contributing signal weight to the system, culminating in an informed output for strategies or signal monitors.
█ DISTINCTIVE FEATURES
The Moving Average Plus indicator brings a set of features to enhance your market analysis:
• Variety of Moving Average Options: Select from multiple moving average types such as ALMA, EMA, HMA, RMA, and SMA, providing flexibility and precision in identifying market trends.
• Customizable Analysis Tools: Tailor the indicator settings to suit your specific analytical needs, enabling a more personalized approach to trend analysis.
• Enhanced Trend Visualization: Visual cues and detailed trend line plotting offer clear insights into market movements, aiding in decision-making processes.
• Integrated Signal Weighting: Utilize the signal weight mechanism for a comprehensive understanding of trend strength and market dynamics.
█ UNIFORM SETTINGS AND A WAY OF WORK
Although connectable indicators may have specific weight scoring conditions, they all aim to follow a standardized general approach to weight scoring settings, as outlined below.
■ Connectable indicators - Settings
• 🗲 Energy: Energy applies an ATR multiplier to the plotted shapes on the chart. A higher value plots shapes farther away from the candle, enhancing visibility.
• ☼ Brightness: Brightness determines the opacity of the shape plotted on the chart, aiding visibility. Indicator weight also influences opacity.
• → Input: Use the input setting to specify a data source for the indicator. Here you can connect the indicator to other indicators.
• ⌥ Flow: Determine where you want to receive signals from:
○ Both: Weights from this indicator and the connected indicator will apply
○ Indicator only: Only weights from this indicator will apply
○ Input only: Only weights from the connected indicator will apply
• ⥅ Weight multiplier: Multiply all weights in the entire indicator by a given factor, useful for quickly testing different indicators in a granular setup.
• ⥇ Threshold: Set a threshold to indicate the minimum amount of weight it should receive to pass it through to the next indicator.
• ⥱ Limiter: Set a hard limit to the maximum amount of weight that can be fed through the indicator.
■ Connectable indicators - Weight scoring settings
▢ Weight scoring conditions
• SM – Signal mode: Enable specific conditions for weight scoring
○ Start: A new trend starting will score
○ End: A trend ending will score
○ Zone: Continuous scoring for each candle between the start and the end.
• SP – Signal period: Defines a range of candles within which a signal can score.
• SC - Signal count: Specifies the number of bars to retrospectively examine and score.
○ Single: Score for a single occurrence
○ All occurrences: Score for all occurrences
○ Single + Threshold: Score for single occurrences within the signal period (SP)
○ Every + Threshold: Score for all occurrences within the signal period (SP)
▢ Weight scoring direction
• ES: Enter Short weight
• XL: Exit long weight
• EL: Enter Long weight
• XS: Exit Short weight
▢ Weight scoring values
• Weights can hold either positive or negative scores. Positive weights enhance a particular trading direction, while negative weights diminish it.
█ MA - Plus - INDICATOR SETTINGS
■ Main settings
• Enable/Disable Indicator: Toggle the entire indicator on or off.
• T - Type: Choose a type of moving average. (ALMA, EMA, HMA, RMA, SMA, SWMA, VWMA, WMA)
• L - Length: Set a period on which the moving average is calculated.
• F - Filter: Set a conditional filter for scoring:
○ Line position: Score bullish when the current trendline is above the next trendline, score bearish when the current trendline is below the next trendline
○ Line direction: Score bullish when the trend line is going up, score bearish when the trendline is going down.
○ Line candle position: Score bullish when the candles are above the current trendline, score bearish when the candles are below the current trendline
○ Any: Score if any of the previously mentioned conditions are true
○ All: Score if all of the previously mentioned conditions are true
• S - Source: Choose an alternative data source for the Moving average calculation.
• T - Timeframe: Select an alternative timeframe for the Moving average calculation.
• C - Candletype: Choose a candletype for the alternative source.
■ Scoring functionality
• For each moving average you'll be able to score Bullish, Bearish or Neutral for each of the conditions as mentioned in the filter above.
█ PLOTTING
• Standard: Symbols (EL, XS, ES, XL) Moving average lines are plotted with bearish, bullish and neutral zones, in the visuals section you can enable plotting by weight which will only show moving average lines to which weight is addressed.
• Conditional Settings: A larger icon appears if global conditions are met. For instance, with a Threshold(⥇) of 12, Signal Period (SP) of 3, and Scoring Condition (SC) set to "EVERY", a moving average signaling over two times in 3 candles (scoring 6 each) triggers a larger icon.
█ USAGE OF CONNECTABLE INDICATORS
■ Connectable chaining mechanism
Connectable indicators can be connected directly to the signal monitor, signal filter or strategy , or they can be daisy chained to each other while the last indicator in the chain connects to the signal monitor, signal filter or strategy. When using a signal filter you can chain the filter to the strategy input to make your chain complete.
• Direct chaining: Connect an indicator directly to the signal monitor, signal filter or strategy through the provided inputs (→).
• Daisy chaining: Connect indicators using the indicator input (→). The first in a daisy chain should have a flow (⌥) set to 'Indicator only'. Subsequent indicators use 'Both' to pass the previous weight. The final indicator connects to the signal monitor, signal filter, or strategy.
■ Set up this indicator with a signal filter and strategy
The indicator provides visual cues based on signal conditions. However, its weight system is best utilized when paired with a connectable signal filter, monitor, or strategy .
Let's connect the MA - Plus to a connectable signal filter and a strategy :
1. Load all relevant indicators
• Load MA - Plus / Connectable
• Load Signal filter / Connectable
• Load Strategy / Connectable
2. Signal Filter: Connect the MA - Plus to the Signal Filter
• Open the signal filter settings
• Choose one of the five input dropdowns (1→, 2→, 3→, 4→, 5→) and choose : MA - Plus / Connectable: Signal Connector
• Toggle the enable box before the connected input to enable the incoming signal
3. Signal Filter: Update the filter settings if needed
• The default filter mode for the trading direction is SWING, and is compatible with the default settings in the strategy and indicators.
4. Signal Filter: Update the weight threshold settings if needed
• All connectable indicators load by default with a score of 6 for each direction (EL, XL, ES, XS)
• By default, weight threshold is 'ABOVE' Threshold 1 (TH1) and Threshold 2 (TH2), both set at 5. This allows each occurrence to score, as the default score is 1 point above the threshold.
5. Strategy: Connect the strategy to the signal filter in the strategy settings
• Select a strategy input → and select the Signal filter: Signal connector
6. Strategy: Enable filter compatible directions
• As the default setting of the filter is SWING, we should also set the SM (Strategy mode) to SWING.
Now that everything is connected, you'll notice green spikes in the signal filter representing long signals, and red spikes indicating short signals. Trades will also appear on the chart, complemented by a performance overview. Your journey is just beginning: delve into different scoring mechanisms, merge diverse connectable indicators, and craft unique chains. Instantly test your results and discover the potential of your configurations. Dive deep and enjoy the process!
█ BENEFITS
• Adaptable Modular Design: Arrange indicators in diverse structures via direct or daisy chaining, allowing tailored configurations to align with your analysis approach.
• Streamlined Backtesting: Simplify the iterative process of testing and adjusting combinations, facilitating a smoother exploration of potential setups.
• Intuitive Interface: Navigate TradingView with added ease. Integrate desired indicators, adjust settings, and establish alerts without delving into complex code.
• Signal Weight Precision: Leverage granular weight allocation among signals, offering a deeper layer of customization in strategy formulation.
• Advanced Signal Filtering: Define entry and exit conditions with more clarity, granting an added layer of strategy precision.
• Clear Visual Feedback: Distinct visual signals and cues enhance the readability of charts, promoting informed decision-making.
• Standardized Defaults: Indicators are equipped with universally recognized preset settings, ensuring consistency in initial setups across different types like momentum or volatility.
• Reliability: Our indicators are meticulously developed to prevent repainting. We strictly adhere to TradingView's coding conventions, ensuring our code is both performant and clean.
█ COMPATIBLE INDICATORS
Each indicator that incorporates our open-source 'azLibConnector' library and adheres to our conventions can be effortlessly integrated and used as detailed above.
For clarity and recognition within the TradingView platform, we append the suffix ' / Connectable' to every compatible indicator.
█ COMMON MISTAKES, CLARIFICATIONS AND TIPS
• Removing an indicator from a chain: Deleting a linked indicator and confirming the "remove study tree" alert will also remove all underlying indicators in the object tree. Before removing one, disconnect the adjacent indicators and move it to the object stack's bottom.
• Point systems: The azLibConnector provides 500 points for each direction (EL: Enter long, XL: Exit long, ES: Enter short, XS: Exit short) Remember this cap when devising a point structure.
• Flow misconfiguration: In daisy chains the first indicator should always have a flow (⌥) setting of 'indicator only' while other indicator should have a flow (⌥) setting of 'both'.
• Hide attributes: As connectable indicators send through quite some information you'll notice all the arguments are taking up some screenwidth and cause some visual clutter. You can disable arguments in Chart Settings / Status line.
• Layout and abbreviations: To maintain a consistent structure, we use abbreviations for each input. While this may initially seem complex, you'll quickly become familiar with them. Each abbreviation is also explained in the inline tooltips.
• Inputs: Connecting a connectable indicator directly to the strategy delivers the raw signal without a weight threshold, meaning every signal will trigger a trade.
█ A NOTE OF GRATITUDE
Through years of exploring TradingView and Pine Script, we've drawn immense inspiration from the community's knowledge and innovation. Thank you for being a constant source of motivation and insight.
█ RISK DISCLAIMER
Azullian's content, tools, scripts, articles, and educational offerings are presented purely for educational and informational uses. Please be aware that past performance should not be considered a predictor of future results.
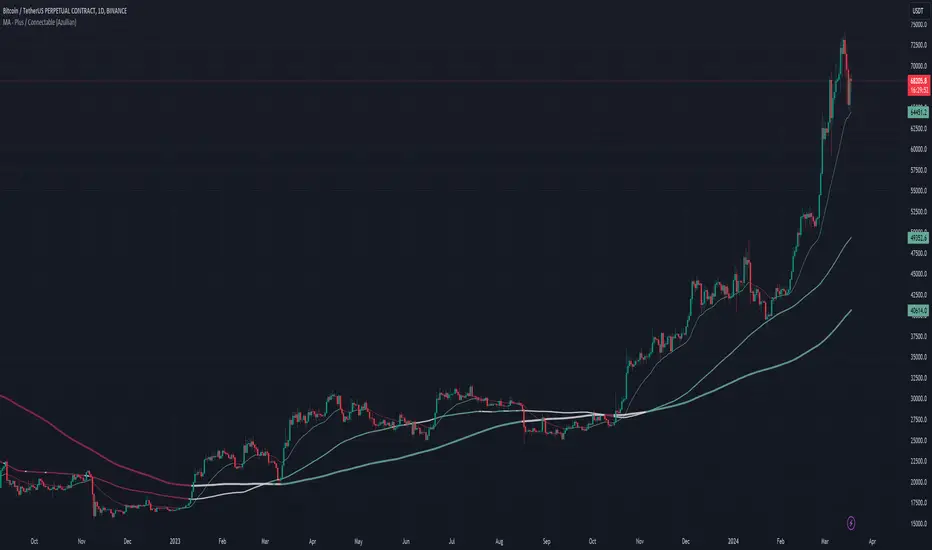
Signal Filter / Connectable [Azullian]The connectable signal filter is an intricate part of an indicator system designed to help test, visualize and build strategy configurations without coding. Like all connectable indicators , it interacts through the TradingView input source, which serves as a signal connector to link indicators to each other. All connectable indicators send signal weight to the next node in the system until it reaches either a connectable signal monitor, signal filter and/or strategy.
The connectable signal filter's function has several roles in the connectable system:
• Input hub: Connect indicators or daisy-chained indicators directly to the filter, manage connections in one place
• Modification: Modify incoming signals by applying smoothing, scaling, or modifiers
• Filtering: Set the trade direction and conditions a signal must adhere to to be passed through
• Visualization: When connected, the signal filter visualizes all incoming signal weights
Let's review the separate parts of this indicator.
█ INPUTS
We've provided 3 inputs for connecting indicators or chains (1→, 2→, 3→) which are all set to 'Close' by default.
An input has several controls:
• Enable disable: Toggle the entire input on or off
• Input: Connect indicators here, choose indicators with a compatible : Signal connector.
• G - Gain: Increase or reduce the strength of the incoming signal by a factor.
█ FILTER SIGNALS
The core of the signal filter , determine a signal direction with the signal mode and determine a threshold (TH).
• ¤ - Trade direction:
○ EL: Send Enter Long signals to the strategy
○ XL: Send Exit Long signals to the strategy
○ ES: Send Enter Short signals to the strategy
○ XS: Send Exit Short signals to the strategy
• TH - Threshold: Define how much weight is needed for a signal to be accepted and passed through to the connectable strategy .
■ VISUALS
• ☼: Brightness % : Set the opacity for the signal curves
• 🡓: ES Color : Set the color for the ES: Entry Short signal
• ⭳: XS Color : Set the color for the XS: Exit Short signal
• ⌥: Plot mode : Set the plotting mode
○ Signals IN: Show all signals
○ Signals OUT: Show only scoring signals
• 🡑: EL Color : Set the color for the EL: Enter Long signal
• ⭱: XL Color : Set the color for the XL: Exit Long signal
█ USAGE OF CONNECTABLE INDICATORS
■ Connectable chaining mechanism
Connectable indicators can be connected directly to the signal monitor, signal filter or strategy , or they can be daisy chained to each other while the last indicator in the chain connects to the signal monitor, signal filter or strategy. When using a signal filter you can chain the filter to the strategy input to make your chain complete.
• Direct chaining: Connect an indicator directly to the signal monitor, signal filter or strategy through the provided inputs (→).
• Daisy chaining: Connect indicators using the indicator input (→). The first in a daisy chain should have a flow (⌥) set to 'Indicator only'. Subsequent indicators use 'Both' to pass the previous weight. The final indicator connects to the signal monitor, signal filter, or strategy.
■ Set up the signal filter with a connectable indicator and strategy
Let's connect the MACD to a connectable signal filter and a strategy :
1. Load all relevant indicators
• Load MACD / Connectable
• Load Signal filter / Connectable
• Load Strategy / Connectable
2. Signal Filter: Connect the MACD to the Signal Filter
• Open the signal filter settings
• Choose one of the three input dropdowns (1→, 2→, 3→) and choose : MACD / Connectable: Signal Connector
• Toggle the enable box before the connected input to enable the incoming signal
3. Signal Filter: Update the filter settings if needed
• The default filter mode for the trading direction is SWING, and is compatible with the default settings in the strategy and indicators.
4. Signal Filter: Update the weight threshold settings if needed
• All connectable indicators load by default with a score of 6 for each direction (EL, XL, ES, XS)
• By default, weight threshold (TH) in the signal filter is set at 5. This allows each occurrence to score, as the default score in each / Connectable indicator is 6 and thus is 1 point above the threshold. Adjust to your liking.
5. Strategy: Connect the strategy to the signal filter in the strategy settings
• Select a strategy input → and select the Signal filter: Signal connector
6. Strategy: Enable filter compatible directions
• As the default setting of the signal filter has enabled EL (Enter Long), XL (Exit Long), ES (Enter Short) and XS (Exit short), the connectable strategy will receive all compatible directions.
Now that everything is connected, you'll notice green spikes in the signal filter representing long signals, and red spikes indicating short signals. Trades will also appear on the chart, complemented by a performance overview. Your journey is just beginning: delve into different scoring mechanisms, merge diverse connectable indicators, and craft unique chains. Instantly test your results and discover the potential of your configurations. Dive deep and enjoy the process!
█ BENEFITS
• Adaptable Modular Design: Arrange indicators in diverse structures via direct or daisy chaining, allowing tailored configurations to align with your analysis approach.
• Streamlined Backtesting: Simplify the iterative process of testing and adjusting combinations, facilitating a smoother exploration of potential setups.
• Intuitive Interface: Navigate TradingView with added ease. Integrate desired indicators, adjust settings, and establish alerts without delving into complex code.
• Signal Weight Precision: Leverage granular weight allocation among signals, offering a deeper layer of customization in strategy formulation.
• Advanced Signal Filtering: Define entry and exit conditions with more clarity, granting an added layer of strategy precision.
• Clear Visual Feedback: Distinct visual signals and cues enhance the readability of charts, promoting informed decision-making.
• Standardized Defaults: Indicators are equipped with universally recognized preset settings, ensuring consistency in initial setups across different types like momentum or volatility.
• Reliability: Our indicators are meticulously developed to prevent repainting. We strictly adhere to TradingView's coding conventions, ensuring our code is both performant and clean.
█ COMPATIBLE INDICATORS
Each indicator that incorporates our open-source 'azLibConnector' library and adheres to our conventions can be effortlessly integrated and used as detailed above.
For clarity and recognition within the TradingView platform, we append the suffix ' / Connectable' to every compatible indicator.
█ COMMON MISTAKES, CLARIFICATIONS AND TIPS
• Removing an indicator from a chain: Deleting a linked indicator and confirming the "remove study tree" alert will also remove all underlying indicators in the object tree. Before removing one, disconnect the adjacent indicators and move it to the object stack's bottom.
• Point systems: The azLibConnector provides 500 points for each direction (EL: Enter long, XL: Exit long, ES: Enter short, XS: Exit short) Remember this cap when devising a point structure.
• Flow misconfiguration: In daisy chains the first indicator should always have a flow (⌥) setting of 'indicator only' while other indicator should have a flow (⌥) setting of 'both'.
• Hide attributes: As connectable indicators send through quite some information you'll notice all the arguments are taking up some screenwidth and cause some visual clutter. You can disable arguments in Chart Settings / Status line.
• Layout and abbreviations: To maintain a consistent structure, we use abbreviations for each input. While this may initially seem complex, you'll quickly become familiar with them. Each abbreviation is also explained in the inline tooltips.
• Inputs: Connecting a connectable indicator directly to the strategy delivers the raw signal without a weight threshold, meaning every signal will trigger a trade.
█ A NOTE OF GRATITUDE
Through years of exploring TradingView and Pine Script, we've drawn immense inspiration from the community's knowledge and innovation. Thank you for being a constant source of motivation and insight.
█ RISK DISCLAIMER
Azullian's content, tools, scripts, articles, and educational offerings are presented purely for educational and informational uses. Please be aware that past performance should not be considered a predictor of future results.
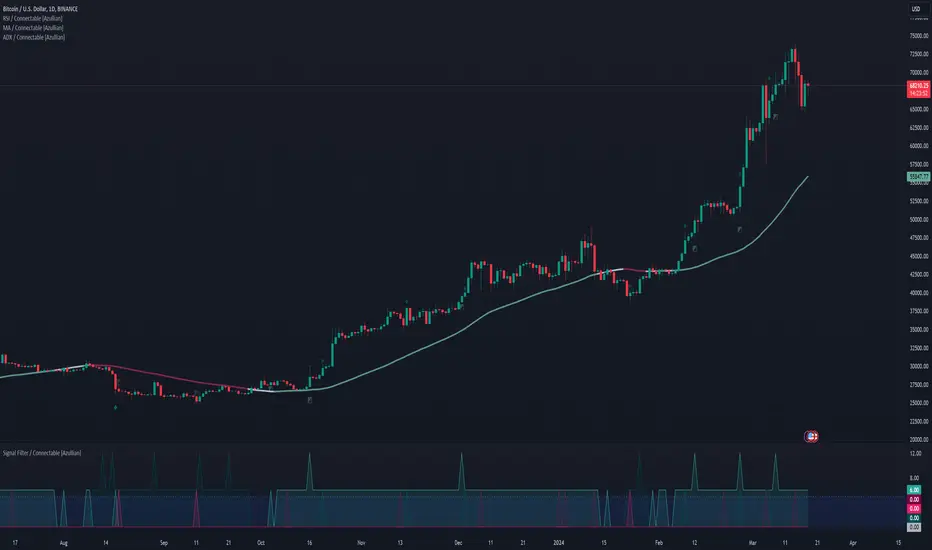
RSI / Connectable [Azullian]Enhance your trading approach with the modular RSI indicator, skilled in identifying market extremes. Simplify pattern visualization and signal weighting for more efficient strategy formulation.
This connectable RSI indicator is part of an indicator system designed to help test, visualize and build strategy configurations without coding. Like all connectable indicators , it interacts through the TradingView input source, which serves as a signal connector to link indicators to each other. All connectable indicators send signal weight to the next node in the system until it reaches either a connectable signal monitor, signal filter and/or strategy.
█ UNIFORM SETTINGS AND A WAY OF WORK
Although connectable indicators may have specific weight scoring conditions, they all aim to follow a standardized general approach to weight scoring settings, as outlined below.
■ Connectable indicators - Settings
• 🗲 Energy: Energy applies an ATR multiplier to the plotted shapes on the chart. A higher value plots shapes farther away from the candle, enhancing visibility.
• ☼ Brightness: Brightness determines the opacity of the shape plotted on the chart, aiding visibility. Indicator weight also influences opacity.
• → Input: Use the input setting to specify a data source for the indicator. Here you can connect the indicator to other indicators.
• ⌥ Flow: Determine where you want to receive signals from:
○ Both: Weights from this indicator and the connected indicator will apply
○ Indicator only: Only weights from this indicator will apply
○ Input only: Only weights from the connected indicator will apply
• ⥅ Weight multiplier: Multiply all weights in the entire indicator by a given factor, useful for quickly testing different indicators in a granular setup.
• ⥇ Threshold: Set a threshold to indicate the minimum amount of weight it should receive to pass it through to the next indicator.
• ⥱ Limiter: Set a hard limit to the maximum amount of weight that can be fed through the indicator.
■ Connectable indicators - Weight scoring settings
▢ Weight scoring conditions
• SM – Signal mode: Enable specific conditions for weight scoring
○ All: All signals will be scored.
○ Entries only: Only entries will score.
○ Exits only: Only exits will score.
○ Entries & exits: Both entries and exits will score.
○ Zone: Continuous scoring for each candle within the zone.
• SP – Signal period: Defines a range of candles within which a signal can score.
• SC - Signal count: Specifies the number of bars to retrospectively examine and score.
○ Single: Score for a single occurrence
○ All occurrences: Score for all occurrences
○ Single + Threshold: Score for single occurrences within the signal period (SP)
○ Every + Threshold: Score for all occurrences within the signal period (SP)
▢ Weight scoring direction
• ES: Enter Short weight
• XL: Exit long weight
• EL: Enter Long weight
• XS: Exit Short weight
▢ Weight scoring values
• Weights can hold either positive or negative scores. Positive weights enhance a particular trading direction, while negative weights diminish it.
■ Entries, exits and zone illustrated on a standard RSI indicator when the RSI is overbought.
█ RSI - INDICATOR SETTINGS
■ Main settings
• Enable/Disable Indicator: Toggle the entire indicator on or off.
• S - Source: Choose an alternative data source for the RSI calculation.
• T - Timeframe: Select an alternative timeframe for the RSI calculation.
• LE - Length: Define the number of bars or periods used in the RSI calculation.
• OB - Overbought Level: Determine the RSI value at which overbought conditions are met.
• OS - Oversold Level: Specify the RSI value at which oversold conditions are met.
■ Scoring functionality
• The RSI scores long entries when the RSI enters OS: oversold area
• The RSI scores long exits when the RSI exits OS: oversold area
• The RSI scores long zones the entire time the RSI is in OS: oversold area
• The RSI scores short entries when the RSI enters OB: overbought area
• The RSI scores short exits when the RSI exits OB: overbought area
• The RSI scores short zones the entire time the RSI is in OB: overbought area
█ PLOTTING
• Standard: Symbols (EL, XS, ES, XL) appear relative to candles based on set conditions. Their opacity and position vary with weight.
• Conditional Settings: A larger icon appears if global conditions are met. For instance, with a Threshold(⥇) of 12, Signal Period (SP) of 3, and Scoring Condition (SC) set to "EVERY", an RSI signaling over two times in 3 candles (scoring 6 each) triggers a larger icon.
█ USAGE OF CONNECTABLE INDICATORS
■ Connectable chaining mechanism
Connectable indicators can be connected directly to the signal monitor, signal filter or strategy , or they can be daisy chained to each other while the last indicator in the chain connects to the signal monitor, signal filter or strategy. When using a signal filter you can chain the filter to the strategy input to make your chain complete.
• Direct chaining: Connect an indicator directly to the signal monitor, signal filter or strategy through the provided inputs (→).
• Daisy chaining: Connect indicators using the indicator input (→). The first in a daisy chain should have a flow (⌥) set to 'Indicator only'. Subsequent indicators use 'Both' to pass the previous weight. The final indicator connects to the signal monitor, signal filter, or strategy.
■ Set up this indicator with a signal filter and strategy
The indicator provides visual cues based on signal conditions. However, its weight system is best utilized when paired with a connectable signal filter, signal monitor, or strategy .
Let's connect the RSI to a connectable signal filter and a strategy :
1. Load all relevant indicators
• Load RSI / Connectable
• Load Signal filter / Connectable
• Load Strategy / Connectable
2. Signal Filter: Connect the RSI to the Signal Filter
• Open the signal filter settings
• Choose one of the three input dropdowns (1→, 2→, 3→) and choose : RSI / Connectable: Signal Connector
• Toggle the enable box before the connected input to enable the incoming signal
3. Signal Filter: Update the filter signals settings if needed
• The default settings of the filter enable EL (Enter Long), XL (Exit Long), ES (Enter Short) and XS (Exit Short).
4. Signal Filter: Update the weight threshold settings if needed
• All connectable indicators load by default with a score of 6 for each direction (EL, XL, ES, XS)
• By default, weight threshold (TH) is set at 5. This allows each occurrence to score, as the default score in each connectable indicator is 1 point above the threshold. Adjust to your liking.
5. Strategy: Connect the strategy to the signal filter in the strategy settings
• Select a strategy input → and select the Signal filter: Signal connector
6. Strategy: Enable filter compatible directions
• Set the signal mode of the strategy to a compatible direction with the signal filter.
Now that everything is connected, you'll notice green spikes in the signal filter representing long signals, and red spikes indicating short signals. Trades will also appear on the chart, complemented by a performance overview. Your journey is just beginning: delve into different scoring mechanisms, merge diverse connectable indicators, and craft unique chains. Instantly test your results and discover the potential of your configurations. Dive deep and enjoy the process!
█ BENEFITS
• Adaptable Modular Design: Arrange indicators in diverse structures via direct or daisy chaining, allowing tailored configurations to align with your analysis approach.
• Streamlined Backtesting: Simplify the iterative process of testing and adjusting combinations, facilitating a smoother exploration of potential setups.
• Intuitive Interface: Navigate TradingView with added ease. Integrate desired indicators, adjust settings, and establish alerts without delving into complex code.
• Signal Weight Precision: Leverage granular weight allocation among signals, offering a deeper layer of customization in strategy formulation.
• Advanced Signal Filtering: Define entry and exit conditions with more clarity, granting an added layer of strategy precision.
• Clear Visual Feedback: Distinct visual signals and cues enhance the readability of charts, promoting informed decision-making.
• Standardized Defaults: Indicators are equipped with universally recognized preset settings, ensuring consistency in initial setups across different types like momentum or volatility.
• Reliability: Our indicators are meticulously developed to prevent repainting. We strictly adhere to TradingView's coding conventions, ensuring our code is both performant and clean.
█ COMPATIBLE INDICATORS
Each indicator that incorporates our open-source 'azLibConnector' library and adheres to our conventions can be effortlessly integrated and used as detailed above.
For clarity and recognition within the TradingView platform, we append the suffix ' / Connectable' to every compatible indicator.
█ COMMON MISTAKES, CLARIFICATIONS AND TIPS
• Removing an indicator from a chain: Deleting a linked indicator and confirming the "remove study tree" alert will also remove all underlying indicators in the object tree. Before removing one, disconnect the adjacent indicators and move it to the object stack's bottom.
• Point systems: The azLibConnector provides 500 points for each direction (EL: Enter long, XL: Exit long, ES: Enter short, XS: Exit short) Remember this cap when devising a point structure.
• Flow misconfiguration: In daisy chains the first indicator should always have a flow (⌥) setting of 'indicator only' while other indicator should have a flow (⌥) setting of 'both'.
• Hide attributes: As connectable indicators send through quite some information you'll notice all the arguments are taking up some screenwidth and cause some visual clutter. You can disable arguments in Chart Settings / Status line.
• Layout and abbreviations: To maintain a consistent structure, we use abbreviations for each input. While this may initially seem complex, you'll quickly become familiar with them. Each abbreviation is also explained in the inline tooltips.
• Inputs: Connecting a connectable indicator directly to the strategy delivers the raw signal without a weight threshold, meaning every signal will trigger a trade.
█ A NOTE OF GRATITUDE
Through years of exploring TradingView and Pine Script, we've drawn immense inspiration from the community's knowledge and innovation. Thank you for being a constant source of motivation and insight.
█ RISK DISCLAIMER
Azullian's content, tools, scripts, articles, and educational offerings are presented purely for educational and informational uses. Please be aware that past performance should not be considered a predictor of future results.

MA / Connectable [Azullian]Streamline trend analysis with the Moving Average indicator. Filter out market noise, aiding in the clear identification of market directions for dynamic strategy development.
This connectable moving average indicator is part of an indicator system designed to help test, visualize and build strategy configurations without coding. Like all connectable indicators , it interacts through the TradingView input source, which serves as a signal connector to link indicators to each other. All connectable indicators send signal weight to the next node in the system until it reaches either a connectable signal monitor, signal filter and/or strategy.
█ UNIFORM SETTINGS AND A WAY OF WORK
Although connectable indicators may have specific weight scoring conditions, they all aim to follow a standardized general approach to weight scoring settings, as outlined below.
■ Connectable indicators - Settings
• 🗲 Energy: Energy applies an ATR multiplier to the plotted shapes on the chart. A higher value plots shapes farther away from the candle, enhancing visibility.
• ☼ Brightness: Brightness determines the opacity of the shape plotted on the chart, aiding visibility. Indicator weight also influences opacity.
• → Input: Use the input setting to specify a data source for the indicator. Here you can connect the indicator to other indicators.
• ⌥ Flow: Determine where you want to receive signals from:
○ Both: Weights from this indicator and the connected indicator will apply
○ Indicator only: Only weights from this indicator will apply
○ Input only: Only weights from the connected indicator will apply
• ⥅ Weight multiplier: Multiply all weights in the entire indicator by a given factor, useful for quickly testing different indicators in a granular setup.
• ⥇ Threshold: Set a threshold to indicate the minimum amount of weight it should receive to pass it through to the next indicator.
• ⥱ Limiter: Set a hard limit to the maximum amount of weight that can be fed through the indicator.
■ Connectable indicators - Weight scoring settings
▢ Weight scoring conditions
• SM – Signal mode: Enable specific conditions for weight scoring
○ Start: A new trend starting will score
○ End: A trend ending will score
○ Zone: Continuous scoring for each candle between the start and the end.
• SP – Signal period: Defines a range of candles within which a signal can score.
• SC - Signal count: Specifies the number of bars to retrospectively examine and score.
○ Single: Score for a single occurrence
○ All occurrences: Score for all occurrences
○ Single + Threshold: Score for single occurrences within the signal period (SP)
○ Every + Threshold: Score for all occurrences within the signal period (SP)
▢ Weight scoring direction
• ES: Enter Short weight
• XL: Exit long weight
• EL: Enter Long weight
• XS: Exit Short weight
▢ Weight scoring values
• Weights can hold either positive or negative scores. Positive weights enhance a particular trading direction, while negative weights diminish it.
█ MA - INDICATOR SETTINGS
■ Main settings
• Enable/Disable Indicator: Toggle the entire indicator on or off.
• T - Type: Choose a type of moving average. (ALMA, EMA, HMA, RMA, SMA, SWMA, VWMA, WMA)
• L - Length: Set a period on which the moving average is calculated.
• F - Filter: Set a conditional filter for scoring:
○ Line direction: Score bullish when the trend line is going up, score bearish when the trendline is going down.
○ Line candle position: Score bullish when the candles are above the current trendline, score bearish when the candles are below the current trendline
○ Any: Score if any of the previously mentioned conditions are true
○ All: Score if all of the previously mentioned conditions are true
• S - Source: Choose an alternative data source for the Moving average calculation.
• T - Timeframe: Select an alternative timeframe for the Moving average calculation.
• C - Candletype: Choose a candletype for the alternative source.
■ Scoring functionality
• For each moving average you'll be able to score Bullish, Bearish or Neutral for each of the conditions as mentioned in the filter above.
█ PLOTTING
• Standard: Symbols (EL, XS, ES, XL) Moving average lines are plotted with bearish, bullish and neutral zones, in the visuals section you can enable plotting by weight which will only show the parts of the moving average line to which weight is addressed.
• Conditional Settings: A larger icon appears if global conditions are met. For instance, with a Threshold(⥇) of 12, Signal Period (SP) of 3, and Scoring Condition (SC) set to "EVERY", a moving average signaling over two times in 3 candles (scoring 6 each) triggers a larger icon.
█ USAGE OF CONNECTABLE INDICATORS
■ Connectable chaining mechanism
Connectable indicators can be connected directly to the signal monitor, signal filter or strategy , or they can be daisy chained to each other while the last indicator in the chain connects to the signal monitor, signal filter or strategy. When using a signal filter you can chain the filter to the strategy input to make your chain complete.
• Direct chaining: Connect an indicator directly to the signal monitor, signal filter or strategy through the provided inputs (→).
• Daisy chaining: Connect indicators using the indicator input (→). The first in a daisy chain should have a flow (⌥) set to 'Indicator only'. Subsequent indicators use 'Both' to pass the previous weight. The final indicator connects to the signal monitor, signal filter, or strategy.
■ Set up this indicator with a signal filter and strategy
The indicator provides visual cues based on signal conditions. However, its weight system is best utilized when paired with a connectable signal filter, signal monitor, or strategy .
Let's connect the MA to a connectable signal filter and a strategy :
1. Load all relevant indicators
• Load MA / Connectable
• Load Signal filter / Connectable
• Load Strategy / Connectable
2. Signal Filter: Connect the MA to the Signal Filter
• Open the signal filter settings
• Choose one of the three input dropdowns (1→, 2→, 3→) and choose : MA / Connectable: Signal Connector
• Toggle the enable box before the connected input to enable the incoming signal
3. Signal Filter: Update the filter signals settings if needed
• The default settings of the filter enable EL (Enter Long), XL (Exit Long), ES (Enter Short) and XS (Exit Short).
4. Signal Filter: Update the weight threshold settings if needed
• All connectable indicators load by default with a score of 6 for each direction (EL, XL, ES, XS)
• By default, weight threshold (TH) is set at 5. This allows each occurrence to score, as the default score in each connectable indicator is 1 point above the threshold. Adjust to your liking.
5. Strategy: Connect the strategy to the signal filter in the strategy settings
• Select a strategy input → and select the Signal filter: Signal connector
6. Strategy: Enable filter compatible directions
• Set the signal mode of the strategy to a compatible direction with the signal filter.
Now that everything is connected, you'll notice green spikes in the signal filter representing long signals, and red spikes indicating short signals. Trades will also appear on the chart, complemented by a performance overview. Your journey is just beginning: delve into different scoring mechanisms, merge diverse connectable indicators, and craft unique chains. Instantly test your results and discover the potential of your configurations. Dive deep and enjoy the process!
█ BENEFITS
• Adaptable Modular Design: Arrange indicators in diverse structures via direct or daisy chaining, allowing tailored configurations to align with your analysis approach.
• Streamlined Backtesting: Simplify the iterative process of testing and adjusting combinations, facilitating a smoother exploration of potential setups.
• Intuitive Interface: Navigate TradingView with added ease. Integrate desired indicators, adjust settings, and establish alerts without delving into complex code.
• Signal Weight Precision: Leverage granular weight allocation among signals, offering a deeper layer of customization in strategy formulation.
• Advanced Signal Filtering: Define entry and exit conditions with more clarity, granting an added layer of strategy precision.
• Clear Visual Feedback: Distinct visual signals and cues enhance the readability of charts, promoting informed decision-making.
• Standardized Defaults: Indicators are equipped with universally recognized preset settings, ensuring consistency in initial setups across different types like momentum or volatility.
• Reliability: Our indicators are meticulously developed to prevent repainting. We strictly adhere to TradingView's coding conventions, ensuring our code is both performant and clean.
█ COMPATIBLE INDICATORS
Each indicator that incorporates our open-source 'azLibConnector' library and adheres to our conventions can be effortlessly integrated and used as detailed above.
For clarity and recognition within the TradingView platform, we append the suffix ' / Connectable' to every compatible indicator.
█ COMMON MISTAKES, CLARIFICATIONS AND TIPS
• Removing an indicator from a chain: Deleting a linked indicator and confirming the "remove study tree" alert will also remove all underlying indicators in the object tree. Before removing one, disconnect the adjacent indicators and move it to the object stack's bottom.
• Point systems: The azLibConnector provides 500 points for each direction (EL: Enter long, XL: Exit long, ES: Enter short, XS: Exit short) Remember this cap when devising a point structure.
• Flow misconfiguration: In daisy chains the first indicator should always have a flow (⌥) setting of 'indicator only' while other indicator should have a flow (⌥) setting of 'both'.
• Hide attributes: As connectable indicators send through quite some information you'll notice all the arguments are taking up some screenwidth and cause some visual clutter. You can disable arguments in Chart Settings / Status line.
• Layout and abbreviations: To maintain a consistent structure, we use abbreviations for each input. While this may initially seem complex, you'll quickly become familiar with them. Each abbreviation is also explained in the inline tooltips.
• Inputs: Connecting a connectable indicator directly to the strategy delivers the raw signal without a weight threshold, meaning every signal will trigger a trade.
█ A NOTE OF GRATITUDE
Through years of exploring TradingView and Pine Script, we've drawn immense inspiration from the community's knowledge and innovation. Thank you for being a constant source of motivation and insight.
█ RISK DISCLAIMER
Azullian's content, tools, scripts, articles, and educational offerings are presented purely for educational and informational uses. Please be aware that past performance should not be considered a predictor of future results.

KDJ / Connectable [Azullian]Enhance your analysis with our KDJ. Oscillate through buying and selling signals seamlessly, identifying potential reversals with accuracy.
This connectable KDJ indicator is part of an indicator system designed to help test, visualize and build strategy configurations without coding. Like all connectable indicators , it interacts through the TradingView input source, which serves as a signal connector to link indicators to each other. All connectable indicators send signal weight to the next node in the system until it reaches either a connectable signal monitor, signal filter and/or strategy.
█ UNIFORM SETTINGS AND A WAY OF WORK
Although connectable indicators may have specific weight scoring conditions, they all aim to follow a standardized general approach to weight scoring settings, as outlined below.
■ Connectable indicators - Settings
• 🗲 Energy: Energy applies an ATR multiplier to the plotted shapes on the chart. A higher value plots shapes farther away from the candle, enhancing visibility.
• ☼ Brightness: Brightness determines the opacity of the shape plotted on the chart, aiding visibility. Indicator weight also influences opacity.
• → Input: Use the input setting to specify a data source for the indicator. Here you can connect the indicator to other indicators.
• ⌥ Flow: Determine where you want to receive signals from:
○ Both: Weights from this indicator and the connected indicator will apply
○ Indicator only: Only weights from this indicator will apply
○ Input only: Only weights from the connected indicator will apply
• ⥅ Weight multiplier: Multiply all weights in the entire indicator by a given factor, useful for quickly testing different indicators in a granular setup.
• ⥇ Threshold: Set a threshold to indicate the minimum amount of weight it should receive to pass it through to the next indicator.
• ⥱ Limiter: Set a hard limit to the maximum amount of weight that can be fed through the indicator.
■ Connectable indicators - Weight scoring settings
▢ Weight scoring conditions
• SM – Signal mode: Enable specific conditions for weight scoring
○ All: All signals will be scored.
○ Entries only: Only entries will score.
○ Exits only: Only exits will score.
○ Entries & exits: Both entries and exits will score.
○ Zone: Continuous scoring for each candle within the zone.
• SP – Signal period: Defines a range of candles within which a signal can score.
• SC - Signal count: Specifies the number of bars to retrospectively examine and score.
○ Single: Score for a single occurrence
○ All occurrences: Score for all occurrences
○ Single + Threshold: Score for single occurrences within the signal period (SP)
○ Every + Threshold: Score for all occurrences within the signal period (SP)
▢ Weight scoring direction
• ES: Enter Short weight
• XL: Exit long weight
• EL: Enter Long weight
• XS: Exit Short weight
▢ Weight scoring values
• Weights can hold either positive or negative scores. Positive weights enhance a particular trading direction, while negative weights diminish it.
█ KDJ - INDICATOR SETTINGS
■ Main settings
• Enable/Disable Indicator: Toggle the entire indicator on or off.
• S - Source: Choose an alternative data source for the KDJ calculation.
• T - Timeframe: Select an alternative timeframe for the KDJ calculation.
• P - Period: Define the number of bars or periods used in the KDJ calculation.
• SL - Signal line: Adjust the smoothing factor for the KDJ's J line. This not only offers clearer buy/sell cues by reducing market noise but also determines the precise points for potential crossovers and crossunders.
■ Scoring functionality
• The KDJ scores long entries when the J line crosses over the signal (SL) line.
• The KDJ scores long exits when the J line crosses under the signal (SL) line after a prior crossover.
• The KDJ scores long zones the entire time the J line is above the signal (SL) line.
• The KDJ scores short entries when the J line crosses under the signal (SL) line.
• The KDJ scores short exits when the J line crosses over the signal (SL) line after a prior crossunder.
• The KDJ scores short zones the entire time the J line is below the signal (SL) line.
█ PLOTTING
• Standard: Symbols (EL, XS, ES, XL) appear relative to candles based on set conditions. Their opacity and position vary with weight.
• Conditional Settings: A larger icon appears if global conditions are met. For instance, with a Threshold(⥇) of 12, Signal Period (SP) of 3, and Scoring Condition (SC) set to "EVERY", an KDJ signaling over two times in 3 candles (scoring 6 each) triggers a larger icon.
█ USAGE OF CONNECTABLE INDICATORS
■ Connectable chaining mechanism
Connectable indicators can be connected directly to the signal monitor, signal filter or strategy , or they can be daisy chained to each other while the last indicator in the chain connects to the signal monitor, signal filter or strategy. When using a signal filter you can chain the filter to the strategy input to make your chain complete.
• Direct chaining: Connect an indicator directly to the signal monitor, signal filter or strategy through the provided inputs (→).
• Daisy chaining: Connect indicators using the indicator input (→). The first in a daisy chain should have a flow (⌥) set to 'Indicator only'. Subsequent indicators use 'Both' to pass the previous weight. The final indicator connects to the signal monitor, signal filter, or strategy.
■ Set up this indicator with a signal filter and strategy
The indicator provides visual cues based on signal conditions. However, its weight system is best utilized when paired with a connectable signal filter, signal monitor, or strategy .
Let's connect the KDJ to a connectable signal filter and a strategy :
1. Load all relevant indicators
• Load KDJ / Connectable
• Load Signal filter / Connectable
• Load Strategy / Connectable
2. Signal Filter: Connect the KDJ to the Signal Filter
• Open the signal filter settings
• Choose one of the three input dropdowns (1→, 2→, 3→) and choose : KDJ / Connectable: Signal Connector
• Toggle the enable box before the connected input to enable the incoming signal
3. Signal Filter: Update the filter signals settings if needed
• The default settings of the filter enable EL (Enter Long), XL (Exit Long), ES (Enter Short) and XS (Exit Short).
4. Signal Filter: Update the weight threshold settings if needed
• All connectable indicators load by default with a score of 6 for each direction (EL, XL, ES, XS)
• By default, weight threshold (TH) is set at 5. This allows each occurrence to score, as the default score in each connectable indicator is 1 point above the threshold. Adjust to your liking.
5. Strategy: Connect the strategy to the signal filter in the strategy settings
• Select a strategy input → and select the Signal filter: Signal connector
6. Strategy: Enable filter compatible directions
• Set the signal mode of the strategy to a compatible direction with the signal filter.
Now that everything is connected, you'll notice green spikes in the signal filter representing long signals, and red spikes indicating short signals. Trades will also appear on the chart, complemented by a performance overview. Your journey is just beginning: delve into different scoring mechanisms, merge diverse connectable indicators, and craft unique chains. Instantly test your results and discover the potential of your configurations. Dive deep and enjoy the process!
█ BENEFITS
• Adaptable Modular Design: Arrange indicators in diverse structures via direct or daisy chaining, allowing tailored configurations to align with your analysis approach.
• Streamlined Backtesting: Simplify the iterative process of testing and adjusting combinations, facilitating a smoother exploration of potential setups.
• Intuitive Interface: Navigate TradingView with added ease. Integrate desired indicators, adjust settings, and establish alerts without delving into complex code.
• Signal Weight Precision: Leverage granular weight allocation among signals, offering a deeper layer of customization in strategy formulation.
• Advanced Signal Filtering: Define entry and exit conditions with more clarity, granting an added layer of strategy precision.
• Clear Visual Feedback: Distinct visual signals and cues enhance the readability of charts, promoting informed decision-making.
• Standardized Defaults: Indicators are equipped with universally recognized preset settings, ensuring consistency in initial setups across different types like momentum or volatility.
• Reliability: Our indicators are meticulously developed to prevent repainting. We strictly adhere to TradingView's coding conventions, ensuring our code is both performant and clean.
█ COMPATIBLE INDICATORS
Each indicator that incorporates our open-source 'azLibConnector' library and adheres to our conventions can be effortlessly integrated and used as detailed above.
For clarity and recognition within the TradingView platform, we append the suffix ' / Connectable' to every compatible indicator.
█ COMMON MISTAKES, CLARIFICATIONS AND TIPS
• Removing an indicator from a chain: Deleting a linked indicator and confirming the "remove study tree" alert will also remove all underlying indicators in the object tree. Before removing one, disconnect the adjacent indicators and move it to the object stack's bottom.
• Point systems: The azLibConnector provides 500 points for each direction (EL: Enter long, XL: Exit long, ES: Enter short, XS: Exit short) Remember this cap when devising a point structure.
• Flow misconfiguration: In daisy chains the first indicator should always have a flow (⌥) setting of 'indicator only' while other indicator should have a flow (⌥) setting of 'both'.
• Hide attributes: As connectable indicators send through quite some information you'll notice all the arguments are taking up some screenwidth and cause some visual clutter. You can disable arguments in Chart Settings / Status line.
• Layout and abbreviations: To maintain a consistent structure, we use abbreviations for each input. While this may initially seem complex, you'll quickly become familiar with them. Each abbreviation is also explained in the inline tooltips.
• Inputs: Connecting a connectable indicator directly to the strategy delivers the raw signal without a weight threshold, meaning every signal will trigger a trade.
█ A NOTE OF GRATITUDE
Through years of exploring TradingView and Pine Script, we've drawn immense inspiration from the community's knowledge and innovation. Thank you for being a constant source of motivation and insight.
█ RISK DISCLAIMER
Azullian's content, tools, scripts, articles, and educational offerings are presented purely for educational and informational uses. Please be aware that past performance should not be considered a predictor of future results.

Donchian channels / Connectable [Azullian]Refine your breakout trading techniques with Donchian Channels. Accurately pinpoint significant highs and lows, enhancing your capacity to detect and react to key market movements.
This connectable Donchian channels indicator is part of an indicator system designed to help test, visualize and build strategy configurations without coding. Like all connectable indicators , it interacts through the TradingView input source, which serves as a signal connector to link indicators to each other. All connectable indicators send signal weight to the next node in the system until it reaches either a connectable signal monitor, signal filter and/or strategy.
█ UNIFORM SETTINGS AND A WAY OF WORK
Although connectable indicators may have specific weight scoring conditions, they all aim to follow a standardized general approach to weight scoring settings, as outlined below.
■ Connectable indicators - Settings
• 🗲 Energy: Energy applies an ATR multiplier to the plotted shapes on the chart. A higher value plots shapes farther away from the candle, enhancing visibility.
• ☼ Brightness: Brightness determines the opacity of the shape plotted on the chart, aiding visibility. Indicator weight also influences opacity.
• → Input: Use the input setting to specify a data source for the indicator. Here you can connect the indicator to other indicators.
• ⌥ Flow: Determine where you want to receive signals from:
○ Both: Weights from this indicator and the connected indicator will apply
○ Indicator only: Only weights from this indicator will apply
○ Input only: Only weights from the connected indicator will apply
• ⥅ Weight multiplier: Multiply all weights in the entire indicator by a given factor, useful for quickly testing different indicators in a granular setup.
• ⥇ Threshold: Set a threshold to indicate the minimum amount of weight it should receive to pass it through to the next indicator.
• ⥱ Limiter: Set a hard limit to the maximum amount of weight that can be fed through the indicator.
■ Connectable indicators - Weight scoring settings
▢ Weight scoring conditions
• SM – Signal mode: Enable specific conditions for weight scoring
○ All: All signals will be scored.
○ Entries only: Only entries will score
○ Exits only: Only exits will score.
○ Entries & exits: Both entries and exits will score.
○ Zone: Continuous scoring for each candle within the zone.
• SP – Signal period: Defines a range of candles within which a signal can score.
• SC - Signal count: Specifies the number of bars to retrospectively examine and score.
○ Single: Score for a single occurrence
○ All occurrences: Score for all occurrences
○ Single + Threshold: Score for single occurrences within the signal period (SP)
○ Every + Threshold: Score for all occurrences within the signal period (SP)
▢ Weight scoring direction
• ES: Enter Short weight
• XL: Exit long weight
• EL: Enter Long weight
• XS: Exit Short weight
▢ Weight scoring values
• Weights can hold either positive or negative scores. Positive weights enhance a particular trading direction, while negative weights diminish it.
█ Donchian channels - INDICATOR SETTINGS
■ Main settings
• Enable/Disable Indicator: Toggle the entire indicator on or off.
• S - Source: Choose an alternative data source for the Donchian channels calculation.
• T - Timeframe: Select an alternative timeframe for the Donchian channels calculation.
• LE - Length: Determine the period the Donchian channels are calculated on
• Enable/Disable plotting: Toggle the plotting of the Donchian channels
• U: Choose a color for the upper band
• B: Choose a color for the basis
• L: Choose a color for the lower band
• BG: Choose a color for Donchian channels background
■ Scoring functionality
• The Donchian channels score long entries when the current low price is equal to lower band.
• The Donchian channels score long exits when the current high price is equal to the upper band.
• The Donchian channels score long zones the entire time the current low price is equal to the lower band.
• The Donchian channels score short entries when the current high is equal to the upper band.
• The Donchian channels score short exits when the current low is equal to the lower band.
• The Donchian channels score short zones the entire time the current high price is equal to the upper band.
█ PLOTTING
• Standard: Symbols (EL, XS, ES, XL) appear relative to candles based on set conditions. Their opacity and position vary with weight.
• Conditional Settings: A larger icon appears if global conditions are met. For instance, with a Threshold(⥇) of 12, Signal Period (SP) of 3, and Scoring Condition (SC) set to "EVERY", a Donchian channels signaling over two times in 3 candles (scoring 6 each) triggers a larger icon.
█ USAGE OF CONNECTABLE INDICATORS
■ Connectable chaining mechanism
Connectable indicators can be connected directly to the signal monitor, signal filter or strategy , or they can be daisy chained to each other while the last indicator in the chain connects to the signal monitor, signal filter or strategy. When using a signal filter you can chain the filter to the strategy input to make your chain complete.
• Direct chaining: Connect an indicator directly to the signal monitor, signal filter or strategy through the provided inputs (→).
• Daisy chaining: Connect indicators using the indicator input (→). The first in a daisy chain should have a flow (⌥) set to 'Indicator only'. Subsequent indicators use 'Both' to pass the previous weight. The final indicator connects to the signal monitor, signal filter, or strategy.
■ Set up this indicator with a signal filter and strategy
The indicator provides visual cues based on signal conditions. However, its weight system is best utilized when paired with a connectable signal filter, signal monitor, or strategy .
Let's connect the Donchian channels to a connectable signal filter and a strategy :
1. Load all relevant indicators
• Load Donchian channels / Connectable
• Load Signal filter / Connectable
• Load Strategy / Connectable
2. Signal Filter: Connect the Donchian channels to the Signal Filter
• Open the signal filter settings
• Choose one of the three input dropdowns (1→, 2→, 3→) and choose : Donchian channels / Connectable: Signal Connector
• Toggle the enable box before the connected input to enable the incoming signal
3. Signal Filter: Update the filter signals settings if needed
• The default settings of the filter enable EL (Enter Long), XL (Exit Long), ES (Enter Short) and XS (Exit Short).
4. Signal Filter: Update the weight threshold settings if needed
• All connectable indicators load by default with a score of 6 for each direction (EL, XL, ES, XS)
• By default, weight threshold (TH) is set at 5. This allows each occurrence to score, as the default score in each connectable indicator is 1 point above the threshold. Adjust to your liking.
5. Strategy: Connect the strategy to the signal filter in the strategy settings
• Select a strategy input → and select the Signal filter: Signal connector
6. Strategy: Enable filter compatible directions
• Set the signal mode of the strategy to a compatible direction with the signal filter.
Now that everything is connected, you'll notice green spikes in the signal filter representing long signals, and red spikes indicating short signals. Trades will also appear on the chart, complemented by a performance overview. Your journey is just beginning: delve into different scoring mechanisms, merge diverse connectable indicators, and craft unique chains. Instantly test your results and discover the potential of your configurations. Dive deep and enjoy the process!
█ BENEFITS
• Adaptable Modular Design: Arrange indicators in diverse structures via direct or daisy chaining, allowing tailored configurations to align with your analysis approach.
• Streamlined Backtesting: Simplify the iterative process of testing and adjusting combinations, facilitating a smoother exploration of potential setups.
• Intuitive Interface: Navigate TradingView with added ease. Integrate desired indicators, adjust settings, and establish alerts without delving into complex code.
• Signal Weight Precision: Leverage granular weight allocation among signals, offering a deeper layer of customization in strategy formulation.
• Advanced Signal Filtering: Define entry and exit conditions with more clarity, granting an added layer of strategy precision.
• Clear Visual Feedback: Distinct visual signals and cues enhance the readability of charts, promoting informed decision-making.
• Standardized Defaults: Indicators are equipped with universally recognized preset settings, ensuring consistency in initial setups across different types like momentum or volatility.
• Reliability: Our indicators are meticulously developed to prevent repainting. We strictly adhere to TradingView's coding conventions, ensuring our code is both performant and clean.
█ COMPATIBLE INDICATORS
Each indicator that incorporates our open-source 'azLibConnector' library and adheres to our conventions can be effortlessly integrated and used as detailed above.
For clarity and recognition within the TradingView platform, we append the suffix ' / Connectable' to every compatible indicator.
█ COMMON MISTAKES, CLARIFICATIONS AND TIPS
• Removing an indicator from a chain: Deleting a linked indicator and confirming the "remove study tree" alert will also remove all underlying indicators in the object tree. Before removing one, disconnect the adjacent indicators and move it to the object stack's bottom.
• Point systems: The azLibConnector provides 500 points for each direction (EL: Enter long, XL: Exit long, ES: Enter short, XS: Exit short) Remember this cap when devising a point structure.
• Flow misconfiguration: In daisy chains the first indicator should always have a flow (⌥) setting of 'indicator only' while other indicator should have a flow (⌥) setting of 'both'.
• Hide attributes: As connectable indicators send through quite some information you'll notice all the arguments are taking up some screenwidth and cause some visual clutter. You can disable arguments in Chart Settings / Status line.
• Layout and abbreviations: To maintain a consistent structure, we use abbreviations for each input. While this may initially seem complex, you'll quickly become familiar with them. Each abbreviation is also explained in the inline tooltips.
• Inputs: Connecting a connectable indicator directly to the strategy delivers the raw signal without a weight threshold, meaning every signal will trigger a trade.
█ A NOTE OF GRATITUDE
Through years of exploring TradingView and Pine Script, we've drawn immense inspiration from the community's knowledge and innovation. Thank you for being a constant source of motivation and insight.
█ RISK DISCLAIMER
Azullian's content, tools, scripts, articles, and educational offerings are presented purely for educational and informational uses. Please be aware that past performance should not be considered a predictor of future results.
ADX / Connectable [Azullian]
Streamline your strategy with the ADX indicator. Precisely analyze market strength and direction, integrating these insights for more adaptable trading decisions.
This connectable ADX indicator is part of an indicator system designed to help test, visualize and build strategy configurations without coding. Like all connectable indicators , it interacts through the TradingView input source, which serves as a signal connector to link indicators to each other. All connectable indicators send signal weight to the next node in the system until it reaches either a connectable signal monitor, signal filter and/or strategy.
█ UNIFORM SETTINGS AND A WAY OF WORK
Although connectable indicators may have specific weight scoring conditions, they all aim to follow a standardized general approach to weight scoring settings, as outlined below.
■ Connectable indicators - Settings
• 🗲 Energy: Energy applies an ATR multiplier to the plotted shapes on the chart. A higher value plots shapes farther away from the candle, enhancing visibility.
• ☼ Brightness: Brightness determines the opacity of the shape plotted on the chart, aiding visibility. Indicator weight also influences opacity.
• → Input: Use the input setting to specify a data source for the indicator. Here you can connect the indicator to other indicators.
• ⌥ Flow: Determine where you want to receive signals from:
○ Both: Weights from this indicator and the connected indicator will apply
○ Indicator only: Only weights from this indicator will apply
○ Input only: Only weights from the connected indicator will apply
• ⥅ Weight multiplier: Multiply all weights in the entire indicator by a given factor, useful for quickly testing different indicators in a granular setup.
• ⥇ Threshold: Set a threshold to indicate the minimum amount of weight it should receive to pass it through to the next indicator.
• ⥱ Limiter: Set a hard limit to the maximum amount of weight that can be fed through the indicator.
■ Connectable indicators - Weight scoring settings
▢ Weight scoring conditions
• SM – Signal mode: Enable specific conditions for weight scoring
○ All: All signals will be scored.
○ Entries only: Only entries will score
○ Exits only: Only exits will score.
○ Entries & exits: Both entries and exits will score.
○ Zone: Continuous scoring for each candle within the zone.
• SP – Signal period: Defines a range of candles within which a signal can score.
• SC - Signal count: Specifies the number of bars to retrospectively examine and score.
○ Single: Score for a single occurrence
○ All occurrences: Score for all occurrences
○ Single + Threshold: Score for single occurrences within the signal period (SP)
○ Every + Threshold: Score for all occurrences within the signal period (SP)
▢ Weight scoring direction
• ES: Enter Short weight
• XL: Exit long weight
• EL: Enter Long weight
• XS: Exit Short weight
▢ Weight scoring values
• Weights can hold either positive or negative scores. Positive weights enhance a particular trading direction, while negative weights diminish it.
█ ADX - INDICATOR SETTINGS
■ Main settings
• Enable/Disable Indicator: Toggle the entire indicator on or off.
• S - Source: Choose an alternative data source for the ADX calculation.
• T - Timeframe: Select an alternative timeframe for the ADX calculation.
• SM - Smoothing: Smooth the length averages.
• LE - DI Length: Determine the DI: Directional indicator length.
• TH - Trend threshold: Specify the level the ADX has to cross
• EM - Entry signal mode: Determine entry mode
○ DI: Use only DI+ and DI- crossings
○ DI + ADX: Use DI with increasing ADX
○ DI + ADX + Invert: Use DI with increasing ADX and DI with decreasing ADX
• XM - Exit signal mode: Determine exit mode
○ DI: Use DI crossing to exit
○ ADX: Use decreasing ADX to signal exit
■ Scoring functionality
• The ADX scores long entries when the ADX crosses the TH: Trend threshold and +DM is greater than -DM
• The ADX scores long exits when the ADX falls back below the TH: Trend threshold and +DM is greater than -DM
• The ADX scores long zones the entire time the ADX is above the TH: Trend threshold and +DM is greater than -DM
• The ADX scores short entries when the ADX crosses the TH: Trend threshold and +DM is smaller than -DM
• The ADX scores short exits when the ADX falls back below the TH: Trend threshold and +DM is smaller than -DM
• The ADX scores short zones the entire time the ADX is above the TH: Trend threshold and +DM is smaller than -DM
█ PLOTTING
• Standard: Symbols (EL, XS, ES, XL) appear relative to candles based on set conditions. Their opacity and position vary with weight.
• Conditional Settings: A larger icon appears if global conditions are met. For instance, with a Threshold(⥇) of 12, Signal Period (SP) of 3, and Scoring Condition (SC) set to "EVERY", an ADX signaling over two times in 3 candles (scoring 6 each) triggers a larger icon.
█ USAGE OF CONNECTABLE INDICATORS
■ Connectable chaining mechanism
Connectable indicators can be connected directly to the signal monitor, signal filter or strategy , or they can be daisy chained to each other while the last indicator in the chain connects to the signal monitor, signal filter or strategy. When using a signal filter you can chain the filter to the strategy input to make your chain complete.
• Direct chaining: Connect an indicator directly to the signal monitor, signal filter or strategy through the provided inputs (→).
• Daisy chaining: Connect indicators using the indicator input (→). The first in a daisy chain should have a flow (⌥) set to 'Indicator only'. Subsequent indicators use 'Both' to pass the previous weight. The final indicator connects to the signal monitor, signal filter and/or strategy.
■ Set up this indicator with a signal filter and strategy
The indicator provides visual cues based on signal conditions. However, its weight system is best utilized when paired with a connectable signal filter, signal monitor, and/or strategy .
Let's connect the ADX to a connectable signal filter and a strategy :
1. Load all relevant indicators
• Load ADX / Connectable
• Load Signal filter / Connectable
• Load Strategy / Connectable
2. Signal Filter: Connect the ADX to the Signal Filter
• Open the signal filter settings
• Choose one of the three input dropdowns (1→, 2→, 3→) and choose : ADX / Connectable: Signal Connector
• Toggle the enable box before the connected input to enable the incoming signal
3. Signal Filter: Update the filter signals settings if needed
• The default settings of the filter enable EL (Enter Long), XL (Exit Long), ES (Enter Short) and XS (Exit Short).
4. Signal Filter: Update the weight threshold settings if needed
• All connectable indicators load by default with a score of 6 for each direction (EL, XL, ES, XS)
• By default, weight threshold (TH) is set at 5. This allows each occurrence to score, as the default score in each connectable indicator is 1 point above the threshold. Adjust to your liking.
5. Strategy: Connect the strategy to the signal filter in the strategy settings
• Select a strategy input → and select the Signal filter: Signal connector
6. Strategy: Enable filter compatible directions
• Set the signal mode of the strategy to a compatible direction with the signal filter.
Now that everything is connected, you'll notice green spikes in the signal filter representing long signals, and red spikes indicating short signals. Trades will also appear on the chart, complemented by a performance overview. Your journey is just beginning: delve into different scoring mechanisms, merge diverse connectable indicators, and craft unique chains. Instantly test your results and discover the potential of your configurations. Dive deep and enjoy the process!
█ BENEFITS
• Adaptable Modular Design: Arrange indicators in diverse structures via direct or daisy chaining, allowing tailored configurations to align with your analysis approach.
• Streamlined Backtesting: Simplify the iterative process of testing and adjusting combinations, facilitating a smoother exploration of potential setups.
• Intuitive Interface: Navigate TradingView with added ease. Integrate desired indicators, adjust settings, and establish alerts without delving into complex code.
• Signal Weight Precision: Leverage granular weight allocation among signals, offering a deeper layer of customization in strategy formulation.
• Signal Filtering: Define entry and exit conditions with more clarity, granting an added layer of strategy precision.
• Clear Visual Feedback: Distinct visual signals and cues enhance the readability of charts, promoting informed decision-making.
• Standardized Defaults: Indicators are equipped with universally recognized preset settings, ensuring consistency in initial setups across different types like momentum or volatility.
• Reliability: Our indicators are meticulously developed to prevent repainting. We strictly adhere to TradingView's coding conventions, ensuring our code is both performant and clean.
█ COMPATIBLE INDICATORS
Each indicator that incorporates our open-source 'azLibConnector' library and adheres to our conventions can be effortlessly integrated and used as detailed above.
For clarity and recognition within the TradingView platform, we append the suffix ' / Connectable' to every compatible indicator.
█ COMMON MISTAKES, CLARIFICATIONS AND TIPS
• Removing an indicator from a chain: Deleting a linked indicator and confirming the "remove study tree" alert will also remove all underlying indicators in the object tree. Before removing one, disconnect the adjacent indicators and move it to the object stack's bottom.
• Point systems: The azLibConnector provides 500 points for each direction (EL: Enter long, XL: Exit long, ES: Enter short, XS: Exit short) Remember this cap when devising a point structure.
• Flow misconfiguration: In daisy chains the first indicator should always have a flow (⌥) setting of 'indicator only' while other indicator should have a flow (⌥) setting of 'both'.
• Hide attributes: As connectable indicators send through quite some information you'll notice all the arguments are taking up some screenwidth and cause some visual clutter. You can disable arguments in Chart Settings / Status line.
• Layout and abbreviations: To maintain a consistent structure, we use abbreviations for each input. While this may initially seem complex, you'll quickly become familiar with them. Each abbreviation is also explained in the inline tooltips.
• Inputs: Connecting a connectable indicator directly to the strategy delivers the raw signal without a weight threshold, meaning every signal will trigger a trade.
█ A NOTE OF GRATITUDE
Through years of exploring TradingView and Pine Script, we've drawn immense inspiration from the community's knowledge and innovation. Thank you for being a constant source of motivation and insight.
█ RISK DISCLAIMER
Azullian's content, tools, scripts, articles, and educational offerings are presented purely for educational and informational uses. Please be aware that past performance should not be considered a predictor of future results.

MFR RangeHello Traders!
You requested it for many months, we are finally making our proprietary Range available to all.
First of all, how should a trader consider a Range in general:
In trading, a "range" refers to a specific price interval or zone within which an asset's price moves or consolidates for a period of time. Ranges are characterized by relatively horizontal or sideways price movements, where the price oscillates between a defined upper and lower boundary. Traders often use ranges to identify potential trading opportunities, manage risk, and make trading decisions.
Here's how ranges are used in trading:
1. Range Identification:
Traders identify ranges by observing price charts and looking for periods where the price appears to be moving horizontally with clear upper and lower boundaries.
Common range patterns include rectangles, channels, and horizontal consolidations.
2. Range Trading Strategies:
Range trading strategies aim to profit from price movements within the established range. Traders typically use two main approaches within a range:
Buying near the range's lower boundary: Traders buy when the price approaches the lower end of the range, anticipating a bounce or reversal towards the upper boundary. This is often referred to as "buying support."
Selling near the range's upper boundary: Traders sell when the price approaches the upper end of the range, anticipating a pullback or reversal towards the lower boundary. This is known as "selling resistance."
3. Risk Management:
Stop-loss orders are crucial when trading ranges. Traders set stop-loss orders just outside the range's boundaries to limit potential losses if the price breaks out of the range unpredictably.
4. Range Breakouts:
Ranges do not last indefinitely, and eventually, the price may break out of the range, leading to a significant price movement.
Traders often look for breakout patterns and use breakout trading strategies to capitalize on the potential for a strong price movement after the range is broken.
5. Volatility Consideration:
Some traders may assess the volatility within the range. If the price oscillates within the range with high volatility, they may consider trading shorter timeframes for smaller, quicker profits.
Lower volatility may prompt longer-term traders to take positions within the range, expecting a slower, more controlled price movement.
6. Time Frame Analysis:
Traders may analyze the time frame in which the range has developed, in our case MFR range are based solely on the Daily timeframe.
7. Confirmation Indicators:
Traders often use technical indicators like Relative Strength Index (RSI), Moving Averages, or Bollinger Bands to confirm range trading signals and assess overbought or oversold conditions.
8. Range Boundaries as Support and Resistance:
Once a range is identified, its upper and lower boundaries can serve as key support and resistance levels even after the range is broken. Traders pay attention to these levels for future trading decisions.
9. Range Expansion:
Some traders look for signs of range expansion, where the price starts to break out or trend strongly. This can signal the end of a range-bound market and a transition to a trending market.
It's important to note that while range trading can be profitable, it requires careful analysis and risk management. Traders must be prepared for the possibility of a breakout that can result in significant losses if they are on the wrong side of the trade. Additionally, market conditions can change, and ranges can evolve into trends or other patterns, so traders need to adapt their strategies accordingly.
What is specific to MFR range?
This script calculates and plots a trading range on a daily timeframe based on historical price data. Based on Benoit Mandelbrot and Edgar E. Peters publications on Range, we run a set of calculations over a defined period. The script will define those to generate the "Range High" and "Range Low". These values are used to define the upper and lower bounds of the trading range.
In short, how could I use this script?
A trader could use the Range to find overbought or oversold points to enter a position. The Lower Range being the price to buy an asset and the Upper Range being the place to sell an asset. This is recommended to be implemented only when our other indication called Trend matches the strategy: buy when the trend is bullish or short when the trend is bearish.
It's important to note that while Range is a useful tool, it should not be relied upon solely for making trading decisions. It's recommended to use it in conjunction with other technical analysis tools and consider other factors such as market conditions, risk management, and fundamental analysis. Remember that the Range indicator is just one tool among many, and it's important to consider other factors such as volume, momentum, volatility, and overall market conditions when making trading decisions. Additionally, using stop-loss orders and proper risk management techniques is crucial to mitigate potential losses.
We hope that you will find these explanations useful, please contact us by private message for access.
Enjoy!
DISCLAIMER: No sharing, copying, reselling, modifying, or any other forms of use are authorised. This script is strictly for individual use and educational purposes only. This is not financial or investment advice. Investments are always made at your own risk and are based on your personal judgement. Myfractalrange is not responsible for any losses you may incur. Please invest wisely.
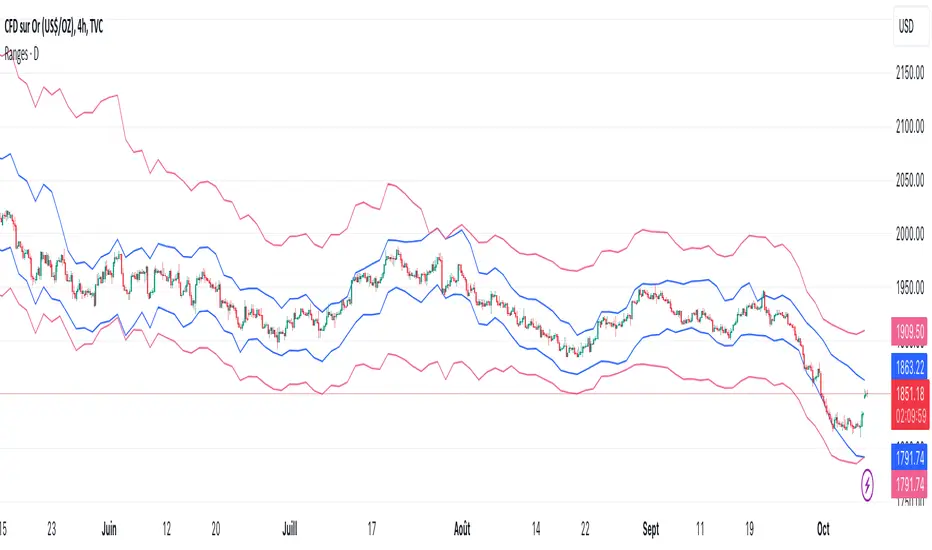
Machine Learning : Cosine Similarity & Euclidean DistanceIntroduction:
This script implements a comprehensive trading strategy that adheres to the established rules and guidelines of housing trading. It leverages advanced machine learning techniques and incorporates customised moving averages, including the Conceptive Price Moving Average (CPMA), to provide accurate signals for informed trading decisions in the housing market. Additionally, signal processing techniques such as Lorentzian, Euclidean distance, Cosine similarity, Know sure thing, Rational Quadratic, and sigmoid transformation are utilised to enhance the signal quality and improve trading accuracy.
Features:
Market Analysis: The script utilizes advanced machine learning methods such as Lorentzian, Euclidean distance, and Cosine similarity to analyse market conditions. These techniques measure the similarity and distance between data points, enabling more precise signal identification and enhancing trading decisions.
Cosine similarity:
Cosine similarity is a measure used to determine the similarity between two vectors, typically in a high-dimensional space. It calculates the cosine of the angle between the vectors, indicating the degree of similarity or dissimilarity.
In the context of trading or signal processing, cosine similarity can be employed to compare the similarity between different data points or signals. The vectors in this case represent the numerical representations of the data points or signals.
Cosine similarity ranges from -1 to 1, with 1 indicating perfect similarity, 0 indicating no similarity, and -1 indicating perfect dissimilarity. A higher cosine similarity value suggests a closer match between the vectors, implying that the signals or data points share similar characteristics.
Lorentzian Classification:
Lorentzian classification is a machine learning algorithm used for classification tasks. It is based on the Lorentzian distance metric, which measures the similarity or dissimilarity between two data points. The Lorentzian distance takes into account the shape of the data distribution and can handle outliers better than other distance metrics.
Euclidean Distance:
Euclidean distance is a distance metric widely used in mathematics and machine learning. It calculates the straight-line distance between two points in Euclidean space. In two-dimensional space, the Euclidean distance between two points (x1, y1) and (x2, y2) is calculated using the formula sqrt((x2 - x1)^2 + (y2 - y1)^2).
Dynamic Time Windows: The script incorporates a dynamic time window function that allows users to define specific time ranges for trading. It checks if the current time falls within the specified window to execute the relevant trading signals.
Custom Moving Averages: The script includes the CPMA, a powerful moving average calculation. Unlike traditional moving averages, the CPMA provides improved support and resistance levels by considering multiple price types and employing a combination of Exponential Moving Averages (EMAs) and Simple Moving Averages (SMAs). Its adaptive nature ensures responsiveness to changes in price trends.
Signal Processing Techniques: The script applies signal processing techniques such as Know sure thing, Rational Quadratic, and sigmoid transformation to enhance the quality of the generated signals. These techniques improve the accuracy and reliability of the trading signals, aiding in making well-informed trading decisions.
Trade Statistics and Metrics: The script provides comprehensive trade statistics and metrics, including total wins, losses, win rate, win-loss ratio, and early signal flips. These metrics offer valuable insights into the performance and effectiveness of the trading strategy.
Usage:
Configuring Time Windows: Users can customize the time windows by specifying the start and finish time ranges according to their trading preferences and local market conditions.
Signal Interpretation: The script generates long and short signals based on the analysis, custom moving averages, and signal processing techniques. Users should pay attention to these signals and take appropriate action, such as entering or exiting trades, depending on their trading strategies.
Trade Statistics: The script continuously tracks and updates trade statistics, providing users with a clear overview of their trading performance. These statistics help users assess the effectiveness of the strategy and make informed decisions.
Conclusion:
With its adherence to housing trading rules, advanced machine learning methods, customized moving averages like the CPMA, and signal processing techniques such as Lorentzian, Euclidean distance, Cosine similarity, Know sure thing, Rational Quadratic, and sigmoid transformation, this script offers users a powerful tool for housing market analysis and trading. By leveraging the provided signals, time windows, and trade statistics, users can enhance their trading strategies and improve their overall trading performance.
Disclaimer:
Please note that while this script incorporates established tradingview housing rules, advanced machine learning techniques, customized moving averages, and signal processing techniques, it should be used for informational purposes only. Users are advised to conduct their own analysis and exercise caution when making trading decisions. The script's performance may vary based on market conditions, user settings, and the accuracy of the machine learning methods and signal processing techniques. The trading platform and developers are not responsible for any financial losses incurred while using this script.
By publishing this script on the platform, traders can benefit from its professional presentation, clear instructions, and the utilisation of advanced machine learning techniques, customised moving averages, and signal processing techniques for enhanced trading signals and accuracy.
I extend my gratitude to TradingView, LUX ALGO, and JDEHORTY for their invaluable contributions to the trading community. Their innovative scripts, meticulous coding patterns, and insightful ideas have profoundly enriched traders' strategies, including my own.

Power Of Stocks - Bollinger Band & 5Ema Indicator - Keanu_RiTz
Power of Stocks - Bollinger band & 5ema Strategy
In this script you get to take Buy/Sell trades using the 3 options mentioned below.(Alerts with price levels for buy/sell at , SL & Target are included in this one)
1. Combined Strategy :- uses confirmation from both strategies to trade.
2. Bollinger band Strategy :- use the Bollinger band Strategy to trade.
3. 5ema Strategy :- use the 5ema Strategy to trade.
1. Combined Strategy :-
for Selling :- we will go short/sell only when conditions of both strategies are satisfied.
i.e. when a candle is completely above the upper Bollinger band & completely above the 5ema then it will be our Alert Candle.
We Short/Sell only when the low of the Alert candle is broken or when the candle closes below the close of the Alert Candle.
SL will be above high of the Alert Candle. Target will be minimum 1:3 or as per your emotions.
for Buying:- we will go Long/Buy only when conditions of both strategies are satisfied.
i.e. when a candle is completely below the lower Bollinger band & completely below the 5ema then it will be our Alert Candle.
We go Long/Buy only when the high of the Alert candle is broken or when the candle closes above the close of the Alert Candle.
SL will be below low of the Alert Candle. Target will be minimum 1:3 or as per your emotions.
2. Power of Stocks - Bollinger Band Strategy :-
Bollinger band with standard deviation = 1.5
when a candle is completely above the upper Bollinger band, that candle will be called a signal/alert candle.
Initiate a Sell trade when that alert candles low is broken. SL will be above high of that alert candle.
Risk to reward ratio will be 1:4 i.e. target will be 4 times the SL.
when a candle is completely below the lower Bollinger band, that candle will be called a signal/alert candle.
Initiate a Buy trade when that alert candles high is broken. SL will be below low of that alert candle.
Risk to reward ratio will be 1:4 i.e. target will be 4 times the SL.
other rules for Options buying:- minimum 15min timeframe
The day you initiate the position , you should be in profit above 10%-15% then only you should carry forward that position overnight, otherwise squareoff your trade on that day only.
Buy ATM or slightly OTM, SL max 100 points , target 1:4
for Long-term/Investing :- Minimum Weekly
If candle is outside the lower band then initiate a Buy trade when that candles High is broken. Sl will be below Low of that candle.
for Long-term Target will be according to your emotions.
3. Power of Stocks - 5ema Strategy (target minimum 1:3)
Timeframe -
5 min for Selling (Sell Futures/index/stocks or buy Put)
15 min for Buying (Buy Futures/index/stocks or sell Put)
for selling stocks :-
you should enter trade within 10am , don't look for entries after that time. take only 2 entries a day.
for selling Index(Banknifty) :-
you can take trade at anytime of the day whenever conditions get satisfied. you can take multiple entries in banknifty as it is very volatile.
for options choose atm strikes: selling trade
sl for premium between 200-300 :- 20-30 points SL
sl for premium between 400-500 :- 40-50 points SL
sl for premium between 500-600 :- 50-60 points SL
Subhashish Pani's (power of stocks) 5 EMA Strategy:-
It plots 5 EMA and Buy/Sell signals with Target & Stoploss levels.
What is Subhashish Pani's (power of stocks) 5 EMA Strategy :-
His strategy is very simple to understand. for intraday use 5 minutes timeframe for selling. You can sell futures, sell call or buy Puts in selling strategy.
What this strategy tries to do is , it tries to catch the tops, so when you sell at top & it turns out to be a reversal point then you can get good profit.
this will hit stop losses often, but stop losses are small and minimum target should be 1:3. but if you stay with the trend you can get big profits.
According to Subhashish Pani this strategy has 60% success rate.
Strategy for Selling (Short future/Call/stock or buy Put)
When ever a Candle closes completely above 5 ema (no part of candle should be touching the 5ema), then that candle should be considered as Alert Candle.
If the next candle is also completely above 5 ema and it has not broken the low of previous alert candle, Then the previous Alert Candle should be ignored and the new candle should be considered as new Alert Candle.
so if this goes on then continue shifting the Alert Candle, but whenever the next candle breaks the low of the Alert Candle we should take the Short trade (Short future/Call/stock or buy Put).
Stoploss will be above high of the Alert Candle and minimum target will be 1:3.
Strategy for Buying (Buy future/Call/stock or sell Put)
When ever a Candle closes completely below 5 ema (no part of candle should be touching the 5ema), then that candle should be considered as Alert Candle.
If the next candle is also completely below 5 ema and it has not broken the high of previous alert candle, Then the previous Alert Candle should be ignored and the new candle should be considered as new Alert Candle.
so if this goes on then continue shifting the Alert Candle, but whenever the next candle breaks the high of the Alert Candle we should take the Long trade (Buy future/Call/stock or sell Put).
Stoploss will be below low of the Alert Candle and minimum target will be 1:3.
Buy/Sell with extra conditions :
it just adds 1 more condition to buying/selling
1. checks if closing of current candle is lower than alert candles closing for Selling & checks if closing of current candle is higher than alert candles closing for Buyling.
This can sometimes save you from false moves but by using this, you can also miss out on big moves as you'll enter trade after candle closing instead of entering at break of high/low.
Note :- According to Subhashish Pani Timeframe for intraday buying should be 15 minutes Timeframe.
If you haven't understood the strategy by reading above description, then search for "Subhashish Pani's (power of stocks) 5 EMA Strategy" on YouTube to get a deeper understanding.
Note:- This is not only for Intraday trading , you can use this strategy for Positional/Swing trading as well. If you use this on Monthly Timeframe then it can be very good for Long Term Investing as well.
Rules will be same for all types of trades & Timeframes.

Original Strategy - Backtest & Alerts [AlgoRider]█ OVERVIEW
This indicator simulates an efficient trading strategy developed by our team in a simple and effective way, the primary objective when designing it was to make its reading and use as simple as possible for TradingView users. The Backtesting feature has been designed to keep only the most essential information to obtain clear and precise results directly on the graph. The settings interface has also been designed for ergonomic and simplified use. The user is free to customize the parameters as he wishes and according to his trading profile by having the choice, for example, of using options to reduce the risk of loss, to increase the win rate, to optimize profits. Automation is made possible and facilitated thanks to preconfigured alert conditions.
█ CONCEPTS
How the strategy works :
When the price is close to its equilibrium (represented by an exponential moving average - EMA) and it starts to take an upward or downward direction the script will issue Long or Short entry orders. If the price turns and goes to the opposite direction, the script quickly cuts the position by issuing a Stop Loss order. When the price takes a real clear direction, this is where the script will be able to accumulate profits.
What makes this script unique is :
• That it is entirely developed by us, inspired by a strategy that is little known and little used in the trading world, in particular because it often involves a greater number of losing trades than winning trades.
• Its ease of reading and use. The backtesting feature was designed to clearly display the most important information in a data table directly on the chart. The user is not lost with dozens of superfluous data and can directly access the most essential information to see how the strategy has performed in the past.
• Its ease of configuration and customization. Once in the configuration window, again the user is not lost, because there is only one main parameter to modify, it is the length of the EMA, which will influence the timing of entries and exits trades. Then there are a few other non-mandatory parameters to fine-tune risk management and maximize profits. (Detailed description of the settings further down the page)
• Strategy automation made easy and fast thanks to several types of alerts which are differentiated for entries, for auto-exits and for Custom TP and SL. These alerts can be configured to send the messages by email or via Webhooks.
• The indicator has several custom options allowing its user to go further than the basic strategy. Several confirmations for entries are available as well as the possibility of adding or not a personalized TP and/or SL.
• There is no repaint, once an entry/exit symbol or drawing is displayed it doesn't change anymore. The Short, Long and auto-Exit signals appear only at the open of the candles, just after the signal was confirmed at the close of the previous candle. The custom TP and custom SL signals can appear when a candle is not yet finished, but once displayed they don't change.
█ HOW TO PROCEED
1 — Once the script is applied to your chart, it already works with its default settings. You can already see the performance of the strategy in the data table directly on the chart (in the top right corner by default).
2 — You can customize the strategy and influence the results/performance by modifying its parameters. 3 types of parameters are present and can be modified.
3 — This strategy is designed for the cryptocurrency market in priority, but you can also try it on other types of assets. It works on Futures but you can also try it on Spot market mainly for LONG trades.
4 — You can apply the script in every timeframe. We do not recommend using it below m30 because in most cases the statistics are unfavorable largely because of the fees. (This is not a financial advice but only for the use of the indicator)
█ FEATURES
Screenshot on BYBIT:EGLDUSDT Bybit Futures, H1, with default parameters, from 2022-01-01 to 2022-09-27, to show the settings window
• Settings For Backtesting
- Strategy : Choose from a drop-down list if the strategy should execute only Long trades or only Short trades or both. Default Both.
- Invest. : Choose the amount you want to invest in the simulation. Default 10000.
- Position : Choose the amount of the position (Size order) that will be used during the simulation. This will be the $ amount staked/involved for each trade entry.
Ex: If you put 20000 in position and 10000 in Invest. We consider that you use at least a leverage x2. Default 10000.
- Slipp. TP : Choose the amount in percentage of average slippage for Take Profits. This parameter makes it possible to predict a potential gap between the theoretical exit price for each TP (On the graph) and the real exit price on an exchange when implementing the strategy for real (slippage may be due to a time lag of a few seconds from execution time of the order on the exchange and/or due to the execution of a market order).
Ex: If a TP exit order of a Long trade, with entry $19000 (on BTCUSDT), is carried out in theory on the chart at $20000, in practice on the exchange the script have indeed sent an exit order at 20000 , but if the true exit price is 20050, the TP slippage is then +0.25%. Default 0.
- Slipp. SL : Choose the amount in percentage of average slippage for Stop Losses. This parameter makes it possible to predict a potential gap between the theoretical exit price for each SL (On the graph) and the real exit price on an exchange when implementing the strategy for real.
Ex: If an SL exit order of a Long trade, entry $19000 (on BTCUSDT), is carried out in theory on the chart at $18000, in practice on the exchange the script have indeed sent an exit order at 18000 $, but if the true exit price is 17950, the slippage SL is then +0.278% . Default 0.
- Fees % : Choose the percentage amount of fees applied to each trade to simulate the application of the strategy on the exchange of your choice. Applies to the entry and exit of each trade. Ex: For Binance Futures: 0.04; For Bybit futures: 0.06; For Ftx Futures: 0.075. Default 0.
- Cumulate Trades : If you check this, the Backtest will use 100% of the balance as Order Size (Position) for All or in the next X consecutive trades. Default not checked.
⚠️ Be Careful please, this option is available to show the full extent and possibilities of the algorithm when pushed to its limits thanks to the accumulation of profits (cumulative earnings), but it is a strategy that involves great risk. If a bad trade suffers a -50% loss, 50% of the account balance is lost, if the position is liquidated, the entire account balance is lost.
- All : If you check this All trades will be accumulated. Default not checked.
- Consecutive Trades : Choose the number of trades to accumulate. After X consecutive trades, the algorithm reassigns the initial order size to the current one and starts again for X consecutive trades. Minimum Value 2, Default 2.
• Settings To Optimize Performances and Risk Management
- (Main Parameter) EMA Length : Choose the length of the EMA. This value will determine the exponential moving average plot (blue line) that represents the equilibrium in this strategy. Depending on the positioning of the price around this equilibrium, the algorithm will decide to trigger Long or Short entry alerts, and exit alerts. Default 200.
- 1 - Confirm (After X Bar(s)) : If you check this, when the algorithm will detect an entry, it will wait for the number of bars you have entered to actually trigger the entry alert. Default not checked.
- Nb Bar : Enter here the number of bar you want, will be taken into account only if you check (1) Confirm (After X Bar(s)). Default 2.
- 2 - Confirm (Trend) : If you check this, when the algorithm will detect an entry, it will check that the trend is similar to the direction of the trade, if not, it will wait that the trade goes in the same direction as the trend to actually trigger the entry alert. Default not checked.
- OR/AND : This choice is taken into account only if you tick both confirmations. If you choose OR: The first of the 2 confirmations to be validated will trigger the entry alert. If you choose AND : once confirmation (1) is validated, the algorithm waits for confirmation (2) to be validated to actually trigger the entry alert. Default OR.
- Use TP / Use SL : If you check these, the algorithm will trigger personalized trade exit alerts when the price evolution has reached the amounts indicated since the trade entry. Default not Checked.
- % TP - SL : Indicate here the personalized amount in percentage that you want for your Take Profit and Stop Loss of each trade. Default 15-5.
• Settings For Appearances
- Small-size Data Table : If you check this, the data table will become smaller to free up more space on the chart to make it visually more pleasing. Default not checked.
Hide Table /
- Hide Labels / : You can check these to get a cleaner chart and focus only on what interests you in the indicator. Default not checked.
Hide Risk-Reward Areas
█ MAIN PARAMETERS TO USE
• In the default settings none of the box settings are checked. Basic strategy is made to be applied this way.
• The main parameter (the length of the EMA) is by default 200 because it is a known value that many traders rely on in many trading strategies. Moreover in this strategy it works in many cases and on different timeframes.
• To go further the user of the indicator is free to modify the parameters of the category "Leading Parameters - Risk Management" to reduce risks and to optimize profits.
• You can find below our recommendations for the EMA length value corresponding to the main timeframes.
m30 — EMA Length = 400 | 800
H1 — EMA Length = 200 | 400
H2 — EMA Length = 200 | 250
H4 — EMA Length = 100 | 200
D — EMA Length = 20 | 40
⚠️ We have chosen to recommend these settings because they will work in most cases, on most cryptoassets, but of course they will not work 100% of the time on all assets and will not always give positive results in the backtest, and they are not the most optimized parameters either. The user of the indicator is free to optimize the asset on which he wants to trade in his own way. Just as we do not give financial advice, we do not encourage to trade any asset in particular.
█ STATISTICS
The statistics presented below are an example of the results that the strategy can provide. (Reminder: These statistics are made over a past period and there is no guarantee that the same performance will reproduce in the future) .
For the demonstration we chose to apply the strategy on the Top 5 marketcap cryptos in September 2022. They are not the most favorable coins for this strategy but at least this way we don't take the most suitable assets to show wonderful and biased results. Likewise for the parameters used which are the default ones and which are not the most optimized parameters, much better results are possible. We chose Binance because it has the highest volumes and liquidity and the most historical data. We chose H1 because it is one of the most used timeframes.
BTC
Screenshot on BINANCE:BTCUSDTPERP Binance Futures, H1, with default parameters (EMA : 400), from 2022-01-01 to 2022-09-27
ETH
Screenshot on BINANCE:ETHUSDTPERP Binance Futures, H1, with default parameters (EMA : 400), from 2022-01-01 to 2022-09-27
BNB
Screenshot on BINANCE:BNBUSDTPERP Binance Futures, H1, with default parameters (EMA : 400), from 2022-01-01 to 2022-09-27
XRP
Screenshot on BINANCE:XRPUSDTPERP Binance Futures, H1, with default parameters (EMA : 200), from 2022-01-01 to 2022-09-27
ADA
Screenshot on BINANCE:ADAUSDTPERP Binance Futures, H1, with default parameters (EMA : 400), from 2022-01-01 to 2022-09-27
To show the potential of the indicator and push it to its limits, here is an example of the strategy applied for about 2 years (Up to the maximum of historical data available).
⚠️ It must be taken into account that during the period of this backtest the last Bullrun took place and it was a very favorable period for the strategy and for this altcoin (FTM), nothing ensures that it will happen again. ⚠️
FTM
Screenshot on BINANCE:FTMUSDTPERP Binance Futures, H4, with default parameters ( without cumulative earnings) and EMA : 400, start on 2020/12/03 to 2022/09/27
✅ All of the above statistics are verifiable by anyone using the indicator's backtesting system.
█ LIMITATIONS
• Despite the fact that we can see good performances when we backtest the strategy, we must take into account the fact that these are results performed in the past and that in no case does this guarantee that these same performances will be repeated again in the future.
• The automation of this strategy is made possible and is facilitated by alerts, but you must be aware of the fact that if you decide to put this strategy into practice in real life, you are solely responsible for the results that you will be able to obtain and you must be aware of the possibility at all times of partial or even total losses of your invested capital.
• Keep in mind that generating profits in trading is difficult. A strategy can perform very well at one time in the past during a period that is favorable to it, then from one day to the next it can give really bad results for several months or years.
• When backtesting a strategy, there are many factors to consider, not just trade entries to which you add a Take Profit and sometimes a Stop Loss. You must at least take into account the size of the position in relation to the capital you want to invest, the trading fees, the slippages (which can be really important depending on the exchange on which you are trading and depending on the asset you are trading), trading frequency, risk management, momentum, volumes and even more.
• This indicator has been optimized for crypto, you can try to use it on other type of assets but again, at your own risk.
The information published here on TradingView is not prohibited, doesn't constitute investment advice, and isn't created solely for qualified investors.
═════════════════════════════════════════════════════════════════════════
Important to note : our indicators with the same backtesting system are published in separate publications, because putting them together in a single script would considerably slow down the execution of the script. In addition each indicator, even when it is based on a simple technical indicator, has several options, parameters and entry/exit conditions specific to the underlying technical indicator. Finally, we want to keep the simplicity of use, configuration and understanding of our indicator by not mixing strategies that have nothing to do with each other.
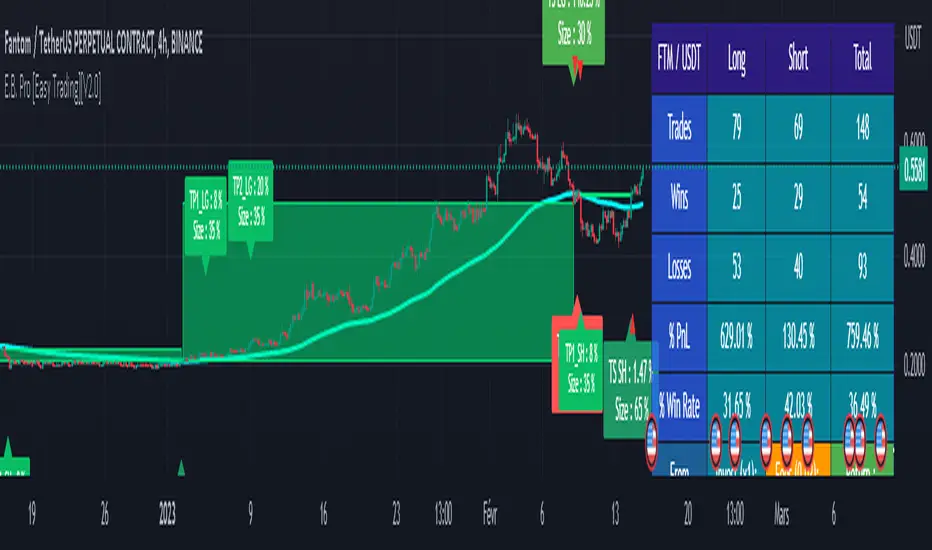
Grid Premium Indicator - The Quant ScienceGrid Premium Indicator - The Quant Science™ is an indicator that represent the grid trading strategy. Unlike our GRID SPOT TRADING ALGORITHM (which buys in a "buy the dip" style, offering a swing type operation) this indicator uses a trend following strategy with a larger number of grids.
A trend-following strategy in a grid algorithm allows you to open long positions if price rises and breaks up or open short positions if price breaks down.
This indicator was created following the guidelines of the best grid algorithms on 3Commas, Bitsgap, Kucoin, and Binance.
Our goal is to recreate a universal and trust model for all traders and investors who use grid algorithms for their trading.
The ideal market condition as for all grid algorithms is the side market. In the side market this algorithm will create profit during upward movements.
The trader using this algorithm can use it to:
1. Manual trading
2. Backtesting
3. Algorithmic trading
HOW TO SET UP
Using this indicator is very simple. We have configured the creation for a three-step set up. You can manage it without any problems experience in coding. All you have to do is click the grid start and end level and the indicator will automatically load generating the grids and backtesting.
OPERATIVITY
Each open trade is long and is opened when the price crossover an upward level. Each order is closed at the next level. If the price breaks upward or downward the extremes of the grid the algorithm stops trading and will not open any more positions.
FEATURES
Grids: this indicator generates 20 levels of grids.
Direction: opens exclusively long positions.
Strategy: trend-following.
Data table: a table collects all the quantitative data on the strategy's performance. By entering your broker's commission costs and initial capital you will have an instant report on the strategy's performance.
MAIN ADVANTAGE
Compound Interest: the high number of grids allows the gains from each trade to be reinvested quickly by speeding capitalization through compound interest.
LIMITATIONS OF THE MODEL
Like all grid strategies, maximum profit is made when the market is flat or sideways. A market with a bullish or bearish trend does not allow you to generate good profits with this strategy.
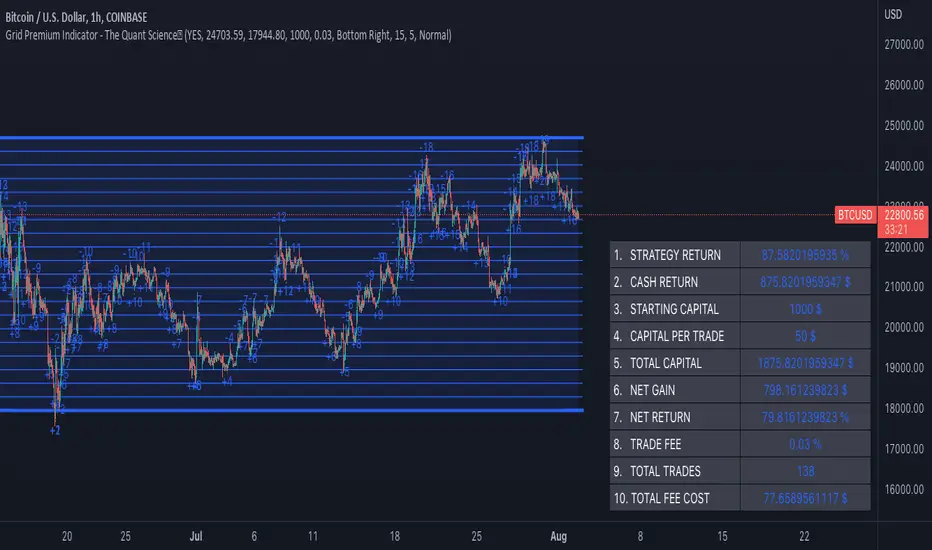
TOTC - Trade outside the Channel (aka "Chaos Coaster") [Free]To make the strategy known as the "Chaos Coaster" (published by "Perfect Entry" group) easy to use, simplify backtesting, and increase awareness, I combined three indicators into one. The result is this standalone indicator, which provides clear signals based on the original rules of the strategy.
Let's look at the rules and components of the strategy to explain how the indicator works and signals:
As a baseline we use a "Pivot (Fractal) Chaos Channel" or also known as "Fractal Chaos Band".
Essentially, the "Fractal Chaos Channel" shows an overall panorama of price action. As they filter out the insignificant price fluctuations. The upper level is created by drawing price highs and the lower level is created by drawing price lows.
As our first confirmation and to identify the direction of the trend, we use the momentum technical oscillator “TSI – True Strength Indicator”.
As a second confirmation, we use my indicator "PaP - Procul ad Pretium", which is not yet public. It helps to identify a trend at an early stage or to serve as confirmation. In short, as the name implies, the indicator tries to identify the trend based on the distance of prices to trending averages, smoothed with moving averages of your choice.
(In the original version of the strategy, "Piphunter lmi" by the_w15rdx is used. PaP provides comparable results.)
The rules for "long" or "short" signals
The basic rule is: "Trade outside the channel" when PaP and TSI point in the same direction.
Rule 1 of the Strategy:
A candle breaks and closes outside the "Pivot (Fractal) Chaos Channel". For "long" positions, the price must break the upper level. For "short" positions, the price must break the lower level.
Rule 2 of the Strategy:
The direction of the TSI must match the break direction of the "Pivot (Fractal) Chaos Channel". For long positions, TSI must be above its signal line. Vice versa for "short" positions.
Rule 3 of the Strategy:
The direction of "PaP - Procul ad Pretium" must match the break direction of the "Pivot (Fractal) Chaos Channel".
Outputs and Filters
The output is the "Pivot (Fractal) Chaos Channel" whose background corresponds to the direction of "PaP - Procul ad Pretium" and whose lines reflect the direction of "TSI - True Strength Indicator".
"long" or "short" signals are indicated by colored candlesticks and arrows. If there are several signals per level of "Pivot (Fractal) Chaos Channel", they are also numbered consecutively.
In addition, the signals can be filtered by defining the maximum number of signals per pivot (fractal) level.
How can this indicator be used?
As mentioned, this indicator provides the signals for the strategy that has become known as the "Chaos Coaster". Details and even videos of this strategy can be found online. I can also provide a list of links upon request.
Limitations of this free version
The default settings of the indicator reflect the original version of the strategy. Some parameters cannot be changed or can only be changed to a limited extent in this free version. To get full access to all parameters, send me a private message here on TradingView.
Setting up alerts and what needs to be considered
Alerts take into account the settings of the indicator at the time of creating an alert. I therefore recommend setting up the alert again after making changes to the settings. To receive alerts: "Add Alert to TOTC" and select "Any alert() function call".
What do I need to consider?
It may be advisable to add further indicators and an analysis of the market structure in order to confirm the signals issued by the indicator. Please note that when you make adjustments to any strategy, you always carry out particularly detailed tests.
You would like to use this strategy, but you have adjustment requests, you want to have additional filters or features implemented, ...?
I am happy to create individual indicators based on "TOTC - Trade outside the Channel ". Write me a PM and we will discuss the details and conditions.
Will this indicator be further developed and will I receive free updates?
All my indicators are of course constantly updated and, if possible and with the aim of the indicator justifiable, supplemented by user requests. If you like this indicator and follow me here on TradingView, you will be informed about updates and also new indicators.

WhaleCrew VisionVision is an advanced momentum oscillator that visualizes momentum strength with overbought and oversold readings.
Features
Momentum Waves
Divergence Detection (regular and hidden divergences)
Detection for momentum shifts (detects higher lows/lower highs on the oscillator)
Detection for momentum stagnation
Moneyflow
Most important: Our Custom Strategy Builder
Custom Strategy Builder
The custom strategy builder is a framework that allows you to easily create custom strategies.
1. Configure long/short conditions
Pre-defined conditions for custom timeframes, under which you're looking to potentially enter a trade.
2. Configure trigger
Select a trigger (e.g. "Wave Cross" or "Wave Lower High") to generate labels/alerts for potential entries, whenever long/short conditions are met.
3. Configure Take Profit Conditions
Potential Take Profits are triggered by momentum stagnation.
4. Backtest your strategy
By using our open-source backtester script (published on our profile).
5. Trade responsibly
Manually review each signal/alert before taking any actions.
Note: The "Strategy Backtest" input section can also help you develop your strategy.
Usage
You can use this indicator to follow the trend, detect momentum shifts or memorize patterns.
Take a systematic approach by using our strategy builder.
Access to this indicator can be obtained through our website.
