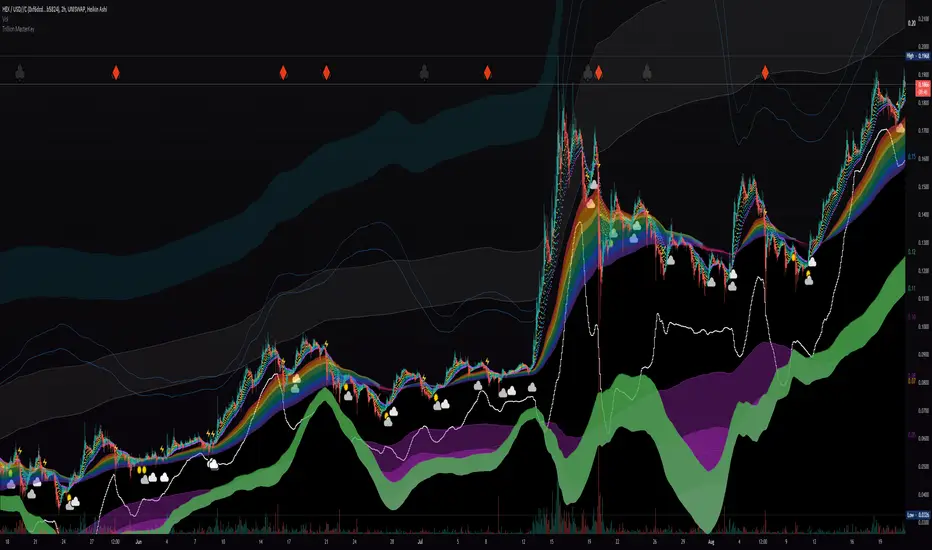
Liquidity Rainbow - Trillion ResearchThis indicator uses regression along with RSI and moving averages from multiple time frames to help you visualize the market in a single view. After learning the notations, you will be able to identify pockets of liquidity and determine high/low probability price zones without drawing a single line.
Booster symbols help confirm short term trends and breakouts based off of two waveform functions, one long period, the other with a much shorter period. You get the buy signal that everyone else sees plus the confirmation!
This is a system that is not fully developed, PNL is not available yet. Strategy version is coming soon, still back testing.
I am tuning this model for crypto specifically, although it works for anything with a price chart.
2 EMAs (configurable to MA)
Dragonskin - RGB circle plots eMA
Rainbow - RGB area plots eMA
+When you see the rainbow appear it means that the price is above the slowest ema baseline. Generally bullish as price tends to ride the rainbow. Ideally, you will see a white cloud at the origin.
-When you see white step line cutting into the upper colors of the rainbow.
Once the price has traded below the rainbow for the FIRST time, not just wicked. You can set a target that's just above the previous high bodys above the rainbow. Do not sell the dip, let the floppers flop.
The second time price cuts down through a thick rainbow is usually bearish .
What makes me so sure? Liquidity
In order to be successful, we need to understand liquidity, the juiciest pockets of profit.
I will reveal more of the strategy in the second script.
For now, use:
SUN symbol - Notice how the price always seems to come back and sweep up any SUNs that get left behind (up and down) this is a liquidity nugget
CLOUD(s) indicators of support. Meaning that on ema trend we expect a lower price but each time that happens, it gets bought up above baseline. weak->strong (little gray - light blue - white)
LIGHTNING indicator of resistance. Meaning the price is not being allowed to recover, each time it rises above baseline, it is sold down again.
YELLOW CROSS - Classically known as a whale manipulation indicator. It tends to indicate a strong bearish move incoming or the reversal of an ongoing bearish move. There's dumping. "Get ready something is happening" indicator.
HEARTS = BUY
SPADES = Buy
CLUBS = Sell
DIAMONDS = SELL
*do not use these during periods of consolidation. consolidation is a period when the price swings in both directions but not too much. In a narrow range the indicators can pop up.
Why does this happen?
Short periods, during which exchanges stabilize the prices, are necessary for the redistribution of assets over the course of trading. Sometimes they happen multiple times a week and can last 24 or 48hours. Also it is a great time to eat up algo traders and that's why you'll see noise.
You want to focus on the period immediately following a consolidations. Don't rush it, they really do take 20 hours+
If you realize that you are in one of these consolidation ranges, limit order the tips of the wicks, nothing in the middle. There is not much profit here but also there is minimal risk.
If you're confirmed in a consolidation, exchanges will work to buoy the price to the appropriate mark price even if there is a big buy/sell order. A lot of time price will go up the congruent amount afterwards to compensate the toxic vwap .
I hope this helps people see the bigger picture and become even more successful with bigger gains.
I've tested this on all the major cryptos. Bitcoin BTC Ethereum ETH HEX
Honestly, I have tested very few stonks with this, later.
-Market Enemy
Wyszukaj w skryptach "the strat"
Reditum SniperReditum Sniper synchronizes multiple time frames POC's (Point of Control) to a single graph, allowing its user to find valuable area's which may act as key levels to take educated decisions. Furthermore it uses custom made formulas to find the lookback period of previously mentioned values.
Reditum Sniper vs Reditum Scanner
Reditum Sniper aproaches the markets in a similar way as the Reditum Scan, yet it counts with several updates and overall a rebrand. The Reditum Sniper includes bug fixes, weekly poc has been added, the ability to fix the max_bars_back error in any security, less memory use which is required due to errors presented in later versions of the TradingView platform, functions which simplify the code and much more!
Components of Reditum Scan:
POC's (30 min, 60 min, 120 min, 240 min, daily, weekly)
How does it work?
The algorithm allows you to identify areas of strong support and resistance , based on where most of the trading activity takes place.
What are the strategies for considering placing a trade?
1.Cluster (agglomeration of multiple POC's) to cluster (by identifying two clusters, the price could go smoothly from one Cluster to the other).
2. From cluster (agglomeration of multiple POCs, each with unique color. Now, from this cluster important movements may begin).
3. Towards a cluster (like the “from cluster” pattern, we identify areas of high interest for institutional companies, in this pattern the cluster acts like a magnet, if price is near it may be fully attracted towards the agglomeration).
If you are a member of the mastermind tribe please contact the support team within the tribe to access the indicator (do not leave personal or subscription data in the comments on this page), if not, please visit the link located in our signature.
Thanks for taking a look!
---------------------------------------------------------------------------------------------------------------------------------------------------------------
Reditum Sniper sincroniza múltiples POC's (Puntos de Control) de distintos marcos de tiempo a un único grafico, permitiéndole al usuario encontrar áreas de alto valor que pueden actuar como niveles clave para tomar una decisión educada en su inversión. Además utiliza formulas propias para encontrar la cantidad de data utilizada para los valores previamente mencionados.
Reditum Sniper vs Reditum Scanner
Reditum Sniper enfrenta el mercado de una manera similar al Reditum Scan, aun así cuenta con una gran cantidad de cambios y sobre todo un cambio de marca. El Reditum Sniper incluye una gran cantidad de arreglos de bugs, el poc weekly ya esta incluido por default, la habilidad de solucionar el error max_bars_back que se presentaba en ciertos marcos de tiempo, menor uso de memoria el cual se requiere debido a que se presentaba este error en nuevas versiones de la plataforma, funciones que simplifican el código y mucho más!
Componentes de Reditum Scan:
POC´s (30 min, 60 min, 120 min, 240 min, diario, semanal)
¿Cómo funciona?
El algoritmo le permite identificar áreas de fuerte soporte y resistencia, según el lugar donde se lleva a cabo la mayor parte de la actividad comercial.
¿Cuáles son las estrategias para considerar una entrada?
1.Cluster (aglomeración de múltiples POC´s) a cluster (al identificar dos cluster el precio podría ir con fluidez desde uno al otro que lo recibe).
2.Desde cluster (lo identificamos con la aglomeración de múltiples POC identificados con colores que hacen fácil la lectura. Ahora, desde este cluster podrían iniciar movimientos importantes).
3.Hacia cluster (al igual que el patrón “desde cluster” identificamos zonas de alto interés para los institucionales, en este patrón el cluster actúa como un imán para el precio, de modo que cuando el precio está lejos de él, lo podría atraer con fuerza).
Para acceder a la herramienta, si usted es miembro de la tribu mastermind por favor comunicarse con el equipo de soporte dentro de la tribu (no dejar datos personales ni de suscripción en los comentarios de esta página), si no es miembro por favor visite el enlace a continuación en nuestra Firma.
Gracias por echarle un vistazo!.

Volatility Color‴What does it do?
Used for calling your attention to rally price movements:
1. red color: signals that the market is "hot" and price spread might be on its way;
2. blue color: signals that the market is "cold" and regular or no price spread will be seen;
3. right side bar signals the market mood (hot or cold) in order to call your attention
How does it work?
When the indicator color is red the market tends to move fast and with volume. The distance between the volatility colored and the black moving average lines gives you a hint of the volatility direction.
This indicador is used in conjunction with other indicadtor in the BOLLINGER BLAST setup that provides a way bigger knowledge of a huge price rally.
What's my filling?
It's just great once you DO NOT have to keeo your eyes on the indicator, just let the red color pop up into your eyes. In other words, let the indicator work for you, let it do the easy stuff while you focus on the strategic part of the trade.
Indicator attributes:
- red color suggests trade with rally and or volume
- blue color suggests regular or weak trade
- right side bar: signals the suggested trade mood (same volatility lines signals)
To have access to this indicator, please DM me.
Don't contact me in the comment area.

Pivotal Zones-What is Pivotal Zones?
an algorithm taking the guess work out of finding your stop loss and take profit.
-What makes the strategy unique?
it makes it easy for a brand new learner to understand.
-What features does the strategy include?
it finds reversal zones on every time frame allowing you to fit your style of scalping, intraday or swing.
Enjoy :)

HYE Mean Reversion SMAIndicator version of the strategy "HYE Mean Reversion SMA "
"Long", "Short", "Exit Long" and "Exit Short" alarms added.
Use with "Once Per Bar Close".

Saper Aude [Alerts]Sapere Aude Strategy - Alerts
Trend based scalping strategy, to work on lower timeframes (15Minute - 1 Hour)
Calculations on ATR, strategy uses extra conditions to help filter out bad trades.
How to use the Indicator?
Simple as when green line shows below, that can be either a good entry point or a signal to start building limit orders on the plot.
I use the ATR as a trailing stop loss for exit.
vica versa for entering shorts. The strategy is only set up to take long positions though.
This is a great scalping strategy for bots in Ranging or up trending markets.
This scripts has 5 variations built within it which are fitted for certain coins & their timeframes
The coins included are
BTC /USDT 1 Hour
ETH/USDT 1 Hour
ADA/USDT 30 Minutes
DOGE/USDT 15 Minutes
LUNA/USDT/15 Minutes
You should find the preset alerts for these when you click "Add aler" on this indicator
You will see in the settings what default Stop losses I used
The script is written in Version 4
The strategy performs best on the Binance listings

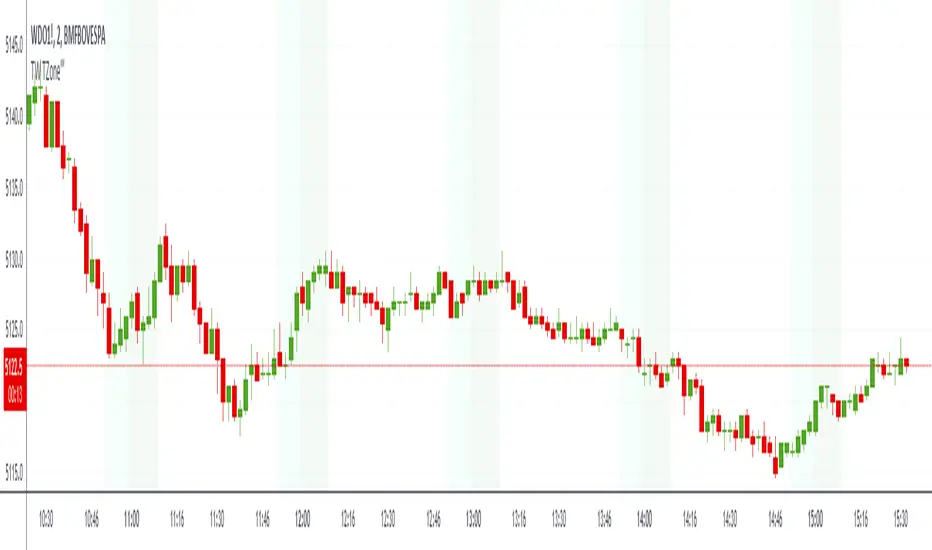
TZone‴ | Trading Zone‴What does it do?
Used in the Cryptocurrency Market and BOVESPA's mini-contract (IND & DOL) and regular stock market (Brazil). This indicator allows you to identify
1. open and close market time;
2. daily dollar ajustments for BOVESPA mini-dollar;
3. daily possible trading zones for Cryptos.
How does it work?
The indicator colors the background with suggested areas according to the above stated.
What's my filling?
It's just great once you DO NOT have to memorize nor remember these important zones. In other words, let the indicator work for you, let it do the easy stuff while you focus on the strategic part of the trade.
Indicator attributes:
- BOVESPA mini-contract (IND & DOL markets): open, close, aftermerket, dollar ajustment;
- BOVESPA regular stock market: open, close, aftermerket;
- Crypto: open, close, trading zones;
- all time/trading zones are ajustable;
- there is a extra time/trading zone disabled that you can enable and set the time window you wish to test.
To have access to this indicator, please DM me.
Don't contact me in the comment area.
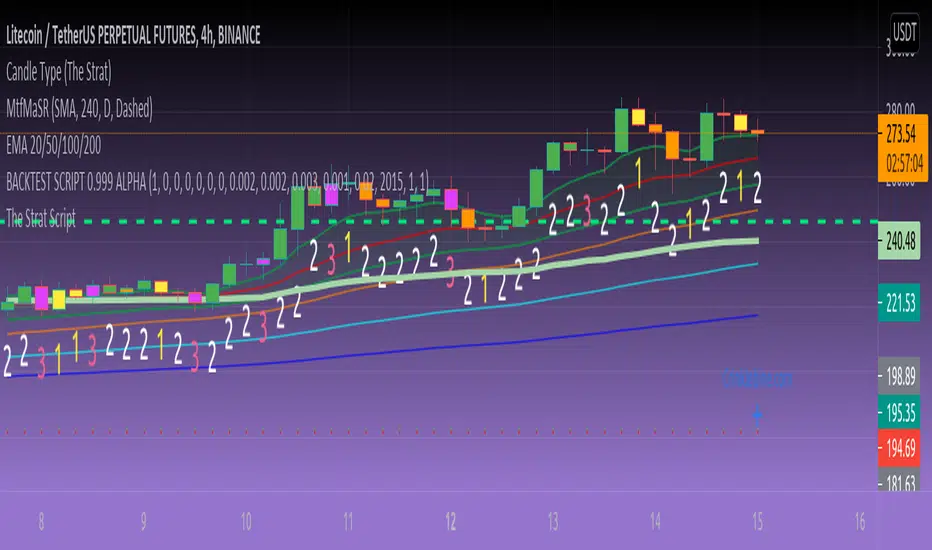
[Sidders] MACDEMASAR IndicatorCame across a cool idea for a strategy that couldn't find in the indicator database, so decided to code it up myself for your pleasure.
Indicators consists of 3 indicators: EMA(200) to determine the overall trend, and the MACD & Parabolic SAR to determine entries (and exits).
Long entry contains 4 conditions and is generated when price is above the 200EMA (1), the MACD crosses above the signal line (2), while they are both below 0 line (3) and when the parabolic SAR is below the closing price of the bar (4).
Short entry is build up the same but in reverse: price is below the 200EMA(1), signal line crosses below the MACD line (2), while they are both above the 0 line (3) and when the parabolic SAR is above the closing price of the bar (4).
Place the stoploss on the parabolic SAR dot below/above the candle that created the signal. Profit target 1:1 risk:reward ratio, but can ofcourse be changed according to your risk apetite. Might add automatically drawn SL/TPs in a later update.
Concept behind the strategy should work on all timeframes, but will require proper backtesting. I think with additional filters the strategy can also be way more finetuned and profitable, personally haven't had the time yet to dive into that.
Have also added alerts for your convenience.
Enjoy!

All in One StudyHere is my All in One Strategy converted into a Study with Alert Conditions you can use for whatever purpose you wish.
Each condition is set up similarly to the way I had the strategy set up, if you pick the indicators you want to base your alerts on it will alert you only if the check box is true.
You can pick one or more of the indicators if you'd like. I only suggest to pick one at a time so you don't have overlapping buy/sell alerts.
I think everyone will find the message of the market falling alert amusing :-)

Logging in Pine ScriptI'm building quite a lot of pretty complicated indicators/strategies in Pine Script. Quite often they don't work from the 1 try so I have to debug them heavily.
In Pine Script there are no fancy debuggers so you have to be creative. You can plot values on your screens, check them in the data window, etc.
If you want to display some textual information, you can plot some info as labels on the screen.
It's not the most convenient way, so with the appearance of tables in Pine Script, I decided to implement a custom logger that will allow me to track some useful information about my indicator over time.
Tables work much better for this kind of thing than labels. They're attached to your screen, you can nicely scale them and you can style them much better.
The idea behind it is very simple. I used few arrays to store the message, bar number, timestamp, and type of the message (you can color messages depend on the type for example).
There is a function log_msg that just append new messages to these arrays.
In the end, for the last bar, I create the table and display the last X messages in it.
In parameters, you can show/hide the entire journal, change the number of messages displayed and choose an offset. With offset, you can basically scroll through the history of messages.
Currently, I implemented 3 types of messages, and I color messages according to these types:
Message - gray
Warning - yellow
Error - red
Of course, it's a pretty simple example, you can create a much fancier way of styling your logs.
What do you think about it? Is it useful for you? What do you use to debug code in Pine Script?
Disclaimer
Please remember that past performance may not be indicative of future results.
Due to various factors, including changing market conditions, the strategy may no longer perform as good as in historical backtesting.
This post and the script don’t provide any financial advice.

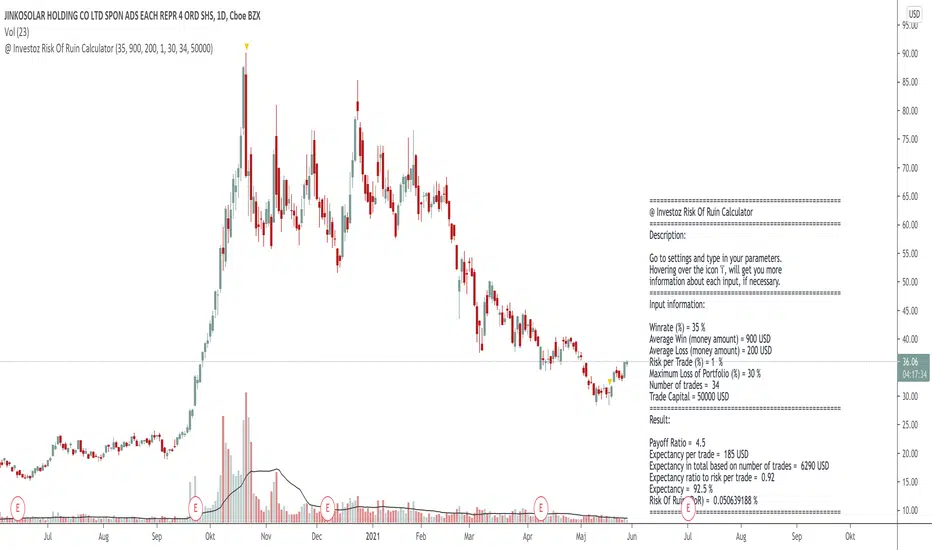
@ Investoz Risk Of Ruin CalculatorWhat is risk of ruin?
The risk of ruin is a statistical concept that matches the probability that you reach the point where it is no longer possible to recover the losses or continue. Please note that this is not the total capital in your account, as you should NEVER risk 100% of your capital.
Ideally, you should be prepared to risk 25-30% of your account as a MAXIMUM breakpoint before you need to stop trading. If that maximum is reached, review your trading plan for new goals and risk settings to determine if you can continue trading and then develop a new plan. You should never have a drawdown of 50% or more, because then you have to get 100% return, just for breaking even!
Considering that new traders are highly risk averse and have no idea of how much risk they can afford to take for each trade, they most likely end up blowing up their account. They probably did not wanted to see it as a possibility, just saw the opportunity to earn money.
Therefore, risk management is one of the key points a trader need to know well, to avoid reaching our point of destruction. This is what allows you to survive and stay in the game in order to have a greater chance of making money in the markets. Every trader must therefore calculate their chances of reaching this drawdown level. Simply put, the more you risk per trade, the more you increase the risk of destruction. So the easiest way to avoid the risk of ruin is to risk only a small portion of your account on each trade. Risk should never exceed 1-2% of the account per trade (preferably less) otherwise that path to point of destruction is where you are heading.
It is obviously not possible for a trader to make money without taking some risk, but it is imperative that he / she knows what his / her risk is and that he / she is prepared to take it. If a trader is not willing to take risks on his / her trading account, trading is not for him / her, it's that simple.
How the Risk Of Ruin Calculator works
You need to know a few things before you can use this calculator. You need to manually go to the indicator settings and make a few inputs over following:
(If you use a pine script strategy, you have all the info you need. Go to "Strategy Tester" and then "Performance Summary").
Inputs
Win rate = How profitable your strategy is in % terms.
Average win = Average winning trade, in money terms.
Average loss = Average losing trade, in money terms.
Risk per trade = How much risk of your portfolio you take at each trade.
Maximum Loss Of Portfolio = What is the total percentage loss of your portfolio that you can afford to risk before you stop trading.
Trade Capital = The total sum of your current trade capital.
Outputs
Payoff ratio = The payoff ratio is simply the system's average profit per trade divided by the average loss per trade.
Expectancy = Is the win rate of the strategy divided by payoff ratio.
Risk of ruin ( RoR ) = Risk of ruin is the probability of a strategy losing money, to the point where it is no longer possible to recover the losses or continue.
=============================================================================================================================================================
DISCLAIMER
Any data and information is provided 'as is' solely for informational purposes, and is not intended for trading purposes or advice. Past performance is not indicative of future results.
Educate yourself on the risks associated with trading, and seek advice from an independent financial or tax advisor if you have any questions.
=============================================================================================================================================================
Bank Heist ( Matrix 5 EMA With Delorean Indicator Alerts )Bank Heist ( Market Maker / Matrix 5 EMA With Delorean Indicator Alerts )
Welcome to the "Bank Heist" Indicator
This indicator is based on one strategy that many many individuals and companies have tried to label as their own, brand it, and resell it. The names of these companies will be listed below as to not "steal" the strategy from the people trying to brand EMA's and also to help those using keyword searches (based on the many hot terms coined over the years) to find this indicator. I personally have decided to add to the confusion and call it the "Bank Heist" so as to not appear to be "stealing" someone elses name for free indicators 😊
The Strategy
Simple:
The EMA's are below price, look for buys. EMA's above price, look for sells.
The 50 EMA is ALWAYS market equilibrium
Intermediate:
5 EMA Crossing Up 13 EMA With The 50 EMA Under everything = Buy
5 EMA Crossing Down 13 EMA with 50 EMA Above everything = Sell
The 50 EMA is ALWAYS market equilibrium
Advanced:
Simple+Intermediate
The higher period the EMA , the Longer the trend.
All time frames must pull back to ALL EMA's at some point during the trend
🤯 Each EMA is one period different, one time frame up or down (Example: The 13 EMA on the 15m chart is the same as the 5 EMA on the 1hr Chart)
🔑 If you don't understand this and/or want to study it further then mark each EMA on the 15m chart, then move up one time frame at a time all the way to the daily chart.
🧙♂️ After it "clicks" , just remember that price must always pull back to all EMA's on all time frames, The 50 EMA is ALWAYS market equilibrium
Delorean Indicator Alerts:
Set alarms on TradingView with this indicator!
For those who don't know what this is:
Two candles cutting through the 13 ema, second candle bigger, trade in the direction of the trend.
Special Notes:
The 50 EMA is ALWAYS market equilibrium
The Highly Skilled Will See How To Get The Worlds Tightest Stop Loss
THIS WORKS ON ALL TIME FRAMES (Yes, 1 minute throught 1 year)
THIS WORKS ON ANY FINANCIAL INSTRUMENT
You Can Also Set Alerts For The EMA's Crossing ( 5 EMA Crossing 13 EMA , ETC.)
🔮 Study These, You Cant Make This Up 🔮
Famous Trading System Names That Got You Here
Ordered from true original to most recent "creators" in chronological order
FXPX
Matrix
Matrix Trading System
Matrix 5 EMA
5 EMA
5 EMA's
Market Maker
MarketMaker
Delorean
Delorean Indicator
Delorean Strategy
IM Academy
Bank Heist (Free & Condensed TradingView Indicator)
DISCLAIMER
THIS IS NOT FINANCIAL OR INVESTMENT ADVICE AND SHOULD NOT BE INTERPRETED AS SUCH.
Trading foreign exchange on margin carries a high level of risk, and may not be suitable for all investors. Past performance is not indicative of future results. The high degree of leverage can work against you as well as for you. Before deciding to invest in foreign exchange you should carefully consider your investment objectives, level of experience, and risk appetite. The possibility exists that you could sustain a loss of some or all of your initial investment and therefore you should not invest money that you cannot afford to lose. You should be aware of all the risks associated with foreign exchange trading, and seek advice from an independent financial advisor if you have any doubts.

MACD + PSAR SetupThis indicator combines 3 elements:-
1. MACD which will act as a source of potential Buy Signal
2. PSAR which provides the confirmation for buy signal and for potential Buy on Dip Strategy
3. Breakout candles which provides the confirmation signal for Buy on Breakout strategy
4. The direction of the trend is provided by the Exponential Moving Average
The strategy is to have any counters which has triggered the MACD Golden Cross signal. These counters are to be out under watchlist for further confirmation.
The Buy Signal is confirmed when:-
1. Price is above EMA Direction(standard is set at 200)
2. PSAR has given the Buy Signal OR a Breakout Candle occurs.
Buy Signal is shown with a Green Diamond symbol whilst the Sell Signal is shown in Red Diamond Symbol.
The bullish and bearish condition is set via a green and red background
The MACD and PSAR codes are derived from the standard codes which is available in tradingview.

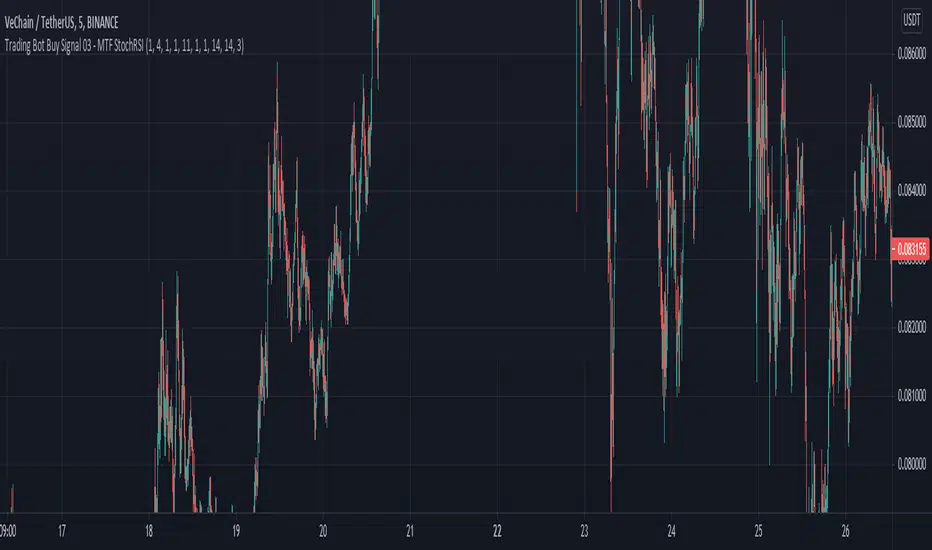
Trading Bot Buy Signal 03 - MTF StochRSIWelcome to our third Tradingview buy signal indicator.
We develop signals which have been specially developed for crypto trading bots. We publish new indicators at regular intervals.
This indicator is based on our "Trading Bot Buy Signal 03 Strategy - MTF StochRSI" strategy, so that you can apply and test this strategy to your charts/pairs.
The basic idea of this script is to use the stochastic RSI indicator in multiple Timeframes. When all selected timeframes show an oversold and in 5 Min Timeframe is an crossover, it triggers a solid buy signal. This strategy is relatively robust against false breakouts, even if these can of course never be avoided. These signals occur relatively rare, but you can set an alarm up on different pairs simultaneously. The strategy needs to be set up in 5 min chart cause of an additional crossover buy condition. It wasnt tested in Forex etc. but feel free to test it.
We recommend to base your sell strategy on trailing stop-loss and not indicator based. A traling stop-loss arming at 1% and trailing stop-loss percentage at 0.3% works well. Our goal was it to reduce the average coin holding time to a minimum. We recommend this procedure cause we believe in the power of long term uptrending crypto, compounding and dont want to sell at a loss in a false breakout. But you can handel it like you prefere.
This indicator using different timeframes so it is sending a repainting warning. Cause it calculates values in a different timeframe. But thats normal and it wont recalculate results.
Feel free to adjust the parameters to your preferences:
- Adjust the values of Stoch - K and Length of RSI and Main Stoch to change the sensitivity of the indicator
- Turn on different timeframes or leave default timeframes
- Adjust the oversold Limit of the StochRSI indicator to change results
We sell this indicator so it is invite only. But of cause you can test it before buying. Also you can freely test the strategy before. Simply check out our profil and look for "Trading Bot Buy Signal 03 Strategy - MTF StochRSI".
If there are questions, write them into the comments or contact us directly over the direct message. Happy Trading!
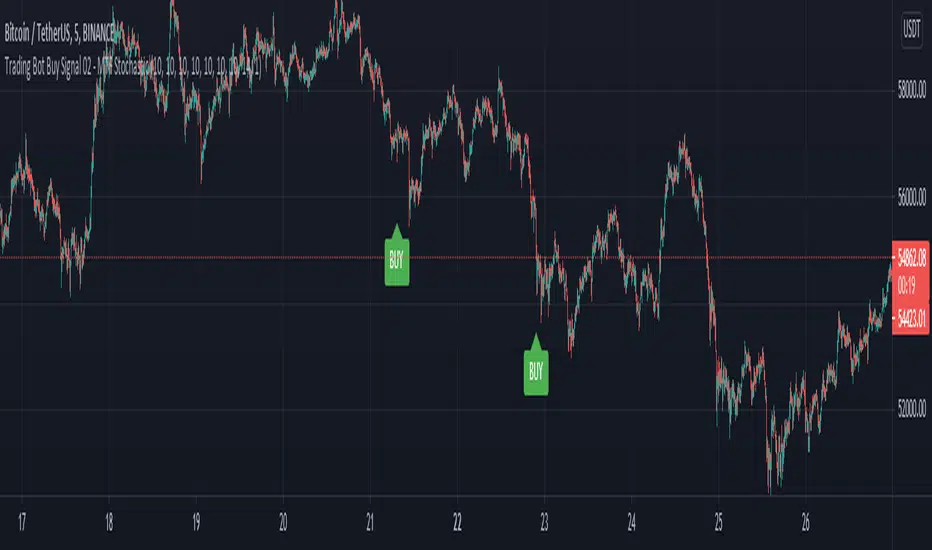
Trading Bot Buy Signal 02 - MTF StochasticWelcome to our second Tradingview buy signal indicator.
We develop signals which have been specially developed for crypto trading bots. We publish new indicators at regular intervals.
This indicator is based on our "Trading Bot Buy Signal 02 Strategy - MTF Stochastic" strategy, so that you can apply and test this strategy to your charts/pairs.
The basic idea of this script is to use the stochastic indicator in multiple Timeframes. When all selected timeframes show an oversold it triggers a solid buy signal. This strategy is relatively robust against false breakouts, even if these can of course never be avoided. These signals occur relatively rare, but you can set an alarm up on different pairs simultaneously. The strategy works best in 5 min chart and in crypto pairs. It wasnt tested in Forex etc. but feel free to test it.
We recommend to base your sell strategy on trailing stop-loss and not indicator based. A traling stop-loss arming at 1% and trailing stop-loss percentage at 0.3% works well. Our goal was it to reduce the average coin holding time to a minimum. We recommend this procedure cause we believe in the power of long term uptrending crypto, compounding and dont want to sell at a loss in a false breakout. But you can handel it like you prefere.
This indicator using different timeframes so it is sending a repainting warning. Cause it calculates values in a different timeframe. But thats normal and it wont recalculate results.
Feel free to adjust the parameters to your preferences:
- Adjust the values of Stoch - K and Stoch - D to change the sensitivity of the indicator
- Turn on different timeframes or leave default timeframes
- Adjust the threshold value of the stoch indicator to change results
We sell this indicator so it is invite only. But of cause you can test it before buying. Also you can freely test the strategy before. Simply check out our profil and look for "Trading Bot Buy Signal 02 Strategy - MTF Stochastic".
If there are questions, write them into the comments or contact us directly over the direct message. Happy Trading!
Crypto Bot Buy Signal 01 - Optimized RSI MomentumWelcome to our first Tradingview buy signal indicator.
We develop signals which have been specially developed for crypto trading bots. We publish new indicators at regular intervals.
This strategy is based on our "Crypto Bot Signal 01 - Optimized RSI Momentum" indicator, so that you can apply and test this strategy to your charts/pairs.
The basic idea of this script is to compare a low sensitive RSI with a low sensitive smoothed RSI to find the sweet spot to buy. This strategy is relatively robust against false breakouts, even if these can of course never be avoided. These signals occur relatively rare, but you can set an alarm up on different pairs simultaneously. The strategy works best in 5 min chart and in crypto pairs. It wasnt tested in Forex etc. but feel free to test it.
We recommend to base your sell strategy on trailing stop-loss and not indicator based. A traling stop-loss arming at 1% and trailing stop-loss percentage at 0.3% works well. Our goal was it to reduce the average coin holding time to a minimum. We recommend this procedure cause we believe in the power of long term uptrending crypto, compounding and dont want to sell at a loss in a false breakout. But you can handel it like you prefere.
Feel free to adjust the parameters to your preferences:
- A lower value of the RSI and EMA length makes this indicator more sensitive
- A lower threshold value results in better trades but it reduces the amout of possible trades per day
- A higher threshold value results in more trades but the risk of false breakouts gets higher
We sell this indicator so it is invite only. But of cause you can test it before buying. Also you can freely test the strategy before. Simply check out our profil and look for "Crypto Bot Signal 01 Strategy - Optimized RSI Momentum".
If there are questions, write them into the comments or contact us directly over the direct message. Happy Trading!

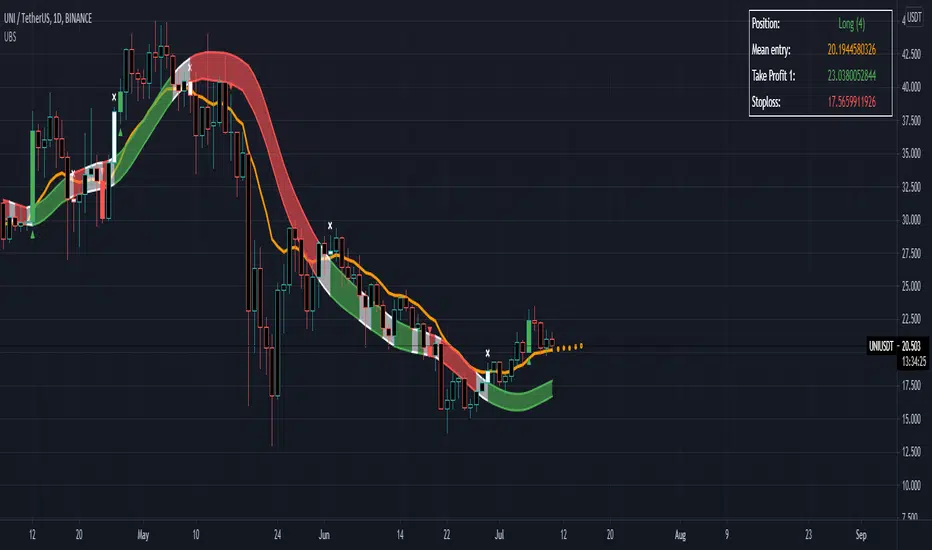
B1rd's Moving AverageThis special moving average is supported by many filters such as the RSI, CCI, Waddah attar, Ichimoku cloud, DMF, TSI and ATR. Combining these indicators will acts as a powerful tool to help us find the direction in trend.
With this indicator, we aim to provide you the best trend trading strategy that includes take profit and stop loss levels.
The fast moving average is named the base line, the slow moving channel is called the secondairy baseline.
Basic instructions:
The strategy prints signals in the form of a green circle in the case of a LONG signal, a red circle in the case of a SHORT signal and white cross above the candle in the case of an exit signal.
Regarding Baselines
There are two Baselines, the primary orange baseline and the secondary which changes color. Both these trendlines are used to determine price trend.
The secondary Baseline consists of a Keltner Channel which is an average True Range of the secondary baseline moving average. The color red on the secondary baseline indicates a bearish trend and the green color indicates a bullish trend. A white secondary baseline indicates a NO TRADE ZONE
Regarding Signals
When price is above both baselines, a LONG signal may be printed by the strategy depending on further verification by other internal calculations.
The LONG signal indicates a bullish trend and allows you to open a long trade. The most optimal way to long the asset is when price is near or at the primary baseline. The qualifier zone also satisfies this criterion, especially when dealing with high momentum in price.
Trend continuation Signals are the color of the relative Trend and they have a diamond shape. They indicate continuation of the trend.
In the case of a SHORT signal, price must be below both baselines. A SHORT signal indicates a bearish trend and indicates opening a short trade. Regarding when to short the position, the same criteria for a long position apply. Namely when price is near or at the baseline or in the qualifier zone.
When an Exit Signal prints, a white cross above the candle for a Long and below the candle for a short, closing of the position in question is recommended.
Regarding stoploss, profit, closing of the trade
The plot tp/sl lines is used to indicate a hard stoploss and take profit level based on an average true range of price.
When a candle closes below both baselines after an active LONG signal or above both baselines after an active SHORT signal, closing the trade is recommended. These criteria serve as secondary exit indicators.
Settings:
The initial setting allows us to select a template from a list of already tested settings. We can change the Template with this setting, make sure to use the corresponding chart and timeframe to get accurate results. More template settings will be updated in the future. Choosing any template setting but custom will override any other setting within the indicator.
Second, we have settings that allow us to input the Smoothing Type and Length on both baselines.
This also manipulates the Keltner Channel surrounding the Secondairy Base Line.
Below this you can find the exit signal option, which will cause the indicator to print exit signals.
The next setting will call upon a forecast on the primary baseline, which could help you determine future support levels based on the selected moving average.
The show Qualifier line option will plot the Entry Qualifier. It will automatically determine trend based on close relative to the Base Line, however you can Override this with the boolean option.
Finally we can enable the Take Profit and Stop Loss options. By default, these will not plot. If you desire to see recommended Take Profit and Stop Loss Levels, you can enable the checkbox in this section.
Strategy
The primary function of this indicator is to detect changes in trend. But it can also be used to supply entry levels, take profit levels and stop loss levels.
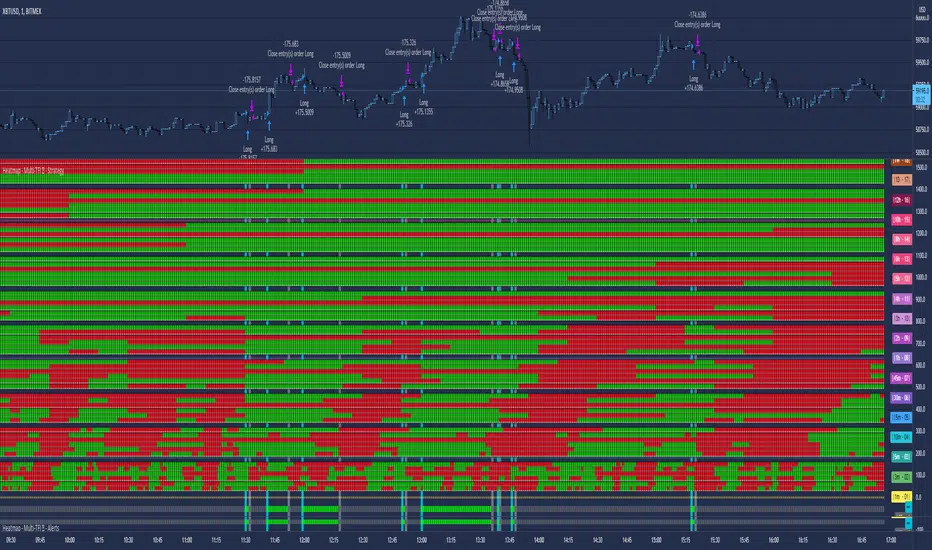
Heatmap - Multi-Timeframe Indicators - AlertsHeatmap - Multi-Timeframe Indicators - Alerts
▪ Main features :
- 19 Timeframes: 1m, 3m, 5m, 10m, 15m, 30m, 45m, 1h, 2h, 3h, 4h, 5h, 6h, 8h, 10h, 12h, 1D, 1W, 1M
- 6 indicators per timeframe
- choose specific timeframes for indicators (example - 1 hour)
- or choose specific timeframe ranges (example - 1 hour to 1 month)
The general idea is that the higher timeframe signals are stronger than the lower timeframe ones.
When a trend is starting, it is first visible on the lower timeframes.
The more time passes, the more the trend propagates through higher timeframes.
The default settings are meant to show all the available features. You may fine-tune it to your specific needs.
How to choose the timeframe for the chart : use the lowest of the choosen timeframes for indicators.
If the heatmap doesn't display correctly on your device, you may check the Heatmap Theme 🎨 setting.
It doesn't repaint.
"Repaint" version available though - good to check the past history, but very bad for real-time analysis.
▪ Indicators used for trend detection
1. MACD Cross
2. Stochastic Cross
3. Stochastic Cross and Overbought or Oversold
4. Moving Average
5. Parabolic SAR
6. Heikin Ashi
▪ Find the best Heatmap settings with the Strategy Tester version.
The signals generated by the Heatmap are considered to be valid at the bar open .
The Strategy Tester, however, uses the bar close in its calculations.
Therefore, the results may seem to be worse than they can be.
The Profitability, Profit Factor and other stats should be taken into consideration relatively to other configurations of the same Heatmap.
▪ Using a score system to consider a change in trend valid.
Example: consider the signal valid if 65% or more of all indicators (max 6) among all timeframes (max 19) hint at a change in trend.
The % percent value can be inserted in settings.
When using the default settings or when all timeframes and indicators are activated,
the ratio of 100% downtrend or 100% uptrend may be less occuring. Adjust accordingly.
The signals across timeframes and indicators are aggregated to show simple entry and exit signals.
▪ Combined Alerts, to be set to fire once per bar open :
0 - 📈 Long! - Heatmap - Multi-TFI
0 - 📈 Short! - Heatmap - Multi-TFI
0 - 📈 Long Exit! - Heatmap - Multi-TFI
0 - 📈 Short Exit! - Heatmap - Multi-TFI
1 *** BUY or SELL (single alert) ***
1 *** Entries or Exits (single alert) ***
▪ Note : The initial load may be slow. If something doesn't seem to work, you can try the following:
- wait more time for it to load
- hide & show or remove & add back to chart
- don't add the indicator to chart multiple times in a short amount of time, as you may be rate limited
▪ Related Studies :
- Heatmap - Multi-Timeframe Indicators - Strategy Tester
- Risk Management System (Stop Loss, Take Profit, Trailing Stop Loss, Trailing Take Profit) - it can be connected to Heatmap - Multi-Timeframe Indicators - Alerts
▪ Layout example:
Envious' RSI Scalper - UpdatedHey Traders, I was really bored so I made this, nothing quality or anything just a simple bollinger + rsi strategy that could turn in some pips every day. This is also my second pinescript work that is published and I have worked hard for the customisation and aesthetic of the indicator so that you can play around with different settings and see what works well and what doesn't. This indicator is also beginner friendly and easy to use and understand, which is good for you traders to use!
Whats Included?
-> Relative Strength Index
-> JR's Bollinger Heat Bands
-> My twist to the strategy
-> Customisable RSI Settings
-> Customisable Overbought and Oversold Zones
-> Customisable Heat Band Zones (Lower Band, Upper Band, Outer Reach, No Zones)
-> Super Rare Condition Mode
-> Optional Dashboard
-> Built in win/loss system <- Triggered by hovering over the dashboard
-> Optional Onboard Strategy Display
How do I use it?
1. Add this indicator to your favourites list or search it up through the TradingView script search engine
2. Click the settings icon on the indicator's name to change settings
Price Input: Calculates the RSI's values based off the candle data chosen.
Index Length: The length decides how fast or slow the RSI will reach the chosen key levels, the higher the slower, the lower the faster!
Overbought Zone: This is a key level that RSI needs to hit before ticking off one of the sell conditions.
Oversold Zone: This is a key level that RSI needs to hit before ticking off one of the buy conditions.
Zone Select: This is a condition based off the bands and each one selects an area either within the band, outside the band or you can delete this condition.
Super Rare Condition: This is a confirmation based indicator to help with the RSI and it occurs less than RSI .
What is the strategy?
1. Make sure you are trading the following time period: UK Open - New York Closing
2. Make sure you acknowledge all the high volatility news event via tradays app or forex's website on the market research tab.
3. Look at pairs that aren't within the high volatility news ~ example EUR Dont trade pairs beginning or ending with EUR.
4. Wait for a signal to print or have RSI on your chart and set an alert for the levels you've chosen.
5. Enter and have a 5-10 Pip stop loss and aim for 5 Pips.
6. Only risk around 0.5% - 2% of your account and no more.
7. Don't enter if there is another RSI dip into the same level within the same day or don't re-enter!
8. Try and limit yourself to maximum 4 trades a day
9. No revenge trading!
Good luck traders and enjoy the indicator if you do decide to use this!

CME's BRL/USD to B3's USD/BRL ConversionThis indicator is made to calculate and show the spread between the currency pair USD-BRL being negotiatied in Brasil's B3 and in USA's CME Globex.
The orange line "Arbitrage" is the spread.
The red/green line is the "Stop Loss" recommended for the strategy. If the line is green, it means that the reward/tisk ratio is above 1.
IMPORTANT: MAKE SURE TO BE USING THE SAME TIMEFRAME ON BOTH THE INDICATOR AND THE CHART.
----------------------------------------------------------------------------------------------------------------------------------------------------------------------
"Este indicador é feito para calcular e mostrar o spread entre o par USD-BRL em negociação na B3 do Brasil e na CME Globex dos EUA.
A linha laranja "Arbitragem" é a propagação.
A linha vermelha / verde é o "Stop Loss" recomendado para a estratégia. Se a linha estiver verde, significa que a relação recompensa / risco está acima de 1.
IMPORTANTE: CERTIFIQUE-SE DE USAR O MESMO PRAZO NO INDICADOR E NA TABELA."

EMA clouds by KetOmanette Script derived from: by @granolabar_trades
Inspired by the strategie of @ripster47
3 EMA clouds:
- cloud 8-9
- cloud 5-12
- cloud 34-50

Envy's Bollinger Band RSI Strategy - My First ScriptThis is an indicator that prints buy and sell signals based off the conditions that are met and this strategy itself can be really good when used correctly and do not use this when you are looking at news pair or any pairs of high volatility and this can be done through looking at the market research on the forex.com website.
This strategy uses the bollinger bands paired with RSI to determine the possible entries and when these two conditions are met, one final condition will have to be met, which is the overstretched candle, and if these are all met then the entry is valid.
Now before placing an entry if you do decide to use this strategy please follow the steps below:
Recommended Time frame: 5 Minutes
If RSI is higher or equal to 75 -> Look for sells or enter a small position to test the burst of the candle
RSI > 75 and Overstretched -> Placing sells and if the candle builds up then you can have another position that can be greater than the previous if you want to take that risk (No more than 2 or 3)
Take Profit: 5-10 pips downwards
Stop Loss: 10 pips or higher
If RSI is lower or equal to 25 -> Look for buys or enter a small position to test the burst of the candle
RSI < 25 and Overstretched -> Placing buys and if the candle falls down then you can have another position that can be greater than the previous if you want to take that risk (No more than 2 or 3)
Take Profit: 5-10 pips upwards
Stop Loss: 10 pips or higher
Tip: For extra confirmation use the one minute time frame to your leverage, if both the 1 minute and the 5 minute has their RSI to the key levels then it will be a high probability trade!
Note: Do not trade high volatility news events
The time zone to trade in: London Open - New York Closing
The script also provides you with multiple interchangeable settings that can provide you a better picture of trades and reduce noise, however this is my first script so there will be errors that will be listed below!
The dashboard will show you current RSI value, current pair, current timezone, overall trend with the 100MA and the strategy trend with the bollinger band.
Known Bugs:
-Sometimes the signals won't print depending on the bollinger band upper or lower ring and this can be fixed by lowering RSI, changing RSI source output, changing the bollinger band settings etc.
-The print text is constantly recreated after every candle that meets the conditions (mostly appears on news event pairs) and this can be annoying to see and has a lot of noise - noise can be reduced through increasing RSI Source
-The timezone on the dashboard is constantly set to New York for some odd reason
