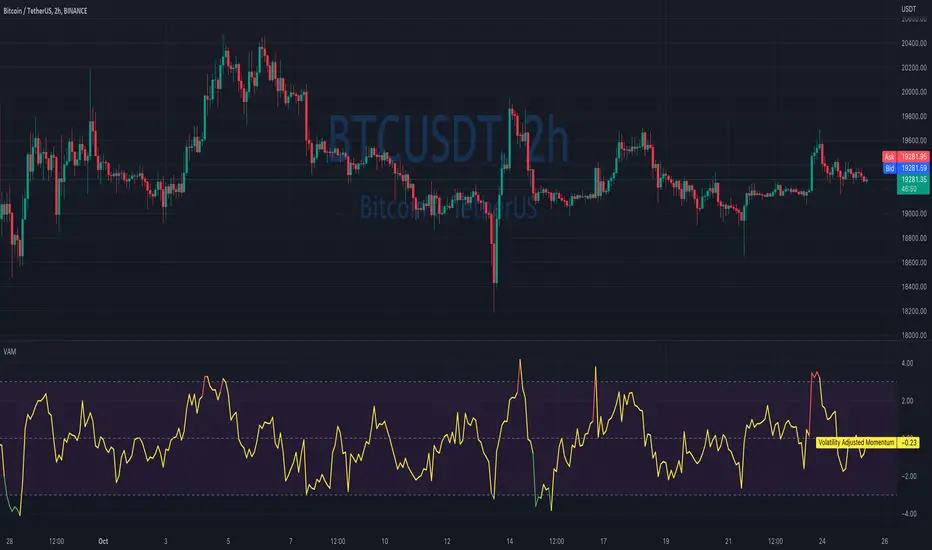
Volatility Adjusted MomentumIt's a script that computes volatility-adjusted momentum indicators.
The problem with the momentum indicator is that it's absolute and it's hard to interpret its value. For example, if you'll change the timeframe or instrument value of Momentum will be very different.
We tried to solve that by expressing momentum in volatility. This way you can easier spot overbought/oversold values.
You can choose to use Standard Deviation or ATR for adjustments.
Thanks to @MUQWISHI for helping me code it.
Disclaimer
Please remember that past performance may not be indicative of future results.
Due to various factors, including changing market conditions, the strategy may no longer perform as well as in historical backtesting.
This post and the script don’t provide any financial advice.
Wyszukaj w skryptach "the strat"
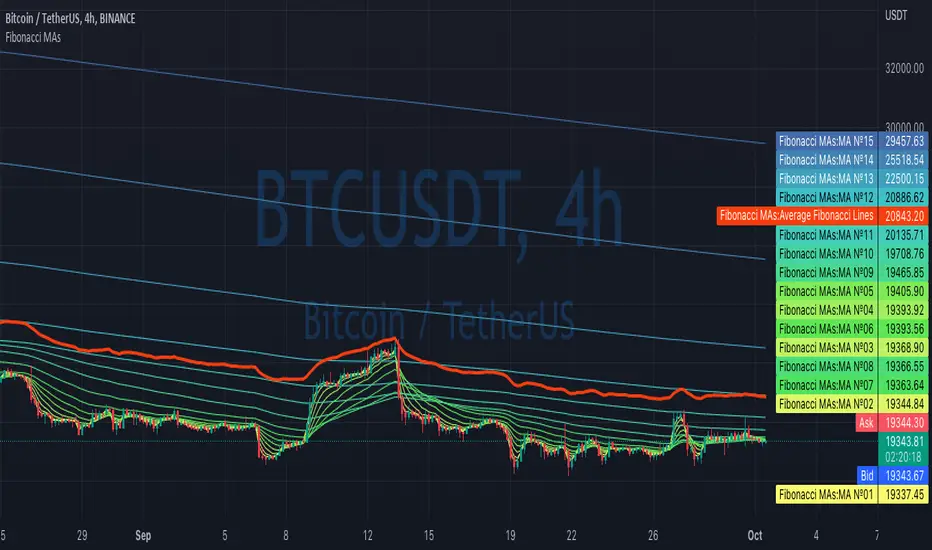
Fibonacci MAsIt's a pretty simple script. Idea is to compute MAs with the length of Fibonacci numbers and then compute an average of them all.
In the script, you can choose the type of MAs and how many Fibonacci numbers to use for it.
You can also adjust the length of these MAs manually and choose the color of every one of them.
Thanks to @MUQWISHI for helping me code it.
Disclaimer
Please remember that past performance may not be indicative of future results.
Due to various factors, including changing market conditions, the strategy may no longer perform as well as in historical backtesting.
This post and the script don’t provide any financial advice.
Portfolio PerformanceThis indicators will help you to compute portfolio performance and display results with a stats table and a nice monthly chart.
In this script you can do following:
Compose portfolio with up to 15 instruments
Change Initial capital / date range / rebalancing period
Compare portfolio performance with a benchmark
Compute basic stats
Compute instruments contribution
Display monthly performance of portfolio and benchmark
Change style for almost everything you see on your chart
Hope it will be useful for you!
Thanks to @MUQWISHI for helping me coding it.
Disclaimer
Please remember that past performance may not be indicative of future results.
Due to various factors, including changing market conditions, the strategy may no longer perform as well as in historical backtesting.
This post and the script don’t provide any financial advice.

Gann Square of 144This indicator will create lines on the chart based on W.D. Gann's Square of 144. All the inputs will be detailed below
Why create this indicator?
I didn't find it on Tradingview (at least with open source). But the main reason is to study the strategy and be able to draw it fast. Manually drawing the square is not hard, but moving all together to the right spots and scale was time-consuming.
It has a lot of inputs...
Yes, each square point divisible by 6 has information with some options, so the user can create any configuration he wants. Also, it has the advantage of having the square built in seconds and adjusting itself on each new calculation.
About the inputs
Starting Date
This input will be used when the "Set Upper/Lower Prices and Start Bar Automatically" checkbox is not selected. The indicator will calculate all the line locations on the chart using the selected start date. When selecting this input, change the Manual Max and Min Prices to the better calculation
Manual Max/Min Price
This input will be used when the "Set Upper/Lower Prices and Start Bar Automatically" checkbox is not selected. The indicator will calculate all the line's locations on the chart using these prices
Set Upper/Lower Prices and Start Bar Automatically
Selects if the starting date will be automatically selected by the system or based on the input data. When it's set, the indicator will use the most recent bar as the middle point of the square, using the higher price as the Upper Price and the lowest price as the Lower Price in the latest 72 bars (or more based on the Candles Per Division parameter)
Update at a new bar
When this option is market, the indicator will update all created lines to match the new bar position, together with all the possible new Upper/Lower prices. Let it unchecked to watch the progression of the price while the square remains fixed in the chart.
Top X-Axis
When checked, it will display the labels on the Top of the square
Bottom X-Axis
When checked, it will display the labels on the Bottom of the square
Left X-Axis
When checked, it will display the labels on the left of the square
Right X-Axis
When checked, it will display the labels on the right of the square
Show Prices on the Right Y-Axis
When checked, it will display the prices together with the labels on the right of the square
Show Vertical Divisions
Show the lines that will divide the square into 9 equal parts
Show Extra Lines
Show unique lines that will come from the Top and bottom middle of the square, connecting the center to the 36 and 108 levels
Show Grid
When selected, it will display a grid in the square
Line Patterns
A selector with some options of built-in lines configuration. When any option besides None is selected, it will override the lines inputs below
Numbers Color
Select the color of each number on the Axis
Vertical Lines Color
Select the color of the vertical lines
Grid Color
Select the grid line color
Connections from corners to N
Each corner is represented by 2 characters, so they all fit in a single line
It will indicate where the line starts and where it ends
┏ ↓ = Top Left to Bottom
┏ → = Top Left to Right
┗ ↑ = Bottom Left to Top
┗ → = Bottom Left to Right
┓ ← = Top Right to Left
┓ ↓ = Top Right to Bottom
┛ ← = Bottom Right to Left
┛ ↑ = Bottom Right to Top
Besides selecting what line will be created, it's possible to select the color, the style, and the extension
How to use this indicator
When you dig into Gann's books for more information about the square of 144, you find that it was part of his setup with multiple indicators (technical and fundamental, and astrological). It is not a "one indicator" setup, so it's hard to say that you will find entries, exits, stop loss, and take profit in this. Still, it will help see trendiness, support, and resistance levels.
Mixing this with other indicators is probably a good idea, but some may find this indicator the only one needed.
Some aspects of the square
The end of the square is important, so where it starts is crucial. The end is important because it is where the price and time expire. The other parts of the square are defined based on their start and end, so placing them right is essential.
So, where to set the start of the square?
The last major low is the most indicated. The minimum price will be the lowest, and the max price will be the last major Top. Note that the indicator uses 1 candle on each point.
After finding the start, the minimum, and the maximum prices for the square, it will draw all lines. Another essential part of the square is The Midpoint.
The midpoint is the most crucial part of the square and is the best way to see if you positioned the square correctly. When the price is inside the square, using the starting candle as the start, a second higher low or a lower high occurs in that spot. When using the Vertical lines in the indicator, it's the middle square inside Gann's square.
The other divisions will be opposing each other most of the time. So if the price is rising in the 1/3 of the square, it's common to see the price fall in the 3/3 of the square.
More information about these aspects here
Considerations
This indicator was meant for price targets and a time calculator for possible support/resistances in the chart. It was created by William Delbert Gann and was part of his setup for trading almost a century ago. The lines will form geometric figures, which Gann used with high accuracy to predict tops/bottoms and when they would occur.

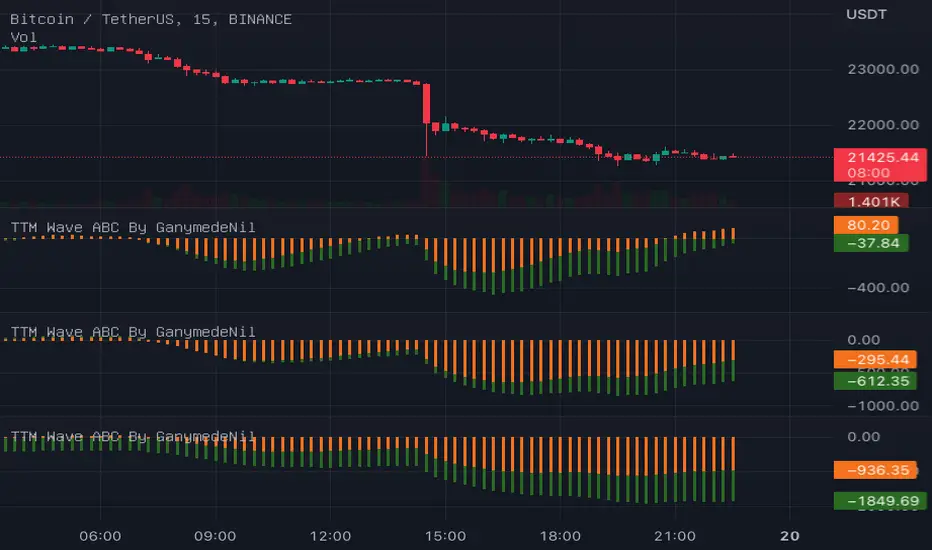
TTM Wave ABC By GanymedeNilTo facilitate the production of an open source version of the strategy TTM Wave ABC
Upvol and DownvolThis is a tweaked version of
What's Added?
- No negative graph lines (I want to see the crossovers in volume)
- Added NQ
- Adjusted enabled tickers (ES and the current ticker are enabled)
- Adjusted the moving average to better fit the strategy I was backtesting
How to use?
I watch it with other indicators for the cross over in positive delta/negative delta of the volume
- short volume crossing above long? consider going long
- long volume crossing below short consider going short
Also watching the total volume to see if it's going up or down (don't enter if it's dropping or consider getting out)

Fractal Potential EntryFractal Potential Entry combine 3 ema and fractal and follow the strategy from Trade Pro on YouTube:
www.youtube.com
with good performance on the 1 minute chart
Feature:
Alert Sell and buy Potential Entry
Happy Trading

Custom Multi-Timeframe IndicatorIt's a pretty simple example of a nice custom screener you can run for multiple timeframes. This is an RSI screener, but you can easily change the function for your own Indicator.
Screener displays:
Last value of the instrument
RSI value for up to 10 instruments / 4 timeframes.
In Parameters you can change:
4 timeframes
10 instruments
Parameters for RSI
Styling parameters for table
If the selected timeframe will be lower than the current one you will receive a warning message in a table.
Thanks to @MUQWISHI to help me code it.
Disclaimer
Please remember that past performance may not be indicative of future results.
Due to various factors, including changing market conditions, the strategy may no longer perform as well as in historical backtesting.
This post and the script don’t provide any financial advice.

Lowest / Highest From WidgetRecent events inspired me to create a small widget that allows you to spot from when current value is lowest / highest.
Just add it to chart and script will compute most recent day when price was higher / lower than current and it will display:
Line coming from that value to the current one
A table with previous low/high information
Thanks to @MUQWISHI to help me coding it.
Disclaimer
Please remember that past performance may not be indicative of future results.
Due to various factors, including changing market conditions, the strategy may no longer perform as well as in historical backtesting.
This post and the script don’t provide any financial advice.

[blackcat] L1 Markos Katsanos Volume Flow IndicatorLevel 1
Background
Markos Katsanos’ volume flow indicator (VFI) calculation uses a default period of 130 days for daily charts. As a result, when applying the strategy, you will need to set the maximum number of bars the study will reference in the general tab of properties for all to at least 130. In order to compare the system objectively with the buy & hold results, he specified a trade size as a percent of equity.
Function
For more information see Markos Katsanos's articles in the June 2004 and July 2004 issues of Technical Analysis of Stocks & Commodities magazine. Period=days for VFI calculation. Default values are 130 for daily and 26 for weekly charts.Coef=coefficient for minimal price cut-of (use 0.2 for daily and 0.1 for intraday 5-15 min data) Vcoef=coefficient for volume cut-off (use 2.5 for daily and 3.5 for intraday charts)
Remarks
This is a Level 1 free and open source indicator.
Feedbacks are appreciated.

Screener for 40+ instrumentsAs you probably know in TradingView there is a limit of 40 instruments in one custom screener.
I created a script that will allow you to scan more symbols.
The idea of it is pretty simple. You have to add a screener a few times on your screen with a different set of symbols. Then select column width (as % of your chart width) and # of the screener right to left.
Script will plot #1 screener next to the right border. For #2 and all next tables, the script will compute the needed offset and will draw it on the left. This way it will look like one table and not a few separate indicators.
I created a script with an RSI screener, but you can create more complicated examples with it.
Off course, that's not a silver bullet solution but might work for some of you.
Disclaimer
Please remember that past performance may not be indicative of future results.
Due to various factors, including changing market conditions, the strategy may no longer perform as well as in historical backtesting.
This post and the script don’t provide any financial advice.

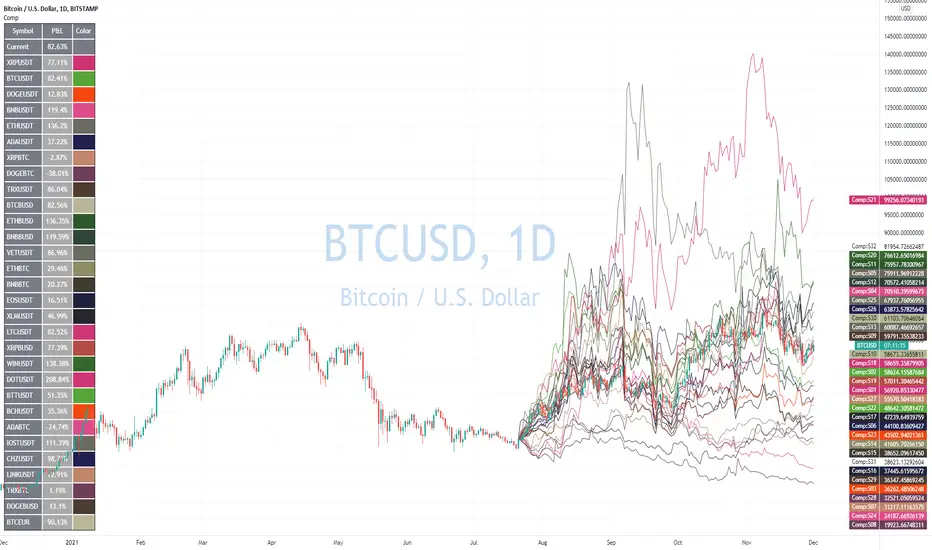
Advanced Comparison ToolWith the new Pine Script features you can build pretty interesting scripts.
Here is my try to expand functionality of basic comparison tool you have in TradingView.
When you apply it on your chart you can select a bar when do you want to start comparing your instrument from.
In parameters you can specify up to 32 symbols to compare. You can also disable symbols and change color for them as well.
As a result you'll see a table with summary and line for every instrument you selected as if it started from the close of the selected bar.
Disclaimer.
Please remember that past performance may not be indicative of future results.
Due to various factors, including changing market conditions, the strategy may no longer perform as well as in historical backtesting.
This post and the script don’t provide any financial advice
52 Weeks High/Low WidgetSome time ago I published my "All-Time High/Low Widget". I was asked to build and 52w weeks version.
So finally it's ready. It works pretty much the same way but uses a time period only of 52weeks.
You can also change the number of weeks in the parameters.
You can plot the levels and display some stats when 52W high/low happened and how far away are we at this moment.
Also, you can create alerts to get notified on 52W levels breakouts.
Disclaimer
Please remember that past performance may not be indicative of future results.
Due to various factors, including changing market conditions, the strategy may no longer perform as well as in historical backtesting.
This post and the script don’t provide any financial advice.

Multiple Indicators ScreenerA screener for multiple indicators with nice table output.
I was asked many times to update custom screener to display results in a table form. This way it looks much better.
You can play with background colors depend on values you're looking for.
In the screener, for example, I'm highlighting overbought/oversold RSI values, big ADX levels and trend of the Supertrend.
In parameters you can change settings for all indicators and change/disable tickers if 40 is too many for you.
There is only 1 function that calculates all these indicators. Potentially you can change and even add more indicators to this function.
Writing code for these kind of screener is a bit time consuming, so I even created a code generator in Python for these kind of indicators :) .
Disclaimer
Please remember that past performance may not be indicative of future results.
Due to various factors, including changing market conditions, the strategy may no longer perform as well as in historical backtesting.
This post and the script don’t provide any financial advice.

All-Time High/Low WidgetIt's a pretty simple widget to track all-time high and all-time low values.
You can plot the levels and display some stats when all-time happened and how far away are we at this moment.
Also, you can create alerts to get notified on ATH/ATL breakout.
Thanks to @Verleiht for helping me with the code.
Disclaimer
Please remember that past performance may not be indicative of future results.
Due to various factors, including changing market conditions, the strategy may no longer perform as well as in historical backtesting.
This post and the script don’t provide any financial advice.

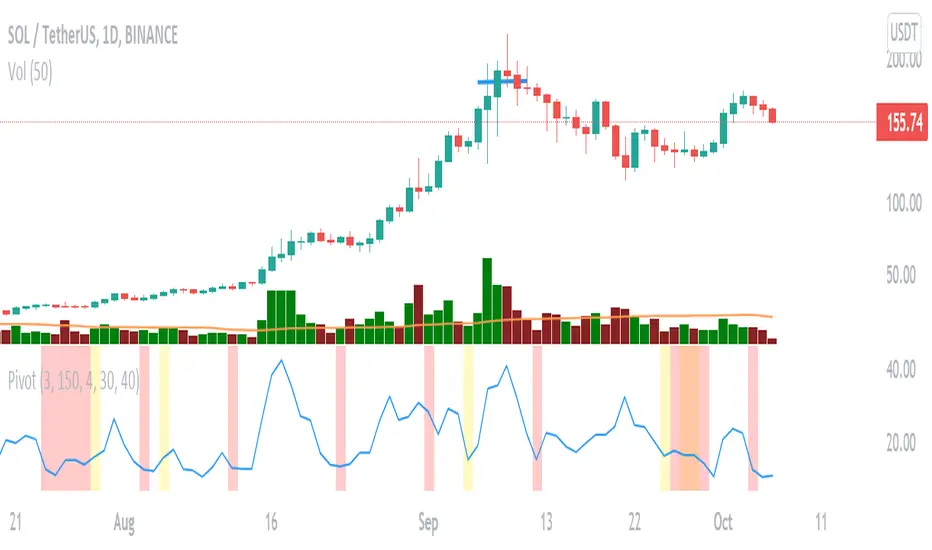
Pivot Point (MM)It helps indicate the contraction point so that we can have a low-risk entry of a buy point.
It followed the strategy of Mark Minervini.
changing the lookback period input to change the percentile
changing the Pivot Length to decide how many bars you would consider as a pivot
changing the Close range to decide in how much percentage does the close range you would consider as a pivot
The percentile rank is represented in the colour of the background, you can alter how low you want to set to indicate lowering volatility.
The blue line shows the percentage range in ( pivot length) days/bars
The coloured background shows the signal of pivot point forming
My Triple SupertrendThis the strategy for 3 Supertrend indicator, here is how it work:
buy : only buy if there is 2 supertrend with green line color, exit when there is 2 supertrend with red line color
sell : only sell if there is 2 supertrend with red line color, exit when there is 2 supertrend with green line color
it can apply to any timeframe except 1minute timeframe .

Nasdaq DowJones RATIOThis script gives you the ratio between the Nasdaq 100 and the Dow 30 (nas100/dow30). The RSI helps you understand when one of the two indices is overbought or oversold compared to the other one. This indicator is supposed to be of help for the strategy called spread trading, which consists in shorting an asset and buying the other one.

HYE Mean Reversion VWAPIndicator version of the strategy "HYE Mean Reversion VWAP"
"Long", "Short", "Exit Long" and "Exit Short" alarms added.
Use with "Once Per Bar Close".
*** I used the "VWAP with period" indicator code of @neolao. Special thanks to @neolao.
Indicator Link:

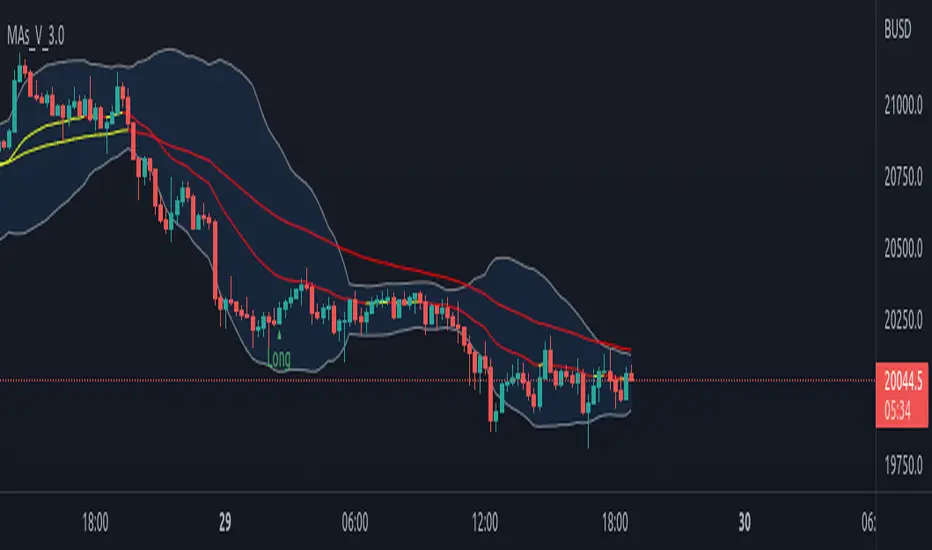
3-in-1 Custom Moving Average IndicatorIntroduction
This is a 3 in 1 indicator, if used wisely could yield some good profits based on the strategy that will be detailed later.
The three indicators so combined are:
a) Moving averages - 3 Moving averages that could be customised to display SMAs and EMAs on the chart
b) Bollinger Bands
c) RSI
By default indicator is set to shown 21,55 & 100 EMAs, where 100 EMA is toggled off and is used on need base. The length and type of the moving average used can be changed based on user preference. 1st and 2nd moving average is color coded for easy identification of trend. Similarly Bollinger Bands and RSI setting too could be adjusted with the exception of the RSI signal displayed.
Following condition was set to reduce noise of RSI:
Signal will only be displayed if there is a Bullish or Bearish Engulfing candle that coincide with the overbought or oversold levels.
How to use
This method follows the known conditions that;
a) the price will return back to the to the Moving average like a magnate after a sudden change/divergence away from the MA
b) the price will return back to the median after breaching the Bollinger bands
c) there will be a reversal if the script is overbought or oversold
Look at the chart displayed to observe condition "a & b" and you will notice that the price always returns back to the moving average. If you time your entry correctly using trend analysis and with the help of stochastic RSI, you could profit from the price reversal.
Condition "c" is a simple add-on that is put up, to help alert you to the entry opportunity being presented. Signal from condition "c" is not absolute, it is only indicative and needs refinement, hence entry is subjective to your attention and analysis of mentioned conditions "a &b"
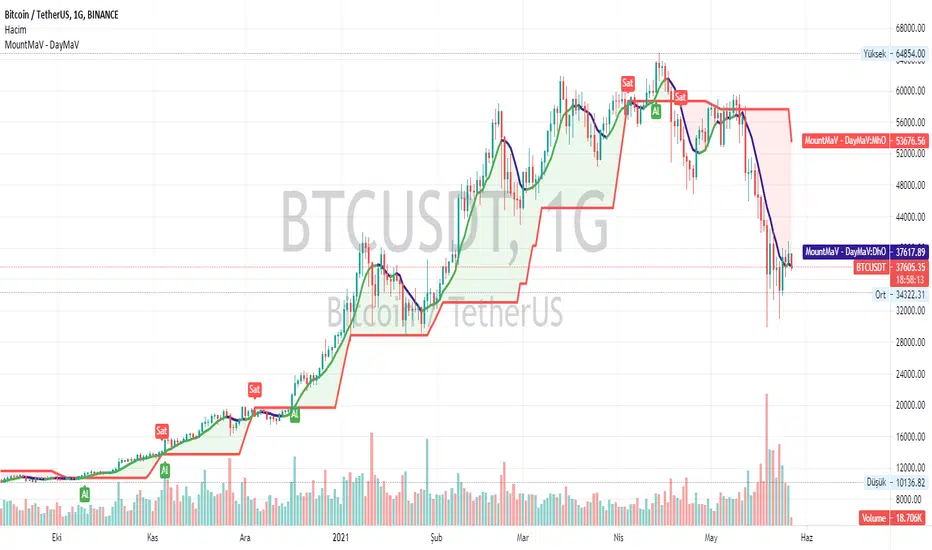
Yusram Mount MaV - Day MaVYüsram Mount HO - Day HO
This indicator shows the comparison between the 7-day fast simple average and the monthly slow average of 5 bars. The red line indicates the monthly green and blue lines the daily average. If the Green-Blue line crosses the red upwards, it is a buy signal and the opposite is a sell signal. As soon as it turns green blue without waiting for the sell signal, a sell signal is created. If you are trading fast, you can consider turning green to blue as an opportunity. In the long run, the red intersection can be interpreted as a Stop point.
I hope it will be useful to everyone.
You can also find the strategy indicator with the same name.
I got the name of this indicator from my daughter's name. The meaning of the name Yüsra means "convenience". I hope this indicator will help you.
Custom Multi-Timeframe Screener with AlertsThis is a multi-timeframe screener with alerts. Use this way you can create a screener on indicators using 2 or more timeframes.
In TradingView there is a limit of 40 security function calls. Every timeframe requires another security call so you can screen fewer symbols with any additional timeframe.
In this example, I use 2 timeframes, so the maximum amount of symbols you can scan is 40/2 = 20.
For 3 timeframes - 13, 4tfs - 10, 5tfs - 8 symbols and so on.
In this simplistic example, I require a cross of EMAs on the current timeframe and confirmation that one EMA above/below another from the second timeframe.
Of course, you can create much more complicated functions for this screener.
Params
- higher timeframe
- ema params
- 20 symbol inputs for instruments you want to use in this screener
Alerts
You can create an alert from it easily by selecting the screener name from the list and then selecting "Any alert() function call".
No additional configuration is required, message and alert on close is generated in the code.
You should better change the default name for your alert. Sometimes because of big amount of inputs you might receive an error.
Disclaimer
Please remember that past performance may not be indicative of future results.
Due to various factors, including changing market conditions, the strategy may no longer perform as good as in historical backtesting.
This post and the script don’t provide any financial advice.

Multiple Screeners with AlertsI already published few version of my custom screeners. Unfortunately, because of TradingView's security function call limit you can't use more than 40 stocks in 1 screener.
Fortunately, you can compute multiple values in your function and screen few indicators at once.
In this script I show how you can compute 5 indicators at the same time for 40 instruments. I display then in different labels.
Every label consist of list of instruments satisfying current indicator conditions and a value for it. It can be absolute value as for RSI or -1/1 representing Bullish/Bearish event.
Also you can create 1 alert with result of all screeners inside.
In this example I took 5 indicators with following conditions:
RSI - "RSI < 30" or "RSI > 70"
TSI - "TSI < -30" or "RSI >30"
ADX - "ADX > 40"
MACD - "MACD Bullish Cross" or "MACD Bearish Cross" (1 and -1 in screener)
AO - "AO Crosses 0 UP" or "AO Crosses 0 DOWN" (1 and -1 in screener)
Params
- bars_apart - this parameter define how may bars apart you labels are on your chart. If you see labels overlapping, increase this number.
- Parameters for all used indicators
- 40 symbol inputs for instruments you want to use in this screener
Alerts
You can create an alert from it easily by selecting screener name from the list and then selecting "Any alert() function call".
No additional configuration is required, message and alert on close is generated in the code.
You should better change default name for your alert. Sometimes because of big amount of inputs you might receive an error.
Disclaimer
Please remember that past performance may not be indicative of future results.
Due to various factors, including changing market conditions, the strategy may no longer perform as good as in historical backtesting.
This post and the script don’t provide any financial advice.
