thread_Spuda_18_stochasticstrategy thread spuda of the 18 stochastics. Description of the strategy for schoolprofit.ru
Wyszukaj w skryptach "the strat"

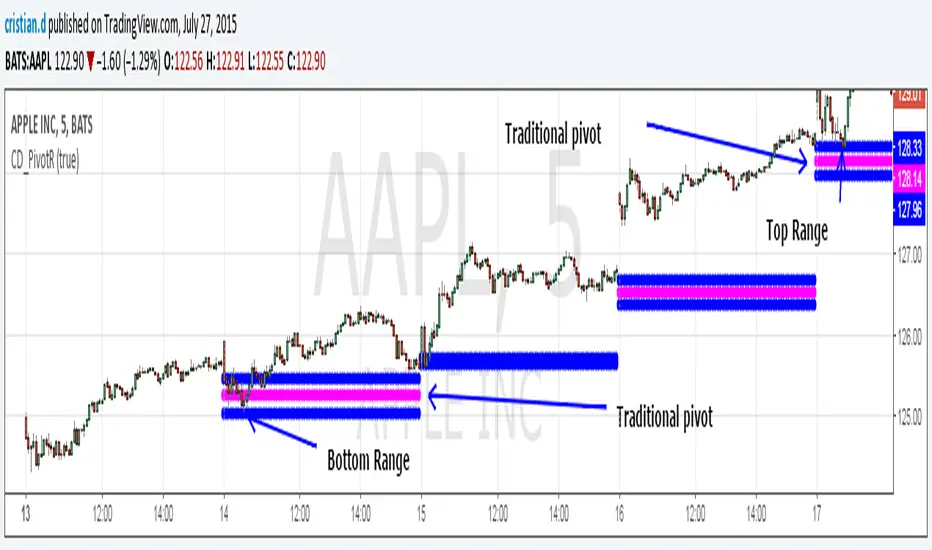
Pivot Range Pivot BossMy first attempt to code something. It's Mark Fischer concept of Pivot Range from his book Logical Trader.
The strategy for using it is actually from Frank Ochoa's book Secrets of a Pivot Boss. Pivot Range is the "meat of the matket" and "the heart beat of the market" according to him.
Besides using the actual pivots the strategy is based on the relationships between 2 day pivot ranges.
Higher Value - Bulish
Overlapping Higher - Moderate Bulish
Lower Value- Bearish
Overlapping Lower - Moderate Bearish
Unchanged - Sideways/Breakout
Outside - Sideways
Inside - Breakout
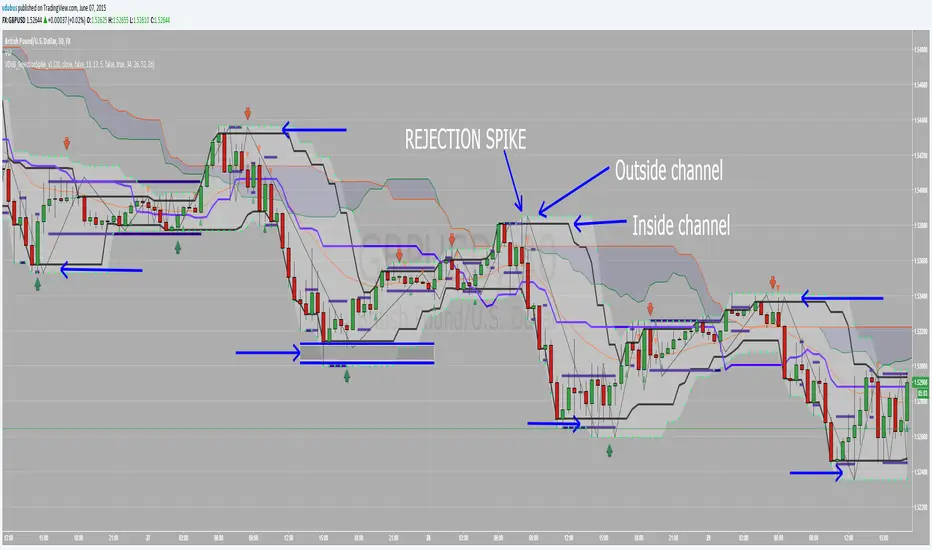
VDUB_RejectionSpike_v1 this indicator is for use with the Rejection Spike Strategy I recently publish
Have't had chance to test it yet so feel free to try.
Details of the strategy are listed in the link below
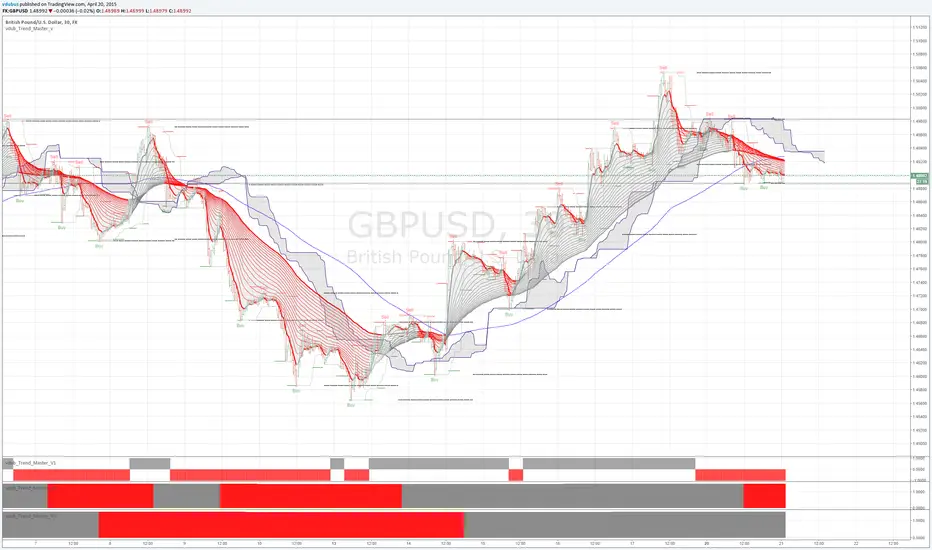
vdub_Trend_Master_v / v1 / v2 / v3NEW
*****Trend Master IV ***** UPDATE HERE
VDUB-TRENDMASTER-WALL UPDATE HERE
User configuration drive.google.com
****Original*****
Strategy / vdub_Trend_Master_v / v1 / v2 / v3.
Being foremost a Binary Options Trader, trying to make a move back into forex was/is challenging. I have no problem in finding entry points, but I lacked the ability to hold my positions for longer than the next retracement , as you can imagine this style of trading eats up trading accounts, so I've pulled together a collaboration of code from various indicators in an attempt to keep you (me) in the trend for longer.
the lower Trend power bars Ive designed for easy visual entry, also both short & long exits v1 being the fastest v2 then v3 the longest.. To be use in correlation with the Trend master v (upper) indicator. The strategy I think speaks for it's self, Buy Long & sell Short . :)
Original edited code from authors listed, with thanks
nb. these indicators are still in demo / testing mode & still needs a few tweaks To get all 4 indicators go to the share icon and select 'Make it mine'
test entry Long
Hold Trends for longer -Trend master v3 (Lower power bar ) / 6hr chart
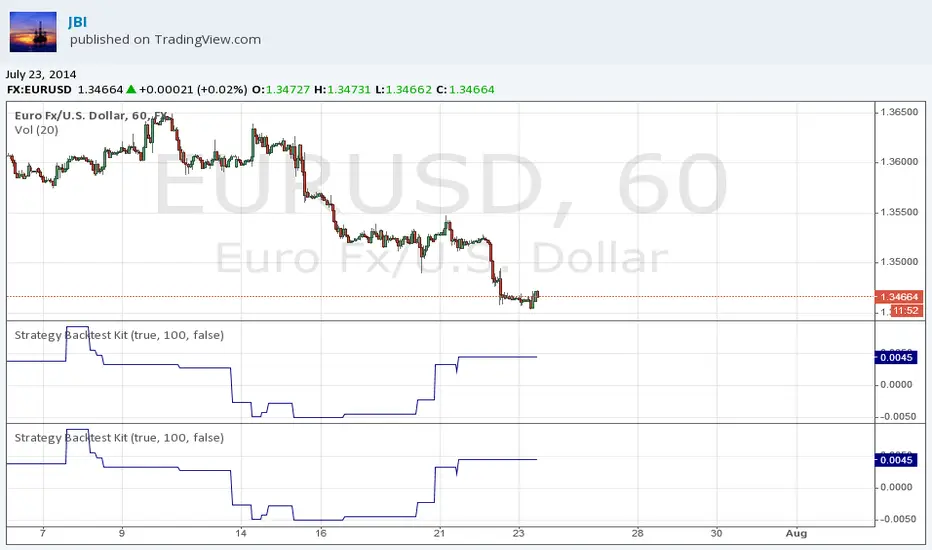
Strategy Backtest KitStrategy Backtest Kit. You have just to define your own entry / exit setups. The strategy I have coded into this is : BUY when MACD > 0 / SELL when MACD < 0. Always in position.
Follow JBI for his daily analyses!
Low Volume Pullback DetectorThis script incorporates the logic of Volume Price Analysis (VPA), identifying potential trend continuations by detecting pullbacks with decreasing volume.
###**Features:**1. **Trend Filtering:** Uses a 50-period EMA to ensure trades align with the dominant market direction.
2. **Structure Identification:** Detects recent highs and lows to confirm that price action is indeed a pullback within a trend.
3. **Volume Analysis:** Checks if the volume during the pullback is below the 20-period average, signaling a lack of conviction from counter-trend traders.
4. **Signal Generation:** Triggers a "Buy" or "Sell" signal when price breaks out of the pullback range, confirming momentum is returning in the direction of the trend.
5. **User Guide:** Detailed comments explaining the strategy, setup, trade execution, and best markets are included directly within the script for easy reference.
###**How to Use:*** **Setup:** Apply the script to a chart (works best on Stocks and Futures).
* **Identify Trend:** Ensure price is above (for Buy) or below (for Sell) the gray 50 EMA line.
* **Wait for Signal:** Look for the **"VOL DRY"** label. This appears when a low-volume pullback is followed by a breakout candle.
* **Execution:** Enter on the close of the signal candle. Set your Stop Loss below/above the pullback swing and target the previous structural high/low.

Apex Liquidity & Trend Architect [Smart]Trading charts often suffer from two problems: Noise (too many false signals in chopping markets) and Clutter (too many old lines and zones obscuring price).
ALTA solves both. It is a streamlined, institutional-grade trend system that uses ADX filtering to silence weak signals and Time-Decay logic to automatically clean up old liquidity zones. It respects your screen real estate, showing you only what matters, right now.
1. The "Smart" Engine
Unlike standard trend indicators that repaint or clutter the screen, ALTA introduces three key innovations:
A. Hull Moving Average (HMA) Baseline
We have upgraded the core engine to use the Hull Moving Average. HMA is significantly faster and smoother than standard EMAs or SMAs, reducing lag on entry signals.
Note: You can switch back to WMA or SMA in the settings if you prefer a slower pace.
B. ADX Momentum Filtering
Quality over Quantity: The script monitors the ADX (Average Directional Index). If the trend flips, but the ADX is below 20 (weak trend), the signal is blocked.
This prevents you from getting chopped out during sideways accumulation phases. You only get a "BUY" or "SELL" label when there is actual momentum behind the move.
C. Adaptive Gradient Coloring
The candles do not just turn Green or Red. They change intensity based on trend strength.
Bright/Vivid Candles: Strong Momentum (High ADX).
Dark/Dull Candles: Weak Momentum (Low ADX).
Visual Cue: If the candles are fading into the background, stay out of the market.
2. Self-Cleaning Liquidity Zones
Most support/resistance indicators leave old boxes on the chart forever. ALTA uses a Decay Protocol.
Volume Validation: Supply/Demand zones are only drawn if the pivot point had volume significantly higher than average (configurable).
Mitigation: If price wicks through a zone, it is deleted instantly.
Time Decay (New): If a zone is not hit within a set number of bars (Default: 100), it automatically deletes itself. This keeps your chart focused on fresh levels only.
3. The Minimalist HUD
A simplified dashboard in the corner of your screen provides an instant health check of the market:
ALTA Label: System Status.
Trend: BULL / BEAR / WAIT (Squeeze).
Power: WEAK / SOLID / STRONG (Based on ADX).
4. How to Trade (The Strategy)
The High-Probability Buy
Trend: Ribbon is Green.
Candles: Candles are Bright Green (indicating High ADX Strength).
Signal: A "BUY" label appears (confirmed by ADX filter).
Liquidity: Price is bouncing off a valid Demand Zone.
The High-Probability Sell
Trend: Ribbon is Red.
Candles: Candles are Bright Red (indicating High ADX Strength).
Signal: A "SELL" label appears.
Liquidity: Price is rejecting off a valid Supply Zone.
When to STAY OUT
The Squeeze: If the ribbon turns Grey/White, volatility is compressing. Wait for the breakout.
The Fade: If the candles are dark/translucent, momentum is dying. Take profits or wait for a fresh impulse.
5. Settings & Customization
Basis Type: Switch between HMA (Fast), WMA (Standard), or SMA (Slow).
Signal Quality Filter: Toggle the ADX filter on/off.
Zone Life: How many bars should a Supply/Demand zone survive before decaying?
Tooltips: Every single setting in this script includes a descriptive tooltip. Hover over the "i" icon in the settings menu for detailed explanations of every feature.
Disclaimer
This indicator is for educational purposes only. Past performance (even with smart filtering) does not guarantee future results. Always manage your risk.

Universal Scalper Indicator [Crypto/Forex/Gold]Universal Scalper Pro is an all-in-one scalping system designed for the 15-Minute Timeframe. It automates the analysis of trend, volatility, and risk management into a single, high-contrast dashboard.
Unlike standard crossover indicators, this system filters out low-volatility "noise" using a built-in ADX engine and automatically calculates dynamic Stop Loss and Take Profit levels based on market volatility (ATR).
It is engineered to work universally on:
Crypto (BTC, ETH, SOL, Altcoins)
Commodities (Gold, Silver, Oil)
Forex (Major & Minor Pairs)
Stocks (High volume tech stocks like NVDA, TSLA)
📈 How It Works (The Strategy)
1. The Trend Engine (9/21 EMA) The core logic utilizes a Fast (9) and Slow (21) Exponential Moving Average crossover.
Bullish Signal: The 9 EMA crosses above the 21 EMA.
Bearish Signal: The 9 EMA crosses below the 21 EMA. This specific combination is chosen for its responsiveness to 15-minute intraday trends.
2. The Noise Filter (ADX > 15) To prevent "whipsaws" (fake signals during sideways markets), the script includes a Volatility Filter based on the Average Directional Index (ADX).
Signals are rejected if the ADX is below 15.
This ensures you only receive alerts when there is sufficient momentum to sustain a move.
3. Dynamic Risk Management (ATR) The script uses the Average True Range (ATR) to calculate Stop Loss and Take Profit levels that adapt to the specific asset's volatility.
Stop Loss: Placed at 1.5x ATR from the entry. (Tight enough to preserve capital, wide enough to survive standard market noise).
Take Profit: Placed at 2.0x ATR from the entry. (Provides a healthy 1:1.3 Risk/Reward ratio).
🚀 Key Features
Universal Dashboard: A bottom-right panel displays the live Trend Status, Entry Price, Stop Loss, and Take Profit. It automatically formats decimals for any asset (e.g., 2 decimals for Gold, 5 for Forex, 8 for Crypto).
"Sticky" Memory: The dashboard retains the prices of the last valid signal, allowing you to manage your trade even after the signal candle closes.
Trend Cloud: A visual Green/Red zone between the EMAs helps you instantly identify the market bias.
Unified Alerts: A single alert setup ("Any alert() function call") sends the Asset Name, Entry, SL, and TP directly to your phone.
🛠️ How to Use
Timeframe: Set your chart to 15 Minutes (15m).
Wait for the Signal: Look for the "BUY" (Green) or "SELL" (Red) label on the chart.
Check the Dashboard: Ensure the "STATUS" is BULLISH (for buys) or BEARISH (for sells). If the status says "WAIT", do not trade.
Execute: Enter the trade using the exact Stop Loss and Take Profit levels shown on the dashboard.
⚠️ Risk Disclaimer
Trading financial markets involves high risk and may not be suitable for all investors. This indicator is a technical analysis tool and does not constitute financial advice. Past performance is not indicative of future results. Always practice with a demo account before trading real capital.

ALISH WEEK LABELS THE ALISH WEEK LABELS
Overview
This indicator programmatically delineates each trading week and encapsulates its realized price range in a live-updating, filled rectangle. A week is defined in America/Toronto time from Monday 00:00 to Friday 16:00. Weekly market open to market close, For every week, the script draws:
a vertical start line at the first bar of Monday 00:00,
a vertical end line at the first bar at/after Friday 16:00, and
a white, semi-transparent box whose top tracks the highest price and whose bottom tracks the lowest price observed between those two temporal boundaries.
The drawing is timeframe-agnostic (M1 → 1D): the box expands in real time while the week is open and freezes at the close boundary.
Time Reference and Session Boundaries
All scheduling decisions are computed with time functions called using the fixed timezone string "America/Toronto", ensuring correct behavior across DST transitions without relying on chart timezone. The start condition is met at the first bar where (dayofweek == Monday && hour == 0 && minute == 0); on higher timeframes where an exact 00:00 bar may not exist, a fallback checks for the first Monday bar using ta.change(dayofweek). The close condition is met on the first bar at or after Friday 16:00 (Toronto), which guarantees deterministic closure on intraday and higher timeframes.
State Model
The indicator maintains minimal persistent state using var globals:
week_open (bool): whether the current weekly session is active.
wk_hi / wk_lo (float): rolling extrema for the active week.
wk_box (box): the graphical rectangle spanning × .
wk_start_line and a transient wk_end_line (line): vertical delimiters at the week’s start and end.
Two dynamic arrays (boxes, vlines) store object handles to support bounded history and deterministic garbage collection.
Update Cycle (Per Bar)
On each bar the script executes the following pipeline:
Start Check: If no week is open and the start condition is satisfied, instantiate wk_box anchored at the current bar_index, prime wk_hi/wk_lo with the bar’s high/low, create the start line, and push both handles to their arrays.
Accrual (while week_open): Update wk_hi/wk_lo using math.max/min with current bar extremes. Propagate those values to the active wk_box via box.set_top/bottom and slide box.set_right to the current bar_index to keep the box flush with live price.
Close Check: If at/after Friday 16:00, finalize the week by freezing the right edge (box.set_right), drawing the end line, pushing its handle, and flipping week_open false.
Retention Pruning: Enforce a hard cap on historical elements by deleting the oldest objects when counts exceed configured limits.
Drawing Semantics
The range container is a filled white rectangle (bgcolor = color.new(color.white, 100 − opacity)), with a solid white border for clear contrast on dark or light themes. Start/end boundaries are full-height vertical white lines (y1=+1e10, y2=−1e10) to guarantee visibility across auto-scaled y-axes. This approach avoids reliance on price-dependent anchors for the lines and is robust to large volatility spikes.
Multi-Timeframe Behavior
Because session logic is driven by wall-clock time in the Toronto zone, the indicator remains consistent across chart resolutions. On coarse timeframes where an exact boundary bar might not exist, the script legally approximates by triggering on the first available bar within or immediately after the boundary (e.g., Friday 16:00 occurs between two 4-hour bars). The box therefore represents the true realized high/low of the bars present in that timeframe, which is the correct visual for that resolution.
Inputs and Defaults
Weeks to keep (show_weeks_back): integer, default 40. Controls retention of historical boxes/lines to avoid UI clutter and resource overhead.
Fill opacity (fill_opacity): integer 0–100, default 88. Controls how solid the white fill appears; border color is fixed pure white for crisp edges.
Time zone is intentionally fixed to "America/Toronto" to match the strategy definition and maintain consistent historical backtesting.
Performance and Limits
Objects are reused only within a week; upon closure, handles are stored and later purged when history limits are exceeded. The script sets generous but safe caps (max_boxes_count/max_lines_count) to accommodate 40 weeks while preserving Editor constraints. Per-bar work is O(1), and pruning loops are bounded by the configured history length, keeping runtime predictable on long histories.
Edge Cases and Guarantees
DST Transitions: Using a fixed IANA time zone ensures Friday 16:00 and Monday 00:00 boundaries shift correctly when DST changes in Toronto.
Weekend Gaps/Holidays: If the market lacks bars exactly at boundaries, the nearest subsequent bar triggers the start/close logic; range statistics still reflect observed prices.
Live vs Historical: During live sessions the box edge advances every bar; when replaying history or backtesting, the same rules apply deterministically.
Scope (Intentional Simplicity)
This tool is strictly a visual framing indicator. It does not compute labels, statistics, alerts, or extended S/R projections. Its single responsibility is to clearly present the week’s realized range in the Toronto session window so you can layer your own execution or analytics on top.

HFT Jude FootprintThis script is designed to detect potential High-Frequency Trader (HFT) activity based on unusual volume spikes and candle behavior, in order to identify potential intraday breakout opportunities. It is best suited for 3-minute and 5-minute charts across NSE-listed stocks.
How It Works
The strategy combines three core conditions:
Volume Spike Multiplier: Detects when current volume is > X times the rolling average (e.g., 5× 20-bar average volume).
Breakout Confirmation: Entry is considered only if the close is:
Near the high (for longs) or low (for shorts) of the candle.
Higher than the previous high (for longs), or lower than previous low (for shorts).
Visual Signal: When all conditions align, a Buy or Sell label is plotted on the chart, right at the candle where the footprint is detected.
This script is tailored for scalpers, intraday traders, and HFT watchers. It is not a mash-up of generic indicators and based on my backtesting and observation of large HFT firms that operate in the indian equities market,

BB Crosses Optimized - [JTCAPITAL]BB Crosses Optimized - is a modified way to use Bollinger Bands combined with volatility filtering (ATR) and flexible smoothing methods for Trend-Following.
The indicator works by calculating in the following steps:
Source Selection & Smoothing
The script begins by letting the user select a preferred price source (default is Close, but options include Open, High, Low, HL2, etc.). This raw input is then passed through a smoothing process.
Multiple smoothing techniques can be chosen: SMA, EMA, HMA, DEMA, TEMA, RMA, and FRAMA. Each method reduces short-term noise differently, ensuring flexibility for traders who prefer faster or slower reaction speeds in trend detection.
Bollinger Band Construction
Once the smoothed source is prepared, Bollinger Bands are calculated. The middle band is a moving average of the smoothed data over the defined BB Period . The upper and lower bands are then generated by adding and subtracting the Standard Deviation × Deviation multiplier . These dynamic bands capture volatility and help define breakout zones.
ATR Volatility Measurement
Parallel to the band calculation, the Average True Range (ATR) is computed over the chosen ATR Period . This measures market volatility. The ATR can optionally act as a filter, refining buy and sell levels so signals adapt to current market conditions rather than being fixed to price alone.
Bollinger Band Signals
-If the smoothed price closes above the upper band, a potential bullish event is marked.
-If the smoothed price closes below the lower band, a potential bearish event is marked.
Trend Line Construction
When a bullish event occurs, the script anchors a trend-following line beneath price. If ATR filtering is enabled, the line is set at Low – ATR , otherwise at the simple Low. Conversely, when a bearish event occurs, the line is anchored above price at High + ATR (or just High without the filter). The line is designed to only move in the direction of the trend—if price action does not exceed the prior value, the previous level is held. This prevents unnecessary whipsaws and keeps the indicator aligned with dominant momentum.
Final Trend Detection
The slope of the trend line defines the trend itself:
-Rising line → bullish trend.
-Falling line → bearish trend.
Visual Output
The indicator plots the trend line with dynamic coloring: Blue for bullish phases, Purple for bearish phases. A subtle filled background area emphasizes the active trend zone for clearer chart interpretation.
Buy and Sell Conditions:
- Buy Signal : Triggered when smoothed price closes above the upper Bollinger Band. Trend line then anchors below price (with or without ATR offset depending on settings).
- Sell Signal : Triggered when smoothed price closes below the lower Bollinger Band. Trend line then anchors above price (with or without ATR offset).
Additional filtering is possible via:
- ATR Toggle : Switch ATR on or off to adapt the strategy to either volatile or steady markets.
- Smoothing Method : Adjust smoothing to speed up or slow down responsiveness.
- Deviation Multiplier : Tight or wide bands adjust the sensitivity of signals.
Features and Parameters:
- Source : Choose between Close, Open, High, Low, HL2, etc.
- Average Type : Options include SMA, EMA, HMA, DEMA, TEMA, RMA, FRAMA.
- ATR Period : Defines how ATR volatility is measured.
- BB Period : Lookback length for Bollinger Band construction.
- Deviation : Multiplier for the standard deviation in Bollinger Bands.
- Smoothing Period : Controls how much the source data is smoothed.
- ATR Filter On/Off : Enables or disables ATR integration in signal calculation.
Specifications:
Smoothing (MA Types)
Smoothing is essential to reduce chart noise. By offering multiple MA choices, traders can balance between lag (SMA, RMA) and responsiveness (EMA, HMA, FRAMA). This flexibility allows the indicator to adapt across asset classes and trading styles.
Bollinger Bands
Bollinger Bands measure price deviation around a moving average. They help identify volatility expansion and contraction. In this script, the bands serve as breakout triggers—price crossing outside suggests momentum strong enough to sustain a trend.
Standard Deviation
Standard Deviation is a statistical measure that quantifies the dispersion of price data around the mean. With a multiplier applied, it creates bands that contain a probabilistic portion of price action. Crossing beyond these suggests a higher likelihood of trend continuation.
ATR (Average True Range)
ATR measures the degree of volatility. Instead of simply reacting to price crossing the bands, ATR ensures the trend line placement adapts to current conditions. In volatile markets, wider buffers prevent premature signals; in calmer markets, tighter placement keeps signals responsive.
Trend Line Logic
The trend line only adjusts in the direction of the trend. If new values do not exceed the prior, the line remains unchanged. This prevents false reversals and makes the line a reliable visual confirmation of trend direction.
Signal Detection
The indicator does not repaint: signals are based on confirmed closes relative to the Bollinger Bands. This makes it more reliable for both live trading and backtesting scenarios.
Visual Enhancements
The use of dual plots and fill shading creates a clearer separation of bullish vs. bearish phases. This helps traders visually align entries and exits without second-guessing.
Enjoy!

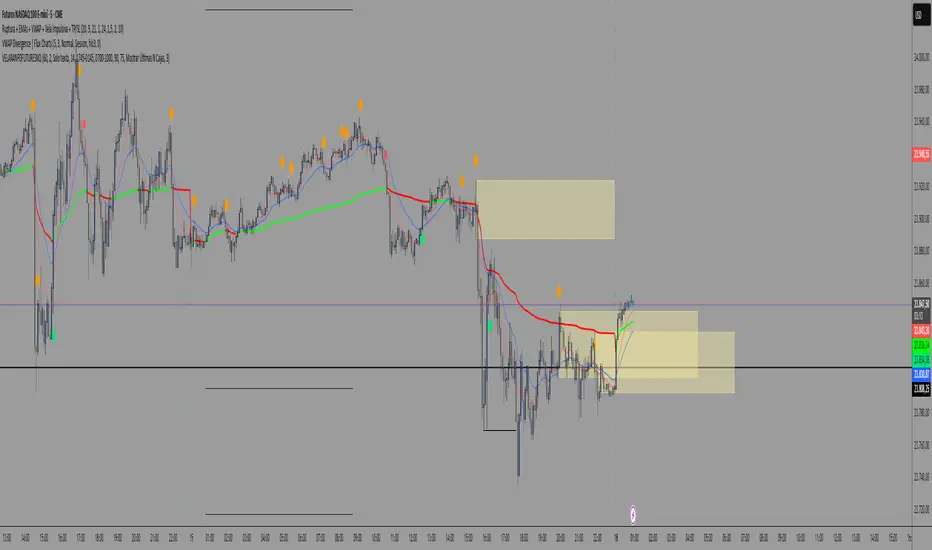
VELA RANGO FUTURESNQ-@MRXAUFXRange candle plus Asian session, add EMAs 9 and 21 and VWAP for the strategy to work
Bullish Bearish Signal with EMA Color + LabelsThis script generates clear BUY and SELL signals based on a combination of trend direction, momentum, and confirmation from multiple indicators. It is intended to help traders identify strong bullish or bearish conditions using commonly trusted tools: EMA 200, MACD, and RSI.
🔍 How it works:
The strategy combines three key elements:
EMA 200 Trend Filter
Identifies the long-term trend:
Price above EMA200 → Bullish trend bias
Price below EMA200 → Bearish trend bias
The EMA line is color-coded:
🔵 Blue for bullish
🔴 Red for bearish
⚪ Gray for neutral/unclear
MACD Crossover
Detects shifts in market momentum:
Bullish: MACD line crosses above signal line
Bearish: MACD line crosses below signal line
RSI Confirmation
Adds an extra layer of confirmation:
Bullish: RSI is above its signal line
Bearish: RSI is below its signal line
✅ Signal Logic:
BUY Signal appears when:
Price > EMA200
MACD crosses up
RSI > its signal line
SELL Signal appears when:
Price < EMA200
MACD crosses down
RSI < its signal line
Labels will appear on the chart to highlight these events.
🔔 Alerts:
The script includes alerts for both Buy and Sell conditions, so you can be notified in real-time when they occur.
📈 How to Use:
Best used in trending markets.
Recommended for higher timeframes (1H and above).
May be combined with other tools such as support/resistance or candlestick analysis.
⚠️ Disclaimer: This script is intended for educational purposes only and does not constitute financial advice or a trading recommendation.

Jesus Vix Spike ComboThis script will:
Show you vix spikes with your 4 different settings.
Draw a white line at the start of each vix.
Draw a dotted green line for 3 spikes in 6 minutes.
Draw a dotted pink line for 3 spikes in 16 minutes.
Draw a green line extending right if it takes out a past low in the last 200 bars plus a spike.
It will also:
Place a white dot on the 5th candle if the price rises past the vix starting point,
a white omega sign on the 6th candle if price rises past the vix starting point,
and a large white dot on the 7th candle past the vix starting point if the price is higher.
It will also:
Show higher time frame EMAs and other emas.
Has some alerts added also.
I have only been using this on the 1 minute chart with $OANDA:SPX500USD.
Ill write about the strategy I use for this soon. But basically you wait for a drop and for some prominent lows to be taken out, then a vix, then your white dot, omega then the large white dot to enter, expect a 100% expansion from the vix low. More aggressive entry's would be the first white dot or 3 green candles in a row. Backtest to see.
Thanks for checking it out. Let me know if it can be better.
The original script is from Xxattaxx and Christ Moody I believe, thank you for sharing all your hard work.

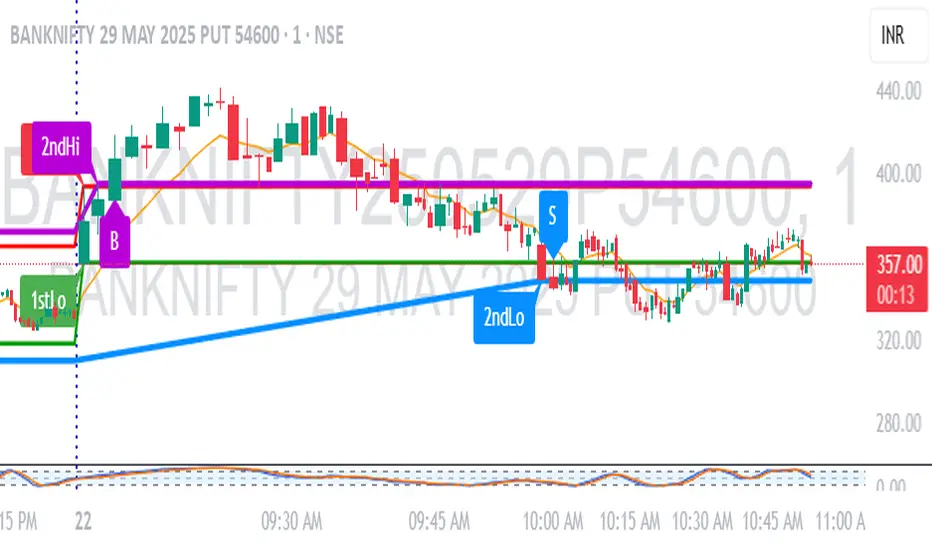
1M Scalp Setup – 2ndHi/2ndLo Breakout1M Scalp Setup – 2ndHi/2ndLo Breakout
This script is designed for 1-minute chart scalpers seeking high-probability intraday breakout setups based on early session price action. The strategy revolves around identifying the first high and low of the day, and then detecting the second breach (2nd high or 2nd low) to anticipate breakout entries.
🔍 Core Logic:
EMA Filter : A configurable EMA (default 8-period) is plotted for trend context.
1st High/Low Detection : Captures the very first high and low of each trading day.
2nd High/Low Markers : Identifies the second time price breaks the initial high or low, acting as a potential signal zone.
Breakout Signals :
A Buy Signal is triggered when price closes above the 2nd high.
A Sell Signal is triggered when price closes below the 2nd low.
Each signal is only triggered once per day to reduce noise and avoid overtrading.
🖌️ Visual Markers:
1stHi and 1stLo : Early session levels (red and green).
2ndHi and 2ndLo : Key breakout reference points (purple and blue).
B and S Labels : Buy and Sell triggers marked in real-time once breakouts occur.
⚙️ Inputs:
EMA Length (default: 8)
Customizable Colors for Buy/Sell signals and key markers
This tool is best used in fast-moving markets or during high-volume sessions. Combine with volume or higher-timeframe confirmation for improved accuracy.
VWAP + Candle-Rating SELL (close, robust)This multi‐timeframe setup first scans the 15-minute chart for strong bearish candles (body position in the bottom 40% of their range, i.e. rating 4 or 5) that close below the session VWAP. When it finds the first such “setup” of a trading period, it pins the low of that 15-minute candle as a trigger level and draws a persistent red line there. On the 5-minute chart, the strategy then waits for a similarly strong bearish candle (rating 4 or 5) to close below that marked low—at which point it emits a one‐time SELL signal. The trigger level remains in place (and additional sell signals are locked out) until the market “rescues” the price: a 15-minute bullish candle (rating 1 or 2) closing back above VWAP clears the old setup and allows the next valid bearish 15-minute candle to form a new trigger. This design ensures you only trade the most significant breakdowns after a clear bearish bias and avoids repeated signals until a genuine bullish reversal resets the system.

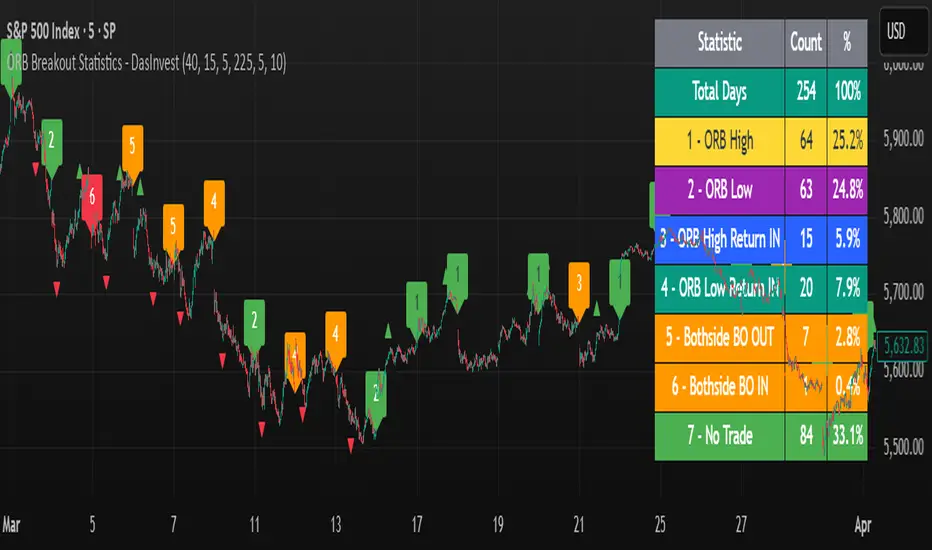
ORB Breakout Statistics with Labels and ProfitOpening Range Breakout Statistics – This indicator identifies the opening range based on user-defined inputs and detects breakouts above the high or below the low. At the end of each trading day, it classifies the session into a specific category based on price action. Additionally, it tracks profit and loss for each classification, allowing you to backtest the strategy using log files.
Nasan Risk Score & Postion Size Estimator** THE RISK SCORE AND POSITION SIZE WILL ONLY BE CALCUTAED ON DIALY TIMEFRAME NOT IN OTHER TIMEFRAMES.
The typically accepted generic rule for risk management is not to risk more than 1% - 2 % of the capital in any given trade. It has its own basis however it does not take into account the stocks historic & current performance and does not consider the traders performance metrics (like win rate, profit ratio).
The Nasan Risk Score & Position size calculator takes into account all the listed parameters into account and estimates a Risk %. The position size is calculated using the estimated risk % , current ATR and a dynamically adjusted ATR multiple (ATR multiple is adjusted based on true range's volatility and stocks relative performance).
It follows a series of calculations:
Unadjusted Nasan Risk Score = (Min Risk)^a + b*
Min Risk = ( 5 year weighted avg Annual Stock Return - 5 year weighted avg Annual Bench Return) / 5 year weighted avg Annual Max ATR%
Max Risk = ( 5 year weighted avg Annual Stock Return - 5 year weighted avg Annual Bench Return) / 5 year weighted avg Annual Min ATR%
The min and max return is calculated based on stocks excess return in comparison to the Benchmark return and adjusted for volatility of the stock.
When a stock underperforms the benchmark, the default is, it does not calculate a position size , however if we opt it to calculate it will use 1% for Min Risk% and 2% for Max Risk% but all the other calculations and scaling remain the same.
Rationale:
Stocks outperforming their benchmark with lower volatility (ATR%) score higher.
A stock with high returns but excessive volatility gets penalized.
This ensures volatility-adjusted performance is emphasized rather than absolute returns.
Depending on the risk preference aggressive or conservative
Aggressive Risk Scaling: a = max (m, n) and b = min (m, n)
Conservative Scaling: a = min (m, n) and b = max (m, n)
where n = traders win % /100 and m = 1 - (1/ (1+ profit ratio))
A default of 50% is used for win factor and 1.5 for profit ratio.
Aggressive risk scaling increases exposure when the strategy's strongest factor is favorable.
Conservative risk scaling ensures more stable risk levels by focusing on the weaker factor.
The Unadjusted Nasan risk is score is further refined based on a tolerance factor which is based on the stocks maximum annual drawdown and the trader's maximum draw down tolerance.
Tolerance = /100
The correction factor (Tolerance) adjusts the risk score based on downside risk. Here's how it works conceptually:
The formula calculates how much the stock's actual drawdown exceeds your acceptable limit.
If stocks maximum Annual drawdown is smaller than Trader's maximum acceptable drawdown % , this results in a positive correction factor (indicating the drawdown is within your acceptable range and increases the unadjusted score.
If stocks maximum Annual drawdown exceeds Trader's maximum acceptable drawdown %, the correction factor will decrease (indicating that the downside risk is greater than what you are comfortable with, so it will adjust the risk exposure).
Once the Risk Score (numerically equal to Risk %) The position size is calculated based on the current market conditions.
Nasan Risk Score (Risk%) = Unadjusted Nasan Risk Score * Tolerance.
Position Size = (Capital * Risk% )/ ATR-Multiplier * ATR
The ATR Multiplier is dynamically adjusted based on the stocks recent relative performance and the variability of the true range itself. It would range between 1 - 3.5.
The multiplier widens when conditions are not favorable decreasing the position size and increases position size when conditions are favorable.
This Calculation /Estimate Does not give you a very different result than the arbitrary 1% - 2%. However it does fine tune the % based on sock performance, traders performance and tolerance level.

Forward Curve Visualization ToolProvide the spot symbol and the futures product root, and the script automatically scans all relevant contracts for you—no more tedious manual searches. The result is a clean, intuitive chart showing the live forward curve in real time.
It also detects contango or backwardation conditions (based on spot < F1 < F2 < F3).
Future Features:
Plot historical snapshots of the curve (1 day, 1 week, or 1 month ago) to understand market trends over time.
Display additional metrics such as annualized basis, cost of carry (CoC), and even volume or open interest for deeper insights.
If you trade futures and watch the forward curve, this script will give you the actionable data you need and get more ideas or features you’d like to see. Let’s build them together!
Disclaimer
Please remember that past performance may not be indicative of future results.
Due to various factors, including changing market conditions, the strategy may no longer perform as well as in historical backtesting.
This post and the script don’t provide any financial advice.

Multi-Moving Average Buy/Sell IndicatorThis Multi-Moving Average Buy/Sell Indicator is a powerful and customizable tool designed to help traders identify potential buy and sell signals based on the interaction between price and multiple moving averages. Whether you're a day trader, swing trader, or long-term investor, this indicator provides clear visual cues and alerts to help you make informed trading decisions.
Key Features
1. Multiple Moving Averages
The indicator calculates four key moving averages:
9-period MA
20-period MA
50-period MA
180-period MA
You can choose the type of moving average:
SMA (Simple Moving Average)
EMA (Exponential Moving Average)
WMA (Weighted Moving Average)
2. Custom Timeframe
Select a custom timeframe from a user-friendly dropdown menu:
1 Minute
5 Minutes
15 Minutes
30 Minutes
1 Hour
4 Hours
Daily
Weekly
The indicator dynamically adjusts to the selected timeframe, making it suitable for all trading styles.
3. Buy/Sell Signals
Buy Signal: Triggered when the price crosses above any of the moving averages.
Sell Signal: Triggered when the price crosses below any of the moving averages.
Signals are displayed as labels on the chart:
Green "BUY" Label: Below the bar when a buy signal is triggered.
Red "SELL" Label: Above the bar when a sell signal is triggered.
4. Visualization
Toggle the visibility of all moving averages using the showAllMAs input.
Moving averages are plotted with distinct colors for easy identification:
9 MA: Blue
20 MA: Orange
50 MA: Purple
180 MA: Teal
5. Alerts
The indicator generates alerts for buy and sell signals, which can be used for notifications or automated trading.
How to Use
Add the Indicator:
Open TradingView and go to the Pine Script Editor.
Copy and paste the script into the editor.
Click Add to Chart.
Configure Inputs:
maType: Choose the type of moving average (SMA, EMA, WMA).
timeframe: Select a custom timeframe (e.g., "1 Minute", "Daily").
showSignals: Toggle to show or hide buy/sell signals.
showAllMAs: Toggle to show or hide all moving averages.
Interpret the Signals:
Look for green "BUY" labels below the bars for potential buy opportunities.
Look for red "SELL" labels above the bars for potential sell opportunities.
Set Alerts:
Use the built-in alert system to get notified when buy or sell signals are triggered.
Example Use Cases
Day Trading
Use a 1-minute or 5-minute timeframe with an EMA for quick signals.
Example Inputs:
maType = "EMA"
timeframe = "5 Minutes"
showAllMAs = true
Swing Trading
Use a daily timeframe with an SMA for longer-term signals.
Example Inputs:
maType = "SMA"
timeframe = "Daily"
showAllMAs = false
Why Use This Indicator?
Versatility: Suitable for all trading styles and timeframes.
Customization: Choose your preferred moving average type and timeframe.
Clear Signals: Easy-to-read buy/sell labels and moving averages.
Alerts: Never miss a trading opportunity with built-in alerts.
Limitations
False Signals:
The indicator may generate false signals in choppy or sideways markets. Always combine it with other tools (e.g., RSI, volume analysis) for better accuracy.
Timeframe Dependency:
The effectiveness of the signals depends on the selected timeframe. Shorter timeframes may produce more signals but with higher noise.
No Backtesting:
The script does not include backtesting functionality. Test the strategy manually on historical data.
Customization Options
Add More Moving Averages: Modify the script to include additional moving averages (e.g., 200 MA).
Change Signal Logic: Adjust the conditions for buy/sell signals (e.g., require confirmation from multiple moving averages).
Add Alerts for Specific MAs: Create separate alerts for signals based on specific moving averages (e.g., only 9 MA or 50 MA).

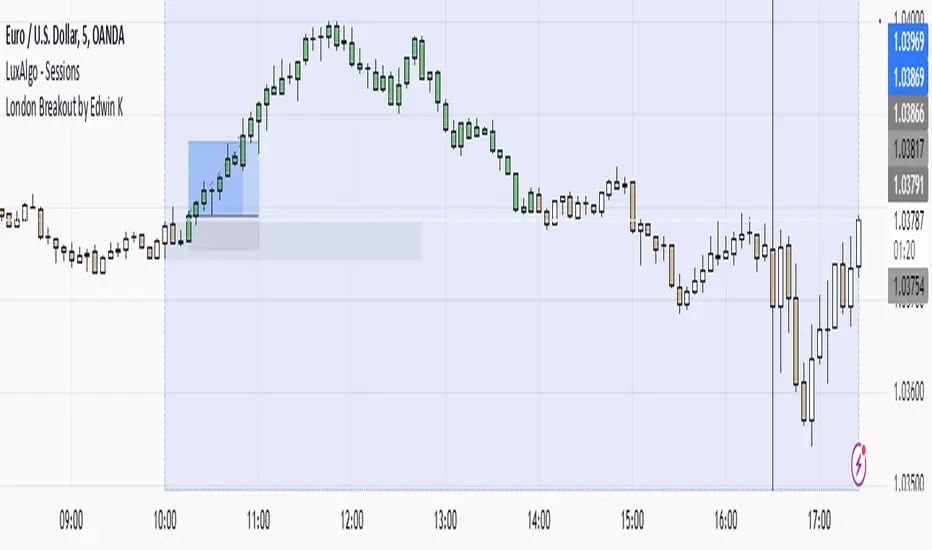
London Breakout by Edwin KPurpose:
The strategy visualizes breakouts based on price action during the London session. It highlights the candles from 09:59 AM to 01:59 PM UTC+3 with different colors depending on whether the price is above or below the high/low from the 10 AM candle.
Key Parts:
Timestamps:
The code defines specific times for the 09:59 AM candle, 10:00 AM candle, and 01:59 PM UTC+3 times.
The timestamp('UTC+3', ...) function creates the timestamps for those moments.
High and Low of the 10 AM Candle:
The high and low of the 10 AM candle are captured and stored in the ten_am_high and ten_am_low variables.
Bullish and Bearish Conditions:
If the price breaks above (bullish_break) or below (bearish_break) the high or low of the 10 AM candle, respectively.
Bar Coloring:
If the conditions are met (price breaking above or below the 10 AM levels), the script colors the candles during the time frame (09:59 AM to 01:59 PM).
Green color is applied for bullish breakouts.
Red color is applied for bearish breakouts.
Price Action + Support/Resistance with LabelsEntry Conditions:
Long Entry (BUY): Based on the bullish engulfing pattern and price being above the resistance level.
Short Entry (SELL): For demonstration, the short entry condition is set as price being below the support level and a bullish candle in the previous bar. You can modify this logic for your own use case.
Stop Loss and Take Profit:
Stoploss is plotted at the calculated stop loss level.
Target is plotted at the calculated take profit level.
Labels:
For long trades, labels are added with "BUY", "STOPLOSS", and "TARGET".
For short trades (if enabled), labels are added with "SELL", "STOPLOSS", and "TARGET".
Labels are placed using label.new at specific locations on the chart (above or below bars).
Alert Conditions:
Alerts are created for both long and short entry signals so you can get notified when the entry conditions are met.
How it works:
BUY label will appear below the bar when a long entry condition is met.
SELL label will appear above the bar when a short entry condition is met.
STOPLOSS and TARGET labels will appear at their respective levels when an entry signal is triggered.
The labels will appear on the chart to give you a clear visual cue of the entry, stop loss, and take profit levels.
How to Use:
Copy the script into your Pine Editor on TradingView and apply it to your chart.
Observe the labels that show up on the chart:
"BUY" will appear below the bar when long conditions are met.
"SELL" will appear above the bar when short conditions are met (if using short logic).
"STOPLOSS" will be plotted at the stop loss level.
"TARGET" will be plotted at the take profit level.
Optional Customization:
You can modify the short entry condition based on your preferred method.
You can adjust the length for the support/resistance calculation, the stopLossRR, and other parameters to fine-tune the strategy for Nifty 50 or any other asset.
Let me know if you have any further questions or need additional modifications!

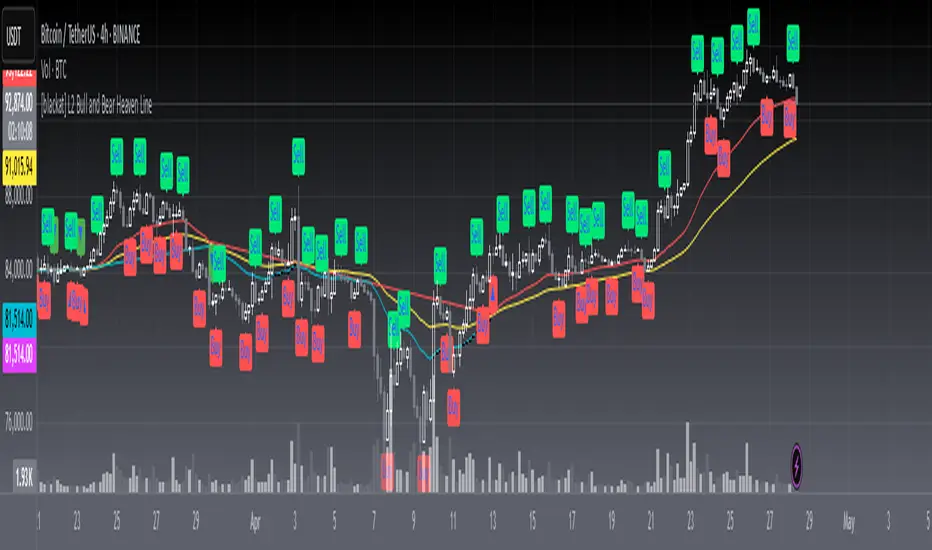
[blackat] L2 Bull and Bear Heaven LineOVERVIEW
The L2 Bull and Bear Heaven Line script is a custom indicator designed to visualize trend directions using Exponential Moving Average (EMA)-based lines and generate trade signals based on crossovers between those lines. It also incorporates an RSI-like feature to provide additional insight into overbought and oversold conditions.
FEATURES
Utilizes two EMAs: a longer-term "Heaven Line" (default 60 bars) and a shorter-term "Trading Line" (default 30 bars).
Generates buy/sell signals based on crossovers between the "Trading Line" and "Heaven Line".
Identifies potential turning points in the market, indicating shifts from bullish to bearish or vice versa.
Includes an "Operation Line" similar to RSI, aiding in detecting overbought/oversold levels.
HOW TO USE
Add the script to your TradingView chart.
Observe the crossovers between the "Trading Line" and "Heaven Line":
Buy signal when the "Trading Line" crosses above the "Heaven Line".
Sell signal when the "Trading Line" crosses below the "Heaven Line".
Monitor the "Operation Line" for additional confirmation:
Secondary sell signal when the "Operation Line" drops below 90% and there is downward price action.
Complementary buy signal when the "Operation Line" rises above 10% and there is upward price action.
Consider the identified trend direction and potential turning points to make informed trading decisions.
LIMITATIONS
The effectiveness of the signals depends on the chosen time frame and specific market conditions.
False signals may occur due to volatile price movements or rapid changes in market sentiment.
NOTES
This script combines traditional technical analysis tools like EMAs with an RSI-like approach to enhance decision-making processes. Users should backtest the strategy under various market scenarios before implementing it in live trading.
THANKS
Special thanks to the contributors whose work inspired parts of this script.