Hancock - Filtered Volume OBV OSC [Alerts]This is an alert version of the strategy found here
This doesn't have the trailing stop or stop loss risk management included, i'll work on a release that has risk management included as best i can with alerts. Make sure to set a stop loss with your alert command.
Happy trading
Hancock
Wyszukaj w skryptach "the strat"

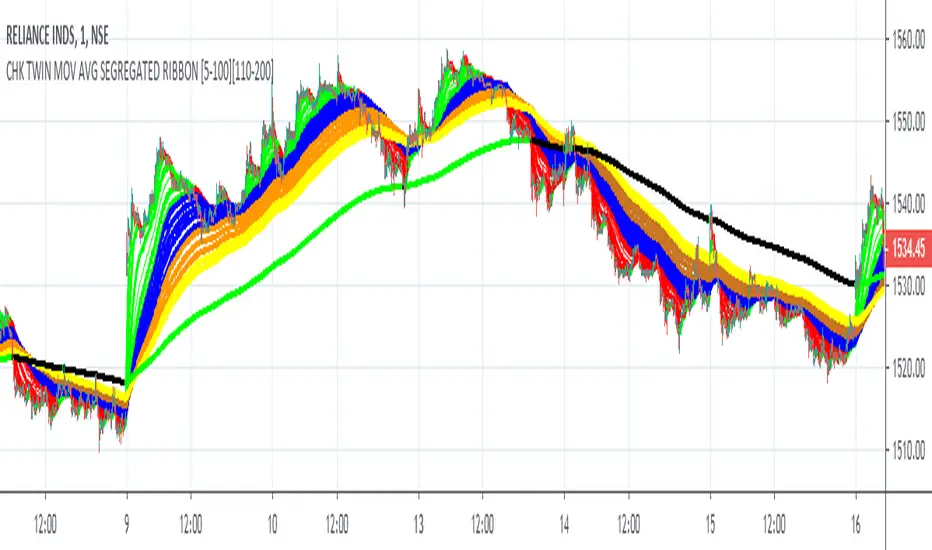
FALSE BREAKOUT NO PROBLEM !! CHK TWIN MOV AVG SEGREGATED RIBBON PROBLEM DEFINITION 1 : To Avoid False Breakouts
PROBLEM DEFINITION 2 : To Ascertain if the trend has changed when a Stock opens with a Gap up or Gap Down
## PROBABLE SOLUTION : Use a Moving Average with lot of latency
## PROBLEM WITH ABOVE SOLUTION : Misses on lot of trades, Late exits leads to drain on winning trades
S O L U T I O N
An Indicator which plots two different types of Moving Averages at the same time
For the MA length 5-100 a fast plot of choice
For the MA Length 110-200 a plot with a lag to ascertain the trend
And then ONE LAST MAN STANDING with even bigger MA length for a lagging indicator to save the day
This indicator gives one 9X9 = 81 Permutation Combinations to look at the markets
One can devise strategies basis if one particular MA Type has crossed another MA Type
Feel free to post the strategies you have come out with!
//// CREDITS AND ACKNOWLEDGEMENTS //////////////////////////////////////////////////////////////////
Following contributors helped the author ::
Credits to Neobutane for his Multiple Type Mov. Avg. Guppy at ......
hxxps://www.tradingview.c0m/script/UQAv1U0c-MA-Study-Different-Types-and-More-NeoButane/
Credits to Jose5770 for sharing Jurik MA code at .....
hxxps://www.tradingview.c0m/script/uqYvkHna-Trend-Direction-Force-Index/
Appreciate and Thank You for sharing your work.
//////////////////////////////////////////////////////////////////////////////////////////////////////
P.S You might notice in the code that the few plots are skipped. It is done to fasten the indicator without compromising
on the functionality
MACD Indicator BFThis is my MACD strategy but in indicator format so I can include alerts. The default settings are the same as in the strategy. The long and short conditions that the alerts are attached to are when the delta (usually illustrated as the histogram) crosses above or below the zero line respectively. There is one alert for long, one for short.

Setting-Less Trend-Step FilteringIntroduction
Indicators settings have been a major concern in trading strategies, in order to provide the best results each indicators involved in the strategy must have its settings optimized, when using only 1 indicator this task can easily be achieved, but an increasing number of indicators involve more slower computations, lot of softwares will use brute force for indicators settings optimization, this involve testing each indicator settings and see which setting/combination maximize the equity, in order to fasten this process softwares can use a user defined range for the indicator settings. Nonetheless the combination that maximize the equity at time t might be different at time t+1...n .
Therefore i propose an indicator without any numerical setting that aim to filter small price variations using the architecture of the T-step lsma, such indicator can provide robust filtering and can therefore be used as input for other indicators.
Robustness Vs Non Robustness
Robustness is often defined as the ability of certain statistical tools to be less affected by outliers, outliers are defined as huge variations in a data-set, high volatility movements and large gaps might be considered as outliers. However here we define robustness as the ability of an indicator to be non affected by price variations that are not correlated with the main trend, which can be defined in technical analysis as pullbacks.
Some small pullbacks in INTEL, the indicator is not affected by them, which allow the indicator to filter the price in a "smart" way.
This effect is made possible by using exponential averaging in the indicator, exponential averaging is defined as y = sc*x + (1-sc)*y , with 1 > sc > 0 . Here sc is calculated in a similar way as the kalman gain, which is in the form of a/(a + b) , in our case this is done with :
sc = abs(input - nz(b ))/(abs(input - nz(b )) + nz(a ))
Non Robust Version Of The Indicator
The user is allowed to use the non robust version of the indicator by unchecking "robust" in the setting panel, this allow a better fit with the price at the cost of less filtering.
robust checked
robust unchecked
Conclusion
I proposed a technical indicator that aim to filter short frequencies without the use of parameters, the indicator proven to be robust to various pullbacks and therefore was able to follow the main trend, although using the term trend for such small price variations might be wrong. Removing high frequencies is always beneficial in trading, noisy series are harder to manipulate, this is why you'll see a lot of indicators using median price often defined as hl2 instead of the closing price.
Like previous settings-less indicators i published this one can behave differently depending on the time frame selected by the user, lower time frames will make the indicator filter more. I'll try to make more setting-less indicators that will correct this effect.
Acknowledgements
The support and interest of the community is only thing that allowed me to be where i'am today, i'am thankful. Special thanks to the tv staff, LucF, and my family who may not have believed in this project but are still proud of their son.

Multistep AutocorrelationAutocorrelation, also known as serial correlation, is the correlation of a signal with a delayed copy of itself as a function of delay. Informally, it is the similarity between observations as a function of the time lag between them. The analysis of autocorrelation is a mathematical tool for finding repeating patterns, such as the presence of a periodic signal obscured by noise, or identifying the missing fundamental frequency in a signal implied by its harmonic frequencies. It is often used in signal processing for analyzing functions or series of values, such as time domain signals.
This multistep autocorrelation function calculates the correlation of roc (rate of change) between an asset at t and t-1 as well as the correlation of the same asset at t and t-4. The output is an average of the two.
If both outputs show a positive correlation, the color will be green.
If only one shows a positive correlation, the color will be yellow.
If neither show a positive correlation, the color will be red.
This indicator can be useful as a filter for strategy entry logic (only enter on strong correlation and the strategy entry condition), or as standalone confirmation of strength in a specific direction. It can also be used to filter chop.
Another potential usecase would be as a variable in regression applications.
Enjoy!

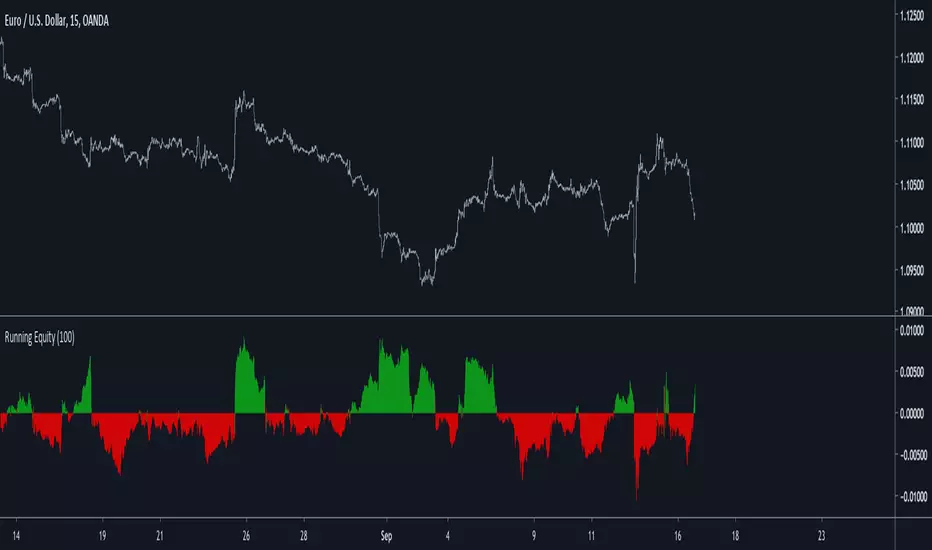
Running Equity - A New Indicator For Optimal Markets DetectionIntroduction
Winning trades and gaining profits in trading is not impossible, however having gross profits superior to gross losses is what make trading challenging, it is logical to think that it is better to open a position when the probability of winning the trade is high, such probability can’t be measured with accuracy but a lot of metrics have been proposed in order to help determining when to open positions, technical analysis support the fact that a trending market is the best market condition for opening a position, which is logical when using a trend following strategy, therefore a long-term positive auto-correlated market is optimal for trading, this is why this paper present a new method for detecting optimal markets conditions in order to open a position.
The Indicator
The proposed indicator is based on the assumption that positive returns using a trend following strategy are a strong indication of trend strength, the proposed indicator is built from the conditions of a simple SMA cross trend following strategy, which are to go long when price > SMA and to go short when price < SMA. Then the equity from those conditions is built, in order to provide a more flexible indicator, length control the period of the sum.
When the indicator is positive it means that the market allow for potential returns, it can thus be considered being trending. Else a negative value of the indicator indicate a ranging market that won't allow for returns.
Filtering Bad Trades
The indicator can be used to filter bad trades entries, in this example a Bollinger band breakout strategy is used, without any changes the strategy return the following equity on EURUSD
The proposed indicator is then applied with the following conditions : buy and sell only if Req > 0
With an indicator period = 100 we filtered unprofitable trades.
Conclusion
I presented a new indicator for the detection of optimal markets based on a running equity. I hope both indicators may find applications in technical analysis and help investors get pertinent outputs from them.
it would mean a lot if you could read the original paper : figshare.com
SAR Trend Trader w/ Alerts By: jhanson107This strategy utilizes Parabolic SAR (Stop and Reverse) along with EMA filtering to improve accuracy. Use the strategy to find optimal settings for the pair your are trading.
Long:
1. SAR below price action
2. Above slow EMA (Default 100 EMA)
3. Update trailing stop daily and exit trade once stopped out.
Short
1. SAR above price action
2. Below slow EMA (Default 100 EMA)
3. Update trailing stop daily and exit trade once stopped out.
White Bars = No trade zone which helps filter out bad trades compared to only using Parabolic SAR.

STPatterns fractalsModified fractals using 1 candle on both side as mentioned by the strategies from stpatterns.com

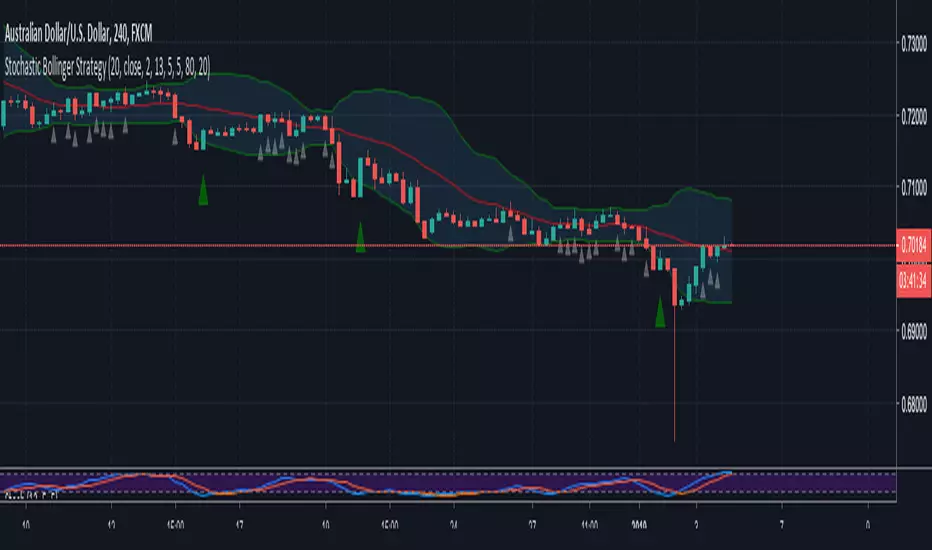
Stochastic Bollinger StrategyBollinger defaults = 20, close, 2
Stochastic defaults = 13, 5, 5
Buy Signal (GREEN triangle):
BULLISH candle formed
Candle OPEN is LESS than LOWER Bollinger Band
Stochastic (K) is LESS than 20
Sell Signal (RED triangle):
BEARISH candle formed
Candle OPEN is GREATER than UPPER Bollinger Band
Stochastic (K) is GREATER than 80
Read more about the strategy and where to set buy stops and sell stops here: swing-trading-strategies.com
Karobein OscillatorDeveloped by Emily Karobein, the Karobein oscillator is an oscillator that aim to rescale smoothed values with more reactivity in a range of (0,1)
Calculation
The scaling method is similar to the one used in a kalman filter for the kalman gain.
We first average the up/downs x, those calculations are similar to the ones used for calculating the average gain/loss in the relative strength index.
a = ema(src < src ? x : 0,length)
b = ema(src > src ? x : 0,length)
where src is a exponential moving average of length period and x is src/src in the standard calculations, but anything else can be used as long as x > 0 .
Then we rescale the results.
c = x/(x + b)
d = 2*(x/(x + c*a)) - 1
How To Use
It is better to use centerline-cross/breakouts/signal line.
In general when we use something smooth as input in oscillators, breakouts are better than reversals, you can see this with the stochastic and rsi.
So a simple approach could be buying when crossing over 0.8 and selling when crossing under 0.2.
Here is the balance of a strategy using those conditions, length = 50 .
20 trades have been mades since the 29 oct we made 341 pips with eur/usd, of course this backtest was made during good trends period,
this result is not representative of how the strategy work with other conditions/markets.
For any questions/suggestions feel free to contact me

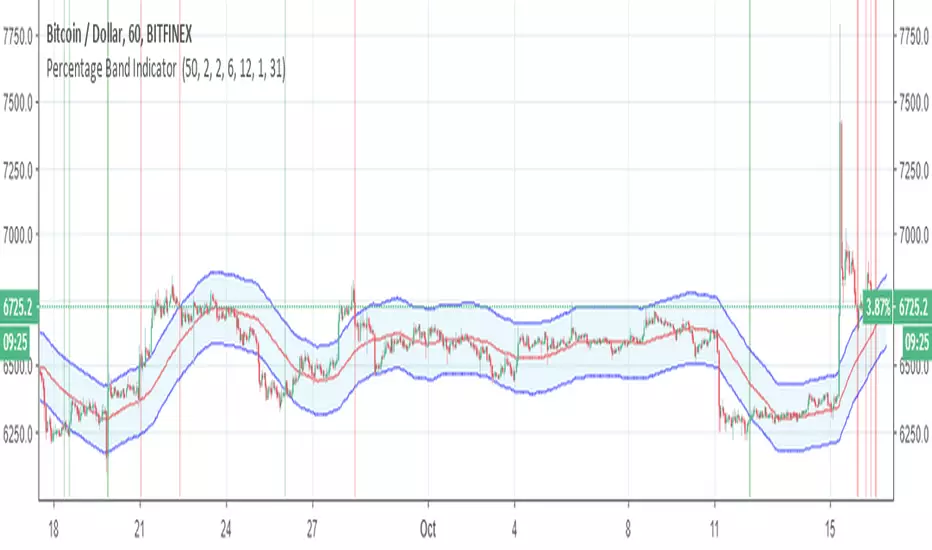
Percentage Band Indicator I added alerts in my Percentage Band strategy
You can see the strategy and backtest here
You can look at my other scripts.
www.tradingview.com
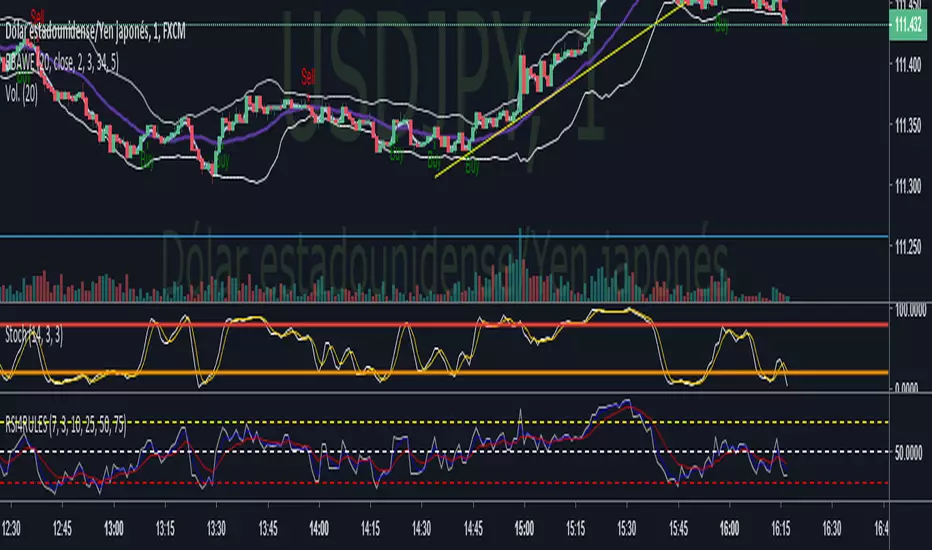
RSI4RULESThe Script is for use with the strategy of the 4 rules of Daven Icao. It is an RSI (black) with two Emas, 3 (blue) and 10 (red). To buy the RSI is expected to cross with the Emas in oversold zone, which is level 25; level 75 is an overbought area where we expect the RSI to cross with the Emas. If you consider that this script can be used in another strategy, use it! You can modify the values of the RSI and the Emas.
Matt Bishop's Moving Average Compression Strategy (MAC)
This strategy works well on all time frames, however, I'm sure everyone will have their own personal preference.
**Ignore the main chart at the top, the strategy is posted in the image below.

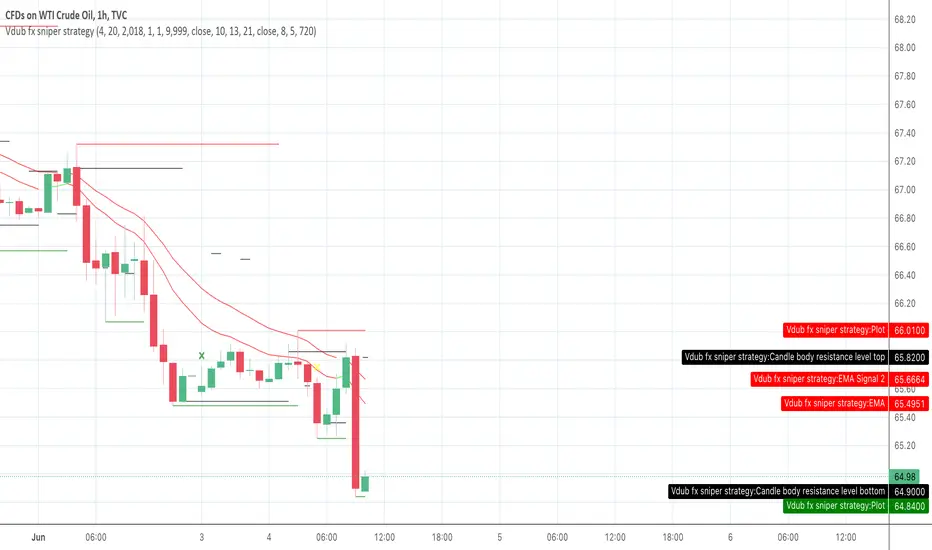
Vdub fx sniper strategy with alertsThis mimics the performance of the strategy created by Vdub FX Sniper, the user should buy when it marks green and sell when it marks yellow, however i can't get to the alert system trigger effectively, any ideas?
EMAgainEMAgain in ProfitTrailer is the strategy using the spread difference between the price and combination of fast EMA and slow EMA .
Buy value and time frame numbers are from popular setting, which can be modified in format.
If you set buy value positive for gain starategy, it is mostly between the price and slow EMA except one or two candle right after cross (sometimes three candles). In the time point indicated by "▲", the trailing for buy will start.
If you set buy value negative for gain starategy, it is mostly between the price and fast EMA except one or two candle right after cross (sometimes three candles). In the time point indicated by "▼", the trailing for buy will start.
This script is to help myself understand the buy strategies of ProfitTrailer.
Any comments and suggestions are welcome.

SMAgainSMAgain in ProfitTrailer is the strategy using the spread difference between the price and combination of fast SMA and slow SMA.
Buy value and time frame numbers are from popular setting, which can be modified in format.
If you set buy value positive for gain starategy, it is mostly between the price and slow SMA except one or two candle right after cross (sometimes three candles). In the time point indicated by "▲", the trailing for buy will start.
If you set buy value negative for gain starategy, it is mostly between the price and fast SMA except one or two candle right after cross (sometimes three candles). In the time point indicated by "▼", the trailing for buy will start.
This script is to help myself understand the buy strategies of ProfitTrailer.
Any comments and suggestions are welcome.

SMAgain vs EMAgain for ProfitTrailerSMAgain or EMAgain in ProfitTrailer is the strategy using the spread difference between the price and combination of fast MA and slow MA.
Time frame numbers are from popular settings.
If you have positive buy value for gain starategy, it is mostly between the price and slow MA except one or two candle right after cross (sometimes three candles).
If you have negative buy value for gain starategy, it is mostly between the price and fast MA except one or two candle right after cross (sometimes three candles).
This script is to help myself understand the buy strategies of ProfitTrailer.
Any comments and suggestions are welcome.

BB and Keltner SqueezeStrategy using the Bollinger band with the Keltner Channels . Watch for the Bollinger bands (blue/red lines) squeezing inside the Keltner Channels (pink dots) for a breakout - this could be up or down so use in conjunction with other indicators.
The blue band is the 2 standard deviation from price, the red is 3 standard deviations. With these, typically if the price bounces off the red then it will retrace a little, (although if there is a massive breakout/down this may not hold). When the bands narrow this is an indicator of consolidation, therefore with a likely upcoming breakup or down.
The pink dots are the Keltner Channels. The strategy says if the bollinger bands come inside the Keltner Channels then this is a strong indicator that the breakout is coming. Sometimes the length of time the squeeze occurs for is indicative of the length/strength of the breakout.
These indicators can be used on all timeframes but higher timeframes will be stronger and more reliable of a trend change.

Double Bollinger Bands Forex Strategy
I came across Kathy Lien talk about Double Bollinger Band strategy quite a lot.
More information concerning the usage of the strategy is best explained by Kathy Lien in her YouTube webinars.
Basically there are two Bollinger Bands:
1. 20 Period, 1 Standard Deviation
2. 20 Period, 2 Standard Deviation
Recommended Time Frame is Daily or 4 Hours.
Basically we want the currency pair to roll over close below the 1 Standard Deviation (Green Band). This tells us the up-trend has broken, the momentum has been lost and the currency pair is now reversing. We then Short it at the next candle.

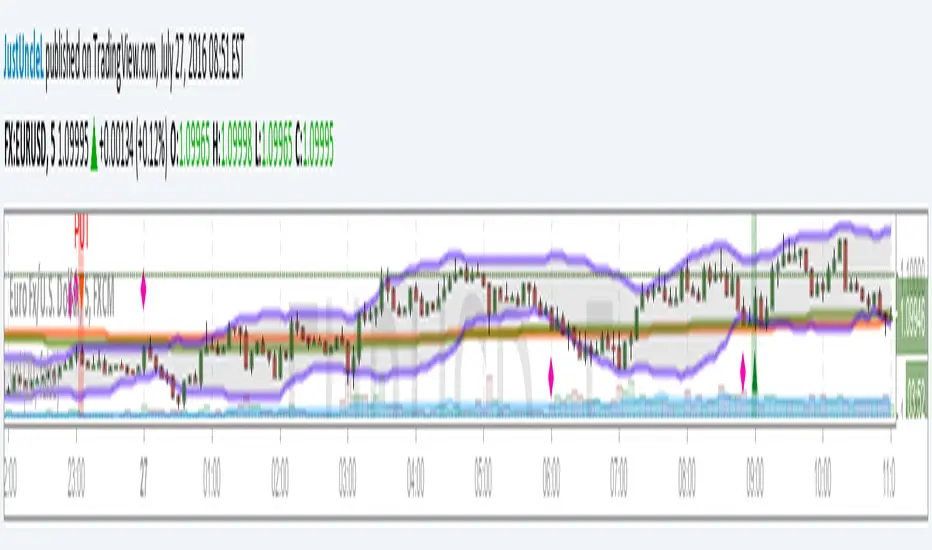
[INDICATOR]Renko Emulator OCC v1 by JustUncleLThis "Study" project has been created by request and is used in conjunction with the "Strategy" version.
*** EXPERIMENTAL ***
*** USE AT YOUR OWN RISK ***
Description:
Indicator based around Renko Bar Chart emulator (ATR) with direction change used to signal buy/sell trades.
I have generally found that setting the strategy ATR resolution to 3-5x that of the chart you are viewing tends to yield the good results, regardless of which chart time used. Positions get taken automatically following THE Renko Bar after a crossover.

Bollinger Band and Moving Average v0.1 by JustUncleLThis is another Bollinger Band strategy+indicator in my series of Bollinger based setups. This one is seems to work best with 5min charts and 20 to 30min expiry. The strategy follows variation of a Bollinger band + Moving Averages
reversal strategy, it uses the 2 moving averages mainly to determine market direction.
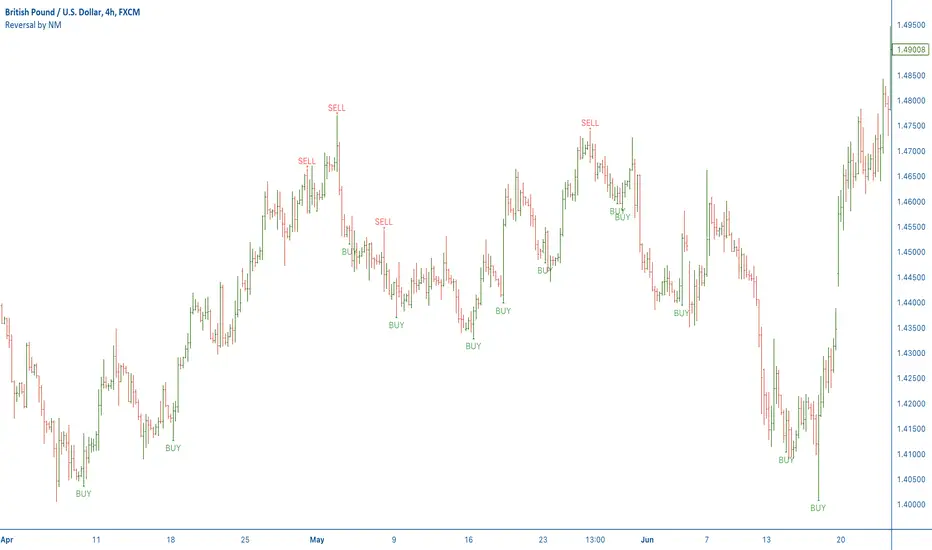
[NM] Reversal Candles v01Reversal candles are a very easy way to identify a turn in trend, this indicator has some specific additional conditions for the reversal candle.
BUY Signal reversal candle
Low of current candle exceeds low of previous candle
Low of current candle is lowest for last 7 candles
High of current candle exceeds high of previous candle
Close of current candle is in the upper 50% of the range of this candle
SELL Signal reversal candle
High of current candle exceeds high of previous candle
High of current candle is Highest for last 7 candles
Low of current candle exceeds low of previous candle
Close of current candle is in the lower 50% of the range of this candle
How do I trade it ? (example buy signal)
Wait for close of the candle and the BUY signal
Put a buy stop entry 5 pips above the high of the candle
Put a stop loss 5 pips below the low of the candle
Calculate difference between entry and stop loss and set your target that number of pips above the entry for a 1:1 RR trade*
Wait for your your target or stop loss to be triggered
* Alternatively, you can take 50% of the profit at the 1st (1:1 RR) profit target, move your stop to break even and let the rest of the position run for a higher potential profit.
Further advice on use
Personally I always look for some additional confirmation like a support or resistance level, a bounce of the EMA or a fibonacci level, but please feel free to add additional filters to make the strategy even more effective. I would strongly advise to backtest your strategy first so you can fine tune it and have confidence in trading it. Forward testing on a demo account before going live, although it takes longer, can be a worthy alternative. Works better on higher time frames.
How do you use it ?
Please leave a note in the comment section below to let me know if you use the indicator and how. There's definitely not just one way to use the indicator so I'm curious about your feedback.
To apply the script to your chart, just add it to your favourites so you can easily find it in the Indicators list.
Kindly leave me a thumbs up if you like this indicator or support my work, and do not hesitate to visit my other indicators. Thanks for your visit
I_Heikin Ashi CandleWhen apply a strategy to Heikin Ashi Candle chart (HA candle), the strategy will use the open/close/high/low values of the Heikin Ashi candle to calculate the Profit and Loss, hence also affecting the Percent Profitable, Profit Factor, etc., often resulting a unrealistic high Percent Profitable and Profit Factor, which is misleading. But if you want to use the HA candle's values to calculate your indicator / strategy, but pass the normal candle's open/close/high/low values to the strategy to calculate the Profit / Loss, you can do this:
1) set up the main chart to be a normal candle chart
2) use this indicator script to plot a secondary window with indicator looks exactly like a HA-chart
3) to use the HA-candle's open/close/high/low value to calculate whatever indicator you want (you may need to create a separate script if you want to plot this indicator in a separate indicator window)
