trend_vol_stopThe description below is copied from the script's comments. Because TradingView does not allow me to edit this description, please refer to the script's comments section, as well as the release notes, for the most up-to-date information.
----------
Usage:
The inputs define the trend and the volatility stop.
Trend:
The trend is defined by a moving average crossover. When the short
(or fast) moving average is above the long (slow) moving average, the
trend is up. Otherwise, the trend is down. The inputs are:
long: the number of periods in the long/slow moving average.
short: the number of periods in the short/fast moving average.
The slow moving average is shown in various colors (see explanation
below. The fast moving average is a faint blue.
Volatility stop:
The volatility stop has two modes, percentage and rank. The percentage
stop is given in terms of annualized volatility. The rank stop is given
in terms of percentile.
stop_pct and stop_rank are initialized with "-1". You need to set one of
these to the values you want after adding the indicator to your chart.
This is the only setting that requires your input.
mode: choose "rank" for a rank stop, "percentage" for a percentage stop.
vol_window: the number of periods in the historical volatility
calculation. e.g. "30" means the volatility will be a weighted
average of the previous 30 periods. applies to both types of stop.
stop_pct: the volatility limit, annualized. for example, "50" means
that the trend will not be followed when historical volatility rises
above 50%.
stop_rank: the trend will not be followed when the volatility is in the
N-th percentile. for example, "75" means the trend will not be
followed when the current historical volatility is greater than 75%
of previous volatilities.
rank_window: the number of periods in the rank percentile calculation.
for example, if rank_window is "252" and "stop_rank" is "80", the
trend will not be followed when current historical volatility is
greater than 80% of the previous 252 historical volatilities.
Outputs:
The outputs include moving averages, to visually identify the trend,
a volatility table, and a performance table.
Moving averages:
The slow moving average is colored green in an uptrend, red in a
downtrend, and black when the volatility stop is in place.
Volatility table:
The volatility table gives the current historical volatility, annualized
and expressed as a whole number percentage. E.g. "65" means the
instrument's one standard deviation annual move is 65% of its price.
The current rank is expressed, also as a whole number percentage. E.g.
"15" means the current volatility is greater than 15% of previous
volatilities. For convenience, the volatilities corresponding to the
0, 25, 50, 75, and 100th percentiles are also shown.
Performance table:
The performance table shows the current strategy's performance versus
buy-and-hold. If the trend is up, the instrument's return for that
period is added to the strategy's return, because the strategy is long.
If the trend is down, the negative return is added, because the strategy
is short. If the volatility stop is in (the slow moving average is
black), that period's return is excluded from the strategy returns.
Every period's return is added to the buy-and-hold returns.
The table shows the average return, the standard deviation of returns,
and the sharpe ratio (average return / standard deviation of returns).
All figures are expressed as per-period, whole number percentages.
For exmaple, "0.1" in the mean column on a daily chart means a
0.1% daily return.
The number of periods (samples) for each strategy is also shown.
Wyszukaj w skryptach "the strat"

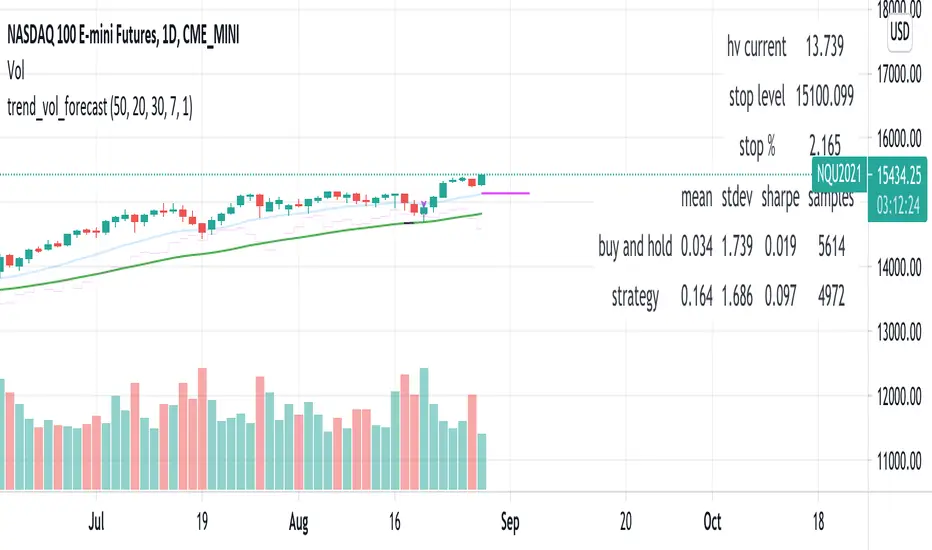
trend_vol_forecastNote: The following description is copied from the script's comments. Since TradingView does not allow me to edit this description, please refer to the comments and release notes for the most up-to-date information.
-----------
USAGE
This script compares trend trading with a volatility stop to "buy and hold".
Trades are taken with the trend, except when price exceeds a volatility
forecast. The trend is defined by a moving average crossover. The forecast
is based on projecting future volatility from historical volatility.
The trend is defined by two parameters:
- long: the length of a long ("slow") moving average.
- short: the length of a short ("fast") moving average.
The trend is up when the short moving average is above the long. Otherwise
it is down.
The volatility stop is defined by three parameters:
- volatility window: determines the number of periods in the historical
volatility calculation. More periods means a slower (smoother)
estimate of historical volatility.
- stop forecast periods: the number of periods in the volatility
forecast. For example, "7" on a daily chart means that the volatility
will be forecasted with a one week lag.
- stop forecast stdev: the number of standard deviations in the stop
forecast. For example, "2" means two standard deviations.
EXAMPLE
The default parameters are:
- long: 50
- short: 20
- volatility window: 30
- stop forecast periods: 7
- stop forecast standard deviations: 1
The trend will be up when the 20 period moving average is above the 50
period moving average. On each bar, the historical volatility will be
calculated from the previous 30 bars. If the historical volatility is 0.65
(65%), then a forecast will be drawn as a fuchsia line, subtracting
0.65 * sqrt(7 / 365) from the closing price. If price at any point falls
below the forecast, the volatility stop is in place, and the trend is
negated.
OUTPUTS
Plots:
- The trend is shown by painting the slow moving average green (up), red
(down), or black (none; volatility stop).
- The fast moving average is shown in faint blue
- The previous volatility forecasts are shown in faint fuchsia
- The current volatility forecast is shown as a fuchsia line, projecting
into the future as far as it is valid.
Tables:
- The current historical volatility is given in the top right corner, as a
whole number percentage.
- The performance table shows the mean, standard deviation, and sharpe
ratio of the volatility stop trend strategy, as well as buy and hold.
If the trend is up, each period's return is added to the sample (the
strategy is long). If the trend is down, the inverse of each period's
return is added to the sample (the strategy is short). If there is no
trend (the volatility stop is active), the period's return is excluded
from the sample. Every period is added to the buy-and-hold strategy's
sample. The total number of periods in each sample is also shown.
HYE Combo Market [Indicator] (Vwap Mean Reversion+Trend Hunter)Indicator version of the strategy:
* Alerts added.
TIPS AND WARNINGS
1-) The standard settings of this combo script is designed and tested with daily timeframe. For lower timeframes, you should change the indicator settings and find the best value for yourself.
2-) Only the mean vwap line is displayed on the graph. For a detailed view, you can delete the "//" marks from the plot codes in the script code.
3-) This is an indicator for educational and experimental purposes. It cannot be considered as investment advice. You should be careful and make your own risk assessment when opening real market trades using this indicator.

HYE Mean Reversion SMAIndicator version of the strategy "HYE Mean Reversion SMA "
"Long", "Short", "Exit Long" and "Exit Short" alarms added.
Use with "Once Per Bar Close".

[Sidders] MACDEMASAR IndicatorCame across a cool idea for a strategy that couldn't find in the indicator database, so decided to code it up myself for your pleasure.
Indicators consists of 3 indicators: EMA(200) to determine the overall trend, and the MACD & Parabolic SAR to determine entries (and exits).
Long entry contains 4 conditions and is generated when price is above the 200EMA (1), the MACD crosses above the signal line (2), while they are both below 0 line (3) and when the parabolic SAR is below the closing price of the bar (4).
Short entry is build up the same but in reverse: price is below the 200EMA(1), signal line crosses below the MACD line (2), while they are both above the 0 line (3) and when the parabolic SAR is above the closing price of the bar (4).
Place the stoploss on the parabolic SAR dot below/above the candle that created the signal. Profit target 1:1 risk:reward ratio, but can ofcourse be changed according to your risk apetite. Might add automatically drawn SL/TPs in a later update.
Concept behind the strategy should work on all timeframes, but will require proper backtesting. I think with additional filters the strategy can also be way more finetuned and profitable, personally haven't had the time yet to dive into that.
Have also added alerts for your convenience.
Enjoy!

All in One StudyHere is my All in One Strategy converted into a Study with Alert Conditions you can use for whatever purpose you wish.
Each condition is set up similarly to the way I had the strategy set up, if you pick the indicators you want to base your alerts on it will alert you only if the check box is true.
You can pick one or more of the indicators if you'd like. I only suggest to pick one at a time so you don't have overlapping buy/sell alerts.
I think everyone will find the message of the market falling alert amusing :-)

Logging in Pine ScriptI'm building quite a lot of pretty complicated indicators/strategies in Pine Script. Quite often they don't work from the 1 try so I have to debug them heavily.
In Pine Script there are no fancy debuggers so you have to be creative. You can plot values on your screens, check them in the data window, etc.
If you want to display some textual information, you can plot some info as labels on the screen.
It's not the most convenient way, so with the appearance of tables in Pine Script, I decided to implement a custom logger that will allow me to track some useful information about my indicator over time.
Tables work much better for this kind of thing than labels. They're attached to your screen, you can nicely scale them and you can style them much better.
The idea behind it is very simple. I used few arrays to store the message, bar number, timestamp, and type of the message (you can color messages depend on the type for example).
There is a function log_msg that just append new messages to these arrays.
In the end, for the last bar, I create the table and display the last X messages in it.
In parameters, you can show/hide the entire journal, change the number of messages displayed and choose an offset. With offset, you can basically scroll through the history of messages.
Currently, I implemented 3 types of messages, and I color messages according to these types:
Message - gray
Warning - yellow
Error - red
Of course, it's a pretty simple example, you can create a much fancier way of styling your logs.
What do you think about it? Is it useful for you? What do you use to debug code in Pine Script?
Disclaimer
Please remember that past performance may not be indicative of future results.
Due to various factors, including changing market conditions, the strategy may no longer perform as good as in historical backtesting.
This post and the script don’t provide any financial advice.

CPR, Camarilla & Moving AverageThis script is created primarily for Intraday trading but can also be used for short and long term trading. This is a combination of Central Pivot Range (CPR), Moving Averages and Camarilla Pivot levels (with inner levels). This helps you to combine the strategies of CPR and Moving Averages to identify the best trading opportunities with greater edge. Central Pivot Range and Camarilla pivots are taken from PivotBoss by Franc Ochoa.
Key features:
# Daily CPR levels
# Weekly CPR levels
# Monthly CPR levels
# Previous Day High and Lows
# Previous Week Highs and Lows
# Previous Month Highs and Lows
# Camarilla Pivots with inner Levels
# CPR Levels for the next Day, Week and Month
# 5 Simple moving averages and 5 Exponential Moving Averages
What separates this script from other scripts with CPR and Moving averages?
# One of the few indicators (if not the only one) which combines the 2 types of Moving Averages, CPR and also Camarilla Pivots.
# CPR Levels for not just the next Day, but for next Week(Weekly CPR) and Month(Monthly CPR) also.
# Hide the previous day's levels according to your wish. This is the most unique feature of this indicator. You can set the number of Daily CPR levels you want to load in the chart. This is not just for the Daily CPR but also for the Weekly and Monthly CPR also. This makes the chart less cluttered and prevents the candles from getting buried in the indicators. Please notice how the previous day's CPR levels are hidden in the displayed demo chart on the script page. In the chart, only one trading day's data is shown(by default).
# This script is OPEN SOURCE.
Strategies :
For CPR & Camarilla Strategies for intraday trading and swing trading refer to the book 'Secrets of a Pivot Boss: Revealing Proven Methods for Profiting in the Market' by Franklin O. Ochoa.
Moving averages strategies :
Moving averages can be combined and also used individually for several strategies
* 9 EMA can be used as trailing stop loss for strong moving trends that helps you to catch big moves.
* 20sma can be used not just trailing stop loss but also for taking re-entry to the trend.
* Golden cross - The golden cross occurs when a short-term moving average crosses over a major long-term moving average to the upside. This indicates a bullish turn in the market. Eg: 50 SMA cuts 200 SMA from below.
* Death Cross - The death cross occurs when the short term moving average crosses the long-term average from above. This indicates a bearish turn in the market. Eg: 50 SMA cuts 200 SMA from above.
* When 20 SMA is above 50 SMA and 20 SMA and 50 SMA are angling up like parallel lines, then it denotes bullish strength. If this happens right after Golden Cross, big moves to the upside can be expected.
* When 20 SMA is below 50 SMA and 20 SMA and 50 SMA are angling down like parallel lines, then it denotes bearish strength. If this happens right after Death Cross, big moves to the downside can be expected.
* When 20SMA and 50 SMA are going flat and crossing each other, then it denotes sideways sentiment.
Moving average strategies are taken from the book 'How to Make Money in Intraday Trading' by Ashwani Gujral. For learning more about how to combine CPR and Moving averages in your trading please refer to this book.

MACD + PSAR SetupThis indicator combines 3 elements:-
1. MACD which will act as a source of potential Buy Signal
2. PSAR which provides the confirmation for buy signal and for potential Buy on Dip Strategy
3. Breakout candles which provides the confirmation signal for Buy on Breakout strategy
4. The direction of the trend is provided by the Exponential Moving Average
The strategy is to have any counters which has triggered the MACD Golden Cross signal. These counters are to be out under watchlist for further confirmation.
The Buy Signal is confirmed when:-
1. Price is above EMA Direction(standard is set at 200)
2. PSAR has given the Buy Signal OR a Breakout Candle occurs.
Buy Signal is shown with a Green Diamond symbol whilst the Sell Signal is shown in Red Diamond Symbol.
The bullish and bearish condition is set via a green and red background
The MACD and PSAR codes are derived from the standard codes which is available in tradingview.

CME's BRL/USD to B3's USD/BRL ConversionThis indicator is made to calculate and show the spread between the currency pair USD-BRL being negotiatied in Brasil's B3 and in USA's CME Globex.
The orange line "Arbitrage" is the spread.
The red/green line is the "Stop Loss" recommended for the strategy. If the line is green, it means that the reward/tisk ratio is above 1.
IMPORTANT: MAKE SURE TO BE USING THE SAME TIMEFRAME ON BOTH THE INDICATOR AND THE CHART.
----------------------------------------------------------------------------------------------------------------------------------------------------------------------
"Este indicador é feito para calcular e mostrar o spread entre o par USD-BRL em negociação na B3 do Brasil e na CME Globex dos EUA.
A linha laranja "Arbitragem" é a propagação.
A linha vermelha / verde é o "Stop Loss" recomendado para a estratégia. Se a linha estiver verde, significa que a relação recompensa / risco está acima de 1.
IMPORTANTE: CERTIFIQUE-SE DE USAR O MESMO PRAZO NO INDICADOR E NA TABELA."

Open Close Cross Strategy R6.1 revised by yourmattieOriginal version: Open Close Cross Strategy R5 revised by JustUncle.
Change: script changed to a study script with custom alerts.
This revision is an open Public release, with just some minor changes. It is a revision of the Strategy "Open Close Cross Strategy R2" originally published by @JayRogers.
Revised by JustUncleL
Description :
Strategy based around Open-Close Moving Average Crossovers optionally from a higher time frame.
Read more about the indicator original script
Klik here
##USE AT YOUR OWN RISK##
Use this as overlayer on the original strategy to set custom alerts.
Info: with this study script no buy/sell arrows show up op the chart.
Does some know a solution for this issue:
Issue: sometimes it gives a false signal because even when you set "one per bar close" the custom set alert might come halfway the bar....and it might be a false signal when the bar is closed
Does somone know a fix for this? I tried with barstate.iscomfirmed but it didn't work for me.
Ps. I'm not a developer...just changed the scipt by watching a youtube tutorial.
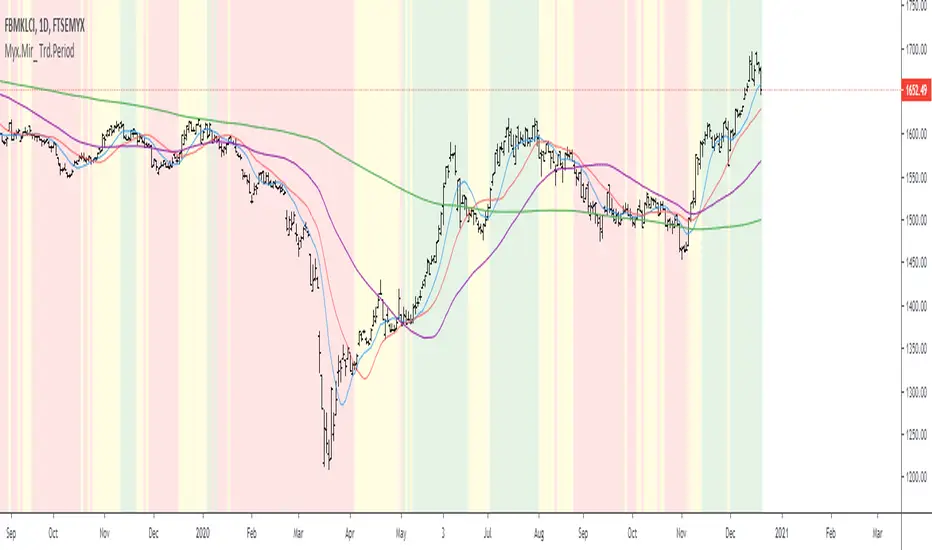
Myx.Mir_ Trd.Period c/w Background ColorMyx.Mir_ Trd.Period c/w Background Color
FBMKLCI is a main Indices/ references
Basis = Based on Simple Moving Average
Note:-
BG= Background Color
Based on personal study:-
BG is Green = Current index > MA 20 > MA 50 = Sign of Bullish // majority portfolio should be in green & make profit... Hehehe
BG is Yellow = MA50 < Current Index < MA 20 = No solid direction and/or sideways // ----------------------------------------------------... should plan to hold or exit
BG is Red = Current Index < MA 50 = Sign of Bearish // majority of portfolio should be in red... Hehehe. Should be run Fast Fast.....
can do your own Trade Record Based on 3 phases
a) When the strategy/ Technique are perform better @ more gain and Don't chase the price ... "nanti asal Kejar Pucuks Je price terus Droppp..." Hehe.
b) When the strategy / Technique not perform well...
Trend Finder V2 StudyStudy version of the script with alert conditions for up and down
Note* The study version will not trigger at the same points the strategy version does due to the strategy limiting the orders to a buy then a sell, back testing didn't seem to change the results to much though
Please experiment with the pyramid function in the strategy script to change how many buy orders can be made in a row before using the alert conditions, a profit factor over 2 is considered good

Minimum Average True RangeI use ATR a lot when designing trading strategies, this way the strategy adjusts to the instrument in most cases instead of me plugging in special numbers.
However, ATR itself could get spiked by some violent moves. For this I have created MinATR which I am publishing here.
It is effectively ATR + minimum ATR over the last "Min Length" bars. (this is a parameter which I have defaulted to 50).
So use this the same way you use ATR, but it will also show the min ATR over the last "Min Length" periods.

CCI Strategy v2This was a strategy I found based on MT4. It takes CCI readings, then transforms them into a weighted moving average illustration. This is represented as:
Red Line - A six period moving average taken from CCI (NOT PRICE)
Green Line - A sixty-six period moving average taken from CCI (NOT PRICE)
Blue Line - CCI plotted
I have also added some levels and bollinger bands to highlight changes in activity.
The strategy is:
BUY - When the red line crosses upwards over green line.
SELL - When the red line crosses downwards over green line.
Extra confirmation is available by watching the blue line, it should be above red to buy, below red to sell. If the blue line drops in the opposite direction, this may be an opportunity to buy on a pull back.
If you wish for any modications to be applied, please do not hesitate to contact me.

XAGUSD Long/Short Signal ~ By: Sarp GokdagAbout the Oscillator :
The Rex Oscillator is a study that measures market behavior based on the relationship of the close to the open, high and low values of the same bar. The theory behind the Rex Oscillator is that a big difference between the high and close on a bar indicates weakness. Conversely, wide disparity between the low and close indicates strength. The difference between open and close also indicates market performance.
The True Value of a Bar (TVB) gives us an indication of how healthy the market is. It is possible to have a negative close and a positive TVB, and vice versa. This indicates that the market is building strength on the opposing side of the trend. The Rex Oscillator is a moving average of the TVB, indicating the inertia of the market. When the Rex Oscillator turns positive in a bearish trend, a reversal is indicated. Likewise, Rex turning negative in a bull market indicates a reversal to the downside.
When the Rex Oscillator turns positive in a bearish trend, a reversal is indicated. Likewise, Rex turning negative in a bull market indicates a reversal to the downside.
The REX Strategy goes long when the REX line of the REX Oscillator crosses above the Signal line and Short when the REX line crosses below the Signal line. The strategy is a reversal strategy through the use of the 'Cover and go Long' and 'Close and go Short' Actions. The REX Oscillator properties of Period' and Signal' can be changed for testing purposes using the available Rex1 'Factor.'
The blue line indicates the difference between the Rex MA and the Signal.
If the blue line crosses above "0", go Long.
If the blue line crosses below "0", go Short.
To achieve best results from this strategy, set your chart range minimum 4hrs, max 1 Day.
The above references an opinion and is for information purposes only. It is not intended to be investment advice. Seek a duly licensed professional for investment advice.

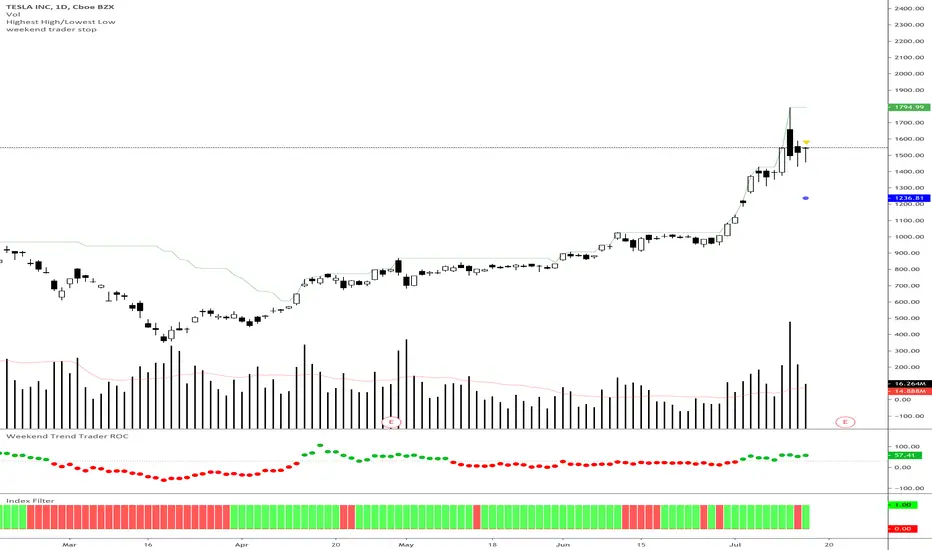
Weekend Trader Smoothed Rate of Change
Rate of change indicator based on Nick Radge's Weekend Trend Trader Strategy, with an added extra of EMA smoothing if you want it.
This indicator simply turns green when the rate of change is above a certain level (value is set in threshold)
Threshold is defaulted to 30 as outlined in the strategy rules
CME's BRL/USD to B3's USD/BRL ConversionThis indicator is made to calculate and show the spread between the currency pair USD-BRL being negotiatied in Brasil's B3 and in USA's CME Globex.
The orange line "Arbitrage" is the spread.
The red/green line is the "Stop Loss" recommended for the strategy. If the line is green, it means that the reward/tisk ratio is above 1.
IMPORTANT: MAKE SURE TO BE USING THE SAME TIMEFRAME ON BOTH THE INDICATOR AND THE CHART.

Arbitrage DOL BR / DOL USAThis indicator is made to calculate and show the spread between the currency pair USD-BRL being negotiatied in Brasil's B3 and in USA's CME Globex.
The orange line "Arbitrage" is the spread.
The red/green line is the "Stop Loss" recommended for the strategy. If the line is green, it means that the reward/tisk ratio is above 1.
IMPORTANT: MAKE SURE TO BE USING THE SAME TIMEFRAME ON BOTH THE INDICATOR AND THE CHART.

MA-EMA Crossover AlertsThis is a script for getting alerts for the MA-EMA XO Strategy that I published recently.
This is probably the first version that I am putting out for this logic.
Based on feedback (and some coding suggestions and support if anyone is willing), I will try to improve this further.
So, what do we have in this script -
I have created 5 alert conditions. The 4 alerts are straight-forward : Entry / Exit alerts for Long / Short.
The fifth alert is just a single Alert which is triggered if any of the 4 alert conditions are met. Then user can check the chart to see what trade is triggered.
I am not explaining the logic of the indicator here since it is kind-of covered in the strategy.

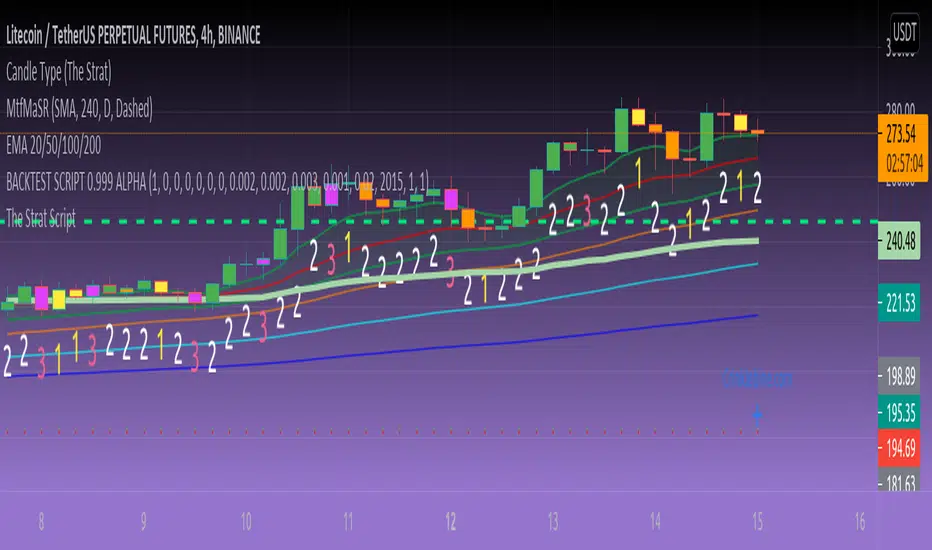
Candle State (The Strat)This script identifies the 2 different Candle States for use in #TheStrat.
Candle Up - The close of the current candle is greater than the close of the previous candle.
Candle Down - The close of the current candle is less than the close of the previous candle.
Though this script is extremely simple it is a teaching aid for #TheStrat.
The script also assists in the identification of up and down candles with gaps where the color of candle will not always match the Candle State.
Analysis of the candle types can help you define actionable signals and draw broadening formations.
Disclaimer: All scripts from this account are for informational purposes only and do not produce buy or sell recommendations.
© 2020 Crinklebine

STEMWAPThis update includes the stop loss long and stop loss short adjustments as well as VWAP tuning into the STEM script.
I tend to not use the VWAP tuning but sometimes the strategy script will benefit slightly from using it.
The adjustment values make a huge difference, especially when using this on shorter time frames.
The idea is to tweak the strategy settings until you have something profitable, then set your stemwap to those settings and use it as a helpful guideline for your day trades.
