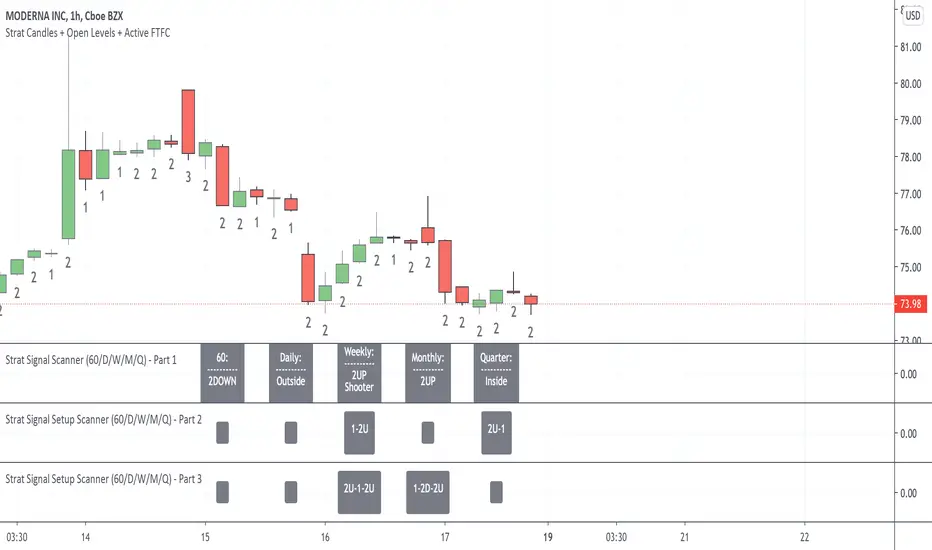
Strat Signal Setup Scanner (5/15/30/60/D) - Part 2
** PLEASE READ BEFORE USING THIS INDICATOR **
This indicator is strictly for helping people like myself learn 'The Strat' method by Rob Smith. This indicator DOES NOT provide trading advice or trade entry signals!
This scanner is Part 2 only. Please use with Strat Signal Setup Scanner's (5/15/30/60/D) Part 1 and 3 for full function.
A demo video of this indicator is available:
Change indicators label color’s and adjust scanner window as required.
Strat Signal and Setup Scanner (60/D/W/M/Q) - Part 1/2/3 version is also available.
Strat Signal and Setup Scanner (60/D/W/M/Q) - Part 1, 2 and 3 features:
Strat Signal Scanner - Part 1 - (The Current bar’s condition with Hammer / Shooting Star combos if identified)
Inside Bar
2UP
2DOWN
Outside Bar
Shooting Star (signal will trigger when candle is forming live not after the candle has closed allowing you to prepare)
Hammer (signal will trigger when candle is forming live not after the candle has closed allowing you to prepare)
Shooter-Hammer (signal will trigger when pattern is forming live AND after both the Shooter and Hammer candles have closed giving you the new bar to action)
Hammer-Shooter (signal will trigger when pattern is forming live AND after both the Shooter and Hammer candles have closed giving you the new bar to action)
Strat Signal Setup Scanner - Part 2 - (Previous Bar + Current bar to identify setups)
2U-1
2D-1
3-1
1-2U
1-2D
1-3
3-2U
3-2D
Strat Signal Setup Scanner - Part 3 - (Previous two bars + Current bar to identify setups)
3-1-2U
3-1-2D
2U-1-2U
2D-1-2D
2U-1-2D
2D-1-2U
1-2U-2D
1-2D-2U
How to use the Strat Signal and Setup Scanner?
Open the 3 indicators in order starting with Part 1, Part 2 then Part 3. That way the scanner headings (5/15/30/60/D) will line up with the setups signals.
IMPORTANT: For the scan to work across ALL Timeframe Groups (5/15/30/60/D) successfully you must open a 5min chart on the stock you want to scan.
Once the scan results are displayed with the 5min chart open you can then click on a 15/30/60/D chart to see the setups. But do not pay attention to the new lower timeframe scan results when you have a higher timeframe chart open as they will be incorrect.
For an example: a Successful (5/15/30/60/D) Scan = after you open a 5min chart only. If you open the 15min chart the (15/30/60/D) scan results will be correct but the 5min scan results will be incorrect. If you open the 30min chart the (30/60/D) results will be correct but the 5 and 15 scan results will be incorrect always go back to the 5min chart to correct. This anomaly if due to a historical data issue with pine script.
How to change the Scanner Labels and Text Color’s?
Color’s changed within the Indicator Settings. After you choose your color's on the 'Inputs' page make sure you click the drop down arrow next to 'Defaults' (bottom left of the indicator settings) and then click 'Save As Default' to save your personalised indicator preferences.
How to create an Alert?
With a 1HR chart open click on Add Alert.
Change Condition to Strat Signal Scanner Part 1, Part or Part 3
Now select signal/setup in drop down box below example: ‘Inside 60’
Click Create
A Warning will appear, click ‘Continue anyway’. An alert is now set.
Wyszukaj w skryptach "the strat"

Strat Signal Scanner (5/15/30/60/D) - Part 1
** PLEASE READ BEFORE USING THIS INDICATOR **
This indicator is strictly for helping people like myself learn 'The Strat' method by Rob Smith. This indicator DOES NOT provide trading advice or trade entry signals!
This scanner is Part 1 only. Please use with Strat Signal Scanner's (5/15/30/60/D) Part 2 and 3 for full function.
A demo video of this indicator is available:
Change indicators label color’s and adjust scanner window as required.
Strat Signal and Setup Scanner (5/15/30/60/D) - Part 1/2/3 version is also available.
Strat Signal and Setup Scanner (5/15/30/60/D) - Part 1, 2 and 3 features:
Strat Signal Scanner - Part 1 - (The Current bar’s condition with Hammer / Shooting Star combos if identified)
Inside Bar
2UP
2DOWN
Outside Bar
Shooting Star (signal will trigger when candle is forming live not after the candle has closed allowing you to prepare)
Hammer (signal will trigger when candle is forming live not after the candle has closed allowing you to prepare)
Shooter-Hammer (signal will trigger when pattern is forming live AND after both the Shooter and Hammer candles have closed giving you the new bar to action)
Hammer-Shooter (signal will trigger when pattern is forming live AND after both the Shooter and Hammer candles have closed giving you the new bar to action)
Strat Signal Setup Scanner - Part 2 - (Previous Bar + Current bar to identify setups)
2U-1
2D-1
3-1
1-2U
1-2D
1-3
3-2U
3-2D
Strat Signal Setup Scanner - Part 3 - (Previous two bars + Current bar to identify setups)
3-1-2U
3-1-2D
2U-1-2U
2D-1-2D
2U-1-2D
2D-1-2U
1-2U-2D
1-2D-2U
How to use the Strat Signal and Setup Scanner?
Open the 3 indicators in order starting with Part 1, Part 2 then Part 3. That way the scanner headings (5/15/30/60/D) will line up with the setups signals.
IMPORTANT: For the scan to work across ALL Timeframe Groups (5/15/30/60/D) successfully you must open a 5min chart on the stock you want to scan.
Once the scan results are displayed with the 5min chart open you can then click on a 15/30/60/D chart to see the setups. But do not pay attention to the new lower timeframe scan results when you have a higher timeframe chart open as they will be incorrect.
For an example: a Successful (5/15/30/60/D) Scan = after you open a 5min chart only. If you open the 15min chart the (15/30/60/D) scan results will be correct but the 5min scan results will be incorrect. If you open the 30min chart the (30/60/D) results will be correct but the 5 and 15 scan results will be incorrect always go back to the 5min chart to correct. This anomaly if due to a historical data issue with pine script.
How to change the Scanner Labels and Text Color’s?
Color’s changed within the Indicator Settings. After you choose your color's on the 'Inputs' page make sure you click the drop down arrow next to 'Defaults' (bottom left of the indicator settings) and then click 'Save As Default' to save your personalised indicator preferences.
How to create an Alert?
With a 1HR chart open click on Add Alert.
Change Condition to Strat Signal Scanner Part 1, Part or Part 3
Now select signal/setup in drop down box below example: ‘Inside 60’
Click Create
A Warning will appear, click ‘Continue anyway’. An alert is now set.

Strat Signal Setup Scanner (60/D/W/M/Q) - Part 3** PLEASE READ BEFORE USING THIS INDICATOR **
This indicator is strictly for helping people like myself learn 'The Strat' method by Rob Smith. This indicator DOES NOT provide trading advice or trade entry signals!
This scanner is Part 3 only. Please use with Strat Signal Scanner's (60/D/W/M/Q) Part 1 and 2 for full function.
A demo video of this indicator is available:
Change indicators label color’s and adjust scanner window as required.
Intraday Strat Signal and Setup Scanner (5/15/30/60/D) - Part 1/2/3 version is also available.
Strat Signal and Setup Scanner (60/D/W/M/Q) - Part 1, 2 and 3 features:
Strat Signal Scanner - Part 1 - (The Current bar’s condition with Hammer/Shooting Star combos if identified)
Inside Bar
2UP
2DOWN
Outside Bar
Shooting Star (signal will trigger when candle is forming live not after the candle has closed allowing you to prepare)
Hammer (signal will trigger when candle is forming live not after the candle has closed allowing you to prepare)
Shooter-Hammer (signal will trigger when pattern is forming live AND after both the Shooter and Hammer candles have closed giving you the new bar to action)
Hammer-Shooter (signal will trigger when pattern is forming live AND after both the Shooter and Hammer candles have closed giving you the new bar to action)
Strat Signal Setup Scanner - Part 2 - (Previous Bar + Current bar to identify setups)
2U-1
2D-1
3-1
1-2U
1-2D
1-3
3-2U
3-2D
Strat Signal Setup Scanner - Part 3 - (Previous two bars + Current bar to identify setups)
3-1-2U
3-1-2D
2U-1-2U
2D-1-2D
2U-1-2D
2D-1-2U
1-2U-2D
1-2D-2U
How to use the Strat Signal and Setup Scanner?
Open the 3 indicators in order starting with Part 1, Part 2 then Part 3. That way the scanner headings (60/D/W/M/Q) will line up with the setups signals.
IMPORTANT: For the scan to work across ALL Timeframe Groups (60/D/W/M/Q) successfully you must open a 1HR (60min) chart on the stock you want to scan.
Once the scan results are displayed with the 1HR chart open you can then click on a Daily, Weekly, Monthly or Quarter chart to see the setups. But do not pay attention to the new lower timeframe scan results when you have a higher timeframe chart open as they will be incorrect.
For an example: a Successful (60/D/W/M/Q) Scan = after you open a 1HR chart only. If you open the Daily chart the (D/W/M/Q) scan results will be correct but the 60 scan results will be incorrect. If you open the Weekly chart the (W/M/Q) results will be correct but the 60 and Daily scan results will be incorrect always go back to the 1HR chart to correct. This anomaly if due to a historical data issue with pine script.
How to change the Scanner Labels and Text Color’s?
Color’s changed within the Indicator Settings. After you choose your color's on the 'Inputs' page make sure you click the drop down arrow next to 'Defaults' (bottom left of the indicator settings) and then click 'Save As Default' to save your personalised indicator preferences.
How to create an Alert?
With a 1HR chart open click on Add Alert.
Change Condition to Strat Signal Scanner Part 1, Part or Part 3
Now select signal/setup in drop down box below example: ‘Inside 60’
Click Create
A Warning will appear now click ‘Continue anyway’. An alert is now set.
Strat Signal Setup Scanner (60/D/W/M/Q) - Part 2** PLEASE READ BEFORE USING THIS INDICATOR **
This indicator is strictly for helping people like myself learn 'The Strat' method by Rob Smith. This indicator DOES NOT provide trading advice or trade entry signals!
This scanner is Part 2 only. Please use with Strat Signal Scanner's (60/D/W/M/Q) Part 1 and 3 for full function.
A demo video of this indicator is available:
Change indicators label color’s and adjust scanner window as required.
Intraday Strat Signal and Setup Scanner (5/15/30/60/D) - Part 1/2/3 version is also available.
Strat Signal and Setup Scanner (60/D/W/M/Q) - Part 1, 2 and 3 features:
Strat Signal Scanner - Part 1 - (The Current bar’s condition with Hammer/Shooting Star combos if identified)
Inside Bar
2UP
2DOWN
Outside Bar
Shooting Star (signal will trigger when candle is forming live not after the candle has closed allowing you to prepare)
Hammer (signal will trigger when candle is forming live not after the candle has closed allowing you to prepare)
Shooter-Hammer (signal will trigger when pattern is forming live AND after both the Shooter and Hammer candles have closed giving you the new bar to action)
Hammer-Shooter (signal will trigger when pattern is forming live AND after both the Shooter and Hammer candles have closed giving you the new bar to action)
Strat Signal Setup Scanner - Part 2 - (Previous Bar + Current bar to identify setups)
2U-1
2D-1
3-1
1-2U
1-2D
1-3
3-2U
3-2D
Strat Signal Setup Scanner - Part 3 - (Previous two bars + Current bar to identify setups)
3-1-2U
3-1-2D
2U-1-2U
2D-1-2D
2U-1-2D
2D-1-2U
1-2U-2D
1-2D-2U
How to use the Strat Signal and Setup Scanner?
Open the 3 indicators in order starting with Part 1, Part 2 then Part 3. That way the scanner headings (60/D/W/M/Q) will line up with the setups signals.
IMPORTANT: For the scan to work across ALL Timeframe Groups (60/D/W/M/Q) successfully you must open a 1HR (60min) chart on the stock you want to scan.
Once the scan results are displayed with the 1HR chart open you can then click on a Daily, Weekly, Monthly or Quarter chart to see the setups. But do not pay attention to the new lower timeframe scan results when you have a higher timeframe chart open as they will be incorrect.
For an example: a Successful (60/D/W/M/Q) Scan = after you open a 1HR chart only. If you open the Daily chart the (D/W/M/Q) scan results will be correct but the 60 scan results will be incorrect. If you open the Weekly chart the (W/M/Q) results will be correct but the 60 and Daily scan results will be incorrect always go back to the 1HR chart to correct. This anomaly if due to a historical data issue with pine script.
How to change the Scanner Labels and Text Color’s?
Color’s changed within the Indicator Settings. After you choose your color's on the 'Inputs' page make sure you click the drop down arrow next to 'Defaults' (bottom left of the indicator settings) and then click 'Save As Default' to save your personalised indicator preferences.
How to create an Alert?
With a 1HR chart open click on Add Alert.
Change Condition to Strat Signal Scanner Part 1, Part or Part 3
Now select signal/setup in drop down box below example: ‘Inside 60’
Click Create
A Warning will appear now click ‘Continue anyway’. An alert is now set.

Strat Signal Scanner (60/D/W/M/Q) - Part 1** PLEASE READ BEFORE USING THIS INDICATOR **
This indicator is strictly for helping people like myself learn 'The Strat' method by Rob Smith. This indicator DOES NOT provide trading advice or trade entry signals!
This scanner is Part 1 only. Please use with Strat Signal Scanner's (60/D/W/M/Q) Part 2 and 3 for full function.
A demo video of this indicator is available:
Change indicators label color’s and adjust scanner window as required.
Intraday Strat Signal and Setup Scanner (5/15/30/60/D) - Part 1/2/3 version is also available.
Strat Signal and Setup Scanner (60/D/W/M/Q) - Part 1, 2 and 3 features:
Strat Signal Scanner - Part 1 - (The Current bar’s condition with Hammer/Shooting Star combos if identified)
Inside Bar
2UP
2DOWN
Outside Bar
Shooting Star (signal will trigger when candle is forming live not after the candle has closed allowing you to prepare)
Hammer (signal will trigger when candle is forming live not after the candle has closed allowing you to prepare)
Shooter-Hammer (signal will trigger when pattern is forming live AND after both the Shooter and Hammer candles have closed giving you the new bar to action)
Hammer-Shooter (signal will trigger when pattern is forming live AND after both the Shooter and Hammer candles have closed giving you the new bar to action)
Strat Signal Setup Scanner - Part 2 - (Previous Bar + Current bar to identify setups)
2U-1
2D-1
3-1
1-2U
1-2D
1-3
3-2U
3-2D
Strat Signal Setup Scanner - Part 3 - (Previous two bars + Current bar to identify setups)
3-1-2U
3-1-2D
2U-1-2U
2D-1-2D
2U-1-2D
2D-1-2U
1-2U-2D
1-2D-2U
How to use the Strat Signal and Setup Scanner?
Open the 3 indicators in order starting with Part 1, Part 2 then Part 3. That way the scanner headings (60/D/W/M/Q) will line up with the setups signals.
IMPORTANT: For the scan to work across ALL Timeframe Groups (60/D/W/M/Q) successfully you must open a 1HR (60min) chart on the stock you want to scan.
Once the scan results are displayed with the 1HR chart open you can then click on a Daily, Weekly, Monthly or Quarter chart to see the setups. But do not pay attention to the new lower timeframe scan results when you have a higher timeframe chart open as they will be incorrect.
For an example: a Successful (60/D/W/M/Q) Scan = after you open a 1HR chart only. If you open the Daily chart the (D/W/M/Q) scan results will be correct but the 60 scan results will be incorrect. If you open the Weekly chart the (W/M/Q) results will be correct but the 60 and Daily scan results will be incorrect always go back to the 1HR chart to correct. This anomaly if due to a historical data issue with pine script.
How to change the Scanner Labels and Text Color’s?
Color’s changed within the Indicator Settings. After you choose your color's on the 'Inputs' page make sure you click the drop down arrow next to 'Defaults' (bottom left of the indicator settings) and then click 'Save As Default' to save your personalised indicator preferences.
How to create an Alert?
With a 1HR chart open click on Add Alert.
Change Condition to Strat Signal Scanner Part 1, Part or Part 3
Now select signal/setup in drop down box below example: ‘Inside 60’
Click Create
A Warning will appear now click ‘Continue anyway’. An alert is now set.

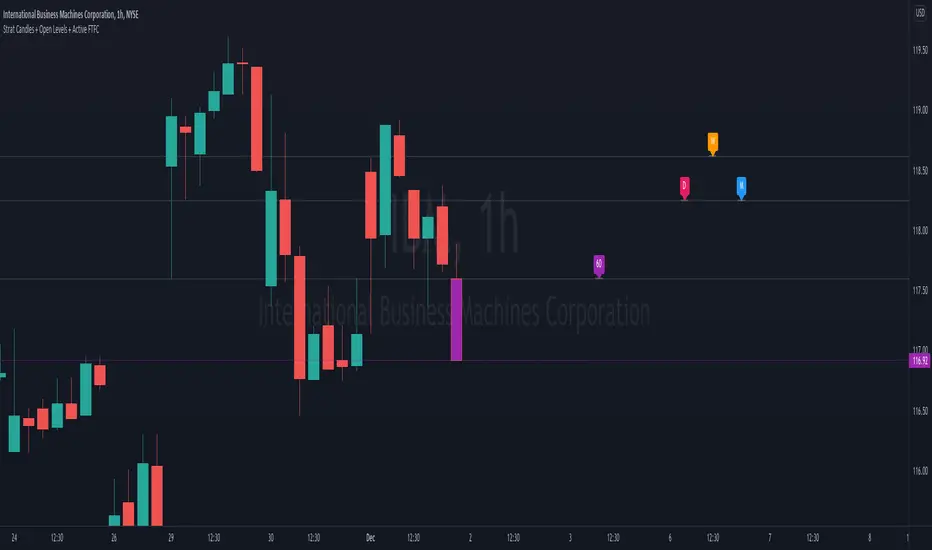
Strat Candles+Open Levels+Active FTFC** YOU MUST READ BEFORE USING THIS INDICATOR **
This indicator is strictly for helping people like myself learn 'The Strat' method by Rob Smith. This indicator DOES NOT provide trading advice or trade entry signals!
Strat Candles+Open Levels+Active FTFC Indicator features :
Strat Candles Scenarios 1, 2 and 3.
Open Price Levels for the 1min/5min/15/30/60/4HR/12HR/D/W/M/Q/Y
Active FTFC (Full Timeframe Continuity) Function.
How to use Active FTFC:
After you have added the indicator to your chart you must open the Indicator Settings. Select your Active FTFC Timeframe Group and Select your Candle Body Color for Bullish FTFC and Bearish FTFC. When FTFC is Active the candle body will change color when all FTFC conditions have been met across your selected Timeframes.
For Active FTFC to work successfully only open the FIRST Timeframe chart listed within your selected group!
If you select other Timeframes within your selected group Active FTFC results will be invalid. Example: If you have ticked and selected 'Active FTFC 60/D/W/M' you must only use the Active FTFC function on a 60min chart. If you then open a Daily chart the Active FTFC will not work correctly go back to the 60min chart.
Please note this function only works on the current live candle not previous historical candles on the chart. Feel free to use Trading View's Replay feature on any chart with the Indicator to see how it works.
How to change Strat Candles, Open Price Level Labels/Price Lines and Active FTFC Candle Color's:
- All color's are customisable within the Indicator Settings. After you choose your color's on the Inputs and Style pages make sure you click the drop down arrow next to 'Defaults' (bottom left of the indicator settings) and then click 'Save As Default' to save your personalised indicator preferences.
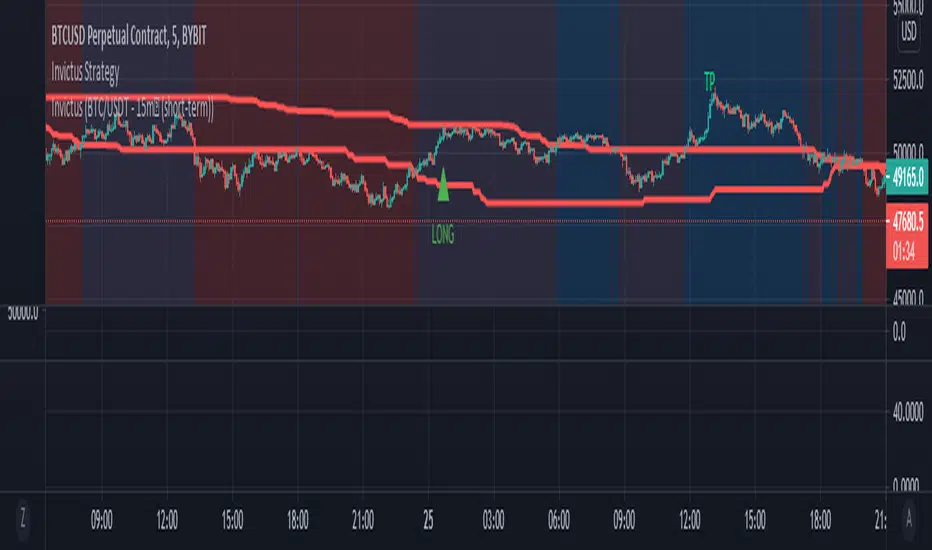
InvictusHello,
I introduce my strategy that provide signals for entering in the market and signal for exit.
This indicator attempts to show a trader when is the best time to open a long or short position. The calculations are partially based on volatility , SMA , EMA and predefined values depending on the time frame you use.
We collect data from comparing the current price, calculating the average move of the market, top, bottom and close of the latest bars. The middle line is an adaptive moving average , which is the base of the signals. The basic idea of this indicator is to show the best place to open a Long or Short position and when to close it.
It is very simple - there are 2 type of signals - LONG (in green) and SHORT (in red). You can close your position when a TP (Take profit) shows up.
You can chose from several options which strategy you want (there is a "Strategy" select in the settings). The strategies that are proving better according to our tests are marked with a diamond.
Please contact me via personal message if you want to test the strategy or for more information.
Thank you.
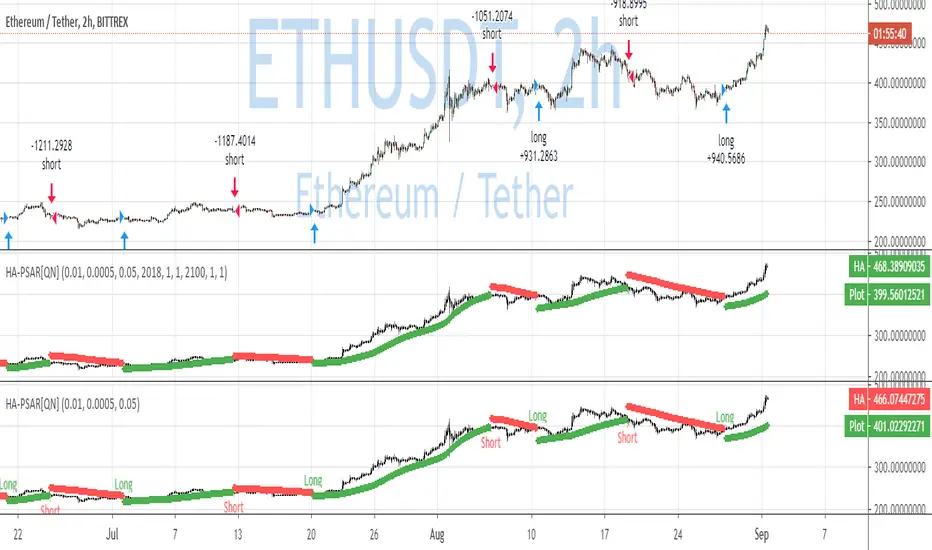
QuantNomad - Heikin-Ashi PSAR AlertsUsing this script you can create alerts for my Heikin-Ashi PSAR Strategy:
When creating alerts use "Once Per Bar Close" in parameters.
####################
Disclaimer
Please remember that past performance may not be indicative of future results.
Due to various factors, including changing market conditions, the strategy may no longer perform as good as in historical backtesting.
This post and the script don’t provide any financial advice.
HFT Divergence Hunter IndicatorDefault Settings are meant to be used in BTC/USDT chart on 5 min time frame on Binance Futures. If you want to use for another asset on another time frame YOU MUST CHANGE THE SETTINGS
This is a divergence finding indicator developed by HFT Research. It is a highly customizable indicator and provides endless opportunities to find profitable trades in the market.
Use Envelope, this is the main decision maker in this strategy. The idea behind is that you choose the length of the moving average and set an offset % to create an upper and lower band. If you click on “display envelope” you will be able to visually see the band you have created. This way, you get to scalp the market as the price is diverging and moving away from the moving average. As the famous saying goes, moving averages act like magnets and prices always visits them back. Using this ideology, we aim to capitilize on the price swings that move away from the chosen moving average by x%.
STARC Bands;
These are two bands that are applied above and below a simple moving average of an asset’s price. The upper band is created by adding the value of the average true range (ATR) or a multiple of i. The lower band is created by subtracting the value of the ATR from the SMA. The channel can provide traders with ideas on when to buy or sell. During an overall uptrend, buying near the lower band and selling near the top band is favorable. However, from our testing results it does fairly poorly in crypto markets while it does pretty well in traditional markets.
Use RSI;
One of the most commonly used indicators in the trading world. The idea is simple, buy when its oversold and sell when its overbought. You can use RSI as a secondary confirmation of the dips. It can be turned on and off.
Use MFI
MFI stands for Money Flow Index and it is an oscillator like RSI. However, it does track the price in a different fashion than RSI providing a reliable option. It uses the price and volume data for identifying overbought and oversold signals in an asset.
Use Fisher Transform
Even though, it has a funny name, Fisher is actually a very decent and reliable indicator. It converts the prices into a Gaussian normal distribution channel. Therefore, the indicator detects when the prices have moved to an extreme, based on recent price action.
Use VWAP
VWAP stands for volume weighted average price. It is an extremely useful indicator when trading intra-day. It does reset every trading session which is at 00:00 UTC. Instead of looking at x number of candles and providing an average price, it will take into consideration the volume that’s traded at a certain price and weigh it accordingly. It will NOT give entry signals but act as a filter. If the price is above VWAP will filter out the shorts and other way around for longs.
Use ADX
Average directional index is a powerful indicator when one is assessing the strength of a trend as well as measuring the volatility in the market. Unfortunately, the worst market condition for this strategy is sideways market. ADX becomes a useful tool since it can detect trend. If the volatility is low and there is no real price movement, ADX will pick that up and will not let you get in trades during a sideways market. It will allow you to enter trades only when the market is trending.
Use Super trend Filter
The indicator works well in a trending market but can give false signals when a market is trading in a range.
It uses the ATR (average true range) as part of its calculation which takes into account the volatility of the market. The ATR is adjusted using the multiplier setting which determines how sensitive the indicator is.
Use MA Filter
Lookback: It is an option to look back x number of candles to validate the price crossing. If the market is choppy and the price keeps crossing up and down the moving average you have chosen, it will generate a lot of “noisy” signals. This option allows you to confirm the cross by selecting how many candles the price needs to stay above or below the moving average. Setting it 0 will turn it off.
MA Filter Type: There is a selection of moving averages that is available on TradingView currently. You can choose from 14 different moving average types to detect the trend as accurate as possible.
Filter Length: You can select the length of your moving average. Most commonly used length being 50,100 and 200.
Filter Type: This is our propriety smoothing method in order to make the moving averages lag less and influence the way they are calculated slightly. Type 1 being the normal calculation and type 2 being the secret sauce.
Reverse MA Filter: This option allows you to use the moving average in reverse. For example, the strategy will go long when the price is above the moving average. However, if you use the reserve MA Filter, you will go short when the price is above the moving average. This method works best in sideways market where price usually retraces back to the moving average. So, in an anticipation of price reverting back to the moving average, it is a useful piece of option to use during sideway markets.
Use MACD Filter
MACD here will act as a filter rather than an entry signal generator. There are a few different ways to use this MACD filter. You can click on the Use MACD filter and it will use filter out the shorts generated in a bullish territory and longs generated in the bearish territory. It will greatly reduce the number of trades the strategy will trade because MACD is a lagging indicator. By the time MACD turns bullish or bearish, most of the other indicators will have already generated the signals. Therefore, resulting in less trades. You can use MACD filter as MA oscillator meaning that it will only look at the MA lines in MACD to filter out trades. Alternatively, you can use it with the histogram (Signal lines) meaning that it will only look at the histogram whether its below or above the zero line in order to filter out the trades.
TP (%)
Place your desired take profit percentage here. Default is 1.5%
Move SL At Entry x% Profit
This is when the strategy will move your SL to the entry point if the position reaches x% profit. It can also generate a signal which can be automated to adjust the SL on the exchange.
SL (%)
Place your desired stop loss percentage here. Default is 1%
If you want to get access to this indicator please DM me or visit our website.

Cyatophilum Levels [ALERTSETUP]Cyatophilum Levels - Version 1.0 - Alert setup
This indicator allows you to build your own strategy based on Fibonacci levels, and create automated alerts for long & short entries and exits.
This study also has a backtest version. See my previous script.
The Fibonacci levels are printed automatically in real time and without repainting on the chart.
You configure your own strategy in the indicator parameters. You can choose to go long or to go short, or both, on which Fib levels to enter Long/Short, and on which Fib levels to exit (up to 2 entry levels and exit levels).
Detailed Guide:
This is a guide that can be useful if you do not understand the strategy or an indicator parameter. Instructions on how to get access are at the bottom.
To configure your strategy, you need to open the indicator settings. You can either right-click on the indicator and click "settings", or click the settings button near the indicator's name.
You should know that the Fibonnaci levels are calculated from the support and resistance levels, which are calculated using the last swing high and swing low. This behavior can be tweaked in the settings with the first 2 parameters:
· Noise reduction
Dropdown menu. Options are "NONE", "SMALL", "MEDIUM", "HUGE". Used to get a smoother level behavior. The higher it is, the less often the support and resistance levels will move. Can be useful to cut off fakeouts.
· Swings lookback
This is the number of historical bars used to calculate the last swing high and swing low.
In TradingView, we usually wait bar close to validate a signal (trade entry or exit), in order to avoid repainting. But since this indicator is purely based on price action, there is an option called Alert Type if you want to receive intra-bar alerts or not.
· Entry Alert Type
2 options : "Once Per Bar Close", "Once Per Bar". These correspond to the alerts options. You must use the same alert type in the indicator settings and in the alert options. When using "Once Per Bar", the candle high and low are used for the cross conditions, otherwise, candle close is used.
· Exit Alert Type
Same but for exit alerts.
The long trades setup can be configured independantly from the short trade setup, but the parameters are the same.
■ Go Long/Short
Check this box to enable/disable long/short trades.
· Long/Short Entry Condition
Dropdown menu from which you can pick the condition for your entry. Options available are "Cross Over","Cross Under" and "Just Cross".
· Long/Short Entry 1
Dropdown menu from which you can pick the level for your entry n°1. Options available are "Support","FIB 23", "FIB 38", "FIB 50","FIB 61","FIB 78" and "Resistance".
· Long/Short Entry 2
Additional FIB level entry.
· Long/Short Exit 1
Dropdown menu from which you can pick the level for your exit. Options available are "Support","FIB 23", "FIB 38", "FIB 50","FIB 61","FIB 78" and "Resistance".
· Long/Short Exit 2
Additional FIB level exit.
■ Trend Filter
Optionnal Tilson T3 TrendLine to make the strategy go long only when price is above T3 (green) and short only when price is below (red). The length in bars is configurable.
· Configuration Panel
It should appear on the left of the chart. This panel displays the whole indicator settings in a compact and easy-to-read way. You can replicate a strategy from just this info panel. Can be turned off if needed.
· Graphic options
A red/green background corresponding to the strategy position (short/long) can be turned off.
The Fib levels labels can be turned off all at once.
Risk management:
Place your secondary exit one or two levels above/below your entry to act as a stop loss.
Availabe alerts:
To create an alert, right-click on the indicator and click "Add alert".
The LONG alerts corresponds to the green labels on chart, while the SHORT are in red.
Select one of the following signals in order to create your strategy:
· LONG/SHORT ENTRY : Alert to enter a long/short. Make sure to select "Once Per Bar" or "Once Per Bar Close" according to the "Entry Alert Type" parameter.
· LONG/SHORT EXIT : Alert to exit a long/short. Make sure to select "Once Per Bar" or "Once Per Bar Close" according to the "Exit Alert Type" parameter.
Default settings are set for 15m.
Use the link below to obtain access to this indicator

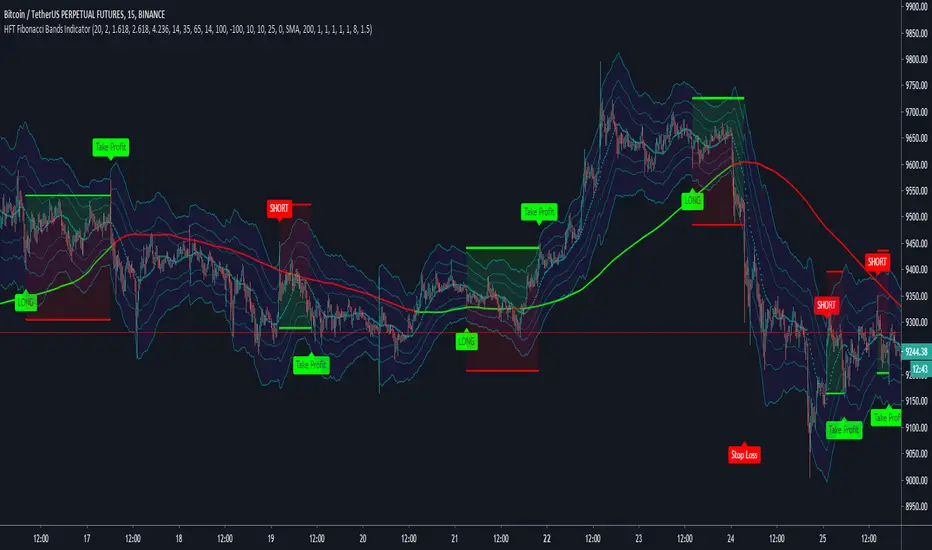
HFT Fibonacci Bands Indicator
Default Settings are meant to be used in XBT/USD chart on 15 min time frame. If you want to use for another asset on another time frame YOU MUST CHANGE THE SETTINGS
This is a Fibonacci bands based trading indicator developed by HFT Research. It is a highly customizable indicator and provided endless opportunities to find profitable trades in the market.
Use Fib BB
This is the main decision maker of the strategy. Tuning the settings of this portion of the strategy will change the outcome the most. We have provided default settings. However, they are only good for 15min chart on Bitcoin. Please adjust accordingly.
Fib BB Length: This setting adjusts the middle line of your Fibonacci Bands. It is the moving average that you take it as base for your Fibonacci bands. Default value is currently 20.
Fib Level to Use for Entry: Here, you adjust which one of the Fibonacci Ratio levels you would like to use for your entry. You can only choose one of the following options.
Fibonacci Ratio 1
This is your Fib ratio level 1 and you can put any number here you would like
Fibonacci Ratio 2
This is your Fib ratio level 2 and you can put any number here you would like
Fibonacci Ratio 3
This is your Fib ratio level 3 and you can put any number here you would like
Please keep in mind that Ratio 1 should be higher than Ratio 2 and Ratio 2 should be higher than Ratio 3.
Use RSI
You can also turn on and off the RSI as well. Alternatively, there is an option to use RSI on a different time frame than you are currently on. For example, if you are looking at the 5min chart to use Bollinger bands but you would like to look at the RSI value on the 15min chart. You can do so by selecting the custom RSI timeframe as well as adjusting the Oversold and Overbought value.
Use CCI
Commodity Channel Index is an indicator developed by Donald Lambert. It is a momentum-based oscillator used to help determine when an investment vehicle is reaching conditions of being overbought or oversold. It also used to asses price trend direction and strength. Default settings are usually the safest and the best fit.
Use VWAP
VWAP stands for volume weighted average price. It is an extremely useful indicator when trading intra-day. It does reset every trading session which is at 00:00 UTC. Instead of looking at x number of candles and providing an average price, it will take into consideration volume that’s traded at a certain price and weigh it accordingly.
Use ADX
ADX stands for average directional index. It is an indicator that measures volatility in the market. Unfortunately, the worst market condition for this strategy is sideways market. ADX becomes a useful tool since it can detect trend. If the volatility is low and there is no real price movement, ADX will pick that up and will not let you get in trades during a sideways market. It will allow you to enter trades only when the market is trending.
Use MA Filters
Lookback: It is an option to look back x number of candles to validate the price crossing. If the market is choppy and the price keeps crossing up and down the moving average you have chosen, it will generate a lot of “noisy” signals. This option allows you to confirm the cross by selecting how many candles the price needs to stay above or below the moving average. Setting it 0 will turn it off.
MA Filter Type: There is a selection of moving averages that is available on TradingView currently. You can choose from 14 different moving average types to detect the trend as accurate as possible.
Filter Length: You can select the length of your moving average. Most commonly used length being 50,100 and 200.
Filter Type: This is our propriety smoothing method in order to make the moving averages lag less and influence the way they are calculated slightly. Type 1 being the normal calculation and type 2 being the secret sauce.
Reverse MA Filter: This option allows you to use the moving average in reverse. For example, the strategy will go long when the price is above the moving average. However, if you use the reserve MA Filter, you will go short when the price is above the moving average. This method works best in sideways market where price usually retraces back to the moving average. So, in an anticipation of price reverting back to the moving average, it is a useful piece of option to use during sideway markets.
If you want to get access to this indicator please DM me or visit our website.
Borsa Akademi Daytrade Hardcore by HassonyaThe Daytrade Hardcore Indicator is a strategy indicator for scalping in a 5-minute time period. Indicator was produced by me by following my way through the daytrade scanning options of my respected teacher ÖZKANFİLİZ(Best Scalper in Turkey). This scan consists of 14 conditions.
We use this scan in a 5-minute time frame. Daytrade Hardcore indicator can show us how many of these conditions in bars are listed and sequentially. You can open which one you want to use.
The Daytrade Hardcore indicator has a 3-day central pivot range. If you want, you can use it to strengthen your buying and selling decision. If the bars can hold on the 3x pivot line, you're safe.
Unless the 3-day central pivot line is shattered, you can move your stocks if you wish.
The strategy also includes DHardcore Trend, Stoploss, First Support, Indicator List, Support/Resistence and S/R Zones, 3dhx central pivot, pivot points, bollinger middle bands,
You should be careful if the 3dhx central pivot breaks down. If you want, you can stop here, you can follow it for new purchase. If you want, you can watch the support point for the new purchase or follow the list and wait for the 3-day pivot to go back when the list supports the 12-13-14 condition.
Sometimes the first support point and stoploss point may change, you can follow it yourself. In this case, you will use the bottom red first support point as a stoploss.
Thanks for your support
Türkçe Açıklama
-------------------
Daytrade Hardcore indikatörü 5 dakikalık periyotta scalping içindir. İndikatör saygıdeğer hocam Türkiye'deki en iyi scalper ÖZKANFİLİZ'in daytrade taraması baz alınarak tarafımdan yaratılmıştır. Bu taramada bildiğiniz üzere 14 tane şart bulunmaktadır. Tarama 17:30 dan kapanışa kadar 5 dakikalık zaman diliminde hisse takipçisinde izlenmektedir.
Taramayı 5 dakikalık zaman diliminde kullanıyoruz. Daytrade Hardcore indikaötür bize barlarda kaç tane şart olduğunu anlık tarayarak ister liste halinde istersek sequential şeklinde gösterebilir. İsterseniz tek tek isterseniz iki seçeneği de kullanabilirsiniz.
Daytrade Hardcore indikatöründe 3 günlük merkezi pivot aralığı bulunmaktadır. Eğer isterseniz, bunu alım satım olarak kullanabilirsiniz. Eğer barlar 3 günlük merkezi pivot çizgisi üzerinde tutunabiliyorsa bu size güvenli olduğunu gösterebilir. Alım için hacim, liste ve RMI'yi kollayabilirsiniz.
3 günlük merkezi pivot noktası kırılmadığı sürece isterseniz hissenizi taşıyabilirsiniz ve mavi çizgi aşağı kırıldığı zaman çıkış yapabilirsiniz.
Bu strateji indikatöründe DHardcore Trend, Stop Noktası, İlk Destek, İndikatör İsim Listesi, Destek/Direnç(Bölgeleri), 3dhx merkezi pivot, pivot noktaları, bollinder orta band içerir.
3 günlük merkezi pivot kırılımına dikkat etmelisiniz. Eğer isterseniz, bunu izleyerek stop olabilirsiniz ve takip ederek yeni alım noktası için izlersiniz. Bunun için isterseniz destek noktası izlersiniz isterseniz mavi çizgi üstünde tutunmasını beklersiniz.Bazı belirtiler nedir? Hacmin ortalama üzerine atması, Liste 12-13-14 olması, fiyatın bollinger orta band üstüne çıkması, fiyatın pivot üzerinde olması.
Bazı zamanlarda ilk destek noktasıyla stoploss noktası değişir. Bunu izleyip kararı kendiniz verebilirsiniz. Kırmızı noktalar mavi çizginin altına indiği zaman orası stoploss noktamız olacaktır.
Destek veren bütün dostlara teşekkür ederim.
Hayrını görün.

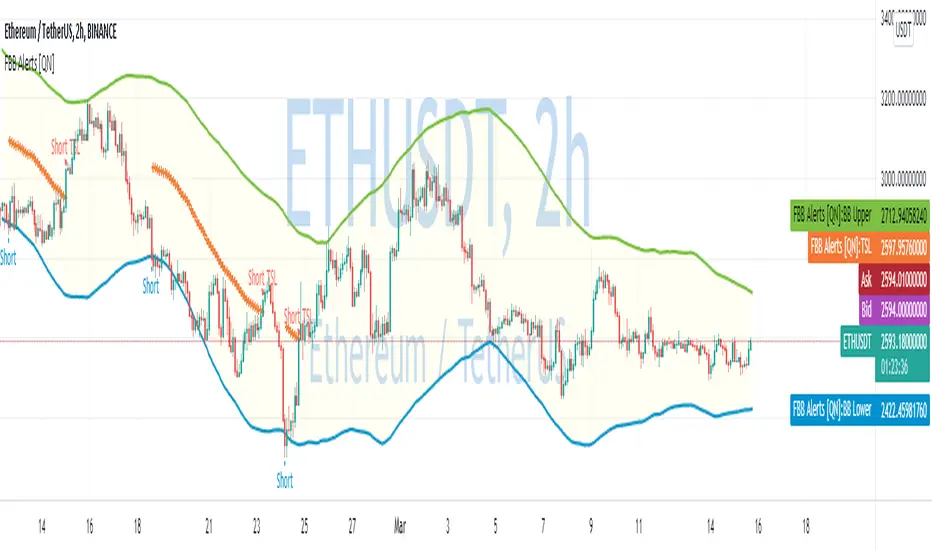
Fibonacci Bollinger Bands Alerts [QuantNomad]These are alerts for my Fibonacci Bollinger Bands Strategy. You can find more details and strategy description in it:
It's a pro indicator, you can have access to it for a small fee. Link to my PRO indicators you can find in my signature.
Disclaimer
Please remember that past performance may not be indicative of future results.
Due to various factors, including changing market conditions, the strategy may no longer perform as good as in historical backtesting.
This post and the script don’t provide any financial advice.
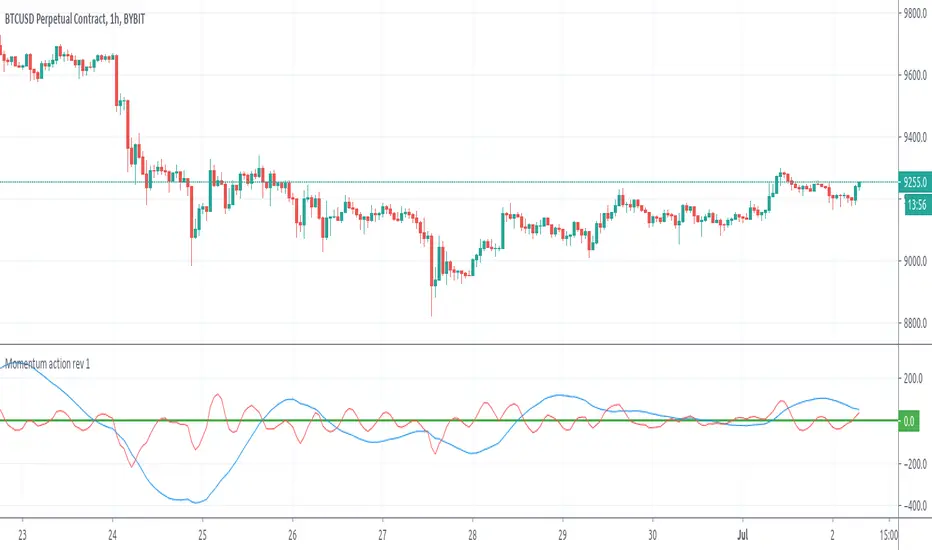
Momentum action rev 1Hello , thank you for checking my strategy .
This is the second indicator Momentum Action ( MA ) from my Strategy . To be useful need to be used with Price Action .
This strategy is suitable for short term trading on Crypto currency and " scalping " if this can be considered scalping when looking for 30-50-70 on Bitcoin for example. It Is good for Forex as well
Here we use two indicators called Price Action ( PA ) and Momentum Action ( MA ) . Both Indicators are available for use after personal request , i can allow trial test for 15 days period. For more details please write me PM.
Simple rules once the price drop bellow the PA indicator we have first Evidence for signal. Confirmation of the signal is coming when the Red Line from MA indicator also drop under 0 Level. ( is good 0 level to be bolt line for better and easier look ) . In Such case we have signal for Sale . The Sale / Buy Signal appear once bar is closed . If you monitoring Chart on 3H, 4H or Daily chart if you wait until full closing of the bar might be a bit late.
In this case i can suggest moving on lower time frame for finding better enter with lower stop loss.
The PA indicator have included in the code already MA indicator , but is good to have it visually attached on the chart.
The MA indicator has 2 lines .Red line is faster and more aggressive , the Blue line is slower . But Once the Red Line and the Blue line are in same direction the Price move is more powerful, the trend is accelerating. When the Blue line is bellow 0 Level and red line also drop bellow we expect stronger and longer trend
For Example signals :
When opposite way the price move across the PA indicator and goes up. In same time the Red line of MA goes from bellow to over 0 level we have confirmation for buy .
As shown on the picture.
All instruments Like Crypto / Forex / Future / commodity have different time zone activity and during some " Late Hours " or hours with slower activities the Indicators can provide falls signals.
Current setup of the Indicator PA is set to wait up 2 bars after Price drop under the indicator line and if within 2 bars we have drop over the 0 level in the MA indicator then signal appear.
This way we will try to reduce false signals.
To Avoid false signal i strongly recommend Visual Filtering as well. I mean when checking the chart and you can see that RED Line PA of is dropping bellow Zero level ,but the price is still Did not drop over the PA indicator .IF the current time is with low activity several bars can be made with small range and then drop appear, the signal will not appear as will be again the rule for 2 bars tolerance between both indicators.
in Such case to not miss any trade can check on lower time frame.
For Example here on 4H the MA red line dropped bellow 0 Level , the price still does not drop under the PA indicator line and we dont have signal for enter.
In same time we have short signal at 30 M frame
When i mention Visual filtering as well is needed i mean following. In case you have Signal on lower time frames as M5 / M15 / M30 is good to see the PA indicator line on higher Time Frame as 3H,4H or Daily as this line will serve as support or resistance and very probably small correction to hit is possible . So the signal M5 / M15 could be quick and after 2-3-4 bars you would need to close or move Stop loss on 0.
As advice for Stop Loss can be the bottom or top of the previous bar or use any other convenient and safe for you .
PA indicator allow setting alerts so you can conveniently set Alerts BUY/Sale on your favourite frames for favourite instruments and this way you can be sure not to miss good opportunity for enter .
One more hint. PA Indicators sometimes show divergences as well so will be more strong signal if you see signal and the PA line is curved same way as the signal not still straight .
as shown here :
.
I will be glad to allow trial period 15 days for testing the strategy. If you have any questions please send me message here.
Thank you for checking
Money Maker for Crypto and Forex MarketHello , thank you for checking my strategy .
This strategy is suitable for short term trading on Crypto currency and " scalping " if this can be considered scalping when looking for 30-50-70 on Bitcoin for example. It Is good for Forex as well
Here we use two indicators called Price Action ( PA ) and Momentum Action ( MA ) . Both Indicators are available for use after personal request , i can allow trial test for 15 days period. For more details please write me PM.
Simple rules once the price drop bellow the PA indicator we have first Evidence for signal. Confirmation of the signal is coming when the Red Line from MA indicator also drop under 0 Level. ( is good 0 level to be bolt line for better and easier look ) . In Such case we have signal for Sale . The Sale / Buy Signal appear once bar is closed . If you monitoring Chart on 3H, 4H or Daily chart if you wait until full closing of the bar might be a bit late.
In this case i can suggest moving on lower time frame for finding better enter with lower stop loss.
The PA indicator have included in the code already MA indicator , but is good to have it visually attached on the chart.
The MA indicator has 2 lines .Red line is faster and more aggressive , the Blue line is slower . But Once the Red Line and the Blue line are in same direction the Price move is more powerful, the trend is accelerating. When the Blue line is bellow 0 Level and red line also drop bellow we expect stronger and longer trend
For Example signals :
When opposite way the price move across the PA indicator and goes up. In same time the Red line of MA goes from bellow to over 0 level we have confirmation for buy .
As shown on the picture.
All instruments Like Crypto / Forex / Future / commodity have different time zone activity and during some " Late Hours " or hours with slower activities the Indicators can provide falls signals.
Current setup of the Indicator PA is set to wait up 2 bars after Price drop under the indicator line and if within 2 bars we have drop over the 0 level in the MA indicator then signal appear.
This way we will try to reduce false signals.
To Avoid false signal i strongly recommend Visual Filtering as well. I mean when checking the chart and you can see that RED Line PA of is dropping bellow Zero level ,but the price is still Did not drop over the PA indicator .IF the current time is with low activity several bars can be made with small range and then drop appear, the signal will not appear as will be again the rule for 2 bars tolerance between both indicators.
in Such case to not miss any trade can check on lower time frame.
For Example here on 4H the MA red line dropped bellow 0 Level , the price still does not drop under the PA indicator line and we dont have signal for enter.
In same time we have short signal at 30 M frame
When i mention Visual filtering as well is needed i mean following. In case you have Signal on lower time frames as M5 / M15 / M30 is good to see the PA indicator line on higher Time Frame as 3H,4H or Daily as this line will serve as support or resistance and very probably small correction to hit is possible . So the signal M5 / M15 could be quick and after 2-3-4 bars you would need to close or move Stop loss on 0.
As advice for Stop Loss can be the bottom or top of the previous bar or use any other convenient and safe for you .
PA indicator allow setting alerts so you can conveniently set Alerts BUY/Sale on your favourite frames for favourite instruments and this way you can be sure not to miss good opportunity for enter .
One more hint. PA Indicators sometimes show divergences as well so will be more strong signal if you see signal and the PA line is curved same way as the signal not still straight .
as shown here :
.
I will be glad to allow trial period 15 days for testing the strategy. If you have any questions please send me message here.
Thank you for checking

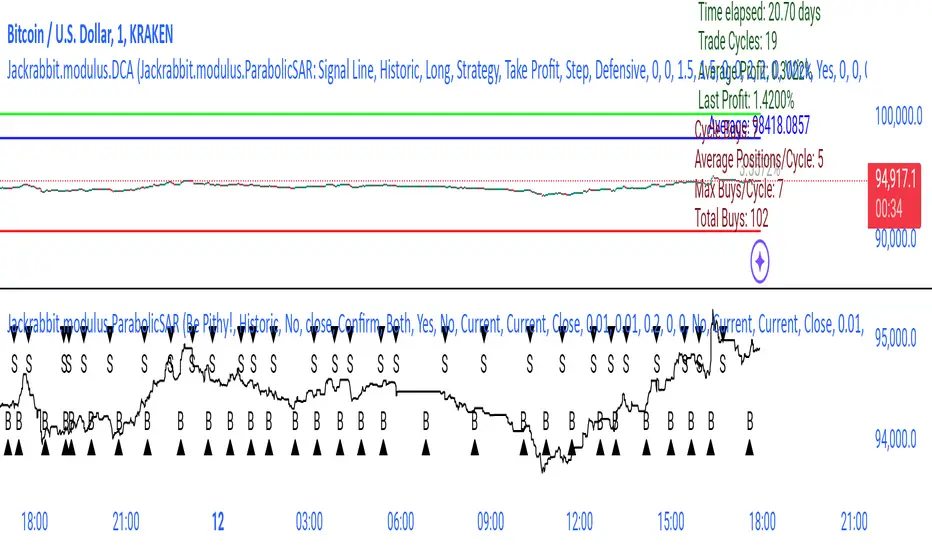
Jackrabbit.modulus.DCAThis is the Dollar Cost Averaging (DCA) for the Jackrabbit suite and modulus framework.
The blue line is the current average price of the asset.
The red line is the deviation boundary. Price action must be below this line for buys to be signaled.
The green line is the take profit. Price action must be above this line for a sell signal to be generated.
Here is a list of the settings:
Buy method: DCA or Strategy. DCA allows the module to decide buys based upon the methodology (step, price). Strategy added to the average on the basis of a buy signal from the strategy, but only when it is below the deviation and is the most organic of dollar cost averaging.
Sell Method. Take profit or Steategy. Take Profit sells the asset as soon as the price action crosses above the take profit line. Strategy sells on the basis of a sell signal, but only if it is above the take profit. Selling never occurs at a loss, with the only exception being the exit point.
Methodolgy: Step or Price. Stepping allows a fixed and uniform averaging ant percise intervals of deviation. Price is a very aggressive approach that will drive the average down on the basis of the difference between the average and the current price action. The price methodology is VERY high risk.
Take Profit, which describes the average profit percent of the combined positions.
Deviation, which describes the percent boundary for which price action must drop before additional assets are purchased.
Sideways Breaker: This algorithm breaks the sideways rut by forcing a purchase after X days, minimum 1 day.
Exit Position: Internal stop loss expressed in the number of buys.
It is important that when you establish your sell signal, ALL positions must be sold to ensure the average profit. If required, use a CLOSE ALL message provided by your platform. Also, any platform specific DCA or Safety Orders will cause losses as this script can not track their value. It is recommended that these features not be used.
The Jackrabbit modulus framework is a plug in play paradigm built to operate through TradingView's indicator on indicatior (IoI) functionality. As such, this script receives a signal line from the previous script in the IoI chain, and evaluates the buy/sell signals appropriate to the current analysis.
This script is by invitation only. To learn more about accessing this script, please see my signature or send me a PM. Thank you.
BCeyhan Hull Strategy System by HassonyaHere is the 1 Hour Hull Moving Average Strategy System
1 hour strategy for Day Traders or Swing Traders.
Our purpose in this system, we have a channel belonging to hullma50 - Channel Top and Channel Bottom.
The indicator warns us when the price rises above hullma14 with green arrow.
Then it tells us to be ready when she collides with the lower band.
When hullma14 breaks hullma50 up, we make our first part purchase.
Then hullma14 breaks hullma100 up, we make our second part purchase.
The system warns you with a red arrow when the price drops below the hull moving average of hullma14. If you want, you can sell there.
Then, when the upper band is broken, it warns with caution with the C label.
And finally, when we break down hullma14, hullma 50, we sell parts and we completely exit hullma14, hullma100 down the position we have.
Our strategy is when Hullma50 is below hullma100. If hullma100 is below hullma50, we will buy the first piece when hullma14 breaks hullma100 up. When hullma14 breaks hullma50 up, we will buy a second piece. That's it
Here is the Resistance/Support Breakouts Alerts with green and red arrows
C label is Careful R label is Ready.
and last one, the candle bars were adjusted on a volume based colored bars.
You can find the necessary explanation about the use of bars here.
You can use it in different indicators to support the strategy. (Rsi , Macd , Stochastic ...)
Thanks

EMA Strategy - Study with AlertsMore adaptable version of the EMA switch strategy. This strategy uses 3 different moving averages to detect trend which are all easy to change in settings to refine the strategy for different graphs. This strategy works well with BTC on the 1hr but also does well on other crypto and stocks. Calls longs and shorts as well as exits in both directions however exits are turned off by default as they will trigger every candle when the condition is met (calls exit long every tick when the trend is heading down).

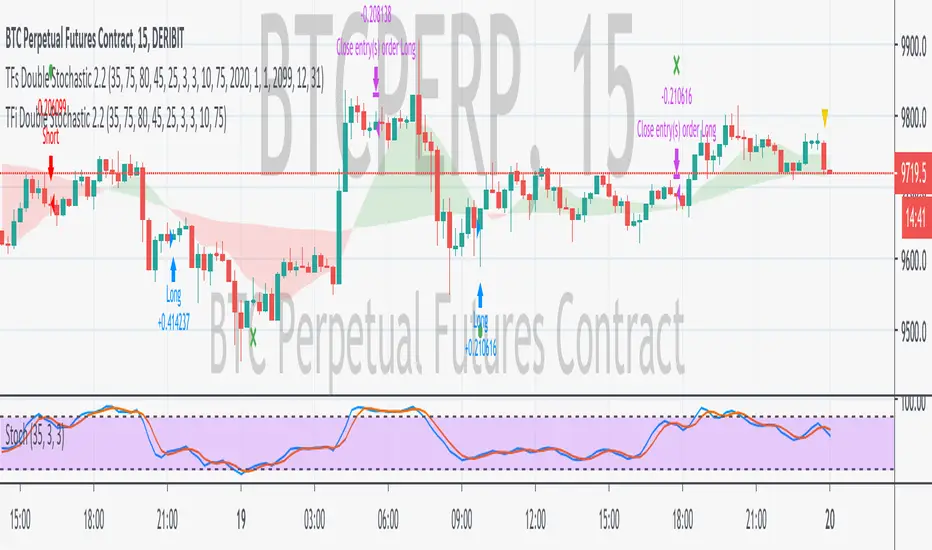
TFi Double Stochastic StudyThe Study script uses Stochastic indicators for entry and exit a position.
The entry and exit points are visualized in the chart via green arrows and crosses; the position follows the exact behavior of the strategy script.
The study also creates alerts, which follow the exact position of the entry/exit markers.
How to use
The Study works with most timeframes and instruments.
I'm also providing a "strategy" version of this Study, which can be used to backtest the strategy.
List of parameters
"Stochastic Length" ... Number of bars for Stochastic indicators
"Stochastic Overbought" ... Stochastic overbought level
"Stochastic Overbought Down Trend" ... Stochastic overbought level for down trends
"Stochastic Oversold Up Trend" ... Stochastic oversold level for up trends
"Stochastic Oversold" ... Stochastic oversold level
"Stochastic Smooth K" ... Stochastic K smoothing
"Stochastic Smooth D" ... Stochastic D smoothing
"Stochastic Confirmed" ... Enable to confirm the indicator value within the current bar
"MA Filter Enabled" ... Enable an additional filter for entering a position; the entries only follow the overall trend
"MA Fast Period" ... Fast filter period
"MA Slow Period" ... Slow filter period
List of alerts
Entry Long' ... Enter long position
'Entry Short' ... Enter short position
'Exit Long/Short' ... Exit long/short position
How to access
This Study is a "Invite Only" script. Please use the link below or send me a message via Tradingview to obtain access to the strategy and study script.
For enabling the script in your Tradingview chart window, click on "Indicators" and select "Invite-Only Scripts".
Strat-test ALERTSAlerts script, accompanying the "Strategy Tester EMA-SMA-RSI-MACD" script,
when you find a good strategy, you can use the same settings in this Alert script and
you'll have your alerts
Have fun!

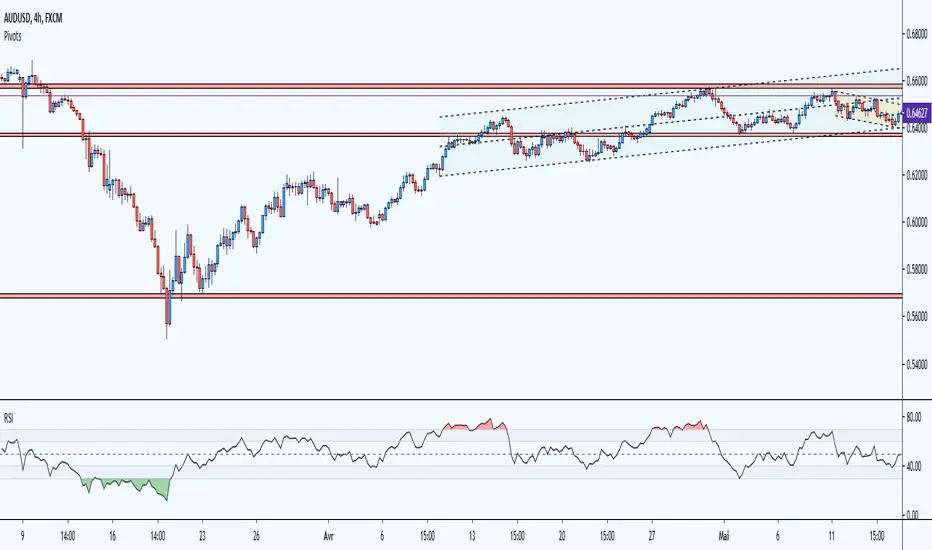
RSI Multicolor editableEN:
RSI with overbought and oversold area in color and editable level. visually more interesting than the basic version the overbought and oversold areas catch the eye quickly. Depending on the strategies and your personal use of the RSI, you can modify all the lines and add colors to each defined zone.
overbought zone, oversold and editable noise zone
I wanted to have a modifiable RSI like some trading platforms.
please excuse me for my english and my code, i'm just getting started.
FR:
RSI avec zone de surachat et survente en couleur et niveau éditable. visuellement plus intéressant que la version basique les zones de surachat et survente attirent l’œil rapidement. Selon les stratégies et l'utilisation personnel que vous faite du RSI, vous pouvez modifier toutes les lignes et ajouter des couleurs à chaque zone défini.
zone de surachat, survente et zone de bruit éditable
je souhaitais avoir un RSI modifiable comme certaines plateforme de trading.
veuillez m'excuser pour mon anglais et mon code, je débute.
PROFIT + ALERTS V2This is an Alert indicator for PROFIT + strategy.
Use it with the strategy to create and receive notifications when the strategy generates buy / sell signals.
To get access to the indicator and its strategy pm me.
------------------------------------------------------
Это алерт индикатор для стратегии PROFIT +
для получения уведомлений когда стратегия генерирует buy / sell сигналы.
Для получения доступа к индикатору и стратегии пишите в личные сообщения.

Stochastic Pop and Drop Signals [Bitduke]It's a long/short signals for modified Stochastic Pop and Drop strategy.
About
It's the strategy of 2 indicators: Stochastic Oscillator to define the bias and Average Directional Index to confirm it.
Signals
Strategy flips long / short depending of indicator signals. There can be multiple signals of the same type, for example, 2 longs in a row, only the first of them matters, others you should handle in your websocket script or manually.
Testing
Tested on different sources for data, oscillator periods and different levels in relation to the crypto market.
So, it shows good results with two tight thresholds at 55 and 45 level.
The bar chart below the defining the bullish and bearish periods (green and red) and gives a signal to enter the trade (purple bars).
Backtesting
Backtested on XBTUSD , BTCPERP ( FTX ) pairs. You may notice it shows good results on 3h timeframe.
Relatively low drawdown
~ 10% (from 2019 to date) FTX
~ 22% (4 years from 2016) Bitmex
Bitmex 3h (2017 - 2020) :
i.imgur.com
FTX 3h (2019 - 2020):
i.imgur.com
Possible Improvements
- Regarding trading algorithm it would be good to check with strategy with ADX somehow. Maybe for the better entries
- As for Risk Management system, it can be improved by adding trailing stop to the strategy.
Link: school.stockcharts.com
