ORB with 100 EMAORB Trading Strategy for FX Pairs on the 30-Minute Time Frame
Overview
This Opening Range Breakout (ORB) strategy is designed for trading FX pairs on the 30-minute time frame. The strategy is structured to take advantage of price momentum while aligning trades with the overall trend using the 100-period Exponential Moving Average (100EMA). The primary objective is to enter trades when price breaks and closes above or below the Opening Range (OR), with additional confirmation from a retest of the OR level if the initial entry is missed.
Strategy Rules
1. Defining the Opening Range (OR)
- The OR is determined by the high and low of the first 30-minute candle after market open.
- This range acts as the key level for breakout trading.
2. Trend Confirmation Using the 100EMA
- The 100EMA serves as a filter to determine trade direction:
- Buy Setup: Only take buy trades when the OR is above the 100EMA.
- Sell Setup: Only take sell trades when the OR is below the 100EMA.
3. Entry Criteria
- Buy Trade: Enter a long position when a candle breaks and closes above the OR high, confirming the breakout.
- Sell Trade: Enter a short position when a candle breaks and closes below the OR low, confirming the breakout.
- Retest Entry: If the initial entry is missed, wait for a price retest of the OR level for a secondary entry opportunity.
4. Risk-to-Reward Ratio (R2R)
- The goal is to target a 1:1 Risk-to-Reward (R2R) ratio.
- Stop-loss placement:
- Buy Trade: Place stop-loss just below the OR low.
- Sell Trade: Place stop-loss just above the OR high.
- Take profit at a distance equal to the stop-loss for a 1:1 R2R.
5. Risk Management
- Risk per trade should be based on personal risk tolerance.
- Adjust lot sizes accordingly to maintain a controlled risk percentage of account balance.
- Avoid over-leveraging, and consider moving stop-loss to breakeven if the price moves favourably.
Additional Considerations
- Avoid trading during major news events that may cause high volatility and unpredictable price movements.
- Monitor market conditions to ensure breakout confirmation with strong momentum rather than false breakouts.
- Use additional confluences such as candlestick patterns, support/resistance zones, or volume analysis for stronger trade validation.
This ORB strategy is designed to provide structured trade opportunities by combining breakout momentum with trend confirmation via the 100EMA. The strategy is straightforward, allowing traders to capitalise on clear breakout movements while implementing effective risk management practices. While the 1:1 R2R target provides a balanced approach, traders should always adapt their risk tolerance and market conditions to optimise trade performance.
By following these rules and maintaining discipline, traders can use this strategy effectively across various FX pairs on the 30-minute time frame.
Wyszukaj w skryptach "the strat"
SatoshiSteps Swing StrategyCore Components:
The indicator combines three popular technical analysis tools:
Ichimoku Cloud: This helps identify the trend, support, and resistance levels.
RSI (Relative Strength Index): This momentum oscillator identifies overbought and oversold conditions.
MACD (Moving Average Convergence Divergence): This trend-following momentum indicator shows the relationship between two moving averages1 of prices.
Logic:
The strategy aims to identify potential swing trading opportunities by combining signals from these three components. It essentially looks for:
Trend Confirmation (Ichimoku):
Price should be above the Ichimoku cloud for buy signals.
Price should be below the Ichimoku cloud for sell signals.
The Tenkan-sen (conversion line) should cross above the Kijun-sen (base line) for buy signals.
The Tenkan-sen should cross below the Kijun-sen for sell signals.
Overbought/Oversold Conditions (RSI):
RSI should be below the overbought level for buy signals (avoiding buying when the market is potentially overextended).
RSI should be above the oversold level for sell signals (avoiding selling when the market is potentially oversold).
Momentum Confirmation (MACD):
The MACD line should be above the signal line for buy signals (indicating upward momentum).
The MACD line should be below the signal line for sell signals (indicating downward momentum).
Buy Signal:
A buy signal is generated when all the following conditions are met:
The Tenkan-sen crosses above the Kijun-sen.
The price is above both the Senkou Span A and Senkou Span B (the cloud).
The RSI is below the overbought level.
The MACD line is above the signal line.
Sell Signal:
A sell signal is generated when all the following conditions are met:
The Tenkan-sen crosses below the Kijun-sen.
The price is below both the Senkou Span A and Senkou Span B (the cloud).
The RSI is above the oversold level.
The MACD line is below the signal line.
Key Considerations:
Time Frame: The indicator has built-in adjustments for 1-hour and 4-hour timeframes, optimizing the parameters for each.
Customization: You can customize the overbought/oversold RSI levels and the styles of the buy/sell signals (triangle, label, arrow, circle) through the indicator's settings.
Accuracy: While the strategy combines multiple indicators to improve accuracy, remember that no trading indicator is perfect. Market conditions can change rapidly, and false signals can occur.
Risk Management: Always use proper risk management techniques, such as stop-loss orders, and never risk more than you can afford to lose.

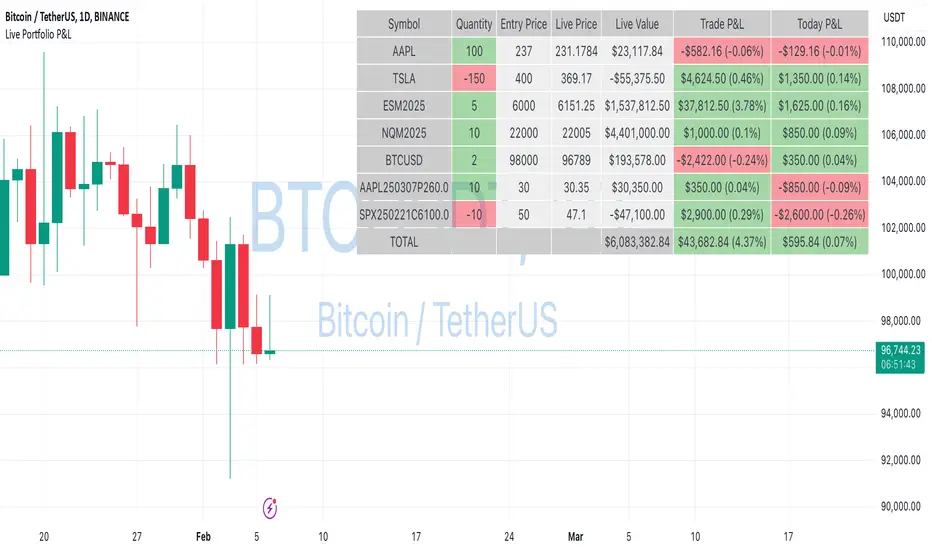
Live Portfolio P<his script calculates live P&L (Profit & Loss) for up to 40 instruments — stocks, ETFs, options, futures, and Forex pairs supported by TradingView. Instead of juggling numerous inputs, you paste your portfolio in CSV format into a single text field, and the script handles the rest. It parses each position and displays a comprehensive table showing the symbol, current price, position value, total P&L, and today’s P&L—all updated in real time.
Key Features
CSV Portfolio Input – Effortlessly import all your positions at once without filling in multiple fields. You can export the position from your broker, save it in the required format, and paste it into this script.
Supports Various Asset Classes – Works with any instrument that TradingView provides data for, including futures, options, and Forex.
Up to 40 Instruments – Track a broad and diverse set of holdings in one place.
Real-Time Updates – Get immediate feedback on live price changes, total value, and current P&L.
Today’s P&L – Monitor your daily performance to gauge short-term trends.
CSV is consumed in the following format:
Symbol (supported TradingView instruments)
Entry Price
Quantity (negative for short position)
Lot Size (for futures/options, it might not be one)
For example:
AAPL,237,100,1
TSLA,400,-150,1
ESM2025,6000,5,50
Planned Enhancements
Multi-Currency Support – Automatically convert and display your positions’ values in different currencies.
Advanced Metrics – Get deeper insights with calculations for drawdown, Sharpe ratio, and more.
Risk Management Tools – Set stop-loss and take-profit levels and receive alerts when thresholds are hit.
Option Greeks & Margin Calculations – Manage complex option strategies and track margin requirements.
Questions for You
What additional features would you like to see?
Are there any specific metrics or analytics you’d find especially valuable?
How might this script fit into your current trading workflow?
Feel free to share your thoughts and suggestions. Your feedback will help shape future updates and make this tool even more helpful for traders like you!
Disclaimer
Please remember that past performance may not be indicative of future results.
Due to various factors, including changing market conditions, the strategy may no longer perform as well as in historical backtesting.
This post and the script don’t provide any financial advice.
Multi Stochastic AlertHello Everyone,
I have created a Multi Stochastic Alert based on Scalping Strategy
The Strategy uses below 4 Stochastic indicator:
1. Stochastic (9,3)
2. Stochastic (14,3)
3. Stochastic (40,4)
4. Stochastic (60,10)
Trade entry become active when all of these goes below 20 or above 80, In this indicator you don't need to use all 4, this will show red and green background whenever all of them goes below 20 or above 80.
As shown in picture below, it works better when script is making a channel, Our indicator shows green or red signal, we wait for RSI Divergence and we enter. We book when blue line (9,3) goes above 80, as shown by arrow, and trail rest at breakeven or your own trailing method
Same Situation shown for Short side. We book 50% when Blue line (9,3) Goes below 20 and trail rest at breakeven or your own trailing method
Happy trading, Let me know if any improvements required.

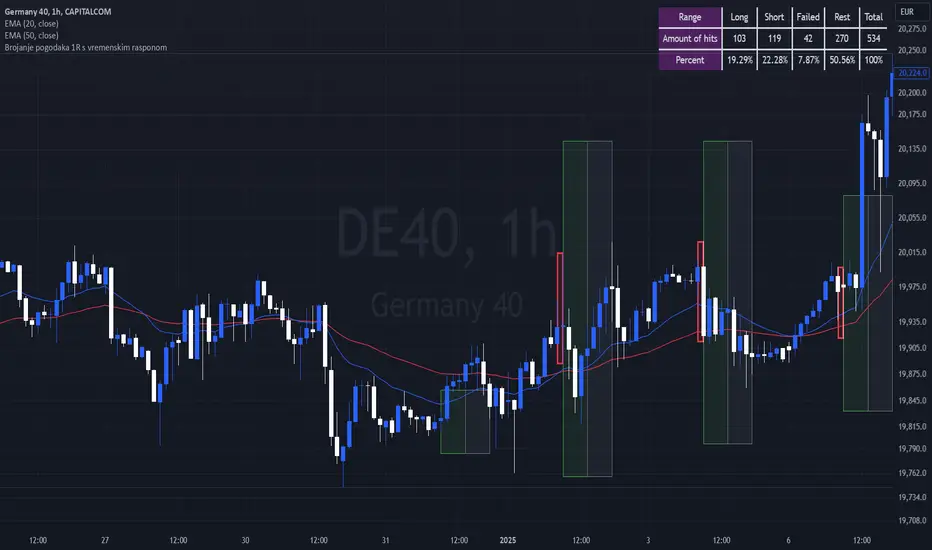
Breakout Josip strategy is focused on analyzing price movements during specific time intervals (from 9:00 AM to 12:00 PM) each day. It tracks the highest and lowest prices in that period and uses them to set targets for potential trades, placing horizontal lines based on these levels. Additionally, you're interested in tracking the success and failure of trades based on whether price breaks certain levels during this time range. The strategy also calculates various metrics like the percentage of successful trades, failed trades, and total trades during a selected time range.
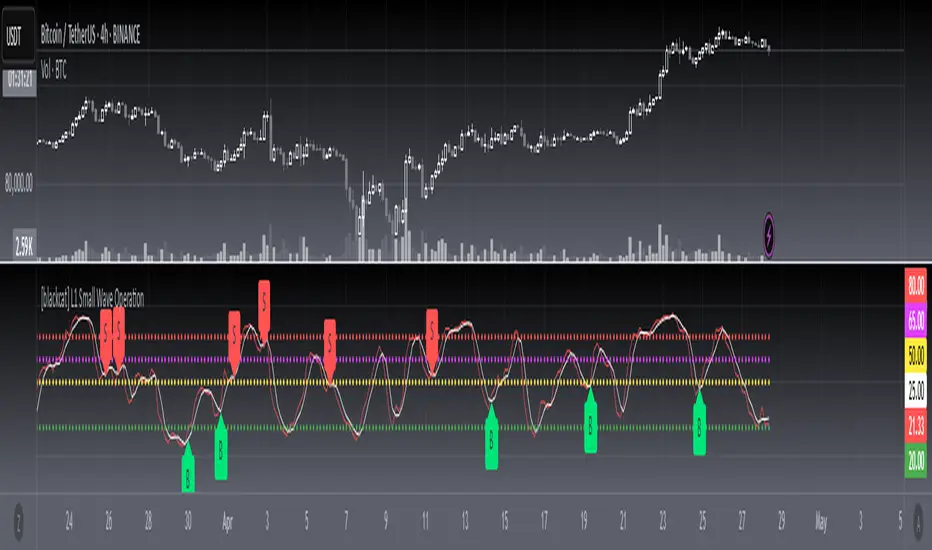
[blackcat] L1 Small Wave Operation L1 Small Wave Operation
Overview
Are you looking to catch those elusive small waves in the market? Look no further than " L1 Small Wave Operation." This script offers a unique way to identify potential buying opportunities by analyzing price movements, volume changes, and trend directions. With customizable inputs and clear visual indicators, it’s designed to help traders spot favorable entry points with precision.
Features
Dynamic Signal Identification: Automatically detects two types of buy signals labeled "S" and "B."
Adaptable Parameters: Allows users to adjust low period, high period, EMA periods, SMA period, and various threshold values to fine-tune the strategy.
Visual Clarity: Plots K and D lines along with four distinct threshold levels for easy visualization.
Condition-Based Signals: Uses multiple conditions including volume increases, price actions, and crossover events to confirm signals.
How It Works
Calculate Percent Range: Determines where the current closing price lies within the recent low and high range.
Compute Moving Averages: Calculates Exponential Moving Average (EMA) and Simple Moving Average (SMA) of the percent range.
Define Conditions: Checks for bullish or strong bullish patterns, uptrends, and specific crossover events between K and D lines.
Generate Signals: Marks potential buying opportunities when predetermined conditions are met.
How To Use
Add this script to your TradingView chart.
Adjust the input parameters according to your preferred settings.
Monitor the plotted lines and look for "S" and "B" labels indicating buy signals.
Consider incorporating these signals into a broader trading strategy that includes risk management techniques.
What Makes It Special
Flexibility: Users can easily modify parameters to adapt the script to different markets or personal preferences.
Automation: Saves time by automatically scanning for trade setups based on predefined rules.
Comprehensive Analysis: Combines multiple factors like volume, price action, and moving averages to provide reliable signals.
Limitations
Past performance does not guarantee future results.
Market conditions can vary, affecting signal reliability.
Not suitable for very short-term trades without additional refinements.
Notes
Always perform backtesting on historical data before implementing live trades.
Understand the underlying logic of the script to avoid misinterpretation of signals.
Regularly review and adjust parameters based on changing market dynamics.
SCE Price Action SuiteThis is an indicator designed to use past market data to mark key price action levels as well as provide a different kind of insight. There are 8 different features in the script that users can turn on and off. This description will go in depth on all 8 with chart examples.
#1 Absorption Zones
I defined Absorption Zones as follows.
//----------------------------------------------
//---------------Absorption---------------------
//----------------------------------------------
box absorptionBox = na
absorptionBar = ta.highest(bodySize, absorptionLkb)
bsab = ta.barssince(bool(ta.change(absorptionBar)))
if bsab == 0 and upBar and showAbsorption
absorptionBox := box.new(left = bar_index - 1, top = close, right = bar_index + az_strcuture, bottom = open, border_color = color.rgb(0, 80, 75), border_width = boxLineSize, bgcolor = color.rgb(0, 80, 75))
absorptionBox
else if bsab == 0 and downBar and showAbsorption
absorptionBox := box.new(left = bar_index - 1, top = close, right = bar_index + az_strcuture, bottom = open, border_color = color.rgb(105, 15, 15), border_width = boxLineSize, bgcolor = color.rgb(105, 15, 15))
absorptionBox
What this means is that absorption bars are defined as the bars with the largest bodies over a selected lookback period. Those large bodies represent areas where price may react. I was inspired by the concept of a Fair Value Gap for this concept. In that body price may enter to be a point of support or resistance, market participants get “absorbed” in the area so price can continue in whichever direction.
#2 Candle Wick Theory/Strategy
I defined Candle Wick Theory/Strategy as follows.
//----------------------------------------------
//---------------Candle Wick--------------------
//----------------------------------------------
highWick = upBar ? high - close : downBar ? high - open : na
lowWick = upBar ? open - low : downBar ? close - low : na
upWick = upBar ? close + highWick : downBar ? open + highWick : na
downWick = upBar ? open - lowWick : downBar ? close - lowWick : na
downDelivery = upBar and downBar and high > upWick and highWick > lowWick and totalSize > totalSize and barstate.isconfirmed and session.ismarket
upDelivery = downBar and upBar and low < downWick and highWick < lowWick and totalSize > totalSize and barstate.isconfirmed and session.ismarket
line lG = na
line lE = na
line lR = na
bodyMidpoint = math.abs(body) / 2
upWickMidpoint = math.abs(upWickSize) / 2
downWickkMidpoint = math.abs(downWickSize) / 2
if upDelivery and showCdTheory
cpE = chart.point.new(time, bar_index - 1, downWickkMidpoint)
cpE2 = chart.point.new(time, bar_index + bl, downWickkMidpoint)
cpG = chart.point.new(time, bar_index + bl, downWickkMidpoint * (1 + tp))
cpR = chart.point.new(time, bar_index + bl, downWickkMidpoint * (1 - sl))
cpG1 = chart.point.new(time, bar_index - 1, downWickkMidpoint * (1 + tp))
cpR1 = chart.point.new(time, bar_index - 1, downWickkMidpoint * (1 - sl))
lG := line.new(cpG1, cpG, xloc.bar_index, extend.none, color.green, line.style_solid, 1)
lE := line.new(cpE, cpE2, xloc.bar_index, extend.none, color.white, line.style_solid, 1)
lR := line.new(cpR1, cpR, xloc.bar_index, extend.none, color.red, line.style_solid, 1)
lR
else if downDelivery and showCdTheory
cpE = chart.point.new(time, bar_index - 1, upWickMidpoint)
cpE2 = chart.point.new(time, bar_index + bl, upWickMidpoint)
cpG = chart.point.new(time, bar_index + bl, upWickMidpoint * (1 - tp))
cpR = chart.point.new(time, bar_index + bl, upWickMidpoint * (1 + sl))
cpG1 = chart.point.new(time, bar_index - 1, upWickMidpoint * (1 - tp))
cpR1 = chart.point.new(time, bar_index - 1, upWickMidpoint * (1 + sl))
lG := line.new(cpG1, cpG, xloc.bar_index, extend.none, color.green, line.style_solid, 1)
lE := line.new(cpE, cpE2, xloc.bar_index, extend.none, color.white, line.style_solid, 1)
lR := line.new(cpR1, cpR, xloc.bar_index, extend.none, color.red, line.style_solid, 1)
lR
First I get the size of the wicks for the top and bottoms of the candles. This depends on if the bar is red or green. If the bar is green the wick is the high minus the close, if red the high minus the open, and so on. Next, the script defines the upper and lower bounds of the wicks for further comparison. If the candle is green, it's the open price minus the bottom wick. If the candle is red, it's the close price minus the bottom wick, and so on. Next we have the condition for when this strategy is present.
Down delivery:
Occurs when the previous candle is green, the current candle is red, and:
The high of the current candle is above the upper wick of the previous candle.
The size of the current candle's top wick is greater than its bottom wick.
The total size of the previous candle is greater than the total size of the current candle.
The current bar is confirmed (barstate.isconfirmed).
The session is during market hours (session.ismarket).
Up delivery:
Occurs when the previous candle is red, the current candle is green, and:
The low of the current candle is below the lower wick of the previous candle.
The size of the current candle's bottom wick is greater than its top wick.
The total size of the previous candle is greater than the total size of the current candle.
The current bar is confirmed.
The session is during market hours
Then risk is plotted from the percentage that users can input from an ideal entry spot.
#3 Candle Size Theory
I defined Candle Size Theory as follows.
//----------------------------------------------
//---------------Candle displacement------------
//----------------------------------------------
line lECD = na
notableDown = bodySize > bodySize * candle_size_sensitivity and downBar and session.ismarket and barstate.isconfirmed
notableUp = bodySize > bodySize * candle_size_sensitivity and upBar and session.ismarket and barstate.isconfirmed
if notableUp and showCdSizeTheory
cpE = chart.point.new(time, bar_index - 1, close)
cpE2 = chart.point.new(time, bar_index + bl_strcuture, close)
lECD := line.new(cpE, cpE2, xloc.bar_index, extend.none, color.rgb(0, 80, 75), line.style_solid, 3)
lECD
else if notableDown and showCdSizeTheory
cpE = chart.point.new(time, bar_index - 1, close)
cpE2 = chart.point.new(time, bar_index + bl_strcuture, close)
lECD := line.new(cpE, cpE2, xloc.bar_index, extend.none, color.rgb(105, 15, 15), line.style_solid, 3)
lECD
This plots candles that are “notable” or out of the ordinary. Candles that are larger than the last by a value users get to specify. These candles' highs or lows, if they are green or red, act as levels for support or resistance.
#4 Candle Structure Theory
I defined Candle Structure Theory as follows.
//----------------------------------------------
//---------------Structure----------------------
//----------------------------------------------
breakDownStructure = low < low and low < low and high > high and upBar and downBar and upBar and downBar and session.ismarket and barstate.isconfirmed
breakUpStructure = low > low and low > low and high < high and downBar and upBar and downBar and upBar and session.ismarket and barstate.isconfirmed
if breakUpStructure and showStructureTheory
cpE = chart.point.new(time, bar_index - 1, close)
cpE2 = chart.point.new(time, bar_index + bl_strcuture, close)
lE := line.new(cpE, cpE2, xloc.bar_index, extend.none, color.teal, line.style_solid, 3)
lE
else if breakDownStructure and showStructureTheory
cpE = chart.point.new(time, bar_index - 1, open)
cpE2 = chart.point.new(time, bar_index + bl_strcuture, open)
lE := line.new(cpE, cpE2, xloc.bar_index, extend.none, color.red, line.style_solid, 3)
lE
It is a series of candles to create a notable event. 2 lower lows in a row, a lower high, then green bar, red bar, green bar is a structure for a breakdown. 2 higher lows in a row, a higher high, red bar, green bar, red bar for a break up.
#5 Candle Swing Structure Theory
I defined Candle Swing Structure Theory as follows.
//----------------------------------------------
//---------------Swing Structure----------------
//----------------------------------------------
line htb = na
line ltb = na
if totalSize * swing_struct_sense < totalSize and upBar and downBar and high > high and showSwingSturcture and session.ismarket and barstate.isconfirmed
cpS = chart.point.new(time, bar_index - 1, high)
cpE = chart.point.new(time, bar_index + bl_strcuture, high)
htb := line.new(cpS, cpE, xloc.bar_index, color = color.red, style = line.style_dashed)
htb
else if totalSize * swing_struct_sense < totalSize and downBar and upBar and low > low and showSwingSturcture and session.ismarket and barstate.isconfirmed
cpS = chart.point.new(time, bar_index - 1, low)
cpE = chart.point.new(time, bar_index + bl_strcuture, low)
ltb := line.new(cpS, cpE, xloc.bar_index, color = color.teal, style = line.style_dashed)
ltb
A bearish swing structure is defined as the last candle’s total size, times a scalar that the user can input, is less than the current candles. Like a size imbalance. The last bar must be green and this one red. The last high should also be less than this high. For a bullish swing structure the same size imbalance must be present, but we need a red bar then a green bar, and the last low higher than the current low.
#6 Fractal Boxes
I define the Fractal Boxes as follows
//----------------------------------------------
//---------------Fractal Boxes------------------
//----------------------------------------------
box b = na
int indexx = na
if bar_index % (n * 2) == 0 and session.ismarket and showBoxes
b := box.new(left = bar_index, top = topBox, right = bar_index + n, bottom = bottomBox, border_color = color.rgb(105, 15, 15), border_width = boxLineSize, bgcolor = na)
indexx := bar_index + 1
indexx
The idea of this strategy is that the market is fractal. It is considered impossible to be able to tell apart two different time frames from just the chart. So inside the chart there are many many breakouts and breakdowns happening as price bounces around. The boxes are there to give you the view from your timeframe if the market is in a range from a time frame that would be higher than it. Like if we are inside what a larger time frame candle’s range. If we break out or down from this, we might be able to trade it. Users can specify a lookback period and the box is that period’s, as an interval, high and low. I say as an interval because it is plotted every n * 2 bars. So we get a box, price moves, then a new box.
#7 Potential Move Width
I define the Potential Move Width as follows
//----------------------------------------------
//---------------Move width---------------------
//----------------------------------------------
velocity = V(n)
line lC = na
line l = na
line l2 = na
line l3 = na
line l4 = na
line l5 = na
line l6 = na
line l7 = na
line l8 = na
line lGFractal = na
line lRFractal = na
cp2 = chart.point.new(time, bar_index + n, close + velocity)
cp3 = chart.point.new(time, bar_index + n, close - velocity)
cp4 = chart.point.new(time, bar_index + n, close + velocity * 5)
cp5 = chart.point.new(time, bar_index + n, close - velocity * 5)
cp6 = chart.point.new(time, bar_index + n, close + velocity * 10)
cp7 = chart.point.new(time, bar_index + n, close - velocity * 10)
cp8 = chart.point.new(time, bar_index + n, close + velocity * 15)
cp9 = chart.point.new(time, bar_index + n, close - velocity * 15)
cpG = chart.point.new(time, bar_index + n, close + R)
cpR = chart.point.new(time, bar_index + n, close - R)
if ((bar_index + n) * 2 - bar_index) % n == 0 and session.ismarket and barstate.isconfirmed and showPredictionWidtn
cp = chart.point.new(time, bar_index, close)
cpG1 = chart.point.new(time, bar_index, close + R)
cpR1 = chart.point.new(time, bar_index, close - R)
l := line.new(cp, cp2, xloc.bar_index, extend.none, color.aqua, line.style_solid, 1)
l2 := line.new(cp, cp3, xloc.bar_index, extend.none, color.aqua, line.style_solid, 1)
l3 := line.new(cp, cp4, xloc.bar_index, extend.none, color.red, line.style_solid, 1)
l4 := line.new(cp, cp5, xloc.bar_index, extend.none, color.red, line.style_solid, 1)
l5 := line.new(cp, cp6, xloc.bar_index, extend.none, color.teal, line.style_solid, 1)
l6 := line.new(cp, cp7, xloc.bar_index, extend.none, color.teal, line.style_solid, 1)
l7 := line.new(cp, cp8, xloc.bar_index, extend.none, color.blue, line.style_solid, 1)
l8 := line.new(cp, cp9, xloc.bar_index, extend.none, color.blue, line.style_solid, 1)
l8
By using the past n bar’s velocity, or directional speed, every n * 2 bars. I can use it to scale the close value and get an estimate for how wide the next moves might be.
#8 Linear regression
//----------------------------------------------
//---------------Linear Regression--------------
//----------------------------------------------
lr = showLR ? ta.linreg(close, n, 0) : na
plot(lr, 'Linear Regression', color.blue)
I used TradingView’s built in linear regression to not reinvent the wheel. This is present to see past market strength of weakness from a different perspective.
User input
Users can control a lot about this script. For the strategy based plots you can enter what you want the risk to be in percentages. So the default 0.01 is 1%. You can also control how far forward the line goes.
Look back at where it is needed as well as line width for the Fractal Boxes are controllable. Also users can check on and off what they would like to see on the charts.
No indicator is 100% reliable, do not follow this one blindly. I encourage traders to make their own decisions and not trade solely based on technical indicators. I encourage constructive criticism in the comments below. Thank you.

Candle 1 2 3 on XAUUSD (by Veronica)Description
Discover the Candle 1 2 3 Strategy, a simple yet effective trading method tailored exclusively for XAUUSD on the 15-minute timeframe. Designed by Veronica, this strategy focuses on identifying key reversal and continuation patterns during the London and New York sessions, making it ideal for traders who prioritise high-probability entries during these active market hours.
Key Features:
1. Session-Specific Trading:
The strategy operates strictly during London (03:00–06:00 UTC) and New York (08:30–12:30 UTC) sessions, where XAUUSD tends to show higher volatility and clearer price movements.
Pattern Criteria:
- Works best if the first candle is NOT a pin bar or a doji.
- Third candle should either:
a. Be a marubozu (large body with minimal wicks).
a. Have a significant body with wicks, ensuring the close of the third candle is above Candle 2 (for Buy) or below Candle 2 (for Sell).
Callout Labels and Alerts:
Automatic Buy and Sell labels are displayed on the chart during qualifying sessions, ensuring clarity for decision-making.
Integrated alerts notify you of trading opportunities in real-time.
Risk Management:
Built-in Risk Calculator to estimate lot sizes based on your account size, risk percentage, and stop-loss levels.
Customizable Table:
Displays your calculated lot size for various stop-loss pip values, making risk management seamless and efficient.
How to Use:
1. Apply the indicator to XAUUSD (M15).
2. Focus on setups appearing within the London and New York sessions only.
3. Ensure the first candle is neither a pin bar nor a doji.
4. Validate the third candle's body placement:
For a Buy, the third candle’s close must be above the second candle.
For a Sell, the third candle’s close must be below the second candle.
5. Use the generated alerts to streamline your entry process.
Notes:
This strategy is meant to complement your existing knowledge of market structure and price action.
Always backtest thoroughly and adjust parameters to fit your personal trading style and risk tolerance.
Credit:
This strategy is the intellectual property of Veronica, developed specifically for XAUUSD (M15) traders seeking precision entries during high-volume sessions.

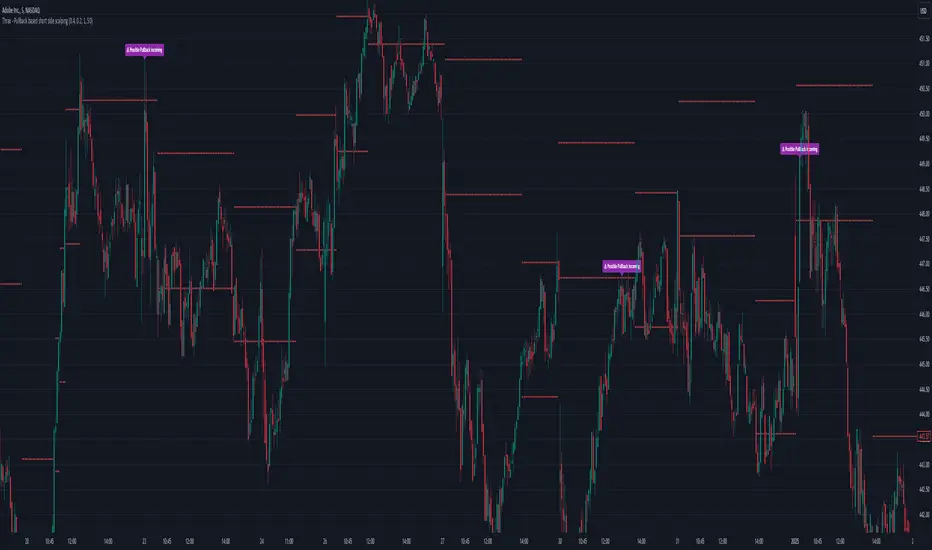
Thrax - Pullback based short side scalping⯁ This indicator is built for short trades only.
⤞ Pullback based scalping is a strategy where a trader anticipates a pullback and makes a quick scalp in this pullback. This strategy usually works in a ranging market as probability of pullbacks occurrence in ranging market is quite high.
⤞ The strategy is built by first determining a possible candidate price levels having high chance of pullbacks. This is determined by finding out multiple rejection point and creating a zone around this price. A rejection is considered to be valid only if it comes to this zone after going down by a minimum pullback percentage. Once the price has gone down by this minimum pullback percentage multiple times and reaches the zone again chances of pullback goes high and an indication on chart for the same is given.
⯁ Inputs
⤞ Zone-Top : This input parameter determines the upper range for the price zone.
⤞ Zone bottom : This input parameter determines the lower range for price zone.
⤞ Minimum Pullback : This input parameter determines the minimum pullback percentage required for valid rejection. Below is the recommended settings
⤞ Lookback : lookback period before resetting all the variables
⬦Below is the recommended settings across timeframes
⤞ 15-min : lookback – 24, Pullback – 2, Zone Top Size %– 0.4, Zone Bottom Size % – 0.2
⤞ 5-min : lookback – 50, pullback – 1% - 1.5%, Zone Top Size %– 0.4, Zone Bottom Size % – 0.2
⤞ 1-min : lookback – 100, pullback – 1%, Zone Top Size %– 0.4, Zone Bottom Size % – 0.2
⤞ Anything > 30-min : lookback – 11, pullback – 3%, Zone Top Size %– 0.4, Zone Bottom Size % – 0.2
✵ This indicator gives early pullback detection which can be used in below ways
1. To take short trades in the pullback.
2. To use this to exit an existing position in the next few candles as pullback may be incoming.
📌 Kindly note, it’s not necessary that pullback will happen at the exact point given on the chart. Instead, the indictor gives you early signals for the pullback
⯁ Trade Steup
1. Wait for pullback signal to occur on the chart.
2. Once the pullback warning has been displayed on the chart, you can either straight away enter the short position or wait for next 2-4 candles for initial sign of actual pullback to occurrence.
3. Once you have initiated short trade, since this is pullback-based strategy, a quick scalp should be made and closed as price may resume it’s original direction. If you have risk appetite you can stay in the trade longer and trial the stops if price keeps pulling back.
4. You can zone top as your stop, usually zone top + some% should be used as stop where ‘some %’ is based on your risk appetite.
5. It’s important to note that this indicator gives early sings of pullback so you may actually wait for 2-3 candles post ‘Pullback warning’ occurs on the chart before entering short trade.
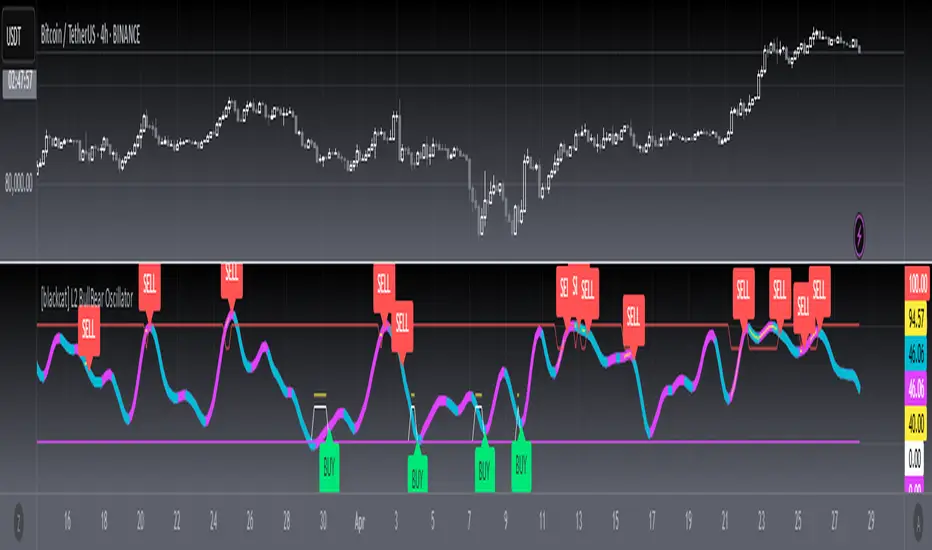
[blackcat] L2 BullBear OscillatorOVERVIEW
The " L2 BullBear Oscillator" is a custom trading indicator for TradingView that helps traders identify market trends, potential tops and bottoms, and the strength of trends using various moving averages and price relationships.
FEATURES
Calculates a base oscillator based on the close price relative to the highest and lowest prices over the past 60 periods.
Smoothes the oscillator using exponential moving averages (EMAs).
Determines market strength through relative strength indicators and moving averages.
Identifies potential tops and strong support levels based on specific conditions involving oscillators and price actions.
Plots several signals to help traders make informed decisions.
HOW TO USE
Install the script on your TradingView chart.
Customize the settings in the "Inputs" section:
Set the periods for the short-term and long-term EMAs.
Set the periods for the three SMAs used in calculations.
Interpret the plots:
BullBear Signal (Fuchsia Line): Indicates the overall market trend. Uptrends suggest buying opportunities, while downtrends suggest selling.
Decreasing BullBear Signal (Aqua Line): Highlights periods when the trend is weakening or turning bearish, signaling possible selling opportunities.
Potential Top Condition (Yellow Plot): Signals possible trend reversals from bullish to bearish, indicating times to consider taking profits or preparing for a downtrend.
High Price Condition (Yellow Plot): Indicates strong bullish momentum but also potentially overbought conditions, which might precede a correction.
Earning Condition (Red Line): Possibly signifies strong bullish signals, indicating good times to enter long positions.
Strong Support Condition (White Arrows): Signals potential bottoms or support levels, indicating buying opportunities.
Start Hiding Condition (Fuchsia Plot): Might indicate times to exit positions or reduce exposure due to unfavorable market conditions.
ALGORITHMS
Moving Averages:
Simple Moving Averages (SMAs): Used to calculate averages of price data over specified periods.
Exponential Moving Averages (EMAs): Used to give more weight to recent prices, making the moving averages more responsive to new data.
Oscillator Calculation:
The base oscillator is calculated based on the close price's position within the highest and lowest prices over 60 periods, normalized to a 0-100 scale.
This oscillator is then smoothed using EMAs to reduce noise and make trends more visible.
Relative Strength Indicator:
Calculated based on the close price's position within the highest and lowest prices over 20 periods, also normalized to a 0-100 scale.
This is smoothed using SMAs to get a more stable signal.
Condition Checks:
Various conditions are checked to identify potential tops, strong support, and other market states based on the relationships between these indicators and price actions.
LIMITATIONS
The script is based on historical data and does not guarantee future performance.
It is recommended to use the script in conjunction with other analysis tools.
The effectiveness of the strategy may vary depending on the market conditions and asset being traded.
NOTES
The script is designed for educational purposes and should not be considered financial advice.
Users are encouraged to backtest the strategy on a demo account before applying it to live trades.
THANKS
Special thanks to the TradingView community for their support and feedback.
4H CRT (1AM and 5AM)This TradingView script is designed to assist traders in implementing the "4-Hour Candle Ranges Theory Strategy (CRT)" by identifying key levels and setups based on the 1am and 4am (5am) 4-hour candles. This strategy is particularly effective for trading high-volatility assets such as Gold, EUR/USD, NAS100, US30, and S&P500, with US30 showing a notably high win rate. Here's how the strategy works:
Key Features:
1. Marking 1am and 4am 4-Hour Candle Ranges
- The script highlights the high and low of the 1am 4-hour candle.
- It visually tracks whether the high or low of the 1am candle is taken out by the subsequent 4-hour candle (5am).
2. Entry Setup Rules
- Primary Setup: Wait for the high or low of the 1am candle to be taken out by the 5am candle. Once this sweep occurs, wait for a Market Structure Shift (MSS) on the lower time frame (15min) to confirm your entry.
- Secondary Setup: If the 5am candle fails to take out the high or low of the 1am candle, the setup focuses on the levels formed by the 5am candle.
3. Trade Execution on 15-Minute Timeframe
- The script supports a lower time frame (15min) view to identify MSS and fine-tune entries.
4. Rinse and Repeat
- This process can be applied daily for consistent opportunities across the specified assets.
Advantages:
- Provides clear visual markers for key levels based on the 4-hour candles.
- Automates level plotting, saving traders time and reducing manual errors.
- Integrates well with the 15-minute timeframe for precise entry triggers.
- Optimized for popular trading instruments, especially US30 for a higher probability of success.
This script simplifies the application of CRT by automating the process of identifying and marking critical levels, enabling traders to focus on executing high-probability setups effectively.
Created by Hamid (poraymanfx)

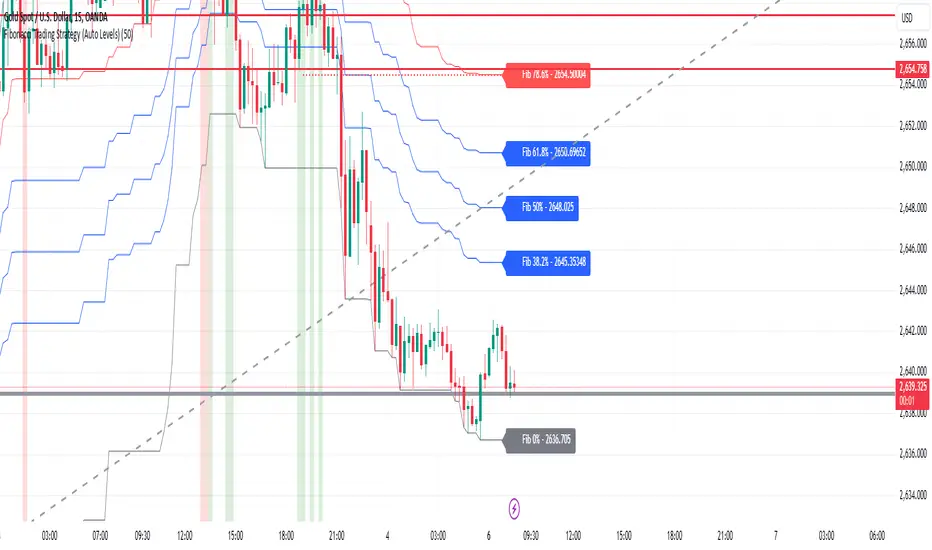
Fibonacci Trading Strategy (Auto Levels)How It Works
Swing Highs and Lows Detection:
The script identifies the highest high and lowest low over a specified lookback period (default: 50 candles). These points are used as the basis for Fibonacci calculations.
Fibonacci Levels:
Fibonacci retracement levels: 0%, 38.2%, 50%, 61.8%, 78.6%, and 100%.
Fibonacci extension levels: 127.2%, 161.8%, 200%, 261.8%, and 361.8%.
Each level is plotted on the chart with a specific color and labeled with the corresponding price.
Entry Zones:
Pullback Area: Between the 50% and 61.8% retracement levels. This area is highlighted in green, indicating a potential entry for conservative traders.
Full Margin Area: Between the 61.8% and 78.6% retracement levels. This area is highlighted in red, suggesting a higher-risk entry for aggressive traders.
Stop Loss (SL):
The Stop Loss is placed at the 78.6% Fibonacci retracement level. A dotted red line is drawn at this level to provide a visual reference for risk management.
Entry labels include the Stop Loss price for clarity.
Take Profit (TP) Levels:
Multiple take-profit targets are identified using Fibonacci extension levels (127.2%, 161.8%, 200%, 261.8%, and 361.8%).
Each level is labeled with the price and target percentage.
Visual Aids:
The script dynamically labels each Fibonacci level with its corresponding price.
Entry points (Pullback and Full Margin) are marked with clear labels, including the recommended Stop Loss.
Background highlights help distinguish the Pullback and Full Margin areas.
Strategy Highlights
Risk Management:
Incorporates a well-defined Stop Loss at the 78.6% level to limit downside risk.
Multiple take-profit levels help traders scale out of positions gradually.
Automation:
Automatically recalculates levels when new swing highs or lows are detected, ensuring accuracy in dynamic markets.
Customizability:
Users can adjust the lookback period to suit different timeframes or trading styles.
Clarity:
Clean visuals and detailed labels ensure the strategy is easy to interpret and apply.
When to Use
The strategy is suitable for trend-following traders looking to enter during pullbacks in an established trend.
It works best in trending markets where Fibonacci levels often act as strong support or resistance.
Example Scenario
Bullish Setup:
Price retraces to the 50%-61.8% area (Pullback Area) after a swing high.
A buy order is placed in this zone, with the Stop Loss at the 78.6% level.
Profit targets are set at the 127.2%, 161.8%, and higher Fibonacci extensions.
Bearish Setup:
In a downtrend, price retraces upward to the 50%-61.8% zone.
A sell order is placed, with the Stop Loss at the 78.6% level and take-profit levels below.
SufinBDThis TradingView script combines RSI, Stochastic RSI, MACD, and Bollinger Bands to generate Buy and Sell signals on two different timeframes: 4-hour (4H) and Daily (1D). The strategy aims to provide entry and exit points based on a multi-indicator confirmation approach, helping traders make more informed decisions.
Features:
RSI (Relative Strength Index):
Measures the speed and change of price movements.
The script looks for oversold conditions (RSI below 30) for buy signals and overbought conditions (RSI above 70) for sell signals.
Stochastic RSI:
Measures the level of RSI relative to its high-low range over a given period.
A Stochastic RSI below 0.2 indicates oversold conditions, and a value above 0.8 indicates overbought conditions.
It helps identify overbought and oversold conditions in a more precise manner than regular RSI.
MACD (Moving Average Convergence Divergence):
A trend-following momentum indicator that shows the relationship between two moving averages of a security's price.
The MACD line crossing above the Signal line generates bullish signals, and vice versa for bearish signals.
Bollinger Bands:
A volatility indicator that consists of a middle band (SMA of price), an upper band, and a lower band.
When the price is below the lower band, it signals potential buy opportunities, while prices above the upper band signal potential sell opportunities.
Timeframe Usage:
The script calculates indicators for both the 4-hour (4H) and Daily (1D) timeframes.
The combined signals from these two timeframes are used to generate Buy and Sell alerts.
Buy Signal:
A Buy signal is generated when all of the following conditions are met:
RSI on both 4H and 1D is below 30 (oversold conditions).
Stochastic RSI on both timeframes is below 0.2.
The MACD line is above the Signal line on both timeframes.
The price is below the lower Bollinger Band on both the 4H and 1D charts.
Sell Signal:
A Sell signal is generated when all of the following conditions are met:
RSI on both 4H and 1D is above 70 (overbought conditions).
Stochastic RSI on both timeframes is above 0.8.
The MACD line is below the Signal line on both timeframes.
The price is above the upper Bollinger Band on both the 4H and 1D charts.
Visuals:
Buy signals are marked with green labels below the bars.
Sell signals are marked with red labels above the bars.
Bollinger Bands are displayed on the chart with the upper and lower bands marked in blue (for 4H) and orange (for 1D).
Purpose:
This script aims to provide more reliable buy/sell signals by combining indicators across multiple timeframes. It is ideal for traders who want to use multiple confirmation points before entering or exiting a trade.
How to Use:
Apply the script to any chart on TradingView.
Look for Buy and Sell signals that meet the conditions above.
You can adjust the timeframe (e.g., 4H or 1D) based on your trading strategy.
This script can be used for intraday trading, swing trading, or position trading depending on your preferred timeframes.
Example of Signal Interpretation:
Buy Signal:
If all conditions are met (e.g., RSI is under 30, Stochastic RSI is under 0.2, MACD is bullish, and price is below the lower Bollinger Band on both the 4-hour and daily charts), the script will show a green "BUY" label below the price bar.
Sell Signal:
If all conditions are met (e.g., RSI is over 70, Stochastic RSI is over 0.8, MACD is bearish, and price is above the upper Bollinger Band on both timeframes), the script will show a red "SELL" label above the price bar.
This combination of indicators offers a multi-layered confirmation approach, which aims to reduce the risk of false signals and increase the reliability of your trading decisions.

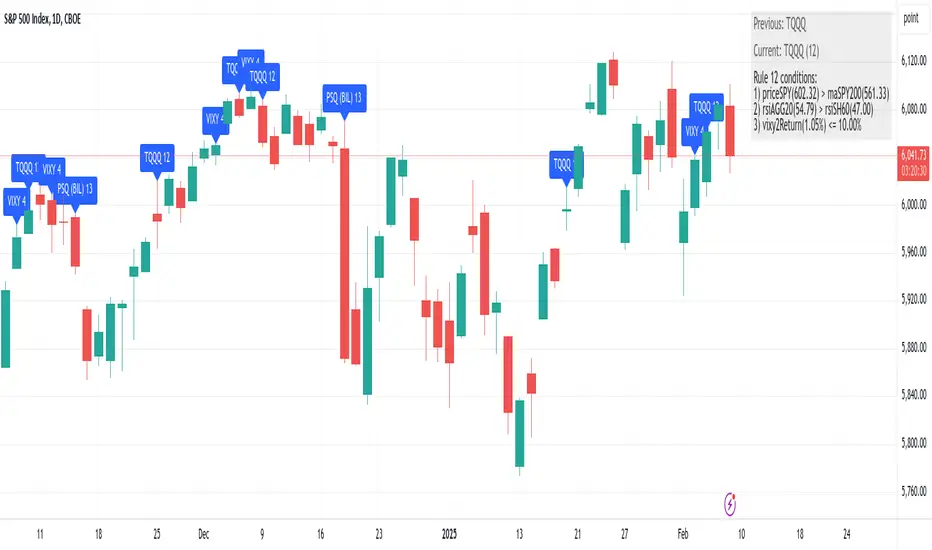
Composer Strategy 1 (Haggis Levered)This strategy dynamically selects an asset to trade each day based on a set of predefined market conditions and technical indicators. It uses relative strength index (RSI) and moving averages to evaluate momentum and trends across multiple tickers, aiming to identify the most advantageous asset for the current market environment. By switching between leveraged ETFs, inverse funds, and defensive assets, the strategy seeks to capitalize on both bullish and bearish scenarios while mitigating risk during uncertain periods.
The approach emphasizes adaptability by monitoring key metrics like overbought or oversold signals and comparing cumulative returns and relative performance across asset classes. This flexibility allows the strategy to respond to changing market dynamics daily, aligning with short-term trends while maintaining a systematic and disciplined methodology for asset allocation.
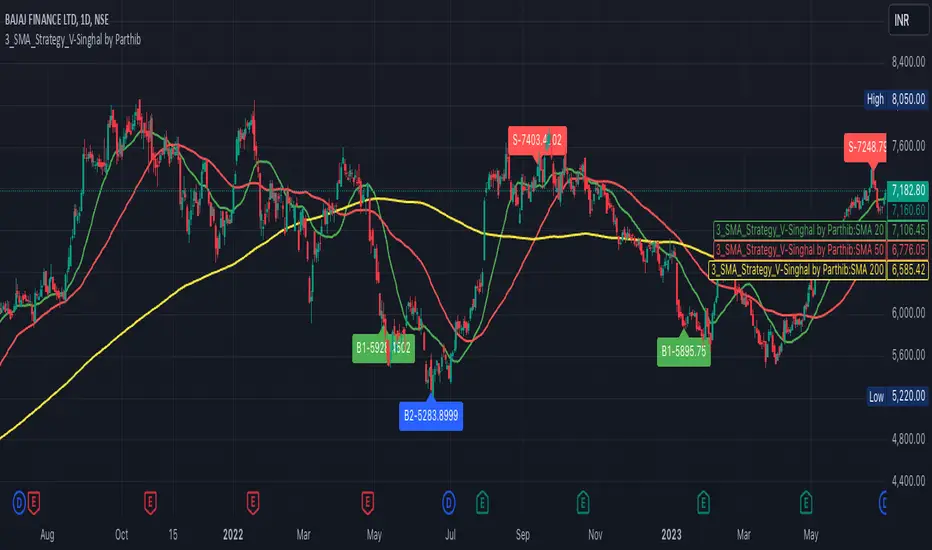
3_SMA_Strategy_V-Singhal by ParthibIndicator Name: 3_SMA_Strategy_V-Singhal by Parthib
Description:
The 3_SMA_Strategy_V-Singhal by Parthib is a dynamic trend-following strategy that combines three key simple moving averages (SMA) — SMA 20, SMA 50, and SMA 200 — to generate buy and sell signals. This strategy uses these SMAs to capture and follow market trends, helping traders identify optimal entry (buy) and exit (sell) points. Additionally, the strategy highlights the closing price (CP), which plays a critical role in confirming buy and sell signals.
The strategy also features a Second Buy Signal triggered if the price falls more than 10% after an initial buy signal, providing a re-entry opportunity with a different visual highlight for the second buy signal.
Features:
Three Simple Moving Averages (SMA):
SMA 20: Short-term moving average reflecting immediate market trends.
SMA 50: Medium-term moving average showing the prevailing trend.
SMA 200: Long-term moving average that indicates the overall market trend.
Buy Signal (B1):
Triggered when:
SMA 200 > SMA 50 > SMA 20, indicating a bullish market structure.
The closing price is positioned below all three SMAs, confirming a potential upward reversal.
A green label appears at the low of the bar with the text B1-Price, indicating the price at which the buy signal is generated.
Second Buy Signal (B2):
Triggered if the price falls more than 10% after the first buy signal, providing an opportunity to re-enter the market at a potentially better price.
A blue label appears at the low of the bar with the text B2-Price, showing the price at which the second buy opportunity arises.
Sell Signal (S):
Triggered when:
SMA 20 > SMA 50 > SMA 200, indicating a bearish trend.
The closing price (CP) is positioned above all three SMAs, confirming a potential downward movement.
A red label appears at the high of the bar with the text S-Price, showing the price at which the sell signal is triggered.
How It Works:
Buy Conditions:
SMA 200 > SMA 50 > SMA 20: Indicates a bullish market where the long-term trend (SMA 200) is above the medium-term (SMA 50), and the medium-term trend is above the short-term (SMA 20).
Closing price below all three SMAs: Confirms that the price is in a favorable position for a potential upward reversal.
Sell Conditions:
SMA 20 > SMA 50 > SMA 200: This setup indicates a bearish trend.
Closing price above all three SMAs: Confirms that the price is in a favorable position for a potential downward movement.
Second Buy Signal (B2): If the price falls more than 10% after the first buy signal, the strategy triggers a second buy opportunity (B2) at a potentially better price. This helps traders take advantage of pullbacks or corrections after an initial favorable entry.
Labeling System:
B1-Price: The first buy signal label, appearing when the market is bullish and the closing price is below all three SMAs.
B2-Price: The second buy signal label, triggered if the price falls more than 10% after the initial buy signal.
S-Price: The sell signal label, appearing when the market turns bearish and the closing price is above all three SMAs.
How to Use:
Add the Indicator: Add "3_SMA_Strategy_V-Singhal by Parthib" to your chart on TradingView.
Interpret Buy Signals (B1): Look for green labels with the text "B1-Price" when the closing price (CP) is below all three SMAs and the trend is bullish.
Interpret Second Buy Signals (B2): If the price falls more than 10% after the first buy, look for blue labels with "B2-Price" and a re-entry opportunity.
Interpret Sell Signals (S): Look for red labels with the text "S-Price" when the market turns bearish, and the closing price (CP) is above all three SMAs.
Conclusion:
The 3_SMA_Strategy_V-Singhal by Parthib is an efficient and simple trend-following tool for traders looking to make informed buy and sell decisions. By combining the power of three SMAs and the closing price (CP) confirmation, this strategy helps traders to buy when the market shows a strong bullish setup and sell when the trend turns bearish. Additionally, the second buy signal feature ensures that traders don’t miss out on re-entry opportunities after price corrections, giving them a chance to re-enter the market at a favorable price.
CauchyTrend [InvestorUnknown]The CauchyTrend is an experimental tool that leverages a Cauchy-weighted moving average combined with a modified Supertrend calculation. This unique approach provides traders with insight into trend direction, while also offering an optional ATR-based range analysis to understand how often the market closes within, above, or below a defined volatility band.
Core Concepts
Cauchy Distribution and Gamma Parameter
The Cauchy distribution is a probability distribution known for its heavy tails and lack of a defined mean or variance. It is characterized by two parameters: a location parameter (x0, often 0 in our usage) and a scale parameter (γ, "gamma").
Gamma (γ): Determines the "width" or scale of the distribution. Smaller gamma values produce a distribution more concentrated near the center, giving more weight to recent data points, while larger gamma values spread the weight more evenly across the sample.
In this indicator, gamma influences how much emphasis is placed on values closer to the current price versus those further away in time. This makes the resulting weighted average either more reactive or smoother, depending on gamma’s value.
// Cauchy PDF formula used for weighting:
// f(x; γ) = (1/(π*γ)) *
f_cauchyPDF(offset, gamma) =>
numerator = gamma * gamma
denominator = (offset * offset) + (gamma * gamma)
pdf = (1 / (math.pi * gamma)) * (numerator / denominator)
pdf
A chart showing different Cauchy PDFs with various gamma values, illustrating how gamma affects the weight distribution.
Cauchy-Weighted Moving Average (CWMA)
Using the Cauchy PDF, we calculate normalized weights to create a custom Weighted Moving Average. Each bar in the lookback period receives a weight according to the Cauchy PDF. The result is a Cauchy Weighted Average (cwm_avg) that differs from typical moving averages, potentially offering unique sensitivity to price movements.
// Summation of weighted prices using Cauchy distribution weights
cwm_avg = 0.0
for i = 0 to length - 1
w_norm = array.get(weights, i) / sum_w
cwm_avg += array.get(values, i) * w_norm
Supertrend with a Cauchy Twist
The indicator integrates a modified Supertrend calculation using the cwm_avg as its reference point. The Supertrend logic typically sets upper and lower bands based on volatility (ATR), and flips direction when price crosses these bands.
In this case, the Cauchy-based average replaces the usual baseline, aiming to capture trend direction via a different weighting mechanism.
When price closes above the upper band, the trend is considered bullish; closing below the lower band signals a bearish trend.
ATR Stats Range (Optional)
Beyond the fundamental trend detection, the indicator optionally computes ATR-based stats to understand price distribution relative to a volatility corridor centered on the cwm_avg line:
Volatility Range:
Defined as cwm_avg ± (ATR * atr_mult), this range creates upper and lower bands. Turning on atr_stats computes how often the daily close falls: Within the range, Above the upper ATR boundary, Below the lower ATR boundary, Within the range but above cwm_avg, Within the range but below cwm_avg
These statistics can help traders gauge how the market behaves relative to this volatility envelope and possibly identify if the market tends to revert to the mean or break out more often.
Backtesting and Performance Metrics
The code is integrated with a backtesting library that allows users to assess strategy performance historically:
Equity Curve Calculation: Compares CauchyTrend-based signals against the underlying asset.
Performance Metrics Table: Once enabled, displays key metrics such as mean returns, Sharpe Ratio, Sortino Ratio, and more, comparing the strategy to a simple Buy & Hold approach.
Alerts and Notifications
The indicator provides Alerts for key events:
Long Alert: Triggered when the trend flips bullish.
Short Alert: Triggered when the trend flips bearish.
Customization and Calibration
Important: The default parameters are not optimized for any specific instrument or time frame. Traders should:
Adjust the length and gamma parameters to influence how sharply or broadly the cwm_avg reacts to price changes.
Tune the atr_len and atr_mult for the Supertrend logic to better match the asset’s volatility characteristics.
Experiment with atr_stats on/off to see if that additional volatility distribution information provides helpful insights.
Traders may find certain sets of parameters that align better with their preferred trading style, risk tolerance, or asset volatility profile.
Disclaimer: This indicator is for educational and informational purposes only. Past performance in backtesting does not guarantee future results. Always perform due diligence, and consider consulting a qualified financial advisor before trading.

Did it move?That is the eternal question in trading.: Is the price moving? This indicators aims to answer that question. It is based on concepts from 2 Bars from "The Strat". This indicator measures the distance the current price is above the previous high or below the previous low and on two timeframes. The assumption is that the price is moving as long as the price is above or below the previous bar.
The distance the price moved is normalized by the standard deviation. This serves the trader in two ways: 1) you can quickly determine if a price movement is significant (score > 1), and 2) you can plan exits when the score falls below 1 (e.g., movement become insignificant). Movement upwards are colored green and down movements are red. When the price is also above the higher timeframe high (below the HTF low), the color are more intense. When the price is not moving, the background is highlighted.
Finally, there are two alert setting. One is for then the price stops moving (movement score falls below a threshold. The other is a exit/reversal warning. For example if there is a strong move in the opposite it will trigger that alert.

MadTrend [InvestorUnknown]The MadTrend indicator is an experimental tool that combines the Median and Median Absolute Deviation (MAD) to generate signals, much like the popular Supertrend indicator. In addition to identifying Long and Short positions, MadTrend introduces RISK-ON and RISK-OFF states for each trade direction, providing traders with nuanced insights into market conditions.
Core Concepts
Median and Median Absolute Deviation (MAD)
Median: The middle value in a sorted list of numbers, offering a robust measure of central tendency less affected by outliers.
Median Absolute Deviation (MAD): Measures the average distance between each data point and the median, providing a robust estimation of volatility.
Supertrend-like Functionality
MadTrend utilizes the median and MAD in a manner similar to how Supertrend uses averages and volatility measures to determine trend direction and potential reversal points.
RISK-ON and RISK-OFF States
RISK-ON: Indicates favorable conditions for entering or holding a position in the current trend direction.
RISK-OFF: Suggests caution, signaling RISK-ON end and potential trend weakening or reversal.
Calculating MAD
The mad function calculates the median of the absolute deviations from the median, providing a robust measure of volatility.
// Function to calculate the Median Absolute Deviation (MAD)
mad(series float src, simple int length) =>
med = ta.median(src, length) // Calculate median
abs_deviations = math.abs(src - med) // Calculate absolute deviations from median
ta.median(abs_deviations, length) // Return the median of the absolute deviations
MADTrend Function
The MADTrend function calculates the median and MAD-based upper (med_p) and lower (med_m) bands. It determines the trend direction based on price crossing these bands.
MADTrend(series float src, simple int length, simple float mad_mult) =>
// Calculate MAD (volatility measure)
mad_value = mad(close, length)
// Calculate the MAD-based moving average by scaling the price data with MAD
median = ta.median(close, length)
med_p = median + (mad_value * mad_mult)
med_m = median - (mad_value * mad_mult)
var direction = 0
if ta.crossover(src, med_p)
direction := 1
else if ta.crossunder(src, med_m)
direction := -1
Trend Direction and Signals
Long Position (direction = 1): When the price crosses above the upper MAD band (med_p).
Short Position (direction = -1): When the price crosses below the lower MAD band (med_m).
RISK-ON: When the price moves further in the direction of the trend (beyond median +- MAD) after the initial signal.
RISK-OFF: When the price retraces towards the median, signaling potential weakening of the trend.
RISK-ON and RISK-OFF States
RISK-ON LONG: Price moves above the upper band after a Long signal, indicating strengthening bullish momentum.
RISK-OFF LONG: Price falls back below the upper band, suggesting potential weakness in the bullish trend.
RISK-ON SHORT: Price moves below the lower band after a Short signal, indicating strengthening bearish momentum.
RISK-OFF SHORT: Price rises back above the lower band, suggesting potential weakness in the bearish trend.
Picture below show example RISK-ON periods which can be identified by “cloud”
Note: Highlighted areas on the chart indicating RISK-ON and RISK-OFF periods for both Long and Short positions.
Implementation Details
Inputs and Parameters:
Source (input_src): The price data used for calculations (e.g., close, open, high, low).
Median Length (length): The number of periods over which the median and MAD are calculated.
MAD Multiplier (mad_mult): Determines the distance of the upper and lower bands from the median.
Calculations:
Median and MAD are recalculated each period based on the specified length.
Upper (med_p) and Lower (med_m) Bands are computed by adding and subtracting the scaled MAD from the median.
Visual representation of the indicator on a price chart:
Backtesting and Performance Metrics
The MadTrend indicator includes a Backtesting Mode with a performance metrics table to evaluate its effectiveness compared to a simple buy-and-hold strategy.
Equity Calculation:
Calculates the equity curve based on the signals generated by the indicator.
Performance Metrics:
Metrics such as Mean Returns, Standard Deviation, Sharpe Ratio, Sortino Ratio, and Omega Ratio are computed.
The metrics are displayed in a table for both the strategy and the buy-and-hold approach.
Note: Due to the use of labels and plot shapes, automatic chart scaling may not function ideally in Backtest Mode.
Alerts and Notifications
MadTrend provides alert conditions to notify traders of significant events:
Trend Change Alerts
RISK-ON and RISK-OFF Alerts - Provides real-time notifications about the RISK-ON and RISK-OFF states for proactive trade management.
Customization and Calibration
Default Settings: The provided default settings are experimental and not optimized. They serve as a starting point for users.
Parameter Adjustment: Traders are encouraged to calibrate the indicator's parameters (e.g., length, mad_mult) to suit their specific trading style and the characteristics of the asset being analyzed.
Source Input: The indicator allows for different price inputs (open, high, low, close, etc.), offering flexibility in how the median and MAD are calculated.
Important Notes
Market Conditions: The effectiveness of the MadTrend indicator can vary across different market conditions. Regular calibration is recommended.
Backtest Limitations: Backtesting results are historical and do not guarantee future performance.
Risk Management: Always apply sound risk management practices when using any trading indicator.

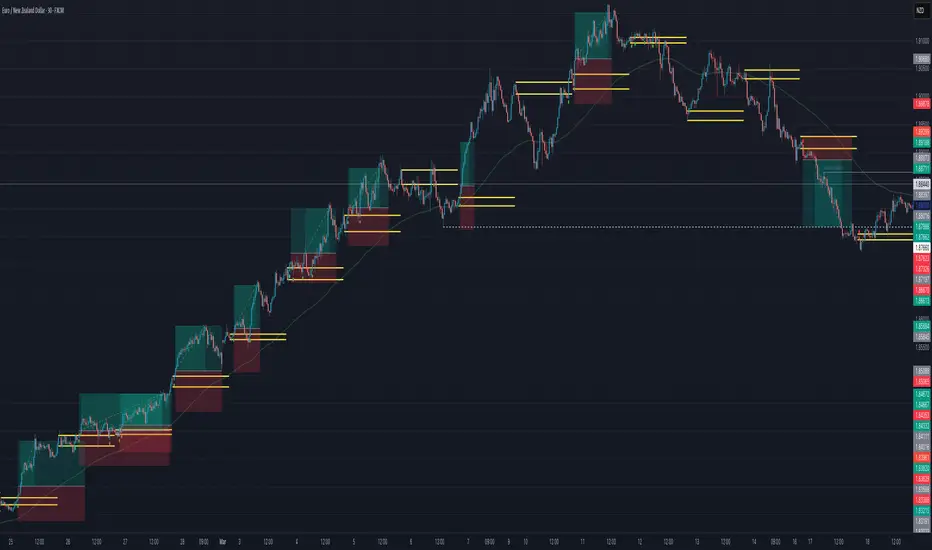
EMA with Supply and Demand Zones
The EMA with Supply and Demand Strategy is a trend-following trading approach that integrates Exponential Moving Averages (EMA) with supply and demand zones to identify potential entry and exit points. Below is a detailed description of its components and logic:
Key Components of the Strategy
1. EMA (Exponential Moving Average)
The EMA is used as a trend filter:
Bullish Trend: Price is above the EMA.
Bearish Trend: Price is below the EMA.
The EMA ensures that trades align with the overall market trend, reducing counter-trend risks.
2. Supply and Demand Zones
Demand Zone:
Represents areas where the price historically found support (buyers dominated).
Calculated using the lowest low over a specified lookback period.
Used for identifying potential long entry points.
Supply Zone:
Represents areas where the price historically faced resistance (sellers dominated).
Calculated using the highest high over a specified lookback period.
Used for identifying potential short entry points.
3. Trade Conditions
Long Trade:
Triggered when:
The price is above the EMA (bullish trend).
The low of the current candle touches or penetrates the most recent demand zone.
Short Trade:
Triggered when:
The price is below the EMA (bearish trend).
The high of the current candle touches or penetrates the most recent supply zone.
4. Exit Conditions
Long Exit:
Exit the trade when the price closes below the EMA, indicating a potential trend reversal.
Short Exit:
Exit the trade when the price closes above the EMA, signaling a potential upward reversal.
Visual Representation
EMA: A blue line plotted on the chart to show the trend.
Supply Zones: Red horizontal lines representing potential resistance levels.
Demand Zones: Green horizontal lines representing potential support levels.
These zones dynamically adjust to reflect the most recent 3 levels.
How the Strategy Works
Trend Identification:
The EMA determines the direction of the trade:
Look for long trades only in a bullish trend (price above EMA).
Look for short trades only in a bearish trend (price below EMA).
Entry Points:
Wait for price interaction with a supply or demand zone:
If the price touches a demand zone during a bullish trend, initiate a long trade.
If the price touches a supply zone during a bearish trend, initiate a short trade.
Risk Management:
The strategy exits trades if the price moves against the trend (crosses the EMA).
This ensures minimal exposure during adverse market movements.
Benefits of the Strategy
Trend Alignment:
Reduces counter-trend trades, improving the win rate.
Clear Entry and Exit Rules:
Combines price action (zones) with a reliable trend filter (EMA).
Dynamic Levels:
The supply and demand zones adapt to changing market conditions.
Customization Options
EMA Length:
Adjust to suit different timeframes or market conditions (e.g., 20 for faster trends, 50 for slower trends).
Lookback Period:
Fine-tune to capture broader or narrower supply and demand zones.
Risk/Reward Preferences:
Pair the strategy with stop-loss and take-profit levels for enhanced control.
This strategy is ideal for traders looking for a structured approach to identify high-probability trades while aligning with the prevailing trend. Backtest and optimize parameters based on your trading style and the specific asset you're tradin

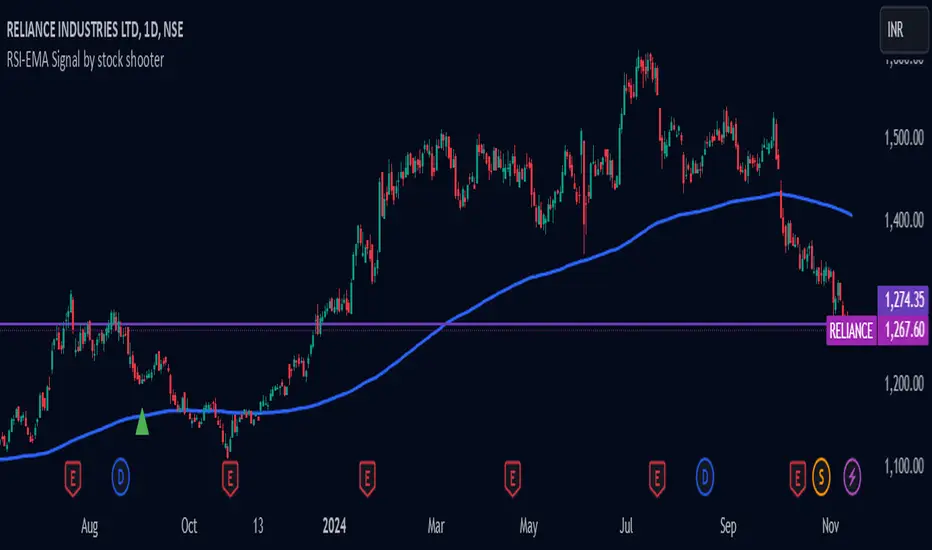
RSI-EMA Signal by stock shooter## Strategy Description: 200 EMA Crossover with RSI, Green/Red Candles, Volume, and Exit Conditions
This strategy combines several technical indicators to identify potential long and short entry opportunities in a trading instrument. Here's a breakdown of its components:
1. 200-period Exponential Moving Average (EMA):
* The 200-period EMA acts as a long-term trend indicator.
* The strategy looks for entries when the price is above (long) or below (short) the 200 EMA.
2. Relative Strength Index (RSI):
* The RSI measures the momentum of price movements and helps identify overbought and oversold conditions.
* The strategy looks for entries when the RSI is below 40 (oversold) for long positions and above 60 (overbought) for short positions.
3. Green/Red Candles:
* This indicator filters out potential entries based on the current candle's closing price relative to its opening price.
* The strategy only considers long entries on green candles (closing price higher than opening) and short entries on red candles (closing price lower than opening).
4. Volume:
* This indicator adds a volume filter to the entry conditions.
* The strategy only considers entries when the current candle's volume is higher than the average volume of the previous 20 candles, aiming for stronger signals.
Overall:
This strategy aims to capture long opportunities during potential uptrends and short opportunities during downtrends, based on a combination of price action, momentum, and volume confirmation.
Important Notes:
Backtesting is crucial to evaluate the historical performance of this strategy before deploying it with real capital.
Consider incorporating additional risk management techniques like stop-loss orders.
This strategy is just a starting point and can be further customized based on your trading goals and risk tolerance.
First 5 Minutes Open/Close LinesThis very simple indicator paints lines at the high and low of the first 5m candle of the session. It is primarily intended for big cap NYSE traded stocks with high volume. I wrote this indicator to save me the trouble of manually drawing the lines each day.
The lines drawn at the 5m high/low will remain constant regardless of which timeframe you switch to. In the example screenshot, we are looking at the 1m timeframe. This helps us switch effortlessly between different timeframes to see if a given price movement meets our entry criteria.
In addition to drawing lines at the first 5m high/low, it will optionally paint two zones, one each around the high and low. The boundaries of this zone are configurable and expressed as a percentage of the total movement of the first 5m bar. By default, it is set to 25%.
This indicator is based on the concept that the first 5m bar always has massive volume which helps us infer that price may react around the extremes of that movement. The basic strategy works something like this:
- You identify the high timeframe (HTF) trend direction of the stock
- You wait for the first 5m candle of the session to close
- You wait for price to puncture through the outer boundary of the zone marked by the indicator.
- You enter when price retraces to the high, or low, which marks the midpoint of the punctured zone.
- Only enter long on stocks in a HTF uptrend, and short on stocks in an HTF downtrend.
- Use market structure to identify stop loss and take profit targets
Note: Use at your own risk. This indicator and the strategy described herein are not in any way financial advice, nor does the author of this script make any claims about the effectiveness of this strategy, which may depend highly on the discretion and skill of the trader executing it, among many other factors outside of the author's control. The author of this script accepts no liability, and is not responsible for any trading decisions that you may or may not make as a result of this indicator. You should expect to lose money if using this indicator.

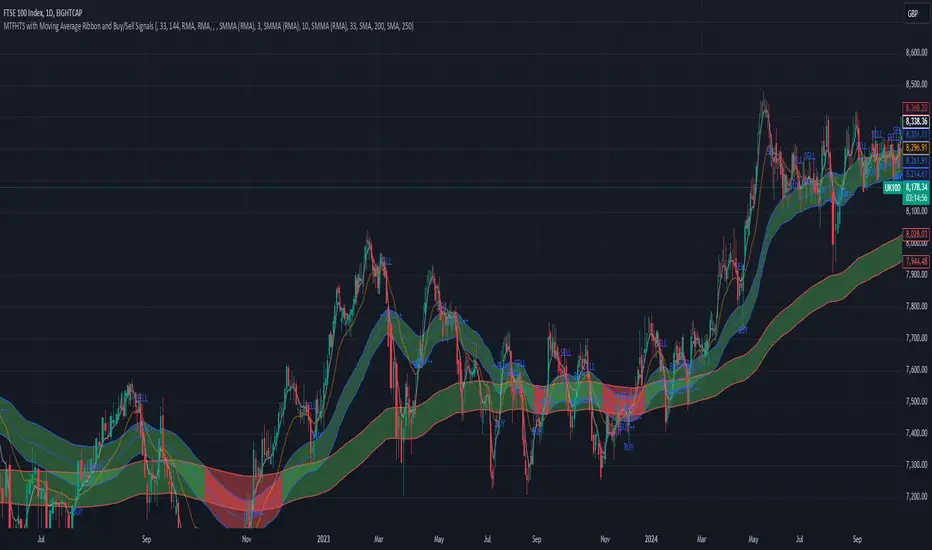
MTFHTS with Moving Average Ribbon and Buy/Sell Signals 3.2Multi-Timeframe Moving Average Strategy with Buy and Sell Signals
Purpose
This strategy is designed to provide clear, data-driven buy and sell signals based on moving average crossovers across multiple timeframes. It aims to help traders identify potential trend reversals and entry/exit points using a systematic approach.
How it Works
Moving Averages Across Multiple Timeframes:
Five customizable moving averages (MA №1 to MA №5) are calculated using different lengths and types, including SMA, EMA, WMA, and VWMA, to suit various trading styles.
The MAs are plotted on different timeframes, allowing traders to visualize trend alignment and identify market momentum across short, medium, and long terms.
Signals for Buying and Selling:
Buy Signals: When the shorter-term MA (MA №1) crosses above a longer-term MA (MA №2 or MA №3), the strategy triggers a buy signal, indicating potential upward momentum.
Sell Signals: When MA №1 crosses below a longer-term MA (MA №2 or MA №3), a sell signal is triggered, suggesting potential downward movement.
Visual Aids and Alerts:
The strategy uses color fills between MAs to indicate bullish (green) or bearish (red) trends, helping traders assess market conditions at a glance.
Alerts for buy and sell signals keep traders notified in real-time, helping to avoid missed opportunities.
Important Note
This strategy is purely educational and does not constitute investment advice. It serves as a tool to help traders understand how multi-timeframe moving averages and crossovers can be used in technical analysis. As with any trading strategy, we recommend testing in a simulated environment and exercising caution.
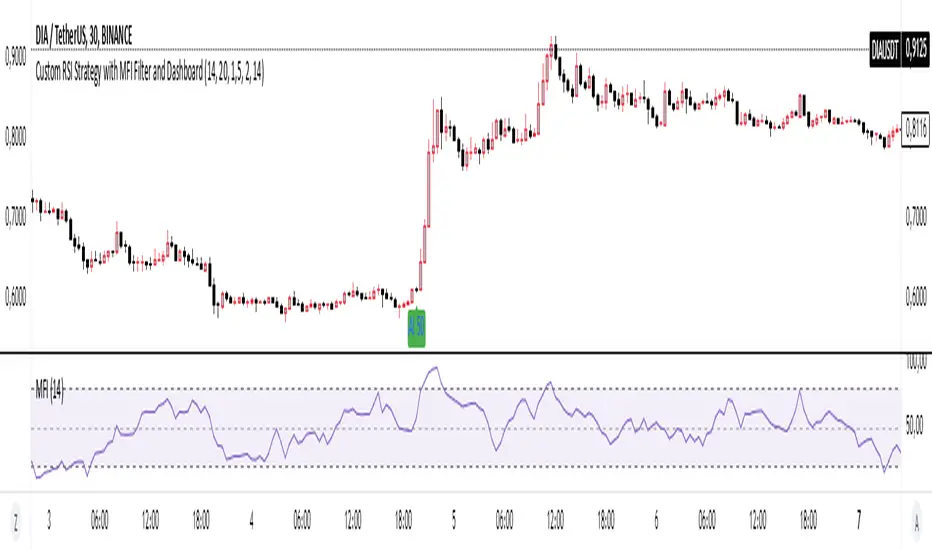
Basic RSI Strategy with MFI Description: This Pine Script is a custom trading strategy that combines the power of the RSI (Relative Strength Index) and MFI (Money Flow Index) indicators with additional signal filters and a user-friendly dashboard. The strategy is designed to identify potential entry and exit points based on dynamic conditions, providing an advanced approach to technical analysis and decision-making in trading.
Key Features:
RSI-Based Signals:
Generates buy signals when the RSI-based moving average crosses above specific thresholds (29 and 50).
Generates sell signals when the RSI-based moving average crosses below specific thresholds (50 and 69).
MFI Filtering:
Signals are validated only if the MFI value is within the specified range of 20 to 80, ensuring that signals are generated only when market conditions are favorable.
Dynamic Signal Thresholds:
The script includes adjustable thresholds for the percentage difference between consecutive bars, as well as the range between high and low prices, to refine signal accuracy.
Dashboard:
Displays real-time statistics in the top right corner of the chart, including the total number of signals, the count of buy and sell signals, and the time duration over which these signals were generated.
How to Use:
Settings: Customize the RSI and MFI lengths, along with thresholds for price movement and MFI range. This flexibility allows the strategy to be tailored to different market conditions and timeframes.
Dashboard Insight: Track the strategy's performance in real-time, with an intuitive overview of generated signals and their time distribution on the chart.
Ideal For:
This script is suitable for traders seeking a robust, customizable, and real-time signal generation strategy that combines momentum and volume indicators. The strategy’s unique filtering mechanism provides a higher level of precision, making it an excellent tool for those who prioritize signal accuracy and clarity.