Evil's Two Legged IndicatorA pullback strategy indicator designed for scalping. This attempts to Identify classic 2-leg pullback patterns and filters out signals during choppy market conditions for better signals.
How It Works:
The indicator detects when price forms two pullback legs (swing lows in an uptrend or swing highs in a downtrend) near key support/resistance zones, then signals when reversal confirmation occurs. Equal-level pullbacks (double bottoms/tops) are marked as stronger signals.
Features:
Channel Options: Donchian (default), Linear Regression, or ATR Bands
Configurable EMA: For trend confirmation (default 21)
Adjustable Leg Detection: Swing lookback period for different timeframes
Equal Level Detection: Highlights stronger setups where both legs terminate at similar prices
Three Chop Filters (can be combined):
ADX Filter — suppresses signals when ADX is below threshold (default 25)
EMA Slope Filter — suppresses signals when EMA is flat
Chop Index Filter — suppresses signals when Chop Index indicates ranging conditions
Signal Types:
Standard signals: 2-leg pullback detected with trend confirmation
Strong signals (highlighted): 2-leg pullback with equal highs/lows — higher probability setup
Recommended Use:
Best suited for scalping on 1-5 minute chart. Designed for 1.5:1 risk/reward setups.
Settings Guide:
Increase "Swing Lookback" for fewer, higher-quality signals
Adjust "Equal Level Threshold" to fine-tune what counts as a double bottom/top
Enable/disable chop filters based on your market and timeframe
Use "Show Strong Signals Only" to filter for highest conviction setups
Wyszukaj w skryptach "swing high"

Goldilocks Pivot FractalsGOLDILOCKS PIVOT FRACTALS - DESCRIPTION
Overview
Goldilocks Pivot Fractals identifies swing highs and lows using fractal pattern recognition with professional visual presentation. This indicator marks potential reversal points where price creates distinct peaks and valleys - perfect pivot points for support, resistance, and market structure analysis.
The "Goldilocks" name reflects the perfectly balanced visual presentation: not too cluttered, not too plain, just right for professional traders. Unlike standard fractal indicators, this edition features fully customizable Buy/Sell labels with tick-based positioning, independent toggle controls, and a high-contrast color scheme optimized for both dark and light chart themes.
What Makes It Unique:
- Professional label system with full customization (colors, sizes, tick-based offsets)
- Toggle labels and arrow shapes independently
- High-contrast default colors (teal/maroon) optimized for maximum visibility
- Clean, trader-friendly interface with intuitive settings
- Works flawlessly on all timeframes and instruments
How to Use
PERIOD ADJUSTMENT & ADJUSTING SENSITIVITY
The Period(s) setting controls how many signals you see:
• Period = 2 (default): Shows more signals, catches smaller price swings - best for day trading and scalping
• Period = 3-4: Shows medium amount of signals, filters out tiny moves - good for swing trading (holding days to weeks)
• Period = 5 or higher: Shows fewer signals, only the biggest turning points - best for long-term position trading
- Simple rule: Lower number = more signals. Higher number = fewer, but stronger signals.
SIGNALS
🟢 "BUY Label" (Down Fractal)
- Marks swing lows and potential support zones
- Look for price bouncing up after the fractal forms
- Use for identifying pullback entry points in uptrends
- Place stops below recent BUY fractals
🔴 "SELL Label" (Up Fractal)
- Marks swing highs and potential resistance zones
- Look for price rejecting down after the fractal forms
- Use for identifying profit targets or short entries
- Place stops above recent SELL fractals
REPAINTING BEHAVIOR
⚠️ This indicator repaints by design. Fractals require N bars on both sides to confirm, so they appear N bars after the actual pivot point. This is normal and ensures accurate pivot identification. Wait for complete confirmation before trading.
TRADING APPLICATIONS
1. Support/Resistance: Mark key price levels for entries and exits
2. Market Structure: higher BUY fractals = uptrend, lower SELL fractals = downtrend
3. Stop Placement: Use recent fractals as logical stop-loss levels
4. Breakout Trading: Monitor price breaking above/below fractal levels
5. Trend Following: Enter on pullbacks to BUY fractals in uptrends
6. Swing Trading: Identify major swing points for position entries
CUSTOMIZATION OPTIONS
• Show BUY/SELL Labels**: Toggle professional text labels on/off
• Show Shapes: Toggle arrow shapes independently
• Offset (ticks): Adjust label distance from price bars for perfect positioning
• Colors: Customize backgrounds (default: teal/maroon) and text (default: white/yellow)
• Label Size: Choose from tiny, small, normal, large, or huge
The high-contrast default colors provide excellent visibility without adjustment, but full customization is available to match any chart theme.
Key Settings
Periods (n) (default: 2): Number of bars on each side of pivot. Lower = more signals, Higher = fewer, stronger signals
Show BUY/SELL Labels (default: ON): Display professional text labels
Show Shapes (default: ON): Display arrow shapes
BUY offset (ticks) (default: 8): Distance BUY labels appear below lows
SELL offset (ticks) (default: 8): Distance SELL labels appear above highs
Colors: Full customization - defaults optimized for visibility
Label size (default: normal): Visual prominence control
Key Features
✅ Professional pivot fractal detection
✅ Fully customizable Buy/Sell labels
✅ Independent toggle for labels and shapes
✅ Tick-based offset positioning
✅ High-contrast color scheme
✅ Works on all timeframes and instruments
✅ Clean, intuitive interface
✅ Adjustable sensitivity
✅ Perfect for support/resistance identification
✅ Ideal for market structure analysis

Liquidity Sweeps [Kodexius]Liquidity Sweeps is a price action indicator built to visualize and react to common “stop run” behavior around recent swing highs and swing lows. It continuously detects pivot-based liquidity levels (recent resistance and support), extends them forward in time, and then classifies the interaction when price probes beyond a level but fails to hold through it.
The script focuses on two outcomes:
Buy-Side Liquidity Sweep (BSL): price takes liquidity above a recent swing high (high breaks above the level) but closes back at or below the level.
Sell-Side Liquidity Sweep (SSL): price takes liquidity below a recent swing low (low breaks below the level) but closes back at or above the level.
To support real trading workflows, it keeps charts readable by limiting active levels, offers clean styling options, and optionally filters sweep signals using relative volume (RVOL) so you can require participation before a sweep is considered valid.
🔹 Features
🔸 Pivot-Based Liquidity Level Detection (Swing Highs and Swing Lows)
The indicator uses a user-defined Pivot Length to identify confirmed swing points:
Pivot Highs become resistance liquidity levels (buy-side liquidity above highs).
Pivot Lows become support liquidity levels (sell-side liquidity below lows).
Each detected level is drawn as a horizontal line and automatically extended to the current bar until it is swept or broken.
🔸 Automatic Level Management (De-Cluttering)
To prevent chart overload, the script stores levels in internal arrays and enforces Maximum Active Levels:
When new levels are added and the limit is exceeded, the oldest level is removed.
This keeps only the most relevant, recent liquidity zones visible.
🔸 Clear Sweep Classification (BSL and SSL)
The sweep logic is intentionally strict and practical:
- BSL Sweep triggers when the bar’s high is above resistance but the close is back below or at resistance.
- SSL Sweep triggers when the bar’s low is below support but the close is back above or at support.
This models the “probe and reject” behavior typical of liquidity grabs.
🔸 Optional Volume Confirmation Using RVOL
When Enable Volume Filter is turned on, sweeps are only valid if the current bar’s volume is strong relative to the last 20 bars:
The script computes a 20-period volume average.
You can require volume to exceed the average by a chosen Volume Multiplier (example: 1.5 means 150% of the average).
If the filter is disabled, sweeps are evaluated purely on price conditions.
🔸 Sweep Labels and Level Highlighting
On a valid sweep:
A label is printed on the sweep bar:
- ▼ BSL for buy-side liquidity sweeps (yellow)
- ▲ SSL for sell-side liquidity sweeps (blue)
The swept level is highlighted by drawing an additional colored line over the swept range.
The script also prints the bar’s RVOL percentage near the midpoint of the swept line segment:
- BSL volume text is placed above the line midpoint
- SSL volume text is placed below the line midpoint
This makes it easy to see whether a sweep was low-effort or supported by strong participation.
🔸 Styling Controls
You can fully tailor the visual output:
Resistance and support line colors
Line style selection: Solid, Dotted, Dashed
Toggle sweep labels on or off
🔸 Alerts
The indicator exposes alert conditions for both sweep types and also fires explicit alert messages once per bar close when a sweep is confirmed:
- Buy Liquidity Sweep (BSL)
- Sell Liquidity Sweep (SSL)
🔹 Calculations
1) Pivot High / Pivot Low Detection
float ph = ta.pivothigh(high, pivotPeriodInput, pivotPeriodInput)
float pl = ta.pivotlow(low, pivotPeriodInput, pivotPeriodInput)
Interpretation:
A pivot is only confirmed after pivotPeriodInput bars have passed.
Once confirmed, the level is anchored at the pivot bar and then extended forward.
2) Creating and Storing Liquidity Levels
New Resistance (Pivot High):
if not na(ph)
line newL = line.new(bar_index , ph, bar_index, ph,
color = resistanceColorInput, width = 1, style = getLineStyle(lineStyleInput))
resistanceLevels.push(LiquidityLevel.new(ph, bar_index , newL))
if resistanceLevels.size() > maxLinesInput
(resistanceLevels.shift()).delete()
New Support (Pivot Low):
if not na(pl)
line newL = line.new(bar_index , pl, bar_index, pl,
color = supportColorInput, width = 1, style = getLineStyle(lineStyleInput))
supportLevels.push(LiquidityLevel.new(pl, bar_index , newL))
if supportLevels.size() > maxLinesInput
(supportLevels.shift()).delete()
This enforces the “Maximum Active Levels” limit by deleting the oldest stored level when the cap is exceeded.
3) Relative Volume (RVOL) and Volume Filter
float volAvg = ta.sma(volume, 20)
float volRelative = (volume / volAvg) * 100
bool isVolStrong = not useVolFilterInput or (volume > volAvg * volMultiplierInput)
volRelative expresses the sweep bar’s volume as a percentage of the last 20-bar average.
If the filter is enabled, a sweep is valid only when isVolStrong is true.
4) Sweep Conditions (Core Logic)
Buy-Side Liquidity Sweep (Resistance Sweep)
A resistance level is considered swept when price trades above it but closes back at or below it.
bool priceSwept = high > lvl.price and close <= lvl.price
bool broken = close > lvl.price
priceSwept captures the “probe and reject” behavior.
broken invalidates the level if price closes above it.
The confirmation and cleanup flow:
if priceSwept and isVolStrong
buySweepOccurred := true
if showLabelsInput
label.new(bar_index, high, "▼ BSL",
style = label.style_label_down, color = #00000000,
textcolor = C_SWEEP_BUY, size = size.small)
line.new(lvl.startBar, lvl.price, bar_index, lvl.price, color = C_SWEEP_BUY, width = 1)
int midX = math.round((lvl.startBar + bar_index) / 2)
label.new(midX, lvl.price, str.tostring(volRelative, "#") + "% VOL",
color = #00000000, textcolor = color.new(C_SWEEP_BUY, 20),
style = label.style_label_down, size = size.tiny)
resistanceLevels.remove(i).delete()
else if broken
resistanceLevels.remove(i).delete()
Sell-Side Liquidity Sweep (Support Sweep)
A support level is considered swept when price trades below it but closes back at or above it.
bool priceSwept = low < lvl.price and close >= lvl.price
bool broken = close < lvl.price
The confirmation and cleanup flow:
if priceSwept and isVolStrong
sellSweepOccurred := true
if showLabelsInput
label.new(bar_index, low, "▲ SSL",
style = label.style_label_up, color = #00000000,
textcolor = C_SWEEP_SELL, size = size.small)
line.new(lvl.startBar, lvl.price, bar_index, lvl.price, color = C_SWEEP_SELL, width = 1)
int midX = math.round((lvl.startBar + bar_index) / 2)
label.new(midX, lvl.price, str.tostring(volRelative, "#") + "% VOL",
color = #00000000, textcolor = color.new(C_SWEEP_SELL, 20),
style = label.style_label_up, size = size.tiny)
supportLevels.remove(i).delete()
else if broken
supportLevels.remove(i).delete()
5) Level Extension to Current Bar
method update(LiquidityLevel this) =>
line.set_x2(this.lineObj, bar_index)
This keeps each active liquidity level extended to the current candle until it is swept or decisively broken.
6) Alerts
alertcondition(buySweepOccurred, "Buy Liquidity Sweep", "BSL Swept!")
alertcondition(sellSweepOccurred, "Sell Liquidity Sweep", "SSL Swept!")
if buySweepOccurred
alert("Kodexius BSL Sweep: " + str.tostring(close), alert.freq_once_per_bar_close)
if sellSweepOccurred
alert("Kodexius SSL Sweep: " + str.tostring(close), alert.freq_once_per_bar_close)

Interest ZonesThis indicator automatically identifies and plots "Interest Zones" around significant pivot highs and lows, representing potential areas of institutional interest, support/resistance, or accumulation/distribution. Zones are dynamically merged when pivots cluster near the same price level and extended for visibility.
How It Works (Technical Methodology)
Pivot Point Detection
The indicator uses Pine Script's ta.pivothigh() and ta.pivotlow() with asymmetric left/right lengths (default left=20, right=13) to detect swing highs and lows. This allows for customizable sensitivity – longer left for stronger confirmation, shorter right for faster detection.
Zone Start Condition (Filtering)
Multiple modes control from which point in history zones begin to be drawn:
"None": All historical pivots (limited by max zones).
"Auto (Start of Day)": Zones only from the beginning of the current trading day (resets daily).
"Manual Date": User-defined fixed date.
"Interactive (Chart)": User-confirmed date via input (useful for backtesting specific periods).
"Last X Bars": Only pivots within the last user-defined number of bars (default 400).
A vertical line marks the start point in date-based modes for visual reference.
Zone Construction
For each valid pivot:
Zone thickness is based on ATR(14) × user-defined multiplier (default 0.3) for dynamic, volatility-adjusted height.
Pivot High zones: Centered below the high (potential supply/resistance).
Pivot Low zones: Centered above the low (potential demand/support).
Zones are drawn as boxes extending to the right, with gray fill and border.
Merge & Overlap Logic
When a new pivot falls inside an existing zone or is very close (within user-defined "Proximity Sensitivity %" of the zone's midpoint, default 1.1%):
The new pivot is merged into the existing zone.
A counter ("x2", "x3", etc.) is displayed on the zone, indicating how many pivots have clustered there.
The zone is strengthened visually (counter text) and extended further right.
This highlights high-interest levels where price repeatedly reversed.
Zone Management
In "None" mode: Only the most recent user-defined max zones are kept (default 5) – oldest deleted automatically.
In other modes: Up to ~490 zones (performance limit), oldest pruned if exceeded.
All zones auto-extend to the right on the last bar for continuous visibility.
Visual Elements
Uniform gray color for all zones (configurable).
Transparent background fill (adjustable).
Counter text in white (configurable) when zones have multiple touches.
Clean, non-directional design – focuses purely on clustered reversal points.
How to Use
Interest Zones highlight price levels where the market has shown repeated respect through multiple swing pivots – often coinciding with institutional order clusters, psychological levels, or hidden support/resistance.
Higher counter values ("x3+", "x5+"): Stronger zones – higher probability of reaction on retest.
Use for:
Potential reversal or bounce areas when price approaches a zone.
Confluence with other tools (order blocks, FVG, volume profile, etc.).
Stop-loss placement beyond zones or take-profit at opposite zones.
Daily reset ("Auto Start of Day"): Ideal for intraday trading – fresh zones each session.
Backtesting: Use "Manual" or "Interactive" date modes to analyze specific historical periods.
"Last X Bars": Good for medium-term swing analysis without full history clutter.
Adjust ATR multiplier for tighter (lower) or wider (higher) zones based on asset volatility. Increase proximity sensitivity for more aggressive merging in ranging markets.
Combine with trend direction, volume, or higher-timeframe structure for best results.
Disclaimer
This indicator is a technical analysis tool and should be used in conjunction with other forms of analysis. Past performance does not guarantee future results. Always use proper risk management.

SMC Academy [PhenLabs]📊 SMC Academy
Version: PineScript™ v6
📌 Description
The SMC Academy indicator is a comprehensive educational tool designed to demystify Smart Money Concepts (SMC) for traders of all levels. Unlike standard indicators that simply print signals, this script uses a “Learning Phase” system that allows users to toggle between individual concepts—such as Market Structure, Liquidity, Imbalances, and Order Blocks—or view them all simultaneously. It lets you focus on one piece of the puzzle at a time.
🚀 Points of Innovation
Progressive Learning Modes: Toggle between 5 distinct phases to master concepts individually before using the Full Strategy Mode.
Educational Tooltips: Hover over labels to read detailed explanations of why a BOS, MSS, or Liquidity zone was identified.
Smart Filtering: Uses ATR and Volume integration to filter out low-quality Fair Value Gaps and weak Order Blocks.
HTF Dashboard: A built-in panel analyzes Higher Timeframe (4H) data to ensure you are trading in alignment with the broader trend.
🔧 Core Components
Market Structure Engine: Automatically detects Swing Highs and Lows to map out market direction using configurable swing lengths.
Liquidity Manager: Identifies unmitigated swing points that serve as Buy-Side (BSL) and Sell-Side (SSL) liquidity magnets.
Imbalance Detector: Highlights Fair Value Gaps (FVG) where price inefficiencies exist, using ATR thresholds to ignore noise.
Order Block Identifier: Locates the specific candles responsible for structure breaks, validated by volume analysis.
🔥 Key Features
Break of Structure (BOS): Automatically marks trend continuation signals with solid lines and color-coded labels.
Market Structure Shift (MSS): Identifies potential trend reversals when significant swing points are breached.
Dashboard Context: Displays the current trend direction and the 4H context directly on your chart.
Custom Alerts: Built-in alert conditions for structure breaks and new Order Blocks allow for automated tracking.
🎨 Visualization
Structure Lines: Solid lines indicate confirmed breaks (Green for Bullish, Red for Bearish).
Liquidity Zones: Dotted lines extending rightward indicate resting liquidity levels that price may target.
FVG Boxes: Shaded boxes highlight imbalance zones, automatically extending for a user-defined number of bars.
Dashboard: A clean, non-intrusive table in the top-right corner displays trend status and active mode.
📖 Usage Guidelines
Setting Categories
Learning Mode: Select from ‘1. Market Structure’ through ‘5. Full Strategy Mode’ to filter what appears on the chart.
Swing Detection Length: Default (5). Determines the sensitivity of the swing high/low detection.
Structure Break Type: Options (Close/Wick). Choose whether a candle close or just a wick is required to confirm a break.
Min FVG Size: Default (0.5 ATR). Filters out gaps smaller than this multiplier to reduce noise.
Filter Weak OBs by Volume: Default (True). Only highlights Order Blocks where volume exceeds the 20-period average.
✅ Best Use Cases
Educational Study: Isolate “Phase 1: Market Structure” to practice identifying trend changes without distraction.
Trend Following: Use “Phase 3: Imbalances” to find entry points within an established trend.
Reversal Trading: Combine “Phase 2: Liquidity” and “Phase 4: Order Blocks” to catch reversals at key levels.
⚠️ Limitations
Subjectivity: Market structure can be interpreted differently depending on the swing length settings used.
Ranging Markets: Like all trend-following concepts, false BOS/MSS signals may generate during choppy, sideways price action.
Repainting: While the signals are non-repainting once confirmed, the live candle may flash a signal before the close if “Close” mode is selected.
💡 What Makes This Unique
Interactive Learning: The inclusion of tooltip explanations transforms this from a simple tool into an active mentor.
Phase-Based Workflow: The ability to strip the chart back to basics at the click of a button is unique to the PhenLabs ecosystem.
🔬 How It Works
Swing Analysis: The script calculates pivot highs and lows based on your length input to define the structural landscape.
Break Validation: It checks if price crosses these pivot points to trigger BOS (Continuation) or MSS (Reversal) logic.
Volume Confirmation: For Order Blocks, it looks back inside the swing leg to find the specific candle responsible for the move, verifying it has significant volume.
💡 Note:
For the best experience, start in Phase 1 to calibrate your Swing Detection Length to the specific volatility of the asset you are trading before enabling Full Strategy Mode.

Wyckoff Method - Comprehensive Analysis# WYCKOFF METHOD - QUICK REFERENCE CHEAT SHEET
## 🟢 STRONGEST BUY SIGNALS
### 1. SPRING ⭐⭐⭐⭐⭐
- **What:** False breakdown below support on LOW volume
- **Look for:** Quick reversal, close above support
- **Entry:** When price closes back in range
- **Stop:** Below spring low
- **Target:** Top of range minimum
### 2. SOS (Sign of Strength) ⭐⭐⭐⭐
- **What:** Breakout above resistance on HIGH volume
- **Look for:** Wide spread up bar, strong close
- **Entry:** On breakout or wait for LPS pullback
- **Stop:** Below range top
- **Target:** Height of range projected up
### 3. SHAKEOUT ⭐⭐⭐⭐
- **What:** Sharp move below support with HIGH volume, immediate reversal
- **Look for:** Long lower wick, closes strong
- **Entry:** When price reclaims support
- **Stop:** Below shakeout low
- **Target:** Previous resistance
---
## 🔴 STRONGEST SELL SIGNALS
### 1. UTAD (Upthrust After Distribution) ⭐⭐⭐⭐⭐
- **What:** False breakout above resistance, quick rejection
- **Look for:** Spike high, weak close, often high volume
- **Entry:** When price closes back in range
- **Stop:** Above UTAD high
- **Target:** Bottom of range minimum
### 2. SOW (Sign of Weakness) ⭐⭐⭐⭐
- **What:** Breakdown below support on HIGH volume
- **Look for:** Wide spread down bar, weak close
- **Entry:** On breakdown or wait for LPSY rally
- **Stop:** Above range bottom
- **Target:** Height of range projected down
### 3. UPTHRUST ⭐⭐⭐⭐
- **What:** Move above resistance on LOW volume, weak close
- **Look for:** Long upper wick, closes in lower half
- **Entry:** When resistance holds
- **Stop:** Above upthrust high
- **Target:** Support level
---
## 📊 ACCUMULATION PHASES (Bottom Formation)
```
PHASE A: Stopping the Downtrend
├─ PS (Preliminary Support) - First buying
├─ SC (Selling Climax) - Panic bottom ⚠️ KEY EVENT
├─ AR (Automatic Rally) - Relief bounce
└─ ST (Secondary Test) - Retest SC low
PHASE B: Building the Cause
├─ Trading range forms
├─ Multiple tests of support
├─ Volume decreasing
└─ Absorption occurring
PHASE C: The Test
├─ SPRING - False breakdown ⚠️ KEY EVENT
└─ TEST - Support holds on low volume
PHASE D: Dominance Emerges
├─ SOS - Breakout ⚠️ KEY EVENT
├─ LPS - Last Point of Support (pullback)
└─ BU - Backup
PHASE E: Markup
└─ New uptrend, strong momentum
```
**Background Color:** Blue → Green (getting brighter)
**Action:** Buy in Phase C/D, Hold through Phase E
---
## 📊 DISTRIBUTION PHASES (Top Formation)
```
PHASE A: Stopping the Uptrend
├─ PSY (Preliminary Supply) - First selling
├─ BC (Buying Climax) - Euphoric top ⚠️ KEY EVENT
├─ AR (Automatic Reaction) - Sharp drop
└─ ST (Secondary Test) - Retest BC high
PHASE B: Building the Cause
├─ Trading range forms
├─ Multiple tests of resistance
├─ Demand being absorbed
└─ Volume patterns change
PHASE C: The Test
└─ UTAD - False breakout ⚠️ KEY EVENT
PHASE D: Dominance Emerges
├─ SOW - Breakdown ⚠️ KEY EVENT
└─ LPSY - Last Point of Supply (rally to exit)
PHASE E: Markdown
└─ New downtrend, strong selling
```
**Background Color:** Orange → Red (getting darker)
**Action:** Sell in Phase C/D, Stay out during Phase E
---
## 💰 VOLUME SPREAD ANALYSIS (VSA)
| Signal | Meaning | Color | Implication |
|--------|---------|-------|-------------|
| **ND** (No Demand) | Up bar, LOW volume | 🟠 Orange | Weakness - uptrend ending |
| **NS** (No Supply) | Down bar, LOW volume | 🔵 Blue | Strength - downtrend ending |
| **SV** (Stopping Volume) | VERY HIGH volume, narrow spread | 🟣 Purple | Potential reversal |
| **UT** (Upthrust) | Above resistance, LOW vol, weak close | 🔴 Red | Sell signal |
| **SO** (Shakeout) | Below support, HIGH vol, strong close | 🟢 Green | Buy signal |
---
## 🎯 VOLUME INTERPRETATION
| Volume Level | Bar Color | Meaning |
|--------------|-----------|---------|
| **VERY HIGH** (>2x average) | Dark Green/Red | Climax, potential reversal |
| **HIGH** (>1.5x average) | Light Green/Red | Strong interest |
| **NORMAL** | Gray | Average trading |
| **LOW** (<0.7x average) | Faint Gray | Testing, no interest |
---
## ⚖️ EFFORT vs RESULT
| Scenario | Volume | Spread | Meaning |
|----------|--------|--------|---------|
| **High Effort, Low Result** | HIGH | Narrow | ⚠️ Potential reversal |
| **Low Effort, High Result** | LOW | Wide | ⚠️ Trend weakening |
| **High Effort, High Result** | HIGH | Wide | ✅ Strong trend |
| **Low Effort, Low Result** | LOW | Narrow | 😴 No interest |
---
## 📏 TRADING RULES
### ✅ DO:
- ✅ Wait for confirmation before entering
- ✅ Trade in direction of higher timeframe
- ✅ Use springs and UTAD as primary signals
- ✅ Measure trading range for targets
- ✅ Place stops outside the range
- ✅ Look for volume confirmation
- ✅ Check multiple timeframes
- ✅ Focus on Phase C and D events
### ❌ DON'T:
- ❌ Buy during Phase E Markdown
- ❌ Sell during Phase E Markup
- ❌ Trade against major trend
- ❌ Ignore volume signals
- ❌ Enter without clear stop loss
- ❌ Trade every signal
- ❌ Use on very low timeframes without practice
- ❌ Ignore the context
---
## 🎪 COMPOSITE OPERATOR (Smart Money)
### 💰 Green Money Symbol (Bottom)
- **Meaning:** Institutions accumulating
- **Location:** Demand zones, springs, tests
- **Action:** Follow the smart money - buy
### 💰 Red Money Symbol (Top)
- **Meaning:** Institutions distributing
- **Location:** Supply zones, UTAD, weak rallies
- **Action:** Follow the smart money - sell
---
## 📍 SUPPLY & DEMAND ZONES
### 🟢 Demand Zones (Green Boxes)
- **Created at:** SC, Spring, Shakeout
- **Represents:** Where smart money bought
- **Action:** Look for bounces
### 🔴 Supply Zones (Red Boxes)
- **Created at:** BC, UTAD, Upthrust
- **Represents:** Where smart money sold
- **Action:** Look for rejections
---
## 🎯 TARGET CALCULATION
### Measured Move Method
```
1. Measure trading range height
Example: Top at 120, Bottom at 100 = 20 points
2. Add to breakout point (accumulation)
Breakout at 120 + 20 = Target: 140
3. Or subtract from breakdown (distribution)
Breakdown at 100 - 20 = Target: 80
```
### Multiple Targets
- **Conservative:** 1x range height (100% probability reached)
- **Moderate:** 1.5x range height (70% probability)
- **Aggressive:** 2x range height (40% probability)
---
## ⏰ TIMEFRAME GUIDE
| Timeframe | Use For | Reliability | Recommended For |
|-----------|---------|-------------|-----------------|
| **Weekly** | Major trends | ⭐⭐⭐⭐⭐ | Position traders |
| **Daily** | Swing trades | ⭐⭐⭐⭐⭐ | Most traders |
| **4-Hour** | Active swing | ⭐⭐⭐⭐ | Active traders |
| **1-Hour** | Day trading | ⭐⭐⭐ | Experienced only |
| **15-Min** | Scalping | ⭐⭐ | Experts only |
**Golden Rule:** Always check one timeframe higher for context!
---
## 🚨 ALERT PRIORITY
### 🔔 MUST-HAVE ALERTS
1. Spring
2. UTAD
3. SOS
4. SOW
### 🔔 NICE-TO-HAVE ALERTS
5. Selling Climax (SC)
6. Buying Climax (BC)
7. Smart Money Accumulation
8. Smart Money Distribution
### 🔔 CONFIRMATION ALERTS
9. Phase E Markup
10. Phase E Markdown
---
## 💡 QUICK DECISION TREE
```
Is there a clear trading range?
├─ YES
│ ├─ Did price break BELOW support?
│ │ ├─ Volume LOW + Quick reversal = SPRING → BUY ✅
│ │ └─ Volume HIGH + Stays down = Breakdown → SELL ⚠️
│ │
│ └─ Did price break ABOVE resistance?
│ ├─ Volume LOW + Quick reversal = UTAD → SELL ✅
│ └─ Volume HIGH + Stays up = Breakout → BUY ⚠️
│
└─ NO
├─ Strong uptrend = Wait for re-accumulation
└─ Strong downtrend = Wait for re-distribution
```
---
## 📝 PRE-TRADE CHECKLIST
Before entering any trade:
- Identified the current Wyckoff phase
- Confirmed with volume analysis
- Checked higher timeframe trend
- Located supply/demand zones
- Identified clear entry point
- Set stop loss level
- Calculated target (risk:reward >1:2)
- Verified position size (risk 1-2%)
- Have at least 2 confirming signals
- Not trading against major trend
---
## 🧠 REMEMBER
**The Three Laws:**
1. **Supply & Demand** - Price is determined by imbalance
2. **Cause & Effect** - Range size predicts move size
3. **Effort & Result** - Volume should confirm price movement
**The Key Principle:**
> "Trade with the Composite Operator (smart money), not against them"
**Best Setups:**
1. Spring in accumulation (Phase C)
2. UTAD in distribution (Phase C)
3. SOS breakout (Phase D)
4. SOW breakdown (Phase D)
**When in Doubt:**
- ❓ Stay out
- 📈 Use higher timeframe
- 📚 Review the documentation
- 🎯 Wait for clearer signal
---
## 📱 INDICATOR SETTINGS QUICK SETUP
**For Stocks/Crypto (Good Volume Data):**
- Volume MA Length: 20
- High Volume Multiplier: 1.5
- Climax Volume: 2.0
- Swing Length: 5
**For Forex (Limited Volume Data):**
- Volume MA Length: 20
- High Volume Multiplier: 1.3
- Climax Volume: 1.8
- Swing Length: 7
- Turn OFF "Volume Confirmation"
**For Day Trading:**
- Swing Length: 3
- All other settings: Default
**For Position Trading:**
- Swing Length: 7-10
- Volume MA Length: 30
- Use Daily/Weekly charts
---
## 🎓 SKILL PROGRESSION
### Beginner (Month 1-2)
- Focus on: SC, Spring, SOS
- Timeframe: Daily only
- Goal: Identify phases correctly
### Intermediate (Month 3-6)
- Add: All accumulation events
- Timeframe: Daily + 4H
- Goal: Trade springs profitably
### Advanced (Month 6-12)
- Add: Distribution events, VSA
- Timeframe: Multiple timeframes
- Goal: Trade complete cycles
### Expert (Year 2+)
- Master: All events, all timeframes
- Combine: With other methodologies
- Goal: Consistent profitability
---
**Print this sheet and keep it next to your trading desk!**
*Remember: Quality over quantity. Wait for the best setups.*
# Wyckoff Method - Comprehensive Analysis Indicator
## Complete Implementation Guide for TradingView Pine Script
---
## TABLE OF CONTENTS
1. (#overview)
2. (#installation)
3. (#theory)
4. (#components)
5. (#signals)
6. (#strategies)
7. (#settings)
8. (#alerts)
9. (#patterns)
10. (#troubleshooting)
---
## OVERVIEW
This indicator implements Richard Wyckoff's complete trading methodology, including:
- **All 5 Phases** of Accumulation and Distribution
- **18+ Wyckoff Events** (PS, SC, AR, ST, Spring, SOS, LPS, BC, UTAD, SOW, etc.)
- **Volume Spread Analysis (VSA)** principles
- **Supply & Demand Zone** detection
- **Composite Operator** logic (Smart Money tracking)
- **Effort vs Result** analysis
- **Three Wyckoff Laws**: Supply/Demand, Cause/Effect, Effort/Result
---
## INSTALLATION
### Step 1: Copy the Code
1. Open the `wyckoff_comprehensive.pine` file
2. Select all code (Ctrl+A / Cmd+A)
3. Copy to clipboard (Ctrl+C / Cmd+C)
### Step 2: Add to TradingView
1. Go to TradingView.com
2. Open any chart
3. Click "Pine Editor" at the bottom of the screen
4. Click "New" or "Open"
5. Paste the entire code
6. Click "Save" and give it a name
7. Click "Add to Chart"
### Step 3: Verify Installation
You should see:
- Labels on the chart (PS, SC, Spring, SOS, etc.)
- Background colors indicating phases
- Volume analysis in the lower pane
- A table in the top-right corner showing current phase
---
## WYCKOFF METHOD THEORY
### The Three Fundamental Laws
#### 1. **Law of Supply and Demand**
- Price rises when demand exceeds supply
- Price falls when supply exceeds demand
- The indicator tracks volume vs price movement to identify imbalances
#### 2. **Law of Cause and Effect**
- A period of accumulation (cause) leads to markup (effect)
- A period of distribution (cause) leads to markdown (effect)
- Trading ranges build "cause" for future price movement
#### 3. **Law of Effort vs Result**
- **Effort** = Volume (energy put into the market)
- **Result** = Price movement (spread of the bar)
- High effort with low result = potential reversal
- Low effort with high result = trend weakness
### The Five Phases
#### **ACCUMULATION CYCLE**
**Phase A: Stopping the Downtrend**
- Preliminary Support (PS): First sign of buying
- Selling Climax (SC): Panic selling exhaustion
- Automatic Rally (AR): Bounce from SC
- Secondary Test (ST): Test of SC low on lower volume
**Phase B: Building the Cause**
- Trading range develops
- Supply being absorbed by composite operator
- Multiple tests of support and resistance
- Volume generally decreases
**Phase C: The Test (Spring)**
- False breakdown below support
- Traps late sellers
- Quick reversal on low volume
- Last chance to accumulate before markup
**Phase D: Dominance Emerges**
- Sign of Strength (SOS): Break above resistance
- Last Point of Support (LPS): Pullback opportunity
- Backup (BU): Final consolidation
- Demand clearly exceeds supply
**Phase E: Markup**
- New uptrend established
- Price moves rapidly higher
- Phase E can last months/years
- Original trading range becomes support
#### **DISTRIBUTION CYCLE**
**Phase A: Stopping the Uptrend**
- Preliminary Supply (PSY): First sign of selling
- Buying Climax (BC): Euphoric buying exhaustion
- Automatic Reaction (AR): Sharp selloff from BC
- Secondary Test (ST): Test of BC high on lower volume
**Phase B: Building the Cause**
- Trading range at top
- Demand being absorbed by composite operator
- Multiple tests of support and resistance
**Phase C: The Test (UTAD)**
- Upthrust After Distribution
- False breakout above resistance
- Traps late buyers
- Quick reversal
**Phase D: Dominance Emerges**
- Sign of Weakness (SOW): Break below support
- Last Point of Supply (LPSY): Rally opportunity to exit
- Supply clearly exceeds demand
**Phase E: Markdown**
- New downtrend established
- Price moves rapidly lower
- Original trading range becomes resistance
---
## INDICATOR COMPONENTS
### 1. EVENT LABELS
#### Accumulation Events (Green labels)
- **PS** = Preliminary Support
- **SC** = Selling Climax (largest label, most important)
- **AR** = Automatic Rally
- **ST** = Secondary Test
- **SPRING** = Spring (critical buy signal)
- **TEST** = Test of support
- **SOS** = Sign of Strength (breakout)
- **LPS** = Last Point of Support
- **BU** = Backup
#### Distribution Events (Red labels)
- **PSY** = Preliminary Supply
- **BC** = Buying Climax (largest label, most important)
- **AR** = Automatic Reaction
- **ST** = Secondary Test
- **UTAD** = Upthrust After Distribution (critical sell signal)
- **SOW** = Sign of Weakness
- **LPSY** = Last Point of Supply
#### VSA Events (Small colored labels)
- **ND** (Orange) = No Demand - weakness
- **NS** (Blue) = No Supply - strength
- **SV** (Purple) = Stopping Volume
- **UT** (Red) = Upthrust - weakness
- **SO** (Green) = Shakeout - strength
#### Composite Operator (💰 symbols)
- Green 💰 at bottom = Smart Money Accumulation
- Red 💰 at top = Smart Money Distribution
### 2. BACKGROUND COLORS
- **Light Blue** = Phase A (Accumulation)
- **Light Orange** = Phase A (Distribution)
- **Very Light Green** = Phase C (Accumulation Testing)
- **Very Light Red** = Phase C (Distribution Testing)
- **Light Green** = Phase D (Accumulation Strength)
- **Light Red** = Phase D (Distribution Weakness)
- **Green** = Phase E (Markup - Bull trend)
- **Red** = Phase E (Markdown - Bear trend)
### 3. SUPPLY & DEMAND ZONES
- **Green boxes** = Demand zones (where smart money accumulated)
- **Red boxes** = Supply zones (where smart money distributed)
- Zones extend 20 bars into the future
- Price reactions at these zones are significant
### 4. VOLUME PANEL
- **Dark Green/Red bars** = Very High Volume (climax)
- **Light Green/Red bars** = High Volume
- **Gray bars** = Normal Volume
- **Faint Gray bars** = Low Volume
- **Blue line** = Volume Moving Average
### 5. INFORMATION TABLE (Top Right)
Displays real-time analysis:
- **Current Phase** (A, B, C, D, or E)
- **Status** (description of what's happening)
- **Volume** (Very High, High, Normal, Low)
- **Spread** (Wide, Normal, Narrow)
- **Effort/Result** (Poor, Normal, Good)
- **Range** (YES if in trading range)
- **Bias** (BULLISH, BEARISH, or NEUTRAL)
---
## HOW TO READ THE SIGNALS
### STRONG BUY SIGNALS (in order of strength)
1. **SPRING** (strongest)
- False breakdown below support
- Look for: Low volume, quick reversal, close above support
- Entry: When price closes back above support level
- Stop: Below the spring low
2. **SOS (Sign of Strength)**
- Break above trading range resistance
- Look for: High volume, wide spread up bar
- Entry: On breakout or pullback to LPS
- Stop: Below trading range
3. **Shakeout (SO)**
- Similar to spring but more violent
- Look for: High volume, penetration of support, strong close
- Entry: When price reclaims support
- Stop: Below shakeout low
4. **LPS (Last Point of Support)**
- Pullback after SOS
- Look for: Low volume, shallow pullback
- Entry: When support holds
- Stop: Below LPS
5. **No Supply (NS)**
- Down bar on very low volume
- Indicates lack of selling pressure
- Confirms accumulation phase
### STRONG SELL SIGNALS (in order of strength)
1. **UTAD (Upthrust After Distribution)** (strongest)
- False breakout above resistance
- Look for: High volume spike, rejection, close below resistance
- Entry: When price closes back below resistance
- Stop: Above UTAD high
2. **SOW (Sign of Weakness)**
- Break below trading range support
- Look for: High volume, wide spread down bar
- Entry: On breakdown or rally to LPSY
- Stop: Above trading range
3. **Upthrust (UT)**
- Move above resistance on low volume, weak close
- Look for: Low volume, close in lower half of bar
- Entry: When resistance becomes resistance again
- Stop: Above upthrust high
4. **LPSY (Last Point of Supply)**
- Rally after SOW
- Look for: Low volume, weak rally
- Entry: When rally fails
- Stop: Above LPSY
5. **No Demand (ND)**
- Up bar on very low volume
- Indicates lack of buying pressure
- Confirms distribution phase
### NEUTRAL/WARNING SIGNALS
- **High Effort, Low Result** = Potential reversal coming
- **Stopping Volume** = Trend may be ending
- **Absorption** = Large volume with small movement (accumulation/distribution)
---
## TRADING STRATEGY EXAMPLES
### Strategy 1: Accumulation Range Breakout
**Setup:**
1. Identify trading range (blue background in Phase B)
2. Wait for Spring or Test (Phase C)
3. Wait for SOS breakout (Phase D)
**Entry:**
- Option A: Buy on SOS breakout
- Option B: Wait for LPS pullback (better risk/reward)
**Stop Loss:**
- Below the spring low or trading range bottom
**Target:**
- Measure height of trading range (cause)
- Project upward from breakout point (effect)
- Minimum target = range height
**Example:**
```
Trading Range: 100 to 120 (20 point range)
SOS Breakout at: 120
Target: 120 + 20 = 140 minimum
```
### Strategy 2: Distribution Range Breakdown
**Setup:**
1. Identify trading range after uptrend
2. Wait for UTAD (Phase C)
3. Wait for SOW breakdown (Phase D)
**Entry:**
- Option A: Sell on SOW breakdown
- Option B: Wait for LPSY rally (better risk/reward)
**Stop Loss:**
- Above the UTAD high or trading range top
**Target:**
- Measure height of trading range
- Project downward from breakdown point
- Minimum target = range height
### Strategy 3: Spring Trading
**Setup:**
1. Strong downtrend followed by range
2. Price breaks below range bottom
3. Volume is LOW on breakdown
4. Price quickly reverses and closes above support
**Entry:**
- When candle closes above support level
- Or on retest of support
**Stop Loss:**
- Below spring low (usually tight)
**Target:**
- Top of trading range
- Previous swing high
**Risk/Reward:**
- Typically 1:3 or better
### Strategy 4: Smart Money Tracking
**Setup:**
1. Look for 💰 symbols in demand zones
2. Multiple accumulation signals (PS, SC, ST, Test)
3. Volume decreasing during range
**Entry:**
- At next demand zone test
- On SOS breakout
**Confirmation:**
- Background turning green (Phase D/E)
- Table shows "BULLISH" bias
### Strategy 5: VSA Reversal
**Setup:**
1. Strong trend in place
2. Stopping Volume (SV) appears at extreme
3. Followed by No Demand (ND) or No Supply (NS)
**Entry:**
- When trend breaks down/up
- On retest of extreme
**Example (Bullish):**
```
Downtrend → Stopping Volume → No Supply → Up bar
Entry: Buy when price moves above SV bar
```
---
## SETTINGS & CUSTOMIZATION
### Volume Analysis Settings
**Volume MA Length** (default: 20)
- Shorter = More sensitive to volume changes
- Longer = Smoother, less noise
- Recommended: 15-25 for most timeframes
**High Volume Multiplier** (default: 1.5)
- Threshold for "high volume"
- Lower = More signals
- Higher = Only extreme volume
- Recommended: 1.3-2.0
**Climax Volume Multiplier** (default: 2.0)
- Threshold for climax events (SC, BC)
- Should be significantly higher than normal
- Recommended: 2.0-3.0
### Phase Detection Settings
**Swing Detection Length** (default: 5)
- How many bars to look left/right for swing points
- Shorter = More swings detected (more noise)
- Longer = Fewer swings (cleaner, might miss some)
- Recommended: 3-7
**Range Expansion Threshold** (default: 1.5)
- Multiplier for "wide spread" bars
- Higher = Only very wide bars qualify
- Recommended: 1.3-2.0
**Volume Confirmation** (default: ON)
- Requires volume confirmation for events
- Turn OFF for very low volume instruments
- Keep ON for stocks, forex, crypto
### Display Options
Toggle on/off:
- ✅ **Show Accumulation/Distribution Phases** - Background colors
- ✅ **Show Wyckoff Events** - All labeled events
- ✅ **Show Volume Spread Analysis** - VSA labels
- ✅ **Show Supply/Demand Zones** - Boxes on chart
- ✅ **Show Composite Operator Signals** - 💰 symbols
### Color Customization
- **Bullish Color** - All accumulation events
- **Bearish Color** - All distribution events
- **Neutral Color** - Range/neutral signals
---
## ALERT SETUP
### Available Alerts
1. **Selling Climax (SC)** - Potential bottom forming
2. **Spring** - Strong buy signal
3. **Sign of Strength (SOS)** - Bullish breakout
4. **Buying Climax (BC)** - Potential top forming
5. **UTAD** - Strong sell signal
6. **Sign of Weakness (SOW)** - Bearish breakdown
7. **Phase E Markup** - Uptrend confirmed
8. **Phase E Markdown** - Downtrend confirmed
9. **Smart Money Accumulation** - Institutions buying
10. **Smart Money Distribution** - Institutions selling
### How to Set Up Alerts
1. Click the "⏰" icon on TradingView
2. Select "Create Alert"
3. Condition: Choose the indicator and alert type
4. Example: "Wyckoff Method - Spring"
5. Set notification preferences (popup, email, webhook)
6. Click "Create"
### Recommended Alert Strategy
**Conservative Trader:**
- Spring
- SOS
- UTAD
- SOW
**Aggressive Trader:**
- Add: SC, BC, Smart Money signals
**Long-term Investor:**
- Phase E Markup
- Phase E Markdown
- Smart Money Accumulation
---
## COMMON PATTERNS
### Pattern 1: Classic Accumulation
```
Phase A: Downtrend → PS → SC → AR → ST
Phase B: Range building (4-12 weeks typical)
Phase C: Spring (false breakdown)
Phase D: SOS → LPS → BU
Phase E: Markup (new uptrend)
```
**What to do:**
- Mark the range boundaries
- Wait for spring
- Buy on LPS or SOS
- Hold through markup
### Pattern 2: Classic Distribution
```
Phase A: Uptrend → PSY → BC → AR → ST
Phase B: Range building (topping process)
Phase C: UTAD (false breakout)
Phase D: SOW → LPSY
Phase E: Markdown (new downtrend)
```
**What to do:**
- Mark the range boundaries
- Wait for UTAD
- Sell on LPSY or SOW
- Stay out during markdown
### Pattern 3: Re-Accumulation
```
Uptrend → Trading Range → Spring → Uptrend continues
```
- Occurs during existing uptrend
- Shorter accumulation period
- Often no clear SC (trend is already up)
- Spring is the key signal
### Pattern 4: Re-Distribution
```
Downtrend → Trading Range → UTAD → Downtrend continues
```
- Occurs during existing downtrend
- Shorter distribution period
- Often no clear BC (trend is already down)
- UTAD is the key signal
### Pattern 5: Failed Breakout
**Bullish Failed Breakout:**
```
Range → Breakdown → Immediate reversal (Spring)
```
- Price breaks support
- Volume is LOW
- Immediate strong reversal
- Very bullish
**Bearish Failed Breakout:**
```
Range → Breakout → Immediate reversal (UTAD)
```
- Price breaks resistance
- Volume may be high initially
- Quick rejection and reversal
- Very bearish
---
## TIMEFRAME RECOMMENDATIONS
### Daily Charts (Most Reliable)
- Best for swing trading
- Clear phases and events
- Less noise
- Recommended for beginners
### 4-Hour Charts
- Good for active swing traders
- Faster signals than daily
- Still reliable
### 1-Hour Charts
- For day traders
- More false signals
- Need to filter carefully
- Use in conjunction with higher timeframe
### 15-Minute / 5-Minute
- Only for experienced traders
- High noise level
- Many false signals
- Use daily chart for context
**Golden Rule:** Always check higher timeframe first!
---
## MULTI-TIMEFRAME ANALYSIS
### Top-Down Approach (Recommended)
1. **Weekly Chart** - Identify major trend and phase
2. **Daily Chart** - Find current accumulation/distribution
3. **4H Chart** - Identify entry timing
4. **Entry Timeframe** - Execute trade
### Example Analysis:
**Weekly:** Phase E Markup (bullish)
**Daily:** Phase B Re-accumulation
**4-Hour:** Spring detected
**Action:** Buy on daily LPS
---
## WYCKOFF + OTHER INDICATORS
### Complementary Tools
1. **Moving Averages**
- 20/50 SMA for trend context
- Already plotted on indicator
2. **RSI**
- Divergences at SC/BC
- Confirms overbought/oversold
3. **MACD**
- Confirms trend change in Phase D
- Divergences support Wyckoff events
4. **Volume Profile**
- Identifies value areas
- Confirms supply/demand zones
5. **Order Flow / Footprint Charts**
- See institutional activity
- Confirms smart money signals
**Don't Over-Complicate:**
- Wyckoff is a complete system
- Other indicators are supplementary
- When in doubt, trust Wyckoff
---
## TROUBLESHOOTING
### Issue: Too Many Labels
**Solution:**
- Increase swing length (Settings → 7 or 10)
- Increase volume multipliers
- Turn off VSA labels if not needed
- Focus on major events only (SC, Spring, SOS, BC, UTAD, SOW)
### Issue: Missing Expected Events
**Solution:**
- Decrease swing length (Settings → 3)
- Decrease volume multipliers
- Turn OFF volume confirmation
- Check timeframe (use daily chart)
### Issue: False Signals
**Solution:**
- Use higher timeframe
- Wait for confirmation
- Don't trade against major trend
- Look for multiple signal convergence
### Issue: Can't See Background Colors
**Solution:**
- Check "Show Phases" is enabled
- Increase monitor brightness
- Colors are subtle by design (not to obscure price)
### Issue: Volume Shows Incorrectly
**Solution:**
- Ensure volume data is available for your symbol
- Some symbols have poor volume data
- Forex spot pairs have no real volume
- Use futures or stock markets for best results
### Issue: No Trading Range Detected
**Solution:**
- Market may be trending strongly
- Trading range might be too small
- Wait for price to consolidate
- Not all markets have clear ranges
---
## ADVANCED TIPS
### 1. Count Point & Figure Charts
- Wyckoff used P&F to measure "cause"
- Width of range × height = minimum move target
- Longer accumulation = larger markup
### 2. Watch for Absorption
- High volume + narrow spread = someone absorbing
- In downtrend = accumulation
- In uptrend = distribution
### 3. Multiple Timeframe Springs
- Spring on daily + spring on weekly = very strong
- Increases probability significantly
### 4. Failed Signals Are Signals Too
- Failed spring = weakness, expect lower
- Failed UTAD = strength, expect higher
### 5. Context is King
- Don't buy during Phase E Markdown
- Don't sell during Phase E Markup
- Respect the major trend
### 6. Volume Precedes Price
- Study volume changes first
- Price follows volume
- Decreasing volume in range = building energy
### 7. Composite Operator Mindset
- Think like institutions
- Where would smart money buy/sell?
- They need liquidity (retail traders)
---
## RISK MANAGEMENT
### Position Sizing
**Conservative:**
- Risk 1% per trade
- Wider stops at range boundaries
**Moderate:**
- Risk 1-2% per trade
- Stops below spring/above UTAD
**Aggressive:**
- Risk 2-3% per trade
- Tight stops
- Higher win rate needed
### Stop Loss Placement
**Accumulation:**
- Below spring low
- Below trading range bottom
- Below demand zone
**Distribution:**
- Above UTAD high
- Above trading range top
- Above supply zone
### Take Profit Strategy
**Method 1: Measured Move**
- Range height = minimum target
- 2x range height = extended target
**Method 2: Fibonacci Extensions**
- 1.0 = range height
- 1.618 = extended target
- 2.618 = maximum target
**Method 3: Trail the Stop**
- Move stop to breakeven at 1R
- Trail under swing lows in markup
- Lock in profits progressively
---
## BACKTESTING CHECKLIST
Before trading with real money:
- Backtest on 50+ historical examples
- Record all signals in trading journal
- Calculate win rate (aim for >50%)
- Calculate average R:R (aim for >1:2)
- Test on multiple instruments
- Test on multiple timeframes
- Test in different market conditions
- Verify signal consistency
- Practice on demo account
- Start small with real money
---
## RECOMMENDED READING
### Books
1. **"Studies in Tape Reading"** - Richard D. Wyckoff
2. **"The Richard D. Wyckoff Method"** - Rubén Villahermosa
3. **"Charting the Stock Market: The Wyckoff Method"** - Jack Hutson
4. **"Master the Markets"** - Tom Williams (VSA)
### Courses
1. Wyckoff Analytics - Official Wyckoff course
2. TradeVSA - Volume Spread Analysis
3. StockCharts - Wyckoff education
### Communities
1. Wyckoff Analytics Forum
2. Reddit r/Wyckoff
3. TradingView Wyckoff ideas section
---
## FREQUENTLY ASKED QUESTIONS
**Q: Can I use this on crypto?**
A: Yes, works well on major cryptocurrencies with good volume.
**Q: Does it work on forex?**
A: Yes, but use futures volume (like 6E for EUR/USD) for better accuracy.
**Q: What's the best timeframe?**
A: Daily chart for most traders. 4H for more active trading.
**Q: How long does accumulation last?**
A: Typically 2-12 weeks. Longer accumulation = bigger markup.
**Q: Can I automate this?**
A: You can use the alerts, but manual analysis is recommended.
**Q: What's the win rate?**
A: With proper filtering: 60-70% on major signals (Spring, UTAD, SOS, SOW).
**Q: Should I trade every signal?**
A: No. Focus on Spring, UTAD, SOS, and SOW in trending markets.
**Q: What if I see conflicting signals?**
A: Use higher timeframe for context. When in doubt, stay out.
**Q: How do I know which phase I'm in?**
A: Check the table in top-right corner. Also look at background color.
**Q: Can I use this for options trading?**
A: Yes, excellent for timing option entries (especially around Spring/UTAD).
---
## FINAL THOUGHTS
The Wyckoff Method is:
- **A complete trading system** (not just an indicator)
- **Based on 100+ years** of market wisdom
- **Used by institutions** and professional traders
- **Requires practice** and screen time
- **Highly effective** when applied correctly
**Success Tips:**
1. Start with daily charts
2. Focus on major events (SC, Spring, SOS, BC, UTAD, SOW)
3. Always check higher timeframe context
4. Wait for confirmation before entering
5. Manage risk properly
6. Keep a trading journal
7. Be patient - wait for the best setups
**Remember:**
- Not every range will have all events
- Some phases may be abbreviated
- Context and confluence matter most
- Practice makes perfect
---
## SUPPORT & UPDATES
For questions, improvements, or bug reports:
- Check TradingView script comments
- Join Wyckoff trading communities
- Study historical examples
- Practice on demo accounts
**Good luck and happy trading!**
---
*Disclaimer: This indicator is for educational purposes. Always do your own analysis and risk management. Past performance does not guarantee future results.*
# WYCKOFF VISUAL SETUP EXAMPLES
## ACCUMULATION SCHEMATIC #1 (Classic Bottom)
```
Price Chart View:
│ PHASE E
│ MARKUP
│ ╱
│ ╱
┌─SOS─────┤ ╱
│ │ ╱
┌───────────┤ ┌LPS │╱
│ PHASE B │ │ │
│ (Cause) └──┴──────┤
┌AR──┤ │
┌────┤ │ ┌─Spring │ PHASE D
│ └ST──┤ │ │
│ │ │ │
────SC────────┴─────────┴───────────┴──────────
│
PS
│ PHASE A
│
Downtrend
```
### PHASE A - Stopping the Downtrend
```
PS: │ High volume down bar
▼ First sign of support
■ Not bottom yet
SC: │ VERY HIGH volume
▼ Panic selling exhaustion
█ Long lower wick
█ This is the low
AR: │ Automatic rally
▲ Relief bounce
■ High volume acceptable
ST: │ Secondary test
▼ Low volume (KEY!)
■ Tests SC low
```
### PHASE B - Building the Cause
```
┌─────────┐
│ ~~~ │ Multiple tests
│ ~ ~ │ Volume decreases
│~ ~ │ Range gets tighter
└─────────┘
Duration: 2-12 weeks typical
The longer, the bigger the eventual move
```
### PHASE C - The Test (SPRING)
```
║ False breakdown
─────╨─────
▼ Low volume
█ Breaks below support
■
█ Quick reversal
▲ Closes ABOVE support
CRITICAL: Volume must be LOW
Close must be strong
Happens quickly (1-3 bars)
```
### PHASE D - Strength Emerges
```
SOS: ▲ Sign of Strength
────╥──── Break above resistance
║ High volume
║ Wide spread
LPS: ▼ Last Point Support
■ Pullback on LOW volume
▲ Great entry point
BU: ▲ Backup
■ Final consolidation
▲ Before markup
```
### PHASE E - Markup
```
╱
╱
╱ Strong uptrend
╱ High momentum
╱ Can last months/years
──╱──
```
---
## DISTRIBUTION SCHEMATIC #2 (Classic Top)
```
Price Chart View:
Uptrend
│
PSY
│ PHASE A
────BC────────┬─────────┬───────────┬──────────
│ │ UTAD │
│ PHASE B │ │ PHASE D
┌AR──┤ ┌LPSY │ │
│ │ │ └───────────┤
│ └──┴──────┐ │╲
└ST──┤ │ │ ╲
│ └───────────┤ ╲
└─SOW─────┤ │ ╲
│ │ ╲
│ PHASE C │ ╲
│ │ PHASE E
│ │ MARKDOWN
```
### PHASE A - Stopping the Uptrend
```
PSY: │ High volume up bar
▲ Preliminary supply
■ Selling starting
BC: │ VERY HIGH volume
▲ Buying climax
█ Euphoric top
█ Long upper wick
AR: │ Automatic reaction
▼ Sharp selloff
■ High volume
ST: │ Secondary test
▲ Low volume (KEY!)
■ Tests BC high
```
### PHASE C - The Test (UTAD)
```
▲ False breakout
────╥────
║ Breaks ABOVE resistance
║ Often high volume spike
▼
█ Rejection / weak close
█ Closes BELOW resistance
▼
CRITICAL: Closes weak
Quick rejection
Traps buyers
```
### PHASE D - Weakness Emerges
```
SOW: ▼ Sign of Weakness
────╨──── Break below support
║ High volume
║ Wide spread
LPSY: ▲ Last Point Supply
■ Rally on LOW volume
▼ Last chance to exit
```
---
## VOLUME PATTERNS (Critical to Understanding)
### ACCUMULATION Volume Pattern
```
Volume
│ SC
█
█ ST
■ ■ Spring
■ ■ ■ SOS LPS
──┴────┴────┴──────█───■────►
│ │ │ │ │
│ │ │ │ │
A A C D D
Pattern: HIGH → low → low → HIGH → low
Key: Volume DECREASES during range
INCREASES on breakout
```
### DISTRIBUTION Volume Pattern
```
Volume
│ BC
█
█ ST
■ ■ UTAD
■ ■ ■ SOW LPSY
──┴────┴────┴──────█───■────►
│ │ │ │ │
│ │ │ │ │
A A C D D
Pattern: HIGH → low → varies → HIGH → low
Key: Volume MAY increase on UTAD
Definitely HIGH on breakdown (SOW)
```
---
## REAL TRADE SETUPS
### Setup #1: SPRING BUY
```
Entry Conditions:
1. Clear trading range identified
2. Price breaks BELOW support
3. Volume is LOW (critical!)
4. Price reverses QUICKLY
5. Closes ABOVE support level
Entry: Next bar or on retest
Stop: Below spring low
Target: Top of range (minimum)
Example:
Support: $100
Spring low: $98 (low volume)
Close: $101
Entry: $102
Stop: $97.50
Target: $120 (range top)
Risk/Reward: 1:4
```
### Setup #2: UTAD SELL
```
Entry Conditions:
1. Clear trading range identified (after uptrend)
2. Price breaks ABOVE resistance
3. Often high volume spike
4. Price reverses QUICKLY
5. Closes BELOW resistance level
Entry: Next bar or on retest
Stop: Above UTAD high
Target: Bottom of range (minimum)
Example:
Resistance: $200
UTAD high: $205 (spike)
Close: $198
Entry: $197
Stop: $206
Target: $180 (range bottom)
Risk/Reward: 1:2
```
### Setup #3: SOS BREAKOUT
```
Entry Conditions:
1. Clear accumulation range
2. Spring already occurred (ideal)
3. Price breaks ABOVE resistance
4. HIGH volume on breakout
5. Wide spread up bar
Entry Option A: On breakout ($120)
Entry Option B: Wait for LPS pullback ($115)
Stop: Below range or LPS
Target: Range height projected up
Example:
Range: $100-$120 (20 points)
SOS breakout: $120
Entry A: $120
Stop: $115
Target 1: $140 (100%)
Target 2: $150 (150%)
```
---
## VSA SPECIFIC PATTERNS
### Pattern 1: No Demand (Weakness)
```
▲
■ Up bar
■ Low volume ◄── KEY
▲ Small body
Context: After uptrend
Meaning: Buyers exhausted
Action: Prepare to sell
```
### Pattern 2: No Supply (Strength)
```
▼
■ Down bar
■ Low volume ◄── KEY
▼ Small body
Context: After downtrend
Meaning: Sellers exhausted
Action: Prepare to buy
```
### Pattern 3: Stopping Volume
```
═ Very high volume
█ Narrow spread ◄── KEY
═ Price not moving
Context: At extremes
Meaning: Absorption
Action: Expect reversal
```
---
## COMMON MISTAKES (What NOT to Do)
### ❌ Mistake 1: Buying Prematurely
```
WRONG:
SC
▼
█ ← DON'T BUY HERE
CORRECT:
Spring
─────╨─────
▼
█ ← BUY HERE
▲
```
### ❌ Mistake 2: Ignoring Volume
```
WRONG: "It broke below support, must be spring"
─────╨───── High volume
█
This is a BREAKDOWN, not a spring!
CORRECT Spring:
─────╨───── LOW volume ✓
■ Quick reversal ✓
▲
```
### ❌ Mistake 3: Trading Against Trend
```
WRONG:
Markdown Phase E
╲
╲ ← Trying to buy here
╲
╲
CORRECT:
Wait for new accumulation to complete
```
---
## MULTI-TIMEFRAME EXAMPLE
### Weekly Chart: Phase E Markup (Bullish)
```
╱
╱
╱ Long-term uptrend
╱
───╱─────
```
### Daily Chart: Re-Accumulation Phase C
```
┌─────────┐
│ Spring │ ← We are here
│ ▼ │
─────┴────█────┴─────
▲
```
### 4-Hour Chart: Entry Timing
```
Last 48 hours:
─────╨───── Spring occurred
█
▲ ← Enter now
■
```
**Result:** Triple confirmation across timeframes = High probability trade
---
## PROFIT TARGETS (Visual Guide)
### Method 1: Basic Measured Move
```
Resistance: 120 ┐ ─────────
│
│ 20 points
│
Support: 100 ┘ ─────────
Breakout: 120
Target: 120 + 20 = 140
╱╱╱ 140 (Target)
╱╱╱
╱╱╱
──────◄ 120 (Breakout)
│
Range │ 20
│
──────┘ 100
```
### Method 2: Multiple Targets
```
╱╱╱ 150 (Target 3: 2.5x) - 20% position
╱╱╱
╱╱╱ 140 (Target 2: 2x) - 30% position
╱╱╱
─────◄╱ 130 (Target 1: 1x) - 50% position
│
10 │ 120 (Breakout)
│
─────┘ 110 (Support)
```
### Method 3: Trailing Stop
```
1. Move stop to breakeven at Target 1
2. Trail stop under swing lows
3. Let winners run
╱╱╱
╱ ╱╱ ← Trail stop here
╱╱ ╱
╱ ╱ ← Then here
─────◄──╱
← Start here (breakeven)
```
---
## TIMING ENTRIES (Exact Bar Patterns)
### Perfect Spring Entry
```
Bar 1: ▼ Breaks below (Low vol)
█
Bar 2: ▲ Reverses (Closes strong)
█ ◄─ ENTER HERE
Bar 3: ■ Confirms
▲
DON'T WAIT for Bar 3!
Enter on Bar 2 close
```
### Perfect UTAD Entry
```
Bar 1: ▲ Breaks above (Spike vol OK)
█
Bar 2: ▼ Reverses (Closes weak)
█ ◄─ ENTER HERE
Bar 3: ■ Confirms
▼
SHORT on Bar 2 close
Don't wait for more confirmation
```
---
## COMPOSITE OPERATOR PSYCHOLOGY
### What Smart Money Does (Follow Them)
**Accumulation:**
```
1. Create fear (PS, SC)
2. Shake out weak hands (Spring)
3. Absorb supply quietly (Phase B)
4. Test for remaining supply (Test)
5. Mark it up (SOS → Phase E)
💰 They buy LOW when retail panics
```
**Distribution:**
```
1. Create euphoria (PSY, BC)
2. Trap late buyers (UTAD)
3. Distribute to buyers (Phase B)
4. Test for remaining demand (ST)
5. Mark it down (SOW → Phase E)
💰 They sell HIGH when retail buys
```
### Where to Look for Smart Money
```
💰 Buy signals appear at:
- Demand zones (green boxes)
- Springs and shakeouts
- Tests of support
- After selling climax
💰 Sell signals appear at:
- Supply zones (red boxes)
- UTAD and upthrusts
- Weak rallies (LPSY)
- After buying climax
```
---
## PRACTICE EXERCISES
### Exercise 1: Identify the Phase
Look at any chart and ask:
1. Is there a trading range? (Phase B likely)
2. Did we just stop a trend? (Phase A)
3. Was there a spring/UTAD? (Phase C)
4. Is there a breakout? (Phase D)
5. Is trend running? (Phase E)
### Exercise 2: Volume Analysis
For each bar, note:
- Volume level (High/Normal/Low)
- Spread (Wide/Normal/Narrow)
- Effort vs Result (Matching? Diverging?)
### Exercise 3: Find Historical Springs
Go back 6 months:
- Mark all springs you can find
- Note the setup before each
- Track what happened after
- Calculate win rate
---
## FINAL VISUALIZATION: The Complete Cycle
```
ACCUMULATION → MARKUP → DISTRIBUTION → MARKDOWN → ACCUMULATION...
Distribution Accumulation
(Top) (Bottom)
┌───────────────┐ ┌───────────────┐
│ BC UTAD │ │ Spring SC │
│ │ │ │ │ │ │ │
────┴───┴───┴───────┴─╲ ╱────────┴───┴───┴────
╲ ╱
Markdown ╲ ╱ Markup
(Phase E) ╲ ╱ (Phase E)
╲ ╱
╲ ╱
╲ ╱
╲ ╱
V
The market cycles endlessly
Your job: Identify where you are in the cycle
Trade accordingly
```
---
**Remember:**
- 📊 Study charts daily
- 📝 Journal every setup
- 🎯 Wait for the best signals
- 💰 Follow smart money
- ⏰ Be patient
- 🚀 Let winners run
**The indicator does the heavy lifting - you make the decisions!**

FX OSINT - Institutional Midnight Intelligence For ForexFX OSINT — Institutional Midnight Intelligence For Forex
See Your FX Charts Like an Intelligence Briefing, Not a Guess
If you’ve ever stared at EURUSD or GBPJPY and thought:
Where is the real liquidity?
Is this move sponsored by smart money or just noise?
Am I buying into premium or discount?
…then FX OSINT is designed for you.
FX OSINT (Forex Open Source Intelligence) treats the FX market the way an analyst treats an investigation:
Collect open‑source signals from price, time, and volatility.
Map out liquidity, structure, and sessions in a repeatable way.
Present them in a clean, non‑cluttered dashboard so you can read context quickly.
No rainbow spaghetti. No 12 indicators stacked on top of each other. Just structured information, midnight visuals, and a clear read on what the market is doing right now.
Why FX OSINT Exists
Many FX traders run into the same problems:
Overloaded charts – multiple indicators fighting for space, none talking to each other.
Signals with no context – arrows that ignore structure, sessions, and liquidity.
Tools not tuned for FX – generic indicators that don’t care what pair you are on.
FX OSINT brings this together into one FX‑focused framework that:
Understands structure : BOS/CHOCH, swings, and trend across multiple timeframes.
Respects liquidity : sweeps, order blocks, and FVGs with controlled visibility.
Reads volatility & ADR : how far today’s range has developed.
Knows the clock : London, New York, and key killzones.
Scores confluence : a 0–100 engine that summarizes how much is lining up.
FX OSINT is built for traders who want structured, institutional‑style logic with a disciplined, midnight‑themed UI —not flashing buy/sell buttons.
1. Midnight Dashboard — Top‑Right Intelligence Panel
This panel acts as your compact “situation room”:
CONFLUENCE — 0–100 score blending trend alignment, volatility regime, sessions, liquidity events, order blocks, FVGs, and ADR context.
REGIME — Low / Building / Normal / Expansion / Extreme, driven by ATR relationships, so you know if you’re in chop, trend, or expansion.
HTF / MTF / LTF TREND — Higher‑, medium‑, and current‑timeframe bias in one place, so you see if you are trading with or against the larger flow.
ADR USED — How much of today’s typical range has already been consumed in percentage terms.
PIP VALUE — Approximate pip size per pair, including JPY‑style pairs.
Everything is bold, legible, and color‑coded, but the layout stays minimal so you can:
Look once → understand the context.
2. Structure, BOS, CHOCH — Smart‑Money‑Style Skeleton
FX OSINT tracks swing highs and lows, then shows how structure evolves:
Trend logic based on evolving swings, not just a moving average cross.
BOS (Break of Structure) when price expands in the direction of trend.
CHOCH (Change of Character) when behavior flips and the market structure changes.
Labels are selective, not spammy . You don’t get a tag on every minor wiggle—only when structure meaningfully shifts, so it’s easier to answer:
"Are we continuing the current leg, or did something actually change here?"
3. Liquidity Sweeps, Order Blocks & FVGs — The OSINT Layer
FX OSINT treats liquidity as a key information layer:
Liquidity sweeps — Detects when price spikes through recent highs/lows and then snaps back, flagging potential stop runs.
Order blocks — The last opposite candle before a displacement move, drawn as controlled boxes with limited lifespan to avoid clutter.
Fair Value Gaps (FVGs) — Three‑candle imbalances rendered as precise zones with a cap on how many can exist at once.
Under the hood, boxes are managed so your chart does not become a wall of old zones:
// Draw Order Blocks with overlap prevention
if isBullishOB and showOrderBlocks
if array.size(obBoxes) >= maxBoxes
oldBox = array.shift(obBoxes)
box.delete(oldBox)
newBox = box.new(bar_index , low , bar_index + obvLength, high ,
border_color = bullColor, bgcolor = bullColorTransp,
border_width = 2, extend = extend.none)
array.push(obBoxes, newBox)
Box limits keep the number of zones under control.
Borders and transparency are tuned so you still see price clearly.
You end up with a curated liquidity map , rather than a chart buried under every level price has ever touched.
4. Volatility, ADR & Sessions — Time and Range Intelligence
FX OSINT runs a Volatility Regime Analyzer and an ADR engine in the background:
Volatility regime — Five states (Low → Extreme) derived from fast vs. slow ATR.
ADR bands — Daily high/mid/low projected from the current daily open.
ADR used % — How far today’s move has traveled relative to its typical range.
On the time side:
Asia, London, New York sessions are softly highlighted with a single active background to avoid overlapping colors.
Killzones (e.g., London and New York opens) can be emphasized when you want to focus on where significant moves often begin.
Together, this helps you answer:
"What time is it in the trading day?"
"How stretched are we?"
"Is expansion just starting, or are we late to the move?"
5. ICT‑Style Add‑Ons — BOS/CHOCH, Premium/Discount, and Confluence
For modern FX / ICT‑inspired workflows, FX OSINT includes:
BOS / CHOCH labels — Clear structural shifts based on swings.
Premium / Discount zones — 25%, 50%, 75% levels of the daily range, so you know if you are buying discount in an uptrend or selling premium in a downtrend.
Confluence score — A single number summarizing how many conditions line up in the current context.
Instead of replacing your plan, FX OSINT compresses your checklist into the chart:
Structure
Liquidity
Session / Time
Volatility / ADR
Higher‑timeframe alignment
When these agree, the dashboard reflects it. When they don’t, it stays neutral and lets you see the conflict.
How To Use FX OSINT
FX OSINT is not a signal bot. It is an information engine that organizes context so you can apply your own plan.
A typical workflow might look like:
Start on higher timeframes (e.g., H4/D1) to form directional bias from structure, volatility regime, and ADR context.
Move to intraday timeframes (e.g., M15/H1) around your chosen sessions (London and/or New York).
Look for confluence :
HTF / MTF / LTF trends aligned.
Price in discount for longs or premium for shorts.
Recent liquidity sweep into a meaningful OB or FVG.
Confluence score at or above a level you consider significant.
Then refine entries using BOS/CHOCH on lower timeframes according to your own risk and execution rules.
FX OSINT aims to make sure you do not enter a trade without seeing:
Where you are in the day (ADR and sessions).
Where you are in the volatility cycle (regime).
Who currently appears in control (structure and trend).
Which liquidity was just targeted (sweeps and zones).
Design Choices and Scope
FX OSINT was designed around a few clear constraints:
FX‑focused — Logic and filters tuned for FX majors, minors, exotics, and metals. It is intended for FX markets, not for every possible asset class.
Open‑source — The full Pine Script code is available so you can read it, learn from it, and adapt it to your own workflow if needed.
Clear themes — Two main visual styles (e.g., dark institutional “midnight” and a lighter accent variant) with a focus on readability, not visual noise.
Chart‑friendly — Panels use fixed areas, session highlights avoid overlapping, and boxes are capped/pruned so the chart remains usable.
FX OSINT is for only Forex pairs, not anything else!
Hope you enjoyed and remember your Open Source Intelligence Matters 😉!
-officialjackofalltrades

Auto Trend Channels OXEThis indicator automatically detects and draws trend channels based on swing highs and lows.
How it works:
It identifies pivot points (swing highs/lows) using your chosen lookback period, then connects consecutive pivots to form channels:
Descending channels connect lower highs (resistance line), with a parallel support line projected from the lowest low between those highs
Ascending channels connect higher lows (support line), with a parallel resistance line projected from the highest high between those lows
Key features:
Channels extend forward so you can see where price might interact with them
Broken channels automatically switch to dashed lines and show "✗" labels
Fill shading helps visualize the channel zone
Info table shows current pivot counts
Trading application:
You'd use this for identifying trend direction and potential reversal zones. Price bouncing off channel boundaries = continuation. Price breaking through = potential trend change or acceleration. The "break detection" highlighting makes it easy to spot when a channel has been invalidated.
The pivot length setting is your main control - higher values find longer-term, more significant channels; lower values catch shorter-term moves.

Trendshift [CHE]Trendshift — First-Shift Regime Turns with Premium/Discount Context
Summary
Trendshift highlights the first confirmed directional structure shift in price and overlays a premium or discount context based on the most recent structural range. It identifies the major swing levels, detects a regime transition when price closes beyond these levels with optional ATR-based conviction, and marks only the first shift per direction to reduce repetition and noise. The indicator then establishes a premium or discount band around the break and tints the background when price operates in either region. This produces a clean regime-aware view that emphasizes only the earliest actionable turn while maintaining contextual bias information.
Motivation: Why this design?
Conventional swing-based structure tools often fire repeated signals after each minor break, especially in volatile environments. This leads to cluttered charts and little informational value. Trendshift focuses on the core trading need: isolating the first confirmed change in directional structure and providing a premium or discount context after the break. By limiting signals to the initial flip and suppressing further markers until direction reverses again, the script reduces noise and highlights only the structural event that materially matters. The band logic further addresses the challenge of distinguishing contextual extremes and avoiding trades taken too late after a shift.
What’s different vs. standard approaches?
Baseline reference: Most structure indicators repeatedly plot every new break of a swing high or swing low.
Differences:
Only the first confirmed bullish or bearish shift is plotted until the opposite direction occurs.
ATR-filtered breakout validation to reduce false breaks during volatility spikes.
A reduced premium and discount band derived from the breakout candle and prior swing structure.
Tinted background for contextual positioning rather than explicit entry signals.
Practical effect:
Fewer but more meaningful shift markers.
Clear visual context of where price operates relative to the structural band.
Cleaner regime transitions and less chart clutter.
How it works (technical)
The indicator continuously evaluates major swing highs and lows using a symmetric window length. When a swing is confirmed, the script stores its price and bar index. A structure shift occurs when price closes beyond the most recent major swing in the opposite direction. Optional ATR filtering requires the breakout distance to exceed an ATR-scaled threshold.
Upon a confirmed shift, the script sets a regime state that remains active until a new shift or an optional timeout. It also establishes a structural band anchored between the breakout candle extremum and the prior opposite swing. The band informs the premium and discount boundaries, each representing a quarter subdivision.
Only the first shift event per direction generates a visual triangle marker. The band is validated by comparing its height to ATR to avoid extremely narrow structures. Background tinting activates whenever price resides within the premium or discount zones. Persistent variables maintain previous structural states and prevent re-triggering until direction reverses.
Parameter Guide
Swing length (default 5): Controls the number of bars used on each side of a swing. Smaller values are more reactive; larger values reduce noise.
Use ATR filter (default true): Requires breakout strength beyond the swing to exceed an ATR-scaled threshold. Disabling increases signal frequency.
ATR length (default 14): Controls volatility estimation for breakout filtering and band validation.
Break ATR multiplier (default 1.0): Higher values require stronger breakouts, reducing false shifts.
Enable framework (default true): Activates the premium and discount context logic.
Persist band on timeout (default true): Retains the current band after a regime timeout.
Min band size ATR mult (default 0.5): Rejects extremely small bands and prevents unrealistic tinting.
Regime timeout bars (default 500): Resets the regime after extended inactivity.
Invert colors (default false): Swaps premium and discount tint color assignments.
Show zone tint (default true): Toggles background shading.
Show shift markers (default true): Enables or disables the first-shift triangles.
Reading & Interpretation
A green or red tint signals that price is operating in the discount or premium region of the most recent structural band. These regions are derived from the breakout event and the prior swing. A green triangle below a bar indicates the first bullish structure shift after a bearish regime. A red triangle above a bar indicates the first bearish shift after a bullish regime. No further markers appear until direction reverses. When tint is active, price location within the band offers simple contextual bias without providing explicit entries.
Practical Workflows & Combinations
Trend following: Treat the first bullish marker as the earliest confirmation of a potential up-regime and the first bearish marker for a potential down-regime. Use price location relative to the premium and discount zones as context for continuation or mean-reversion setups.
Structure-based execution: Combine with simple swing highs and lows to refine entry points within discount after a bullish shift or within premium after a bearish shift.
Higher-timeframe overlays: Apply the indicator on higher timeframes to define macro structure, then trade on lower timeframes using the band as a contextual anchor.
Risk management: When price stays in premium during a bearish regime or in discount during a bullish regime, consider protective actions or position management adjustments.
Behavior, Constraints & Performance
The script uses only confirmed swing points and closed-bar conditions, so repainting from future bars does not occur except the inherent delay of pivot confirmation. No higher-timeframe security calls are used, avoiding HTF repaint paths.
Performance impact is minimal because the script uses no loops or arrays and relies on persistent variables. The maximum bars back setting is five-thousand, required for swing lookback. Known limitations include quiet behavior during long consolidations, occasional delayed recognition of shifts due to swing confirmation, and limited effectiveness during large market gaps where extremum logic may be distorted.
Sensible Defaults & Quick Tunin g
Increase the swing length for smoother trend shifts and fewer signals.
Decrease the swing length for more sensitivity.
Raise the ATR breakout multiplier to reduce noise in volatile markets.
Lower the band size requirement to make premium and discount zones more active on slower markets.
Extend the regime timeout for slow-moving assets.
What this indicator is—and isn’t
This tool is a structural regime-shift detector with contextual premium and discount shading. It is not a complete trading system and does not include entries, exits, or risk models. It does not predict future price movement. It should be combined with broader structure analysis, liquidity considerations, and risk management practices.
Disclaimer
The content provided, including all code and materials, is strictly for educational and informational purposes only. It is not intended as, and should not be interpreted as, financial advice, a recommendation to buy or sell any financial instrument, or an offer of any financial product or service. All strategies, tools, and examples discussed are provided for illustrative purposes to demonstrate coding techniques and the functionality of Pine Script within a trading context.
Any results from strategies or tools provided are hypothetical, and past performance is not indicative of future results. Trading and investing involve high risk, including the potential loss of principal, and may not be suitable for all individuals. Before making any trading decisions, please consult with a qualified financial professional to understand the risks involved.
By using this script, you acknowledge and agree that any trading decisions are made solely at your discretion and risk.
Do not use this indicator on Heikin-Ashi, Renko, Kagi, Point-and-Figure, or Range charts, as these chart types can produce unrealistic results for signal markers and alerts.
Best regards and happy trading
Chervolino

RSI Hybrid + EMA Cloud + Swings(15m/2H)RSI Hybrid + EMA Cloud (15m Trend + 2H Momentum)
A dual-timeframe trading system combining fast 15-minute trend structure with higher-timeframe 2-Hour momentum, volume and structural levels.
🧩 What This Indicator Does
This tool blends:
🔹 15m Trend (EMA Cloud) – 2 Points
EMA 7 vs 21 → Short trend
EMA 30 vs 74 → Long trend
Cloud shading highlights bullish/bearish alignment
Faster, intraday trend sensitivity
🔹 2H Momentum (RSI Hybrid) – 3 Points
RSI > 50
RSI > SMA(4)
RSI > SMA(12)
Gives short / medium / long momentum confirmation from the higher timeframe.
🔹 2H Volume Pressure – 1 Point
Volume vs 20-SMA
Mild / Moderate / Strong Bull/Bear
Confirms true participation behind price moves
⭐ Score System (0–6 Total)
Component Points
15m EMA Trend 2
2H RSI Hybrid 3
2H Volume Power 1
Total 6
Interpretation:
5–6 → High-confluence direction
3–4 → Partial confluence
1–2 → Weak bias
0 → No reliable direction
Designed for discretionary and semi-systematic intraday traders.
📊 15m Structural Levels
Includes:
✔ Last confirmed 15m Swing High / Swing Low
Based on close-price pivots, not highs/lows.
✔ Live Running High since last Swing LOW
Tracks how far price has extended upward.
✔ Live Running Low since last Swing HIGH
Tracks downward extension after a swing high.
✔ ATR(15m)
Volatility reference for SL/TP or risk modeling.
These levels help in timing entries, managing stops, and identifying breakout/breakdown zones.
🖥 On-Chart Info Table
Summarizes:
15m EMA short & long trend
2H RSI short/medium/long momentum
RSI vs 50
2H volume power
Bull & Bear score (with breakdown)
Last 15m swing highs/lows
ATR(15m)
Color-coded for clarity
💡 Why Use This Indicator
High-speed 15m trend detection
Higher-TF 2H momentum & volume confirmation
Multi-layered bias presented in a simple score
Built-in structure for more intelligent entries/exits
Works on indices, stocks, FX, crypto
Ideal for intraday traders who want speed + reliability

Scout Regiment - MACD# Scout Regiment - MACD Indicator
## English Documentation
### Overview
Scout Regiment - MACD is an advanced implementation of the Moving Average Convergence Divergence indicator with enhanced features including dual divergence detection (histogram and MACD line), customizable moving average types, multi-timeframe analysis, and sophisticated visual elements. This indicator provides traders with comprehensive momentum analysis and high-probability reversal signals.
### What is MACD?
MACD (Moving Average Convergence Divergence) is a trend-following momentum indicator that shows the relationship between two moving averages:
- **MACD Line**: Difference between fast and slow EMAs
- **Signal Line**: Moving average of the MACD line
- **Histogram**: Difference between MACD line and signal line
- **Purpose**: Identifies trend direction, momentum strength, and potential reversals
### Key Features
#### 1. **Enhanced MACD Display**
**Three Core Components:**
**MACD Line** (Default: Blue/Orange, 2px)
- Fast EMA (13) minus Slow EMA (34)
- Shows momentum direction
- Color changes based on position relative to signal line:
- Blue: Above signal line (bullish)
- Orange: Below signal line (bearish)
- Can be toggled on/off
**Signal Line** (Default: White/Blue with transparency, 2px)
- EMA (9) of the MACD line
- Serves as trigger line for crossover signals
- Color varies based on settings
- Essential for identifying entry/exit points
**Histogram** (Default: 4-color gradient, 4px columns)
- Difference between MACD and signal line
- Visual representation of momentum strength
- Advanced 4-color scheme:
- **Dark Green (#26A69A)**: Positive and increasing (strong bullish)
- **Light Green (#B2DFDB)**: Positive but decreasing (weakening bullish)
- **Dark Red (#FF5252)**: Negative and decreasing (strong bearish)
- **Light Red (#FFCDD2)**: Negative but increasing (weakening bearish)
- Histogram tells the "story" of momentum changes
#### 2. **Customizable Moving Average Types**
**Oscillator MA Type** (MACD Line calculation):
- **EMA** (Exponential) - Default, more responsive
- **SMA** (Simple) - Smoother, less responsive
**Signal Line MA Type**:
- **EMA** (Exponential) - Default, faster signals
- **SMA** (Simple) - Slower, fewer false signals
**Flexibility**: Mix and match for different trading styles
- EMA/EMA: Most responsive (day trading)
- SMA/SMA: Smoothest (swing trading)
- EMA/SMA or SMA/EMA: Balanced approaches
#### 3. **Multi-Timeframe Capability**
**Current Chart Period** (Default: Enabled)
- Uses current timeframe automatically
- Simplest option for most traders
**Custom Timeframe Selection**
- Calculate MACD on any timeframe
- Display higher timeframe MACD on lower timeframe charts
- Example: View 1H MACD on 15min chart
- **Use Case**: Align lower timeframe trades with higher timeframe momentum
#### 4. **Visual Enhancement Features**
**Golden Cross / Death Cross Markers**
- Circles mark crossover points
- Color matches MACD line color
- Clearly identifies entry/exit signals
- Can be toggled on/off
**Zero Line** (White, 2px solid)
- Reference for positive/negative momentum
- Critical level for trend identification
- MACD above zero = Bullish bias
- MACD below zero = Bearish bias
**Color Transitions**
- MACD line changes color at signal line crosses
- Histogram shows momentum acceleration/deceleration
- Provides early warning of trend changes
#### 5. **Dual Divergence Detection System**
This indicator features TWO separate divergence detection systems:
**A. Histogram Divergence Detection**
- **Purpose**: Earlier divergence signals (most sensitive)
- **Detects**: Regular bullish and bearish divergences
- **Label**: "H涨" (Histogram Up), "H跌" (Histogram Down)
- **Special Feature**: Same-sign requirement option
- Top divergence: Both histogram points must be positive
- Bottom divergence: Both histogram points must be negative
- Filters out less reliable divergences
**B. MACD Line Divergence Detection**
- **Purpose**: Stronger, more reliable divergences
- **Detects**: Regular bullish and bearish divergences
- **Label**: "M涨" (MACD Up), "M跌" (MACD Down)
- **Use**: Confirmation of histogram divergences or standalone
**Divergence Types Explained:**
**Regular Bullish Divergence (Yellow)**
- **Price**: Lower lows
- **Indicator**: Higher lows (histogram OR MACD line)
- **Signal**: Potential upward reversal
- **Best**: Near support levels, oversold conditions
- **Entry**: After price breaks above recent resistance
**Regular Bearish Divergence (Blue)**
- **Price**: Higher highs
- **Indicator**: Lower highs (histogram OR MACD line)
- **Signal**: Potential downward reversal
- **Best**: Near resistance levels, overbought conditions
- **Entry**: After price breaks below recent support
#### 6. **Advanced Divergence Parameters**
**Histogram Divergence Settings:**
- **Price Reference**: Wicks (default) or Bodies
- **Right Lookback**: Bars to right of pivot (default: 2)
- **Left Lookback**: Bars to left of pivot (default: 5)
- **Max Range**: Maximum bars between divergences (default: 60)
- **Min Range**: Minimum bars between divergences (default: 5)
- **Same Sign Requirement**: Ensures both histogram points have same sign
- **Show Regular Divergence**: Toggle display
- **Show Labels**: Toggle divergence labels
**MACD Line Divergence Settings:**
- **Price Reference**: Wicks (default) or Bodies
- **Right Lookback**: Bars to right of pivot (default: 1)
- **Left Lookback**: Bars to left of pivot (default: 5)
- **Max Range**: Maximum bars between divergences (default: 60)
- **Min Range**: Minimum bars between divergences (default: 5)
- **Show Regular Divergence**: Toggle display
- **Show Labels**: Toggle divergence labels
**Independent Control**: Adjust histogram and MACD line divergences separately
### Configuration Settings
#### MACD Basic Settings
- **Fast EMA Period**: Fast moving average length (default: 13)
- **Slow EMA Period**: Slow moving average length (default: 34)
- **Signal Line Period**: Signal line length (default: 9)
- **Use Current Chart Period**: Auto-adjust to current timeframe
- **Select Period**: Choose custom timeframe
- **Show MACD & Signal Lines**: Toggle lines display
- **Show Cross Markers**: Toggle golden/death cross dots
- **Show Histogram**: Toggle histogram display
- **Show Crossover Color Change**: Enable MACD line color change
- **Show Histogram Colors**: Enable 4-color histogram scheme
- **Oscillator MA Type**: Choose SMA or EMA for MACD
- **Signal Line MA Type**: Choose SMA or EMA for signal
#### Histogram Divergence Settings
- **Show Histogram Divergence**: Enable histogram divergence detection
- **Price Reference**: Wicks or Bodies for price comparison
- **Right/Left Lookback**: Pivot detection parameters
- **Max/Min Range**: Distance constraints between pivots
- **Show Regular Divergence**: Display histogram divergence lines
- **Show Labels**: Display histogram divergence labels
- **Require Same Sign**: Enforce histogram sign consistency
#### MACD Line Divergence Settings
- **Show MACD Line Divergence**: Enable MACD line divergence detection
- **Price Reference**: Wicks or Bodies for price comparison
- **Right/Left Lookback**: Pivot detection parameters
- **Max/Min Range**: Distance constraints between pivots
- **Show Regular Divergence**: Display MACD line divergence lines
- **Show Labels**: Display MACD line divergence labels
### How to Use
#### For Basic Trend Following
1. **Enable Core Components**
- MACD line, signal line, and histogram
- Enable cross markers
2. **Identify Trend**
- MACD above zero = Uptrend
- MACD below zero = Downtrend
3. **Watch for Crossovers**
- Golden cross (MACD crosses above signal) = Buy signal
- Death cross (MACD crosses below signal) = Sell signal
4. **Confirm with Histogram**
- Increasing histogram = Strengthening trend
- Decreasing histogram = Weakening trend
#### For Divergence Trading
1. **Enable Both Divergence Systems**
- Histogram divergence (early signals)
- MACD line divergence (confirmation)
2. **Wait for Divergence Signals**
- "H涨" or "H跌" = Early warning
- "M涨" or "M跌" = Confirmation
3. **Best Divergences**
- Both histogram AND MACD line showing divergence
- Divergence at key support/resistance levels
- Multiple divergences on same trend
4. **Entry Timing**
- Wait for price structure break
- Enter on pullback after confirmation
- Use MACD crossover as trigger
#### For Multi-Timeframe Analysis
1. **Set Higher Timeframe**
- Example: 4H MACD on 1H chart
- Uncheck "Use Current Chart Period"
- Select desired timeframe
2. **Identify Higher TF Trend**
- MACD position relative to zero
- MACD vs signal line relationship
3. **Trade with HTF Direction**
- Only take long signals if HTF MACD bullish
- Only take short signals if HTF MACD bearish
4. **Use Current TF for Entries**
- Higher TF for bias
- Current TF for precise timing
#### For Histogram Analysis
1. **Enable 4-Color Histogram**
- Watch color transitions
- Dark colors = Strong momentum
- Light colors = Weakening momentum
2. **Momentum Stages**
- Dark green → Light green = Bullish losing steam
- Light red → Dark red = Bearish gaining strength
3. **Trade Transitions**
- Light green to light red = Momentum shift (potential reversal)
- Entry on confirmation crossover
### Trading Strategies
#### Strategy 1: Classic MACD Crossover
**Setup:**
- Standard settings (13/34/9)
- Enable MACD, signal line, and cross markers
- Clear trend on higher timeframe
**Entry:**
- **Long**: Golden cross (circle marker) above zero line
- **Short**: Death cross (circle marker) below zero line
**Confirmation:**
- Histogram color supporting direction
- Volume increase helps
**Stop Loss:**
- Below recent swing low (long)
- Above recent swing high (short)
**Exit:**
- Opposite crossover
- MACD crosses zero line against position
**Best For:** Trend following, clear trending markets
#### Strategy 2: Zero Line Bounce
**Setup:**
- Enable all components
- Established trend (MACD staying one side of zero)
- Wait for pullback to zero line
**Entry:**
- **Long**: MACD touches zero from above, bounces up with golden cross
- **Short**: MACD touches zero from below, bounces down with death cross
**Confirmation:**
- Histogram color change
- Price at support/resistance
**Stop Loss:**
- Just beyond zero line (opposite side)
**Exit:**
- Target previous extreme
- Or opposite crossover
**Best For:** Trend continuation, strong markets
#### Strategy 3: Dual Divergence Confirmation
**Setup:**
- Enable both histogram and MACD line divergences
- Price at extreme (high/low)
- Wait for divergence signals
**Entry:**
- **Long**: Both "H涨" AND "M涨" labels appear
- **Short**: Both "H跌" AND "M跌" labels appear
**Confirmation:**
- Price breaks structure
- Volume increase
- Golden/death cross confirms
**Stop Loss:**
- Beyond divergence pivot point
**Exit:**
- MACD crosses zero line
- Or opposite divergence appears
**Best For:** Reversal trading, swing trading
#### Strategy 4: Histogram Color Transition
**Setup:**
- Enable 4-color histogram
- Focus on color changes
- Price in trend
**Entry:**
- **Long**: Light red → Light green transition + golden cross
- **Short**: Light green → Light red transition + death cross
**Rationale:**
- Light colors show momentum exhaustion
- Color flip = momentum shift
- Early entry before full trend reversal
**Stop Loss:**
- Recent swing point
**Exit:**
- Histogram color turns light against position
- Or at predetermined target
**Best For:** Scalping, day trading, early entries
#### Strategy 5: Multi-Timeframe Momentum
**Setup:**
- Display higher timeframe MACD (e.g., 4H on 1H chart)
- Current chart shows current momentum
- Higher TF shows overall bias
**Entry:**
- **Long**: HTF MACD above zero + current TF golden cross
- **Short**: HTF MACD below zero + current TF death cross
**Confirmation:**
- HTF histogram supporting direction
- Both timeframes aligned
**Stop Loss:**
- Based on current timeframe structure
**Exit:**
- Current TF opposite crossover
- Or HTF MACD momentum weakens
**Best For:** Swing trading, high-probability setups
#### Strategy 6: Histogram-Only Divergence Scout
**Setup:**
- Enable only histogram divergence
- Use "same sign requirement"
- Focus on early signals
**Entry:**
- **Long**: "H涨" label + price at support
- **Short**: "H跌" label + price at resistance
**Confirmation:**
- Wait for MACD/signal crossover
- Or price structure break
**Advantage:**
- Earliest divergence signals
- Get in before crowd
**Risk:**
- More false signals than MACD line divergence
- Requires strict confirmation
**Stop Loss:**
- Tight stop beyond entry bar
**Exit:**
- Quick targets (30-50% of expected move)
- Or trail stop
**Best For:** Active traders, scalpers seeking early entries
### Best Practices
#### MACD Period Selection
**Standard (13/34/9)** - Default
- Balanced for most markets
- Good for day trading and swing trading
- Widely used, works with general market psychology
**Faster (8/21/5 or 12/26/9)**
- More responsive
- More signals, more noise
- Best for: Scalping, volatile markets
- Risk: More false signals
**Slower (21/55/13)**
- Smoother signals
- Fewer but stronger signals
- Best for: Swing trading, position trading
- Benefit: Higher reliability
#### Histogram vs MACD Line Divergences
**Histogram Divergence:**
- ✅ Earlier signals
- ✅ Catch moves before others
- ❌ More false signals
- ❌ Requires confirmation
- **Best for**: Active traders, scalpers
**MACD Line Divergence:**
- ✅ More reliable
- ✅ Stronger divergences
- ❌ Later signals
- ❌ May miss early moves
- **Best for**: Swing traders, conservative traders
**Both Together:**
- ✅ Maximum confidence
- ✅ Histogram for alert, MACD for confirmation
- ✅ Highest probability setups
- **Best for**: All traders seeking quality over quantity
#### Same Sign Requirement Feature
**Enabled (Recommended):**
- Filters low-quality divergences
- Top divergence: Both histogram points positive
- Bottom divergence: Both histogram points negative
- Results in fewer but more reliable signals
**Disabled:**
- More divergence signals
- Includes zero-line crossing divergences
- Higher false signal rate
- Only for experienced traders
#### Price Reference: Wicks vs Bodies
**Wicks (Default):**
- Uses high/low prices
- Catches all extremes
- More divergences detected
- Best for: Most trading styles
**Bodies:**
- Uses open/close prices
- Filters out spike movements
- Fewer but cleaner divergences
- Best for: Noisy markets, crypto
#### Visual Settings Recommendations
**For Beginners:**
- Enable: MACD line, signal line, histogram
- Enable: Cross markers
- Enable: Histogram colors
- Disable: Both divergence systems initially
- Focus: Learn basic crossovers first
**For Intermediate:**
- All basic components
- Add: Histogram divergence only
- Use: Same sign requirement
- Focus: Early reversal signals
**For Advanced:**
- All components
- Both divergence systems
- Custom parameters per market
- Multi-timeframe analysis
- Focus: High-probability confluence setups
### Indicator Combinations
**With Moving Averages (EMAs):**
- EMAs (21/55/144) show trend
- MACD shows momentum
- Enter when both align
- Exit when MACD turns first
**With RSI:**
- RSI for overbought/oversold
- MACD for momentum confirmation
- Divergence on both = Extremely strong signal
- RSI + MACD divergence = High probability trade
**With Volume:**
- Volume confirms MACD signals
- Crossover + volume spike = Valid breakout
- Divergence + volume divergence = Strong reversal
**With Support/Resistance:**
- S/R levels for entry/exit targets
- MACD divergence at levels = Highest probability
- MACD crossover at level = Strong confirmation
**With Bias Indicator:**
- Bias shows price deviation from EMA
- MACD shows momentum
- Both diverging = Powerful reversal signal
- Bias extreme + MACD divergence = High conviction trade
**With OBV:**
- OBV shows volume trend
- MACD shows price momentum
- OBV + MACD divergence = Volume not supporting price
- Strong reversal indication
**With KSI (RSI/CCI):**
- KSI for oscillator extremes
- MACD for momentum direction
- KSI extreme + MACD divergence = Reversal likely
- All aligned = Maximum confidence
### Common MACD Patterns
1. **Bullish Cross Above Zero**: Strong uptrend continuation signal
2. **Bearish Cross Below Zero**: Strong downtrend continuation signal
3. **Zero Line Rejection**: Price respects zero as support/resistance
4. **Histogram Peak**: Momentum climax, watch for reversal
5. **Double Divergence**: Two divergences without reversal = Very strong signal when it finally reverses
6. **Histogram Convergence**: Histogram narrowing = Trend losing steam
7. **Signal Line Hug**: MACD stays close to signal = Consolidation, expect breakout
### Performance Tips
- Start with default settings (13/34/9 EMA/EMA)
- Test one divergence system at a time
- Use same sign requirement initially
- Enable cross markers for clear signals
- Adjust lookback parameters per market volatility
- Higher timeframe MACD more reliable than lower
- Combine histogram early signal with MACD line confirmation
- Don't trade every divergence - wait for best setups
### Alert Conditions
While not explicitly coded, you can set custom alerts on:
- MACD crossing above/below signal line
- MACD crossing above/below zero line
- Histogram crossing zero
- When divergence labels appear (using visual alerts)
---
## 中文说明文档
### 概述
Scout Regiment - MACD 是移动平均线收敛发散指标的高级实现版本,具有增强功能,包括双重背离检测(直方图和MACD线)、可自定义的移动平均类型、多时间框架分析和复杂的视觉元素。该指标为交易者提供全面的动量分析和高概率反转信号。
### 什么是MACD?
MACD(移动平均线收敛发散)是一个趋势跟随动量指标,显示两条移动平均线之间的关系:
- **MACD线**:快速和慢速EMA之间的差值
- **信号线**:MACD线的移动平均
- **直方图**:MACD线和信号线之间的差值
- **用途**:识别趋势方向、动量强度和潜在反转
### 核心功能
#### 1. **增强的MACD显示**
**三个核心组件:**
**MACD线**(默认:蓝色/橙色,2像素)
- 快速EMA(13)减去慢速EMA(34)
- 显示动量方向
- 根据相对于信号线的位置改变颜色:
- 蓝色:信号线上方(看涨)
- 橙色:信号线下方(看跌)
- 可开关显示
**信号线**(默认:白色/蓝色带透明度,2像素)
- MACD线的EMA(9)
- 作为交叉信号的触发线
- 颜色根据设置变化
- 识别进出场点的关键
**直方图**(默认:4色渐变,4像素柱)
- MACD和信号线之间的差值
- 动量强度的视觉表示
- 高级4色方案:
- **深绿色(#26A69A)**:正值且增加(强劲看涨)
- **浅绿色(#B2DFDB)**:正值但减少(看涨减弱)
- **深红色(#FF5252)**:负值且减少(强劲看跌)
- **浅红色(#FFCDD2)**:负值但增加(看跌减弱)
- 直方图讲述动量变化的"故事"
#### 2. **可自定义的移动平均类型**
**振荡器MA类型**(MACD线计算):
- **EMA**(指数)- 默认,反应更快
- **SMA**(简单)- 更平滑,反应较慢
**信号线MA类型**:
- **EMA**(指数)- 默认,更快信号
- **SMA**(简单)- 更慢,假信号更少
**灵活性**:混合搭配以适应不同交易风格
- EMA/EMA:最灵敏(日内交易)
- SMA/SMA:最平滑(波段交易)
- EMA/SMA或SMA/EMA:平衡方法
#### 3. **多时间框架功能**
**当前图表周期**(默认:启用)
- 自动使用当前时间框架
- 大多数交易者的最简单选项
**自定义时间框架选择**
- 在任何时间框架上计算MACD
- 在低时间框架图表上显示高时间框架MACD
- 示例:在15分钟图上查看1小时MACD
- **使用场景**:使低时间框架交易与高时间框架动量保持一致
#### 4. **视觉增强功能**
**金叉/死叉标记**
- 圆点标记交叉点
- 颜色与MACD线颜色匹配
- 清晰识别进出场信号
- 可开关
**零线**(白色,2像素实线)
- 正负动量的参考
- 趋势识别的关键水平
- MACD在零线上方 = 看涨偏向
- MACD在零线下方 = 看跌偏向
**颜色转换**
- MACD线在信号线交叉处改变颜色
- 直方图显示动量加速/减速
- 提供趋势变化的早期警告
#### 5. **双重背离检测系统**
该指标具有两个独立的背离检测系统:
**A. 直方图背离检测**
- **用途**:更早的背离信号(最敏感)
- **检测**:常规看涨和看跌背离
- **标签**:"H涨"(直方图上涨)、"H跌"(直方图下跌)
- **特殊功能**:同符号要求选项
- 顶背离:两个直方图点都必须为正
- 底背离:两个直方图点都必须为负
- 过滤不太可靠的背离
**B. MACD线背离检测**
- **用途**:更强、更可靠的背离
- **检测**:常规看涨和看跌背离
- **标签**:"M涨"(MACD上涨)、"M跌"(MACD下跌)
- **用途**:确认直方图背离或独立使用
**背离类型说明:**
**常规看涨背离(黄色)**
- **价格**:更低的低点
- **指标**:更高的低点(直方图或MACD线)
- **信号**:潜在向上反转
- **最佳**:在支撑水平附近、超卖状况
- **入场**:价格突破近期阻力后
**常规看跌背离(蓝色)**
- **价格**:更高的高点
- **指标**:更低的高点(直方图或MACD线)
- **信号**:潜在向下反转
- **最佳**:在阻力水平附近、超买状况
- **入场**:价格跌破近期支撑后
#### 6. **高级背离参数**
**直方图背离设置:**
- **价格参考**:影线(默认)或实体
- **右侧回溯**:枢轴点右侧K线数(默认:2)
- **左侧回溯**:枢轴点左侧K线数(默认:5)
- **最大范围**:背离之间最大K线数(默认:60)
- **最小范围**:背离之间最小K线数(默认:5)
- **同符号要求**:确保两个直方图点符号相同
- **显示常规背离**:切换显示
- **显示标签**:切换背离标签
**MACD线背离设置:**
- **价格参考**:影线(默认)或实体
- **右侧回溯**:枢轴点右侧K线数(默认:1)
- **左侧回溯**:枢轴点左侧K线数(默认:5)
- **最大范围**:背离之间最大K线数(默认:60)
- **最小范围**:背离之间最小K线数(默认:5)
- **显示常规背离**:切换显示
- **显示标签**:切换背离标签
**独立控制**:分别调整直方图和MACD线背离
### 配置设置
#### MACD基础设置
- **快速EMA周期**:快速移动平均长度(默认:13)
- **慢速EMA周期**:慢速移动平均长度(默认:34)
- **信号线周期**:信号线长度(默认:9)
- **使用当前图表周期**:自动调整到当前时间框架
- **选择周期**:选择自定义时间框架
- **显示MACD线和信号线**:切换线条显示
- **显示金叉死叉圆点标记**:切换金叉/死叉圆点
- **显示直方图**:切换直方图显示
- **显示穿越变化MACD线**:启用MACD线颜色变化
- **显示直方图颜色**:启用4色直方图方案
- **振荡器MA类型**:为MACD选择SMA或EMA
- **信号线MA类型**:为信号线选择SMA或EMA
#### 直方图背离设置
- **显示直方图背离信号**:启用直方图背离检测
- **价格参考**:影线或实体用于价格比较
- **右侧/左侧回溯**:枢轴检测参数
- **最大/最小范围**:枢轴之间的距离约束
- **显示直方图常规背离**:显示直方图背离线
- **显示直方图常规背离标签**:显示直方图背离标签
- **要求背离点柱状图同符号**:强制直方图符号一致性
#### MACD线背离设置
- **显示MACD线背离信号**:启用MACD线背离检测
- **价格参考**:影线或实体用于价格比较
- **右侧/左侧回溯**:枢轴检测参数
- **最大/最小范围**:枢轴之间的距离约束
- **显示线常规背离**:显示MACD线背离线
- **显示线常规背离标签**:显示MACD线背离标签
### 使用方法
#### 基础趋势跟随
1. **启用核心组件**
- MACD线、信号线和直方图
- 启用交叉标记
2. **识别趋势**
- MACD在零线上方 = 上升趋势
- MACD在零线下方 = 下降趋势
3. **观察交叉**
- 金叉(MACD向上穿越信号线)= 买入信号
- 死叉(MACD向下穿越信号线)= 卖出信号
4. **用直方图确认**
- 直方图增加 = 趋势加强
- 直方图减少 = 趋势减弱
#### 背离交易
1. **启用两个背离系统**
- 直方图背离(早期信号)
- MACD线背离(确认)
2. **等待背离信号**
- "H涨"或"H跌" = 早期警告
- "M涨"或"M跌" = 确认
3. **最佳背离**
- 直方图和MACD线都显示背离
- 在关键支撑/阻力水平的背离
- 同一趋势上多个背离
4. **入场时机**
- 等待价格结构突破
- 确认后回调时进入
- 使用MACD交叉作为触发
#### 多时间框架分析
1. **设置更高时间框架**
- 示例:在1小时图上显示4小时MACD
- 取消勾选"使用当前图表周期"
- 选择所需时间框架
2. **识别更高TF趋势**
- MACD相对于零线的位置
- MACD与信号线的关系
3. **顺HTF方向交易**
- 仅在HTF MACD看涨时接受多头信号
- 仅在HTF MACD看跌时接受空头信号
4. **使用当前TF入场**
- 更高TF确定偏向
- 当前TF精确定时
#### 直方图分析
1. **启用4色直方图**
- 观察颜色转换
- 深色 = 强动量
- 浅色 = 动量减弱
2. **动量阶段**
- 深绿色→浅绿色 = 看涨失去动力
- 浅红色→深红色 = 看跌获得力量
3. **交易转换**
- 浅绿色到浅红色 = 动量转变(潜在反转)
- 确认交叉时入场
### 交易策略
#### 策略1:经典MACD交叉
**设置:**
- 标准设置(13/34/9)
- 启用MACD、信号线和交叉标记
- 更高时间框架明确趋势
**入场:**
- **多头**:零线上方金叉(圆点标记)
- **空头**:零线下方死叉(圆点标记)
**确认:**
- 直方图颜色支持方向
- 成交量增加有帮助
**止损:**
- 近期波动低点之下(多头)
- 近期波动高点之上(空头)
**离场:**
- 相反交叉
- MACD反向穿越零线
**适合:**趋势跟随、明确趋势市场
#### 策略2:零线反弹
**设置:**
- 启用所有组件
- 已建立趋势(MACD保持在零线一侧)
- 等待回调至零线
**入场:**
- **多头**:MACD从上方触及零线,向上反弹并金叉
- **空头**:MACD从下方触及零线,向下反弹并死叉
**确认:**
- 直方图颜色变化
- 价格在支撑/阻力位
**止损:**
- 零线对面一侧
**离场:**
- 目标前一极值
- 或相反交叉
**适合:**趋势延续、强势市场
#### 策略3:双重背离确认
**设置:**
- 启用直方图和MACD线背离
- 价格在极值(高点/低点)
- 等待背离信号
**入场:**
- **多头**:"H涨"和"M涨"标签都出现
- **空头**:"H跌"和"M跌"标签都出现
**确认:**
- 价格突破结构
- 成交量增加
- 金叉/死叉确认
**止损:**
- 背离枢轴点之外
**离场:**
- MACD穿越零线
- 或出现相反背离
**适合:**反转交易、波段交易
#### 策略4:直方图颜色转换
**设置:**
- 启用4色直方图
- 关注颜色变化
- 价格处于趋势
**入场:**
- **多头**:浅红色→浅绿色转换 + 金叉
- **空头**:浅绿色→浅红色转换 + 死叉
**原理:**
- 浅色显示动量衰竭
- 颜色翻转 = 动量转变
- 完全趋势反转前的早期入场
**止损:**
- 近期波动点
**离场:**
- 直方图颜色变为反向浅色
- 或预定目标
**适合:**剥头皮、日内交易、早期入场
#### 策略5:多时间框架动量
**设置:**
- 显示更高时间框架MACD(例如,在1小时图上显示4小时)
- 当前图表显示当前动量
- 更高TF显示整体偏向
**入场:**
- **多头**:HTF MACD在零线上方 + 当前TF金叉
- **空头**:HTF MACD在零线下方 + 当前TF死叉
**确认:**
- HTF直方图支持方向
- 两个时间框架对齐
**止损:**
- 基于当前时间框架结构
**离场:**
- 当前TF相反交叉
- 或HTF MACD动量减弱
**适合:**波段交易、高概率设置
#### 策略6:仅直方图背离侦察
**设置:**
- 仅启用直方图背离
- 使用"同符号要求"
- 关注早期信号
**入场:**
- **多头**:"H涨"标签 + 价格在支撑位
- **空头**:"H跌"标签 + 价格在阻力位
**确认:**
- 等待MACD/信号线交叉
- 或价格结构突破
**优势:**
- 最早的背离信号
- 在大众之前进入
**风险:**
- 比MACD线背离假信号更多
- 需要严格确认
**止损:**
- 入场K线之外紧密止损
**离场:**
- 快速目标(预期波动的30-50%)
- 或移动止损
**适合:**活跃交易者、寻求早期入场的剥头皮交易者
### 最佳实践
#### MACD周期选择
**标准(13/34/9)** - 默认
- 大多数市场的平衡
- 适合日内交易和波段交易
- 广泛使用,符合一般市场心理
**更快(8/21/5或12/26/9)**
- 更灵敏
- 更多信号,更多噪音
- 最适合:剥头皮、波动市场
- 风险:更多假信号
**更慢(21/55/13)**
- 更平滑的信号
- 信号较少但更强
- 最适合:波段交易、仓位交易
- 优势:更高可靠性
#### 直方图vs MACD线背离
**直方图背离:**
- ✅ 更早信号
- ✅ 在其他人之前捕捉波动
- ❌ 更多假信号
- ❌ 需要确认
- **最适合**:活跃交易者、剥头皮交易者
**MACD线背离:**
- ✅ 更可靠
- ✅ 更强的背离
- ❌ 信号较晚
- ❌ 可能错过早期波动
- **最适合**:波段交易者、保守交易者
**两者结合:**
- ✅ 最大信心
- ✅ 直方图警报,MACD确认
- ✅ 最高概率设置
- **最适合**:所有寻求质量而非数量的交易者
#### 同符号要求功能
**启用(推荐):**
- 过滤低质量背离
- 顶背离:两个直方图点都为正
- 底背离:两个直方图点都为负
- 产生更少但更可靠的信号
**禁用:**
- 更多背离信号
- 包括零线穿越背离
- 假信号率更高
- 仅适合有经验的交易者
#### 价格参考:影线vs实体
**影线(默认):**
- 使用最高/最低价
- 捕捉所有极值
- 检测到更多背离
- 最适合:大多数交易风格
**实体:**
- 使用开盘/收盘价
- 过滤突刺波动
- 背离更少但更干净
- 最适合:噪音市场、加密货币
#### 视觉设置建议
**新手:**
- 启用:MACD线、信号线、直方图
- 启用:交叉标记
- 启用:直方图颜色
- 禁用:初始禁用两个背离系统
- 重点:先学习基本交叉
**中级:**
- 所有基本组件
- 添加:仅直方图背离
- 使用:同符号要求
- 重点:早期反转信号
**高级:**
- 所有组件
- 两个背离系统
- 每个市场自定义参数
- 多时间框架分析
- 重点:高概率汇合设置
### 指标组合
**与移动平均线(EMA)配合:**
- EMA(21/55/144)显示趋势
- MACD显示动量
- 两者一致时进入
- MACD先转向时退出
**与RSI配合:**
- RSI用于超买超卖
- MACD用于动量确认
- 两者都背离 = 极强信号
- RSI + MACD背离 = 高概率交易
**与成交量配合:**
- 成交量确认MACD信号
- 交叉 + 成交量激增 = 有效突破
- 背离 + 成交量背离 = 强反转
**与支撑/阻力配合:**
- 支撑阻力水平用于进出目标
- 水平处的MACD背离 = 最高概率
- 水平处的MACD交叉 = 强确认
**与Bias指标配合:**
- Bias显示价格相对EMA的偏离
- MACD显示动量
- 两者都背离 = 强大反转信号
- Bias极值 + MACD背离 = 高信念交易
**与OBV配合:**
- OBV显示成交量趋势
- MACD显示价格动量
- OBV + MACD背离 = 成交量不支持价格
- 强反转迹象
**与KSI(RSI/CCI)配合:**
- KSI用于振荡器极值
- MACD用于动量方向
- KSI极值 + MACD背离 = 可能反转
- 全部对齐 = 最大信心
### 常见MACD形态
1. **零线上方看涨交叉**:强上升趋势延续信号
2. **零线下方看跌交叉**:强下降趋势延续信号
3. **零线拒绝**:价格将零线作为支撑/阻力
4. **直方图峰值**:动量高潮,注意反转
5. **双重背离**:两次背离未反转 = 最终反转时非常强
6. **直方图收敛**:直方图变窄 = 趋势失去动力
7. **信号线紧贴**:MACD紧贴信号线 = 盘整,预期突破
### 性能提示
- 从默认设置开始(13/34/9 EMA/EMA)
- 一次测试一个背离系统
- 初始使用同符号要求
- 启用交叉标记以获得清晰信号
- 根据市场波动性调整回溯参数
- 更高时间框架MACD比更低的更可靠
- 结合直方图早期信号与MACD线确认
- 不要交易每个背离 - 等待最佳设置
### 警报条件
虽然没有明确编码,但您可以设置自定义警报:
- MACD向上/向下穿越信号线
- MACD向上/向下穿越零线
- 直方图穿越零线
- 背离标签出现时(使用视觉警报)
---
## Technical Support
For questions or issues, please refer to the TradingView community or contact the indicator creator.
## 技术支持
如有问题,请参考TradingView社区或联系指标创建者。

ZigZagZigZag Indicator – Overview
This ZigZag indicator highlights the most important swing highs and swing lows on the chart, helping traders see market structure more clearly by filtering out minor price movements. It connects significant turning points with straight lines, creating a clean visual representation of trend direction and major reversals.
How It Works
Price constantly moves up and down, but not every movement is meaningful. The ZigZag indicator waits for price to make a move large enough to be considered a true swing point. Once such a movement occurs, the indicator identifies it as either a swing high or a swing low and draws a line connecting it to the previous swing.
This produces a simplified outline of market structure, making it easier to recognize trends, corrections, and major turning points.
Settings
ZigZag Length
Controls the sensitivity of the indicator.
Lower values produce more frequent swing points.
Higher values show only major swings and reduce noise.
Show ZigZag
Enables or disables the visual lines. When disabled, the indicator continues tracking swing points internally.
What You See on the Chart
Every time the market creates a confirmed swing high or swing low, the indicator draws a line to the previous swing in the opposite direction.
After a major low is confirmed, a line is drawn to the most recent high.
After a major high is confirmed, a line is drawn to the most recent low.
This creates a clear, continuous zigzag that outlines the dominant movements of the market without reacting to every small fluctuation.
Why This ZigZag Is Useful
It does not repaint once a swing is confirmed.
It provides a clean and simplified view of price structure.
It helps identify trend direction, structure breaks, impulses, and corrections.
It is useful for traders who follow price action, smart money concepts, and swing-based strategies.
Recommended Use Cases
This ZigZag indicator is suited for traders who rely on market structure analysis, including:
Swing trading
Smart Money Concepts (BOS/CHOCH detection)
Identifying impulses and pullbacks
Finding strong highs and lows
Studying overall trend direction

SMC Clean: Structure + LiquidityThis indicator provides Smart Money Concepts (SMC) tools designed to help traders analyze market structure, liquidity pools, and institutional trading zones. It combines several popular SMC methods into one powerful, customizable tool, with a clean and controlled chart display.
Features and How it Works:
Swing Highs and Lows: The indicator identifies confirmed swing highs and swing lows using a lookback period (default: 15 bars). These points form the basis for market structure analysis.
Equal Highs/Equal Lows (EQH/EQL): When price action creates repeated swing highs or lows within a defined tolerance, the tool automatically marks these areas as potential liquidity pools. These are levels where multiple stop orders may accumulate, sometimes leading to significant market moves.
Liquidity Lines & Sweeps: Liquidity lines highlight unswept highs and lows, making it easy to see where price may hunt liquidity. When price crosses a swing high/low and closes back, a sweep label is shown (optional).
BOS/CHOCH Detection:
Break of Structure (BOS): Signals a continuation of the current trend if price closes beyond the previous swing point.
Change of Character (CHOCH): Highlights when price reverses and breaks a key swing from the opposite direction, hinting at a potential trend change or shift in market regime.
Only confirmed swing points are considered to avoid repainting.
Premium & Discount Zones Explained:
After a new confirmed swing high and swing low, the area between them forms a “range.”
The premium zone is the upper half (from midpoint to swing high): this is typically considered where price is “expensive” or overvalued for the current swing, and is often watched for potential sell setups.
The discount zone is the lower half (from swing low to midpoint): this is where price is “cheap” or undervalued for the current swing, commonly monitored for potential buy setups.
Colored boxes mark these zones on your chart for instant reference.
Dashboard (Movable Position):
A visually enhanced dark-themed dashboard shows the current market structure (Bullish/Bearish), liquidity bias (Buy-Side, Sell-Side, or Balanced, based on unswept levels), and last swept side (i.e., which liquidity pool was last taken by price).
Dashboard position can be set anywhere on your chart for best visibility.
Customization Options:
Enable/disable any feature individually for a cleaner chart.
Control colors, transparency, and swing sensitivity via user settings.
How to Use:
Add the indicator to your chart and adjust settings to fit your trading style.
Use swing lines and dashboard to determine current market structure and bias.
Watch equal highs/lows and liquidity lines for possible sweep events.
Use the premium/discount zones to locate optimal areas for trade entries—with institutional logic, buy when price reaches the discount (lower) zone, and look for sales in the premium (upper) zone.
Use BOS/CHOCH signals as objective confirmations of trend or regime changes. Always interpret signals in context of broader price action.
Important Notes:
This indicator is educational and analytical—NO signals are guaranteed.
All calculations are non-repainting and use only confirmed price data (no lookahead).
No claims of predicting future price movement or performance are made.
Disclaimer:
This tool is for technical analysis education only. It is not a financial advice nor a guaranteed trading system. Please test all signals and concepts before using in live markets.

Quantura - Supply & Demand Zone DetectionIntroduction
“Quantura – Supply & Demand Zone Detection” is an advanced indicator designed to automatically detect and visualize institutional supply and demand zones, as well as breaker blocks, directly on the chart. The tool helps traders identify key areas of market imbalance and potential reversal or continuation zones, based on price structure, volume, and ATR dynamics.
Originality & Value
This indicator provides a unique and adaptive method of zone detection that goes beyond simple pivot or candle-based logic. It merges multiple layers of confirmation—volume sensitivity, ATR filters, and swing structure—while dynamically tracking how zones evolve as the market progresses. Unlike traditional supply and demand indicators, this script also detects and plots Breaker Zones when previous imbalances are violated, giving traders an extra layer of market context.
The key values of this tool include:
Automated detection of high-probability supply and demand zones.
Integration of both volume and ATR filters for precision and adaptability.
Dynamic zone merging and updating based on price evolution.
Identification of breaker blocks (invalidated zones) to visualize market structure shifts.
Optional bullish and bearish trade signals when zones are retested.
Clear, visually optimized plotting for efficient chart interpretation.
Functionality & Core Logic
The indicator continuously scans recent price data for swing highs/lows and combines them with optional volume and ATR conditions to validate potential zones.
Demand Zones are formed when price action indicates accumulation or a strong bullish rejection from a low area.
Supply Zones are created when distribution or strong bearish rejection occurs near local highs.
Breaker Blocks appear when existing zones are invalidated by price, helping traders visualize potential market structure shifts.
Bullish and bearish signals appear when price re-enters an active zone or breaks through a breaker block.
Parameters & Customization
Demand Zones / Supply Zones: Enable or disable each individually.
Breaker Zones: Activate breaker block detection for invalidated zones.
Volume Filter: Optional filter to only confirm zones when volume exceeds its long-term average by a user-defined multiplier.
ATR Filter: Optional filter for volatility confirmation, ensuring zones form under strong momentum conditions.
Swing Length: Controls the number of bars used to detect structural pivots.
Sensitivity Controls: Adjustable ATR and volume multipliers to fine-tune detection responsiveness.
Signals: Toggle for on-chart bullish (▲) and bearish (▼) signal plotting when price interacts with zones.
Color Customization: User-defined bullish and bearish colors for both standard and breaker zones.
Core Calculations
Zones are detected using pivot highs and lows with a defined lookback and lookahead period.
Additional filters apply if ATR and volume are enabled, requiring conditions like “ATR > average * multiplier” and “Volume > average * multiplier.”
Detected zones are merged if overlapping, keeping the chart clean and logical.
When price breaks through a zone, the original box is closed, and a new breaker zone is plotted automatically.
Bullish and bearish markers appear when zones are retested from the opposite side.
Visualization & Display
Demand zones are shaded in semi-transparent bullish color (default: blue).
Supply zones are shaded in semi-transparent bearish color (default: red).
Breaker zones appear when previous imbalances are broken, helping to spot structural shifts.
Optional arrows (▲ / ▼) indicate potential buy or sell reactions on zone interaction.
Use Cases
Identify institutional areas of accumulation (demand) or distribution (supply).
Detect potential breakout traps and market structure shifts using breaker zones.
Combine with other tools such as volume profile, EMA, or liquidity indicators for deeper confirmation.
Observe retests and reactions of zones to anticipate possible reversals or continuations.
Apply multi-timeframe analysis to align higher timeframe zones with lower timeframe entries.
Limitations & Recommendations
The indicator does not predict future price movement; it highlights structural imbalances only.
Performance depends on chosen swing length and sensitivity—users should optimize parameters for each market.
Works best in volatile markets where supply and demand imbalances are clearly expressed.
Should be used as part of a broader trading framework, not as a standalone signal generator.
Markets & Timeframes
The “Quantura – Supply & Demand Zone Detection” indicator is suitable for all asset classes including cryptocurrencies, Forex, indices, commodities, and equities. It performs reliably across multiple timeframes, from intraday scalping to higher timeframe swing analysis.
Author & Access
Developed 100% by Quantura. Published as a Open-source script indicator. Access is free.
Important
This description complies with TradingView’s Script Publishing and House Rules. It clearly explains the indicator’s originality, underlying logic, functionality, and intended use without unrealistic claims or performance guarantees.

Quantura - Liquidity Sweep & Run LevelsIntroduction
“Quantura – Liquidity Sweep & Run Levels” is a structural price-action indicator designed to automatically detect swing-based liquidity zones and visualize potential sweep and run events. It helps traders identify areas where liquidity has likely been taken (sweep) or released (run), improving precision in market structure analysis and timing of entries or exits.
Originality & Value
This tool translates institutional liquidity concepts into an automated visual framework. Instead of simply marking highs and lows, it dynamically monitors swing points, tracks their breaches, and identifies subsequent reactions. The indicator is built to highlight the liquidity dynamics that often precede reversals or continuations.
Its originality lies in:
Automatic identification and tracking of swing highs and lows.
Real-time detection of broken levels and liquidity sweeps.
Distinction between “Run” and “Sweep” modes for different market behaviors.
Persistent historical visualization of liquidity levels using clean line structures.
Configurable signal markers for bullish and bearish sweep confirmations.
Functionality & Core Logic
Detects swing highs and lows using a user-defined Swing Length parameter.
Stores and updates all swing levels dynamically with arrays for efficient memory handling.
Draws horizontal lines from each detected swing point to visualize potential liquidity zones.
Monitors when price breaks a swing level and marks that event as “broken.”
Generates signals when the market either sweeps above/below or runs away from those levels, depending on the chosen mode.
Provides optional visual signal markers (“▲” for bullish sweeps, “▼” for bearish sweeps).
Parameters & Customization
Mode: Choose between “Sweep” (detects liquidity grabs) or “Run” (detects breakout continuations).
Swing Length: Sets the sensitivity for detecting swing highs/lows. A higher value focuses on larger structures, while smaller values detect micro liquidity points.
Bullish Color / Bearish Color: Customize color themes for sweep/run lines and signal markers.
Signals: Enables or disables visual up/down markers for confirmed events.
Visualization & Display
Horizontal lines represent potential liquidity levels (unbroken swing highs/lows).
Once broken, lines automatically stop extending, marking the moment liquidity is taken.
Depending on the selected mode:
“Sweep” mode identifies false breaks or stop-hunt behavior.
“Run” mode highlights breakouts that continue the trend.
Colored arrows indicate the direction and type of liquidity reaction.
Clean, non-intrusive visualization suitable for overlaying on price charts.
Use Cases
Detect liquidity sweeps before major reversals.
Identify breakout continuations after liquidity runs.
Combine with Supply/Demand or FVG indicators for multi-layered confirmation.
Validate liquidity bias in algorithmic or discretionary strategies.
Analyze market manipulation patterns and institutional stop-hunting behavior.
Limitations & Recommendations
This indicator identifies structural behavior but does not guarantee trade direction or profitability.
Works best on liquid markets with clear swing structures (e.g., crypto, forex, indices).
Signal interpretation should be combined with confluence tools such as volume, order flow, or structure-based filters.
Excessively small swing settings may cause over-signaling in volatile markets.
Markets & Timeframes
Optimized for all major asset classes — including crypto, Forex, indices, and equities — and for intraday to higher-timeframe structural analysis (5-minute up to daily charts).
Author & Access
Developed 100% by Quantura. Published as a Open-source script indicator. Access is free.
Compliance Note
This description fully complies with TradingView’s Script Publishing Rules and House Rules . It avoids performance claims, provides transparency on methodology, and clearly describes indicator behavior and limitations.

Smart Money Flow Index (SMFI) - Advanced SMC [PhenLabs]📊Smart Money Flow Index (SMFI)
Version: PineScript™v6
📌Description
The Smart Money Flow Index (SMFI) is an advanced Smart Money Concepts implementation that tracks institutional trading behavior through multi-dimensional analysis. This comprehensive indicator combines volume-validated Order Block detection, Fair Value Gap identification with auto-mitigation tracking, dynamic Liquidity Zone mapping, and Break of Structure/Change of Character detection into a unified system.
Unlike basic SMC indicators, SMFI employs a proprietary scoring algorithm that weighs five critical factors: Order Block strength (validated by volume), Fair Value Gap size and recency, proximity to Liquidity Zones, market structure alignment (BOS/CHoCH), and multi-timeframe confluence. This produces a Smart Money Score (0-100) where readings above 70 represent optimal institutional setup conditions.
🚀Points of Innovation
Volume-Validated Order Block Detection – Only displays Order Blocks when formation candle exceeds customizable volume multiplier (default 1.5x average), filtering weak zones and highlighting true institutional accumulation/distribution
Auto-Mitigation Tracking System – Fair Value Gaps and Order Blocks automatically update status when price mitigates them, with visual distinction between active and filled zones preventing trades on dead levels
Proprietary Smart Money Score Algorithm – Combines weighted factors (OB strength 25%, FVG proximity 20%, Liquidity 20%, Structure 20%, MTF 15%) into single 0-100 confidence rating updating in real-time
ATR-Based Adaptive Calculations – All distance measurements use 14-period Average True Range ensuring consistent function across any instrument, timeframe, or volatility regime without manual recalibration
Dynamic Age Filtering – Automatically removes liquidity levels and FVGs older than configurable thresholds preventing chart clutter while maintaining relevant levels
Multi-Timeframe Confluence Integration – Analyzes higher timeframe bias with customizable multipliers (2-10x) and incorporates HTF trend direction into Smart Money Score for institutional alignment
🔧Core Components
Order Block Engine – Detects institutional supply/demand zones using characteristic patterns (down-move-then-strong-up for bullish, up-move-then-strong-down for bearish) with minimum volume threshold validation, tracks mitigation when price closes through zones
Fair Value Gap Scanner – Identifies price imbalances where current candle's low/high leaves gap with two-candle-prior high/low, filters by minimum size percentage, monitors 50% fill for mitigation status
Liquidity Zone Mapper – Uses pivot high/low detection with configurable lookback to mark swing points where stop losses cluster, extends horizontal lines to visualize sweep targets, manages lifecycle through age-based removal
Market Structure Analyzer – Tracks pivot progression to identify trend through higher-highs/higher-lows (bullish) or lower-highs/lower-lows (bearish), detects Break of Structure and Change of Character for trend/reversal confirmation
Scoring Calculation Engine – Evaluates proximity to nearest Order Blocks using ATR-normalized distance, assesses FVG recency and distance, calculates liquidity proximity with age weighting, combines structure bias and MTF trend into smoothed final score
🔥Key Features
Customizable Display Limits – Control maximum Order Blocks (1-10), Liquidity Zones (1-10), and FVG age (10-200 bars) to maintain clean charts focused on most relevant institutional levels
Gradient Strength Visualization – All zones render with transparency-adjustable coloring where stronger/newer zones appear more solid and weaker/older zones fade progressively providing instant visual hierarchy
Educational Label System – Optional labels identify each zone type (Bullish OB, Bearish OB, Bullish FVG, Bearish FVG, BOS) with color-coded text helping traders learn SMC concepts through practical application
Real-Time Smart Money Score Dashboard – Top-right table displays current score (0-100) with color coding (green >70, yellow 30-70, red <30) plus trend arrow for at-a-glance confidence assessment
Comprehensive Alert Suite – Configurable notifications for Order Block formation, Fair Value Gap detection, Break of Structure events, Change of Character signals, and high Smart Money Score readings (>70)
Buy/Sell Signal Integration – Automatically plots triangle markers when Smart Money Score exceeds 70 with aligned market structure and fresh Order Block detection providing clear entry signals
🎨Visualization
Order Block Boxes – Shaded rectangles extend from formation bar spanning high-to-low of institutional candle, bullish zones in green, bearish in red, with customizable transparency (80-98%)
Fair Value Gap Zones – Rectangular areas marking imbalances, active FVGs display in bright colors with adjustable transparency, mitigated FVGs switch to gray preventing trades on filled zones
Liquidity Level Lines – Dashed horizontal lines extend from pivot creation points, swing highs in bearish color (short targets above), swing lows in bullish color (long targets below), opacity decreases with age
Structure Labels – "BOS" labels appear above/below price when Break of Structure confirmed, colored by direction (green bullish, red bearish), positioned at 1% beyond highs/lows for visibility
Educational Info Panel – Bottom-right table explains key terminology (OB, FVG, BOS, CHoCH) and score interpretation (>70 high probability) with semi-transparent background for readability
📖Usage Guidelines
General Settings
Show Order Blocks – Default: On, toggles visibility of institutional supply/demand zones, disable when focusing solely on FVGs or Liquidity
Show Fair Value Gaps – Default: On, controls FVG zone display including active and mitigated imbalances
Show Liquidity Zones – Default: On, manages liquidity line visibility, disable on lower timeframes to reduce clutter
Show Market Structure – Default: On, toggles BOS/CHoCH label display
Show Smart Money Score – Default: On, controls score dashboard visibility
Order Block Settings
OB Lookback Period – Default: 20, Range: 5-100, controls bars scanned for Order Block patterns, lower values detect recent activity, higher values find older blocks
Min Volume Multiplier – Default: 1.5, Range: 1.0-5.0, sets minimum volume threshold as multiple of 20-period average, higher values (2.0+) filter for strongest institutional candles
Max Order Blocks to Display – Default: 3, Range: 1-10, limits simultaneous Order Blocks shown, lower settings (1-3) maintain focus on most recent zones
Fair Value Gap Settings
Min FVG Size (%) – Default: 0.3, Range: 0.1-2.0, defines minimum gap size as percentage of close price, lower values detect micro-imbalances, higher values focus on significant gaps
Max FVG Age (bars) – Default: 50, Range: 10-200, removes FVGs older than specified bars, lower settings (10-30) for scalping, higher (100-200) for swing trading
Show FVG Mitigation – Default: On, displays filled FVGs in gray providing visual history, disable to show only active untouched imbalances
Liquidity Zone Settings
Liquidity Lookback – Default: 50, Range: 20-200, sets pivot detection period for swing highs/lows, lower values (20-50) mark shorter-term liquidity, higher (100-200) identify major swings
Max Liquidity Age (bars) – Default: 100, Range: 20-500, removes liquidity lines older than specified bars, adjust based on timeframe
Liquidity Sensitivity – Default: 0.5, Range: 0.1-1.0, controls pivot detection sensitivity, lower values mark only major swings, higher values identify minor swings
Max Liquidity Zones to Display – Default: 3, Range: 1-10, limits total liquidity levels shown maintaining chart clarity
Market Structure Settings
Pivot Length – Default: 5, Range: 3-15, defines bars to left/right for pivot validation, lower values (3-5) create sensitive structure breaks, higher (10-15) filter for major shifts
Min Structure Move (%) – Default: 1.0, Range: 0.1-5.0, sets minimum percentage move required between pivots to confirm structure change
Multi-Timeframe Settings
Enable MTF Analysis – Default: On, activates higher timeframe trend analysis incorporation into Smart Money Score
Higher Timeframe Multiplier – Default: 4, Range: 2-10, multiplies current timeframe to determine analysis timeframe (4x on 15min = 1hour)
Visual Settings
Bullish Color – Default: Green (#089981), sets color for bullish Order Blocks, FVGs, and structure elements
Bearish Color – Default: Red (#f23645), defines color for bearish elements
Neutral Color – Default: Gray (#787b86), controls color of mitigated zones and neutral elements
Show Educational Labels – Default: On, displays text labels on zones identifying type (OB, FVG, BOS), disable once familiar with patterns
Order Block Transparency – Default: 92, Range: 80-98, controls Order Block box transparency
FVG Transparency – Default: 92, Range: 80-98, sets Fair Value Gap zone transparency independently from Order Blocks
Alert Settings
Alert on Order Block Formation – Default: On, triggers notification when new volume-validated Order Block detected
Alert on FVG Formation – Default: On, sends alert when Fair Value Gap appears enabling quick response to imbalances
Alert on Break of Structure – Default: On, notifies when BOS or CHoCH confirmed
Alert on High Smart Money Score – Default: On, alerts when Smart Money Score crosses above 70 threshold indicating high-probability setup
✅Best Use Cases
Order Block Retest Entries – After Break of Structure, wait for price retrace into fresh bullish Order Block with Smart Money Score >70, enter long on zone reaction targeting next liquidity level
Fair Value Gap Retracement Trading – When price creates FVG during strong move then retraces, enter as price approaches unfilled gap expecting institutional orders to continue trend
Liquidity Sweep Reversals – Monitor price approaching swing high/low liquidity zones against prevailing Smart Money Score trend, after stop hunt sweep watch for rejection into premium Order Block/FVG
Multi-Timeframe Confluence Setups – Identify alignment when current timeframe Order Block coincides with higher timeframe FVG plus MTF analysis showing matching trend bias
Break of Structure Continuations – After BOS confirms trend direction, trade pullbacks to nearest Order Block or FVG in direction of structure break using Smart Money Score >70 as entry filter
Change of Character Reversal Plays – When CHoCH detected indicating potential reversal, look for Smart Money Score pivot with opposing Order Block formation then enter on structure confirmation
⚠️Limitations
Lagging Pivot Calculations – Pivot-based features (Liquidity Zones, Market Structure) require bars to right of pivot for confirmation, meaning these elements identify levels retrospectively with delay equal to lookback period
Whipsaw in Ranging Markets – During choppy conditions, Order Blocks fail frequently and structure breaks produce false signals as Smart Money Score fluctuates without clear institutional bias, best used in trending markets
Volume Data Dependency – Order Block volume validation requires accurate volume data which may be incomplete on Forex pairs or limited in crypto exchange feeds
Subjectivity in Scoring Weights – Proprietary 25-20-20-20-15 weighting reflects general institutional behavior but may not optimize for specific instruments or market regimes, user cannot adjust factor weights
Visual Complexity on Lower Timeframes – Sub-hour timeframes generate excessive zones creating cluttered charts, requires aggressive display limit reduction and higher minimum thresholds
No Fundamental Integration – Indicator analyzes purely technical price action and volume without incorporating economic events, news catalysts, or fundamental shifts that override technical levels
💡What Makes This Unique
Unified SMC Ecosystem – Unlike indicators displaying Order Blocks OR FVGs OR Liquidity separately, SMFI combines all three institutional concepts plus market structure into single cohesive system
Proprietary Confidence Scoring – Rather than manual setup assessment, automated Smart Money Score quantifies probability by weighting five institutional dimensions into actionable 0-100 rating
Volume-Filtered Quality – Eliminates weak Order Blocks forming without institutional volume confirmation, ensuring displayed zones represent genuine accumulation/distribution
Adaptive Lifecycle Management – Automatically updates mitigation status and removes aged zones preventing trades on dead levels through continuous validity and age monitoring
Educational Integration – Built-in tooltips, labeled zones, and reference panel make indicator functional for both learning Smart Money Concepts and executing strategies
🔬How It Works
Order Block Detection – Scans for patterns where strong directional move follows counter-move creating last down-candle before rally (bullish OB) or last up-candle before sell-off (bearish OB), validates formations only when candle exhibits volume exceeding configurable multiple (default 1.5x) of 20-bar average volume
Fair Value Gap Identification – Compares current candle’s high/low against two-candles-prior low/high to detect price imbalances, calculates gap size as percentage of close and filters micro-gaps below minimum threshold (default 0.3%), monitors whether subsequent price fills 50% triggering mitigation status
Liquidity Zone Mapping – Employs pivot detection using configurable lookback (default 50 bars) to identify swing highs/lows where retail stops cluster, extends horizontal reference lines from pivot creation and applies age-based filtering to remove stale zones
Market Structure Analysis – Tracks pivot progression using structure-specific lookback (default 5 bars) to determine trend, confirms uptrend when new pivot high exceeds previous by minimum move percentage, detects Break of Structure when price breaks recent pivot level, flags Change of Character for potential reversals
Multi-Timeframe Confluence – When enabled, requests security data from higher timeframe (current TF × HTF multiplier, default 4x), compares HTF close against HTF 20-period MA to determine bias, contributes ±50 points to score ensuring alignment with institutional positioning on superior timeframe
Smart Money Score Calculation – Evaluates Order Block component via ATR-normalized distance producing max 100-point contribution weighted at 25%, assesses FVG factor through age penalty and distance at 20% weight, calculates Liquidity proximity at 20%, incorporates structure bias (±50-100 points) at 20%, adds MTF component at 15%, applies 3-period smoothing to reduce volatility
Visual Rendering and Lifecycle – Draws Order Block boxes, Fair Value Gap rectangles with color coding (green/red active, gray mitigated), extends liquidity dashed lines with fade-by-age opacity, plots BOS labels, displays Smart Money Score dashboard, continuously updates checking mitigation conditions and removing elements exceeding age/display limits
💡Note:
The Smart Money Flow Index combines multiple Smart Money Concepts into unified institutional order flow analysis. For optimal results, use the Smart Money Score as confluence filter rather than standalone entry signal – scores above 70 indicate high-probability setups but should be combined with risk management, higher timeframe bias, and market regime understanding.

Lord Mathew ATSThe Smart Money Structure & Pattern Analyzer is a complete, all-in-one visual trading system that brings together every essential element of Smart Money Concepts (SMC), ICT methodology, and candlestick psychology into one powerful indicator.
It is designed to help traders instantly understand the market’s structure, liquidity flow, and potential turning points without switching tools or manually marking charts. Whether you trade forex, indices, crypto, or commodities, this indicator automatically identifies where institutional activity, imbalances, and price inefficiencies occur in real time.
With its advanced algorithm, it plots market structure shifts, equal highs and lows, liquidity zones, order blocks, fair value gaps (FVGs), and previous week and day levels (PWO, PWH, PWL, PWC, PDO, PDH, PDL, PDO). It also integrates a deep candlestick recognition engine that detects over ten classic and advanced candle formations including engulfing patterns, dojis, hammers, shooting stars, morning/evening stars, and spinning tops to provide precise confirmation at critical points of interest.
This indicator isn’t just a tool it’s a complete market map that helps traders visualize how institutional order flow and candlestick sentiment interact.
Core Features
📊 Market Structure Detection:
Automatically marks swing highs/lows, Break of Structure (BOS), and Change of Character (CHOCH) in real time.
💧 Liquidity Mapping:
Highlights equal highs/lows and liquidity grabs, showing where price is likely to target before a reversal or continuation.
🧱 Order Block Visualization:
Displays the last bullish or bearish candle before an impulsive displacement, acting as a potential institutional entry zone.
⚡ Fair Value Gap (FVG) Scanner:
Detects and highlights imbalances where price moved too fast, helping you identify high-probability retracement areas.
🕯️ Candlestick Pattern Recognition:
Recognizes key reversal and continuation patterns (engulfing, hammer, shooting star, doji, morning/evening star, etc.) in real time.
📅 Institutional Reference Points:
Plots previous week & day open (PWO, PDO), previous week & day high (PWH, PWH), previous week & day low (PWL, PDL), previous week & day close (PWC, PDC) and optionally previous day levels to help frame bias.
🎨 Customizable Design:
Toggle any feature, change colors, and set alerts when multiple Smart Money signals align for cleaner, faster decision-making.
How It Works
Add the indicator to your chart on any timeframe or market.
The algorithm automatically detects structure, liquidity, and imbalance zones.
Candlestick patterns are highlighted when they form near high-probability areas (like OBs or FVGs).
When confluence occurs such as a liquidity grab, FVG fill, and bullish engulfing candle—the indicator provides a visual signal zone for your confirmation-based entries.
You can refine your trades using higher-timeframe bias (HTF order flow) and lower-timeframe execution (LTF confirmation).
Best For
Traders using ICT, Smart Money Concepts, or price-action systems.
Intraday and swing traders looking for clear, data-driven chart structure.
Traders who want to simplify confluence analysis and focus on precision execution.
Why It Stands Out
Unlike standard candlestick or pattern scanners, this indicator merges institutional market logic with technical candle behavior, allowing traders to see where smart money might be entering or exiting positions.
It’s not about random signals it’s about context, structure, and confirmation.
Every feature in this indicator is built around the principle of liquidity engineering:
price creates liquidity, grabs it, and moves toward imbalance or order flow efficiency.
By merging that institutional logic with candlestick patterns, this tool gives traders an edge in recognizing not only where to trade but why price is reacting in that exact area.
Disclaimer
This indicator is intended for educational and analytical use. It does not provide financial advice or guaranteed trading results. Always backtest and manage your risk responsibly.

Dynamic Auto FibonacciDynamic Auto Fibonacci - Logarithmic Fib Retracements & Extensions
Overview
Dynamic Auto Fibonacci is an advanced Fibonacci analysis tool that automatically identifies swing highs and lows to plot precise retracement and extension levels on your chart. Unlike traditional manual Fibonacci tools, this indicator dynamically updates as price action evolves, with full support for logarithmic scaling - essential for accurate analysis on long-term charts and high-growth assets.
The indicator features a clean, modern aesthetic with customizable vibrant colors and text-only labels that won't clutter your chart, making it perfect for both intraday scalping and long-term position trading.
Key Features
✅ Automatic Fibonacci Detection - Automatically finds the highest high and lowest low within your selected timeframe
✅ Manual Anchor Point - Click directly on the chart to set a custom low point for your Fibonacci analysis
✅ Logarithmic Scale Support - True logarithmic Fibonacci calculations for accurate levels on log-scale charts
✅ Flexible Display Modes - Show retracements only, extensions only, or both simultaneously
✅ Fully Customizable Levels - Adjust any Fibonacci level value, color, or toggle individual levels on/off
✅ Unified Color Mode - One-click option to change all levels to a single color (perfect for minimalist chart styles)
✅ Clean Modern Design - Text-only labels with vibrant colors and adjustable positioning
✅ 13 Default Levels - Includes 0.0, 0.236, 0.382, 0.5, 0.618, 0.786, 0.886, 1.0, 1.236, 1.414, 1.618, 2.0, and 2.618
How to Use
Quick Start (Automatic Mode)
Add the indicator to your chart
By default, it will automatically find the lowest and highest points over the past 12 months
Fibonacci levels will appear with clean colored text labels positioned to the right of current price
Setting a Custom Anchor Point (Manual Mode)
This is the most powerful feature - drawing from a specific swing low:
Click the Settings icon (gear) on the indicator
Navigate to Fibonacci Settings group
Click inside the "Anchor Start Time" field - this will activate anchor selection mode
Click directly on the candle where you want to set your swing low point on the chart
The indicator will automatically:
Lock that candle as your anchor (swing low)
Find the highest high that occurred after your selected anchor point
Draw Fibonacci retracement and extension levels between those two points
Important: The anchor represents the starting point (0.0 level) of your Fibonacci, and the indicator finds the peak after that point as the 1.0 level.
Display Modes
Navigate to Display Settings → Display Mode to choose:
Retracements & Extensions (default) - Shows all levels from 0.0 to 2.618
Retracements Only - Shows only 0.0 to 1.0 levels (great for identifying pullback entry zones)
Extensions Only - Shows 1.0+ levels (useful for profit targets and breakout projections)
Customizing Individual Levels
Under Retracement Levels and Extension Levels groups, each level has three controls:
Toggle checkbox - Show/hide the level
Value field - Adjust the exact Fibonacci ratio (e.g., change 0.618 to 0.65 if desired)
Color picker - Set unique colors for each level
Unified Color Override
Perfect for chart screenshots or minimalist aesthetics:
Go to Unified Color Override settings group
Enable "Use Unified Color for All Levels"
Choose your color (defaults to gray)
All lines and text immediately change to that color - individual settings are preserved when you toggle back off
Line & Label Customization
Display Settings group offers:
Line Style: Solid, Dashed, or Dotted
Line Length: Short (10 bars), Medium (50 bars), or Long (extends right infinitely)
Line Width: 1-5 pixels
Label Size: Tiny to Huge
Label Offset: Adjust how many bars to the right labels appear (default: 12)
Show Anchor Line: Display vertical lines at your swing low and swing high points
Settings Overview
Fibonacci Settings:
Retracement Timeframe (default: 12M)
Anchor Start Time (click to select candle)
Use Log Scale Calculation (highly recommended for crypto and growth stocks)
Display Settings:
Display Mode (Retracements & Extensions / Retracements Only / Extensions Only)
Line Style, Length, Width
On-Chart Labels (clean text) or Price Scale Labels (traditional right-side axis)
Label Size and Offset
Unified Color Override:
One-click monochrome mode for all levels
Individual Level Controls:
8 customizable retracement levels (0.0 to 1.0)
5 customizable extension levels (1.236 to 2.618)
Use Cases
📊 Swing Trading - Identify key support/resistance zones for entries and exits
📊 Scalping - Use short-term anchors to find precise intraday reversal levels
📊 Position Trading - Logarithmic calculations essential for multi-year crypto/stock analysis
📊 Options Trading - Extension levels provide excellent profit target zones
📊 Multi-Timeframe Analysis - Set different anchors to compare short-term vs. long-term Fibonacci structures
Tips for Best Results
For cryptocurrency and growth stocks: Always enable "Use Log Scale Calculation" and view your chart in log scale
For precision: Use the manual anchor feature to draw from confirmed swing lows/highs rather than relying on automatic detection
For clean charts: Toggle off levels you don't actively use (e.g., disable 0.786 and 0.886 if you only trade 0.382/0.618)
For screenshots: Enable Unified Color Override and set to grayscale for professional-looking chart exports
Note on Logarithmic Scale
This indicator includes true logarithmic Fibonacci calculations, which are critical when analyzing assets with significant price appreciation. Standard arithmetic Fibonacci tools become increasingly inaccurate on log-scale charts - this indicator solves that problem by calculating levels using logarithmic mathematics when "Use Log Scale Calculation" is enabled.
Disclaimer: This indicator is a tool for technical analysis and does not constitute financial advice. Always perform your own analysis and risk management before making trading decisions.

Liquidity Sweep & Reversal — Body Anchored + Risk (v6)Overview
The Liquidity Sweep & Reversal — Locked to Price (v6) indicator identifies liquidity sweeps around major swing highs and lows, confirming reversals when price closes back inside the swept level.
All signals are locked to price (bottom of green candle for BUY, top of red candle for SELL), so they remain perfectly aligned when zooming or scaling.
This indicator is ideal for swing traders and scalpers who trade reversals, liquidity events, and reclaim structures.
How It Works
Detects confirmed swing highs and lows using a pivot-based structure.
Waits for a liquidity sweep — when price wicks beyond a recent swing.
Confirms a reclaim when price closes back inside the previous swing level.
Triggers a BUY or SELL signal anchored to the candle body.
Automatically calculates stop loss and risk using ATR and your inputs.
Input Settings
Swing Detection
Swing Detection Strength: How many bars confirm a swing pivot. Higher = stronger swings.
Bars to Confirm Reclaim: Number of bars after a sweep for price to close back within the swing zone.
Swing Proximity %: How close price must come to a swing to count as a liquidity sweep.
Trend Filter (optional)
Use EMA Trend Filter: When enabled, only BUY in uptrend and SELL in downtrend.
Fast EMA Length / Slow EMA Length: Define EMAs used to detect trend direction.
Risk & Stop Management
ATR Length: Period for ATR calculation (volatility measurement).
Base ATR Stop Buffer (x ATR): Distance of stop loss from entry based on ATR multiplier.
Position Size (quote units): Your total position size in quote currency (e.g., USDT).
Risk % of (Position / 20): Defines how much of your position to risk per trade.
Example: (Position / 20) × Risk % = per-trade risk.
Chart Elements
BUY Arrow (green): Appears after a liquidity sweep and reclaim near a swing low.
SELL Arrow (red): Appears after a sweep and reclaim near a swing high.
Labels: Display entry price, stop loss (SL), and calculated risk dollar value.
EMAs: Optional fast/slow moving averages for directional bias.
Dynamic Stops: Adjust automatically using ATR × risk settings.
Trading Tips
Use BUY signals near liquidity sweeps under swing lows.
Use SELL signals near liquidity sweeps above swing highs.
Adjust swing length for different timeframes:
Lower values for scalping (3–5)
Higher values for swing trading (7–10)
Respect stop loss levels and use risk control settings for consistent sizing.
Combine with volume, OBV, or structure for confirmation.
Alerts
BUY — Locked to Price: "BUY: swing low reclaimed with dynamic stop."
SELL — Locked to Price: "SELL: swing high reclaimed with dynamic stop."
Best Use Cases
Liquidity-based reversals
Swing entry confirmation
Stop hunt reclaims
Structure-based entries
Author
Created by @roccodallas
For traders who value clean structure, risk control, and chart precision.

Fib OscillatorWhat is Fib Oscillator and How to Use it?
🔶 1. Conceptual Overview
The Fib Oscillator is a Fibonacci-based relative position oscillator.
Instead of measuring momentum (like RSI or MACD), it measures where price currently sits between the recent swing high and swing low, expressed as a percentage within the Fibonacci range.
In other words:
It answers: “Where is price right now within its most recent dynamic range?”
It visualizes retracement and extension zones numerically, providing continuous feedback between 0% and 100% (and beyond if extended).
🔶 2. What the Script Does
The indicator:
Automatically detects recent high and low levels using an adaptive lookback window, which depends on ATR volatility.
Calculates the current price’s position between those levels as a percentage (0–100).
Plots that percentage as an oscillator — showing visually whether price is near the top, middle, or bottom of its recent range.
Overlays Fibonacci retracement levels (23.6%, 38.2%, 50%, 61.8%, 78.6%) as reference zones.
Generates alerts when the oscillator crosses key Fib thresholds — which can signal retracement completion, breakout potential, or pullback exhaustion.
🔶 3. Technical Flow Breakdown
(a) Inputs
Input Description Default Notes
atrLength ATR period used for volatility estimation 14 Used to dynamically tune lookback sensitivity
minLookback Minimum lookback window (candles) 20 Ensures stability even in low volatility
maxLookback Maximum lookback window 100 Limits over-expansion during high volatility
isInverse Inverts chart orientation false Useful for inverse markets (e.g. shorts or inverse BTC view)
(b) Volatility-Adaptive Lookback
Instead of using a fixed lookback, it calculates:
lookback
=
SMA(ATR,10)
/
SMA(Close,10)
×
500
lookback=SMA(ATR,10)/SMA(Close,10)×500
Then it clamps this between minLookback and maxLookback.
This makes the oscillator:
More reactive during high volatility (shorter lookback)
More stable during calm markets (longer lookback)
Essentially, it self-adjusts to market rhythm — you don’t have to constantly tweak lookback manually.
(c) High-Low Reference Points
It takes the highest and lowest points within the dynamic lookback window.
If isInverse = true, it flips the candle logic (useful if viewing inverse instruments like stablecoin pairs or when analyzing bearish setups invertedly).
(d) Oscillator Core
The main oscillator line:
osc
=
(
close
−
low
)
(
high
−
low
)
×
100
osc=
(high−low)
(close−low)
×100
0% = Price is at the lookback low.
100% = Price is at the lookback high.
50% = Midpoint (balanced).
Between Fibonacci percentages (23.6%, 38.2%, 61.8%, etc.), the oscillator indicates retracement stages.
(e) Fibonacci Levels as Reference
It overlays horizontal reference lines at:
0%, 23.6%, 38.2%, 50%, 61.8%, 78.6%, 100%
These act as support/resistance bands in oscillator space.
You can read it similar to how traders use Fibonacci retracements on charts, but compressed into a single line oscillator.
(f) Alerts
The script includes built-in alert conditions for crossovers at each major Fibonacci level.
You can set TradingView alerts such as:
“Oscillator crossed above 61.8%” → possible bullish continuation or breakout.
“Oscillator crossed below 38.2%” → possible pullback or correction starting.
This allows automated monitoring of fib retracement completions without manually drawing fib levels.
🔶 4. How to Use It
🔸 Visual Interpretation
Oscillator Value Zone Market Context
0–23.6% Deep Retracement Potential exhaustion of a down-move / early reversal
23.6–38.2% Shallow retracement zone Possible continuation phase
38.2–50% Mid retracement Neutral or indecisive structure
50–61.8% Key pivot region Common trend resumption zone
61.8–78.6% Late retracement Often “last pullback” area
78.6–100% Near high range Possible overextension / profit-taking
>100% Range breakout New leg formation / expansion
🔸 Practical Application Steps
Load the indicator on your chart (set overlay = false, so it’s below the main price chart).
Observe oscillator position relative to fib bands:
Use it to determine retracement depth.
Combine with structure tools:
Trend lines, swing points, or HTF market structure.
Use crossovers for timing:
Crossing above 61.8% in an uptrend often confirms breakout continuation.
Crossing below 38.2% in a downtrend signals renewed downside momentum.
For range markets, oscillator swings between 23.6% and 78.6% can define accumulation/distribution boundaries.
🔶 5. When to Use It
During Retracements: To gauge how deep the pullback has gone.
During Range Markets: To identify relative overbought/oversold positions.
Before Breakouts: Crossovers of 61.8% or 78.6% often precede impulsive moves.
In Multi-Timeframe Contexts:
LTF (15M–1H): Detect intraday retracement exhaustion.
HTF (4H–1D): Confirm major range expansions or key reversal zones.
🔶 6. Ideal Companion Indicators
The Fib Oscillator works best when contextualized with structure, volatility, and trend bias indicators.
Below are optimal pairings:
Companion Indicator Purpose Integration Insight
Market Structure MTF Tool Identify active trend direction Use Fib Oscillator only in trend direction for cleaner signals
EMA Ribbon / Supertrend Trend confirmation Align oscillator crossovers with EMA bias
ATR Bands / Volatility Envelope Validate breakout strength If oscillator >78.6% & ATR rising → valid breakout
Volume Oscillator Confirm retracement strength Volume contraction + oscillator under 38.2% → potential reversal
HTF Fib Retracement Tool Combine LTF oscillator with HTF fib confluence Powerful multi-timeframe setups
RSI or Stochastic Measure momentum relative to position RSI divergence while oscillator near 78.6% → exhaustion clue
🔶 7. Understanding the Settings
Setting Function Practical Impact
ATR Period (14) Controls volatility sampling Higher = smoother lookback adaptation
Min Lookback (20) Smallest window allowed Lower = more reactive but noisier
Max Lookback (100) Largest window allowed Higher = smoother but slower to react
Inverse Candle Chart Flips oscillator vertically Useful when analyzing bearish or inverse scenarios (e.g. short-side fib mapping)
Recommended Configs:
For scalping/intraday: ATR 10–14, lookback 20–50
For swing/position trading: ATR 14–21, lookback 50–100
🔶 8. Example Trade Logic (Practical Use)
Scenario: Uptrend on 4H chart
Oscillator drops to below 38.2% → retracement zone
Price consolidates → oscillator stabilizes
Oscillator crosses above 50% → pullback ending
Entry: Long when oscillator crosses above 61.8%
Exit: Near 78.6–100% zone or upon divergence with RSI
For Short Bias (Inverse Setup):
Enable isInverse = true to visually flip the oscillator (so lows become highs).
Use the same thresholds inversely.
🔶 9. Strengths & Limitations
✅ Strengths
Dynamic, self-adapting to volatility
Quantifies Fib retracement as a continuous function
Compact oscillator view (no clutter on chart)
Works well across all timeframes
Compatible with both trending and ranging markets
⚠️ Limitations
Doesn’t define trend direction — must be used with structure filters
Can whipsaw during choppy consolidations
The “lookback auto-adjust” may lag in sudden volatility shifts
Shouldn’t be used standalone for entries without structural confluence
🔶 10. Summary
The “Fib Oscillator” is a dynamic Fibonacci-relative positioning tool that merges retracement theory with adaptive volatility logic.
It gives traders an intuitive, quantified view of where price sits within its recent fib range, allowing anticipation of pullbacks, reversals, or breakout momentum.
Think of it as a "Fibonacci RSI", but instead of momentum strength, it shows positional depth — the vibrational location of price within its natural swing cycle.

ICT Anchored Market Structures with Validation [LuxAlgo]The ICT Anchored Market Structures with Validation indicator is an advanced iteration of the original Pure-Price-Action-Structures tool, designed for price action traders.
It systematically tracks and validates key price action structures, distinguishing between true structural shifts/breaks and short-term sweeps to enhance trend and reversal analysis. The indicator automatically highlights structural points, confirms breakouts, identifies sweeps, and provides clear visual cues for short-term, intermediate-term, and long-term market structures.
A distinctive feature of this indicator is its exclusive reliance on price patterns. It does not depend on any user-defined input, ensuring that its analysis remains robust, objective, and uninfluenced by user bias, making it an effective tool for understanding market dynamics.
🔶 USAGE
Market structure is a cornerstone of price action analysis. This script automatically detects real-time market structures across short-term, intermediate-term, and long-term levels, simplifying trend analysis for traders. It assists in identifying both trend reversals and continuations with greater clarity.
Market structure shifts and breaks help traders identify changes in trend direction. A shift signals a potential reversal, often occurring when a swing high or low is breached, suggesting a transition in trend. A break, on the other hand, confirms the continuation of an established trend, reinforcing the current direction. Recognizing these shifts and breaks allows traders to anticipate price movement with greater accuracy.
It’s important to note that while a CHoCH may signal a potential trend reversal and a BoS suggests a continuation of the prevailing trend, neither guarantees a complete reversal or continuation. In some cases, CHoCH and BoS levels may act as liquidity zones or areas of consolidation rather than indicating a clear shift or continuation in market direction. The indicator’s validation component helps confirm whether the detected CHoCH and BoS are true breakouts or merely liquidity sweeps.
🔶 DETAILS
🔹 Market Structures
Market structures are derived from price action analysis, focusing on identifying key levels and patterns in the market. Swing point detection, a fundamental concept in ICT trading methodologies and teachings, plays a central role in this approach.
Swing points are automatically identified based exclusively on market movements, without requiring any user-defined input.
🔹 Utilizing Swing Points
Swing points are not identified in real-time as they form. Short-term swing points may appear with a delay of up to one bar, while the identification of intermediate and long-term swing points is entirely dependent on subsequent market movements. Importantly, this detection process is not influenced by any user-defined input, relying solely on pure price action. As a result, swing points are generally not intended for real-time trading scenarios.
Instead, traders often analyze historical swing points to understand market trends and identify potential entry and exit opportunities. By examining swing highs and lows, traders can:
Recognize Trends: Swing highs and lows provide insight into trend direction. Higher swing highs and higher swing lows signify an uptrend, while lower swing highs and lower swing lows indicate a downtrend.
Identify Support and Resistance Levels: Swing highs often act as resistance levels, referred to as Buyside Liquidity Levels in ICT terminology, while swing lows function as support levels, also known as Sellside Liquidity Levels. Traders can leverage these levels to plan their trade entries and exits.
Spot Reversal Patterns: Swing points can form key reversal patterns, such as double tops or bottoms, head and shoulders, and triangles. Recognizing these patterns can indicate potential trend reversals, enabling traders to adjust their strategies effectively.
Set Stop Loss and Take Profit Levels: In ICT teachings, swing levels represent price points with expected clusters of buy or sell orders. Traders can target these liquidity levels/pools for position accumulation or distribution, using swing points to define stop loss and take profit levels in their trades.
Overall, swing points provide valuable information about market dynamics and can assist traders in making more informed trading decisions.
🔹 Logic of Validation
The validation process in this script determines whether a detected market structure shift or break represents a confirmed breakout or a sweep.
The breakout is confirmed when the close price is significantly outside the deviation range of the last detected structural price. This deviation range is defined by the 17-period Average True Range (ATR), which creates a buffer around the detected market structure shift or break.
A sweep occurs when the price breaches the structural level within the deviation range but does not confirm a breakout. In this case, the label is updated to 'SWEEP.'
A visual box is created to represent the price range where the breakout or sweep occurs. If the validation process continues, the box is updated. This box visually highlights the price range involved in a sweep, helping traders identify liquidity events on the chart.
🔶 SETTINGS
The settings for Short-Term, Intermediate-Term, and Long-Term Structures are organized into groups, allowing users to customize swing points, market structures, and visual styles for each.
🔹 Structures
Swings and Size: Enables or disables the display of swing highs and lows, assigns icons to represent the structures, and adjusts the size of the icons.
Market Structures: Toggles the visibility of market structure lines.
Market Structure Validation: Enable or disable validation to distinguish true breakouts from liquidity sweeps.
Market Structure Labels: Displays or hides labels indicating the type of market structure.
Line Style and Width: Allows customization of the style and width of the lines representing market structures.
Swing and Line Colors: Provides options to adjust the colors of swing icons, market structure lines, and labels for better visualization.
🔶 RELATED SCRIPTS
Pure-Price-Action-Structures.
Market-Structures-(Intrabar).

Simple Pivot Zones (Error-free) — v11. Core Idea
The indicator we built is a “pivot-based zone detector with breakout signals.”
It does three things:
1. Finds important swing highs and swing lows in price (pivots).
2. Creates support and resistance zones around those pivots using volatility (ATR).
3. Watches price action to see if those zones get broken, then gives signals.
________________________________________
2. What is a Pivot?
A pivot high happens when the price makes a local peak — a bar is higher than the bars around it.
A pivot low happens when the price makes a local dip — a bar is lower than the bars around it.
These are natural turning points in the market, showing where buyers or sellers had strong control temporarily. Traders often use them to draw support (pivot lows) and resistance (pivot highs).
________________________________________
3. Why Use ATR for Zones?
ATR (Average True Range) measures the average volatility of a market. Instead of drawing just a flat line at the pivot, we create a zone above and below it, sized according to ATR.
Example:
• If ATR is 20 points and zone size is 0.5, then the zone extends 10 points above and below the pivot level.
This turns thin “lines” into thicker areas of interest. Real markets don’t respect razor-thin levels, but zones are more realistic.
________________________________________
4. How Support & Resistance Zones Work
• Resistance zones are created at pivot highs. They mark where sellers were strong before.
• Support zones are created at pivot lows. They mark where buyers were strong before.
Over time, these zones extend forward until the price interacts with them.
________________________________________
5. Breakout Detection
The indicator checks whether the price closes beyond the last pivot high or low:
• If price closes above the last pivot high, it means buyers have broken resistance.
• If price closes below the last pivot low, it means sellers have broken support.
These moments are significant because they often trigger trend continuation.
________________________________________
6. Parameters It Uses
1. Pivot Length – how many bars to look back and forward to confirm a pivot. A higher length makes pivots less frequent but stronger.
2. ATR Length and Multiplier – defines the size of the zones (wider zones in more volatile markets).
3. Max Zones to Keep – avoids clutter by keeping only the most recent zones.
4. Colors & Styling – helps traders visually separate bullish and bearish zones.
________________________________________
7. How It Helps Traders
• Visual clarity: Instead of guessing support and resistance, the chart automatically highlights them.
• Dynamic adjustment: Zones adapt to volatility using ATR, making them useful in both calm and volatile markets.
• Breakout signals: Traders get notified when price actually breaks key levels, instead of reacting late.
• Cleaner charts: Instead of dozens of hand-drawn lines, the tool manages zones for you, deleting old ones.
________________________________________
8. The Logic in One Sentence
It finds important swing highs and lows, turns them into support/resistance zones scaled by volatility, and alerts you when the market breaks through them.
________________________________________
👉 In practice, this helps traders spot where the market is likely to bounce or break, and gives a framework to plan trades — for example, buying on bullish breakouts or selling on bearish breakouts.
________________________________________
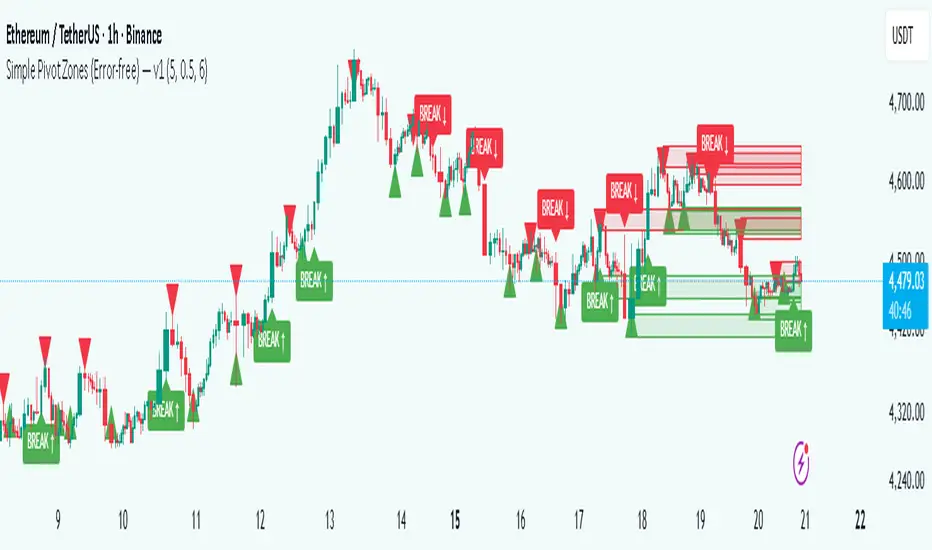
ICT Sweep + FVG Entry (v6) • Antoine📌 ICT Sweep + FVG Entry (Antoine)
This indicator is designed for price action traders who follow ICT concepts and want a mechanical tool to spot liquidity sweeps, fair value gaps (FVGs), and precise entry signals.
🔎 Key Features
Liquidity Pools (HTF)
• Automatically plots recent swing highs/lows from a higher timeframe (5m/15m).
• These act as Buy Side Liquidity (BSL) and Sell Side Liquidity (SSL) levels where stop orders accumulate.
Sweep Detection
• Identifies when price breaks a pool (BSL/SSL) but closes back inside → a classic liquidity grab.
• Plots a triangle on the chart when a sweep is confirmed.
Fair Value Gap (FVG) Highlighting
• Detects bullish and bearish FVGs on the execution timeframe (ideal for 1m).
• Option to display active FVG zones with shaded boxes.
Entry Signals
• A signal (cross) appears when:
A liquidity sweep occurs.
An FVG forms in the direction of the rejection.
Price retests the FVG (entry at the 50% mid-level or edge).
Alerts Ready
• Get alerted for sweeps (bullish/bearish) and for entry confirmations (long/short FVG retests).
🎯 How to Use
Choose your HTF (5m or 15m) → The indicator maps major liquidity pools.
Drop to LTF (1m) → Wait for a sweep signal at one of the pools.
Confirm with FVG → If an FVG appears in the sweep’s direction, the indicator waits for a retest.
Entry → Enter on the retest of the FVG (edge or 50%).
Risk Management
Stop loss: just beyond the sweep’s wick.
Target: opposite liquidity pool.
Minimum recommended R:R: 1:2.
✅ Why this helps
This tool makes it easier to trade ICT-style setups without missing opportunities:
No need to manually draw every swing high/low.
Automatic FVG detection saves time.
Clear sweep + FVG + retest logic keeps your entries mechanical and disciplined.
⚠️ Disclaimer: This script is for educational purposes only. It does not guarantee profits. Always use proper risk management.
