Fibonacci Trend [ChartPrime]Fibonacci Trend Indicator
This powerful indicator leverages supertrend analysis to detect market direction while overlaying dynamic Fibonacci levels to highlight potential support, resistance, and optimal trend entry zones. With its straightforward design, it is perfect for traders looking to simplify their workflow and enhance decision-making.
⯁ KEY FEATURES AND HOW TO USE
⯌ Supertrend Trend Identification :
The indicator uses a supertrend algorithm to identify market direction. It displays purple for downtrends and green for uptrends, ensuring quick and clear trend analysis.
⯌ Fibonacci Levels for Current Swings :
Automatically calculates Fibonacci retracement levels (0.236, 0.382, 0.618, 0.786) for the current swing leg.
- These levels act as key zones for potential support, resistance, and trend continuation.
- The high and low swing points are labeled with exact prices, ensuring clarity.
- If the swing range is insufficient (less than five times ATR), Fibonacci levels are not displayed, avoiding irrelevant data.
⯌ Extended Fibonacci Levels :
User-defined extensions project Fibonacci levels into the future, aiding traders in planning price targets or projecting key zones.
⯌ Optimal Trend Entry Zone :
A filled area between 0.618 and 0.786 levels visually highlights the optimal entry zone for trend continuation. This allows traders to refine their entry points during pullbacks.
⯌ Diagonal Trend Line :
A dashed diagonal line connects the swing high and low, visually confirming the range and trend strength of the current swing.
⯌ Visual Labels for Fibonacci Levels :
Each Fibonacci level is marked with a label displaying its value for quick reference.
⯁ HOW TRADERS CAN POTENTIALLY USE THIS TOOL
Fibonacci Retracements:
Use the Fibonacci retracement levels to find key support or resistance zones where the price may pull back before continuing its trend.
Example: Enter long trades when the price retraces to 0.618–0.786 levels in an uptrend.
Fibonacci Extensions:
Use Fibonacci extensions to project future price targets based on the current trend's swing leg. Levels like 127.2% and 161.8% are commonly used as profit-taking zones.
Reversal Identification:
Spot potential reversals by monitoring price reactions at key Fibonacci retracement levels (e.g., 0.236 or 0.382) or the swing high/low.
Optimal Trend Entries:
The filled zone between 0.618 and 0.786 is a statistically strong area for entering a position in the direction of the trend.
Example: Enter long positions during retracements to this range in an uptrend.
Risk Management:
Set stop-losses below key Fibonacci levels or the swing low/high, and take profits at extension levels, enhancing your trade management strategies.
⯁ CONCLUSION
The Fibonacci Trend Indicator is a straightforward yet effective tool for identifying trends and key Fibonacci levels. It simplifies analysis by integrating supertrend-based trend identification with Fibonacci retracements, extensions, and optimal entry zones. Whether you're a beginner or experienced trader, this indicator is an essential addition to your toolkit for trend trading, reversal spotting, and risk management.
Wyszukaj w skryptach "swing high"

paranimonipobre
Chart Description: Buy Low, Sell High with Market Structure
This chart utilizes a dynamic trading strategy based on Bollinger Bands, RSI, and market structure analysis to identify high-probability buy and sell signals while aligning with prevailing trends.
Key Elements:
Bollinger Bands:
The upper (red) and lower (green) bands define volatility boundaries based on standard deviations.
The middle line (blue) represents the 20-period simple moving average.
Market Structure:
Swing highs (red triangles labeled "SH") and swing lows (green triangles labeled "SL") are identified to analyze the trend.
Background colors indicate trend direction:
Green Background: Uptrend (Higher Lows).
Red Background: Downtrend (Lower Highs).
RSI Indicator:
Shown in a separate pane, with overbought (red) at 70 and oversold (green) at 30.
Helps confirm signal validity by identifying momentum extremes.
Buy and Sell Signals:
Buy Signals (Green):
Triggered when the price crosses above the lower Bollinger Band, RSI is oversold (<30), and the market is in an uptrend.
Displayed as green "BUY" labels below bars.
Sell Signals (Red):
Triggered when the price crosses below the upper Bollinger Band, RSI is overbought (>70), and the market is in a downtrend.
Displayed as red "SELL" labels above bars.
How to Use:
Trend Identification:
Follow market structure analysis to determine the current trend direction.
Trade only in the direction of the trend (e.g., buy in an uptrend, sell in a downtrend).
Signal Confirmation:
Look for signals aligning with Bollinger Bands, RSI levels, and market structure.
Ignore signals that conflict with the trend to avoid false entries.
Market Conditions:
Best suited for trending markets with clear higher lows or lower highs.
Signals in choppy or sideways markets may require additional confirmation.

Swing-Based VWAPSwing-Based VWAP
Summary:
The "Swing-Based VWAP" indicator enhances traditional VWAP calculations by incorporating swing-based logic. It dynamically adapts to market conditions by identifying key swing highs and lows and calculating VWAP levels around these pivot points. This makes it a versatile tool for traders seeking actionable price insights.
Explanation:
What is Swing-Based VWAP?
The Swing-Based VWAP is a modified version of the Volume-Weighted Average Price (VWAP). It calculates VWAP not only for a chosen timeframe (e.g., session, week) but also adapts dynamically to market swings. By identifying swing highs and lows, it offers more precise levels for potential price action.
Unique Features:
1. Dynamic Swing Integration:
- Uses pivot points to determine significant price levels.
- Calculates VWAP based on these points to adapt to market trends.
2. User-Friendly Settings:
- Includes options to hide VWAP on higher timeframes for chart clarity.
- Flexible swing size input for adjusting sensitivity.
How to Use:
1. Configuring Swing Settings:
- Use the "Swing Setting" input to determine the sensitivity of swing detection.
- Higher values identify broader swings, while smaller values capture more granular movements.
2. Enabling/Disabling VWAP:
- Toggle VWAP visibility using the "Use VWAP" option.
- The "Hide VWAP on 1D or Above" setting lets you control visibility on higher timeframes.
3. Anchor Period:
- Select your preferred anchoring period (e.g., session, week) to match your trading style.
4. Adjusting the Data Source:
- Use the "Source" input to select the price source (default: HLC3).
5. Visualizing Swing-Based VWAP:
- The script plots a dynamic VWAP line based on detected swing points.
- This line highlights average price levels weighted by volume and swing pivots.
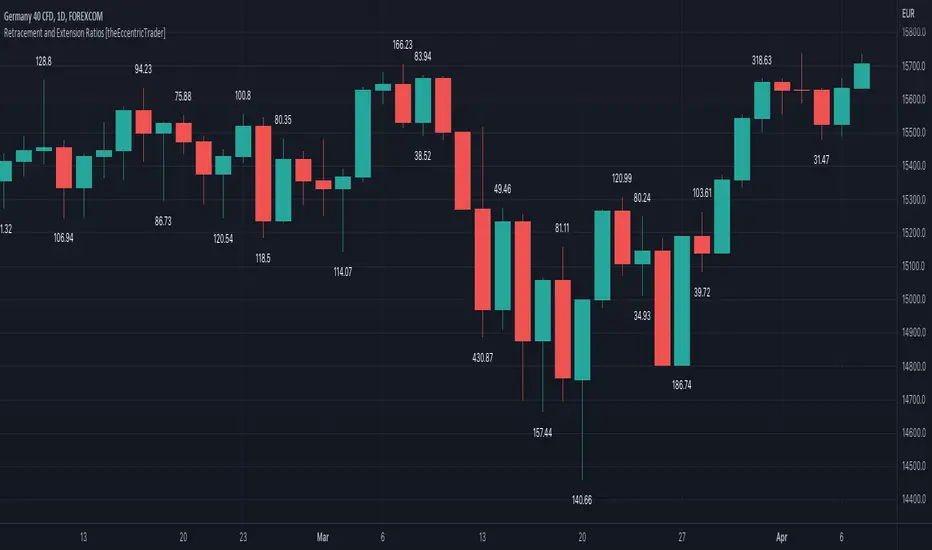
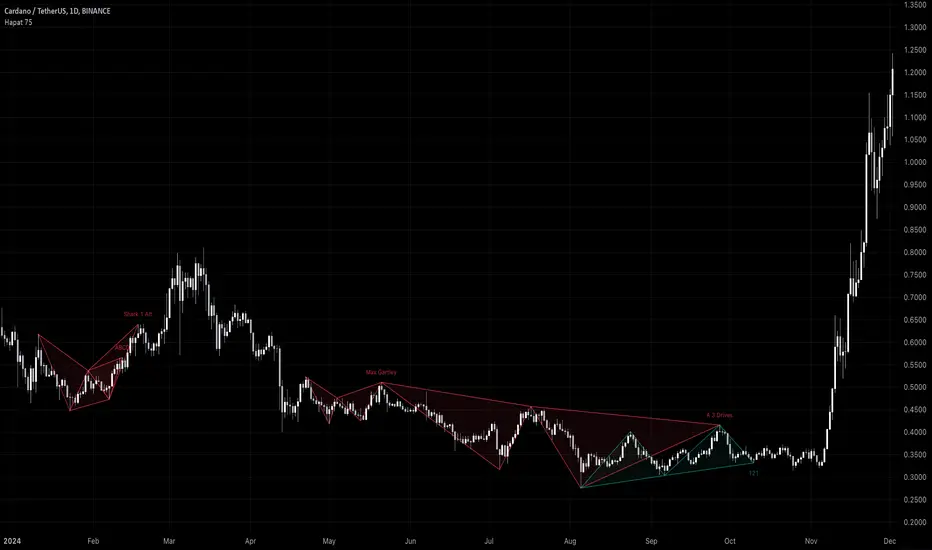
Harmonic Pattern Detector (75 patterns)Harmonic Pattern Detector offers a record amount of "Harmonic Patterns" in one script, with 75 different patterns detected, together with up to 99 different swing lengths.
🔶 USAGE
Harmonic Patterns are detected from several different ZigZag lines, derived from Swings with different lengths (shorter - longer term)
Depending on the settings ' Minimum/Maximum Swing Length ', the user will see more or less patterns from shorter and/or longer-term swing points.
🔹 Fibonacci Ratio
Certain patterns have only one ratio for a specific retrace/extension instead of one upper and one lower limit. In this case, we add a ' Tolerance ', which adds a percentage tolerance below/above the ratio, creating two limits.
A higher number may show more patterns but may become less valid.
Hoovering over points B, C, and D will show a tooltip with the concerning limits; adjusted limits will be seen if applicable.
Tooltips in settings will also show which patterns the Fibonacci Ratio applies to.
🔹 Triangle Area Ratio
Using Heron's formula , the triangle area is calculated after the X-Y axis is normalized.
Users can filter patterns based on the ratio of the smallest triangle to the largest triangle.
A lower Triangle Area Ratio number leads to more symmetrical patterns but may appear less frequently.
🔶 DETAILS
Harmonic patterns are based on geometric patterns, where the retracement/extension of a swing point must be located between specific Fibonacci ratios of the previous swing/leg. Different Harmonic Patterns require unique ratios to become valid patterns.
In the above example there is a valid 'Max Butterfly' pattern where:
Point B is located between 0.618 - 0.886 retracement level of the X-A leg
Point C is located between 0.382 - 0.886 retracement level of the A-B leg
Point D is located between 1.272 - 2.618 extension level of the B-C leg
Point D is located between 1.272 - 1.618 extension level of the X-A leg
Harmonic Pattern Detector uses ZigZag lines, where swing highs and swing lows alternate. Each ZigZag line is checked for valid Harmonic Patterns . When multiple types of Harmonic Patterns are valid for the same sequence, the pattern will be named after the first one found.
Different swing lengths form different ZigZag lines.
By evaluating different ZigZag lines (up to 99!), shorter—and longer-term patterns can be drawn on the same chart.
🔹 Blocks
The patterns are organized into blocks that can be toggled on or off with a single click.
When a block is enabled, the user can still select which specific patterns within that block are enabled or disabled.
🔹 Visuals
Besides color settings, labels can show pattern names or arrows at point D of the pattern.
Note this will happen 1 bar after validation because one extra bar is needed for confirmation.
An option is included to show only arrows without the patterns.
🔹 Updated Patterns
When a Swing Low is followed by a lower low or a Swing High followed by a higher high , triggering a pattern identical to a previous one except with a different point D, the pattern will be updated. The previous C-D line will be visible as a dashed line to highlight the event. Only the last dashed line is shown when this happens more than once.
🔹 Optimization
The script only verifies the last leg in the initial phase, significantly reducing the time spent on pattern validation. If this leg doesn't align with a potential Harmonic Pattern , the pattern is immediately disregarded. In the subsequent phase, the remaining patterns are quickly scrutinized to ensure the next leg is valid. This efficient process continues, with only valid patterns progressing to the next phase until all sequences have been thoroughly examined.
This process can check up to 99 ZigZag lines for 75 different Harmonic Patterns , showcasing its high capacity and versatility.
🔹 Ratios
The following table shows the different ratios used for each Harmonic Pattern .
' min ' and ' max ' are used when only one limit is provided instead of 2. This limit is given a percentage tolerance above and below, customizable by the setting ' Tolerance - Fibonacci Ratio '.
For example a ratio of 0.618 with a tolerance of 1% would result in:
an upper limit of 0.624
a lower limit of 0.612
|-------------------|------------------------|------------------------|-----------------------|-----------------------|
| NAME PATTERN | BCD (BD) | ABC (AC) | XAB (XB) | XAD (XD) |
| | min max | min max | min max | min max |
|-------------------|------------------------|------------------------|-----------------------|-----------------------|
| 'ABCD' | 1.272 - 1.618 | 0.618 - 0.786 | | |
| '5-0' | 0.5 *min - 0.5 *max | 1.618 - 2.24 | 1.13 - 1.618 | |
| 'Max Gartley' | 1.128 - 2.236 | 0.382 - 0.886 | 0.382 - 0.618 | 0.618 - 0.786 |
| 'Gartley' | 1.272 - 1.618 | 0.382 - 0.886 | 0.618*min - 0.618*max | 0.786*min - 0.786*max |
| 'A Gartley' | 1.618*min - 1.618*max | 1.128 - 2.618 | 0.618 - 0.786 | 1.272*min - 1.272*max |
| 'NN Gartley' | 1.128 - 1.618 | 0.382 - 0.886 | 0.618*min - 0.618*max | 0.786*min - 0.786*max |
| 'NN A Gartley' | 1.618*min - 1.618*max | 1.128 - 2.618 | 0.618 - 0.786 | 1.272*min - 1.272*max |
| 'Bat' | 1.618 - 2.618 | 0.382 - 0.886 | 0.382 - 0.5 | 0.886*min - 0.886*max |
| 'Alt Bat' | 2.0 - 3.618 | 0.382 - 0.886 | 0.382*min - 0.382*max | 1.128*min - 1.128*max |
| 'A Bat' | 2.0 - 2.618 | 1.128 - 2.618 | 0.382 - 0.618 | 1.128*min - 1.128*max |
| 'Max Bat' | 1.272 - 2.618 | 0.382 - 0.886 | 0.382 - 0.618 | 0.886*min - 0.886*max |
| 'NN Bat' | 1.618 - 2.618 | 0.382 - 0.886 | 0.382 - 0.5 | 0.886*min - 0.886*max |
| 'NN Alt Bat' | 2.0 - 4.236 | 0.382 - 0.886 | 0.382*min - 0.382*max | 1.128*min - 1.128*max |
| 'NN A Bat' | 2.0 - 2.618 | 1.128 - 2.618 | 0.382 - 0.618 | 1.128*min - 1.128*max |
| 'NN A Alt Bat' | 2.618*min - 2.618*max | 1.128 - 2.618 | 0.236 - 0.5 | 0.886*min - 0.886*max |
| 'Butterfly' | 1.618 - 2.618 | 0.382 - 0.886 | 0.786*min - 0.786*max | 1.272 - 1.618 |
| 'Max Butterfly' | 1.272 - 2.618 | 0.382 - 0.886 | 0.618 - 0.886 | 1.272 - 1.618 |
| 'Butterfly 113' | 1.128 - 1.618 | 0.618 - 1.0 | 0.786 - 1.0 | 1.128*min - 1.128*max |
| 'A Butterfly' | 1.272*min - 1.272*max | 1.128 - 2.618 | 0.382 - 0.618 | 0.618 - 0.786 |
| 'Crab' | 2.24 - 3.618 | 0.382 - 0.886 | 0.382 - 0.618 | 1.618*min - 1.618*max |
| 'Deep Crab' | 2.618 - 3.618 | 0.382 - 0.886 | 0.886*min - 0.886*max | 1.618*min - 1.618*max |
| 'A Crab' | 1.618 - 2.618 | 1.128 - 2.618 | 0.276 - 0.446 | 0.618*min - 0.618*max |
| 'NN Crab' | 2.236 - 4.236 | 0.382 - 0.886 | 0.382 - 0.618 | 1.618*min - 1.618*max |
| 'NN Deep Crab' | 2.618 - 4.236 | 0.382 - 0.886 | 0.886*min - 0.886*max | 1.618*min - 1.618*max |
| 'NN A Crab' | 1.128 - 2.618 | 1.128 - 2.618 | 0.236 - 0.447 | 0.618*min - 0.618*max |
| 'NN A Deep Crab' | 1.128*min - 1.128*max | 1.128 - 2.618 | 0.236 - 0.382 | 0.618*min - 0.618*max |
| 'Cypher' | 1.272 - 2.00 | 1.13 - 1.414 | 0.382 - 0.618 | 0.786*min - 0.786*max |
| 'New Cypher' | 1.272 - 2.00 | 1.414 - 2.14 | 0.382 - 0.618 | 0.786*min - 0.786*max |
| 'Anti New Cypher' | 1.618 - 2.618 | 0.467 - 0.707 | 0.5 - 0.786 | 1.272*min - 1.272*max |
| 'Shark 1' | 1.618 - 2.236 | 1.128 - 1.618 | 0.382 - 0.618 | 0.886*min - 0.886*max |
| 'Shark 1 Alt' | 1.618 - 2.618 | 0.618 - 0.886 | 0.446 - 0.618 | 1.128*min - 1.128*max |
| 'Shark 2' | 1.618 - 2.236 | 1.128 - 1.618 | 0.382 - 0.618 | 1.128*min - 1.128*max |
| 'Shark 2 Alt' | 1.618 - 2.618 | 0.618 - 0.886 | 0.446 - 0.618 | 0.886*min - 0.886*max |
| 'Leonardo' | 1.128 - 2.618 | 0.382 - 0.886 | 0.5*min - 0.5*max | 0.786*min - 0.786*max |
| 'NN A Leonardo' | 2.0*min - 2.0*max | 1.128 - 2.618 | 0.382 - 0.886 | 1.272*min - 1.272*max |
| 'Nen Star' | 1.272 - 2.0 | 1.414 - 2.14 | 0.382 - 0.618 | 1.272*min - 1.272*max |
| 'Anti Nen Star' | 1.618 - 2.618 | 0.467 - 0.707 | 0.5 - 0.786 | 0.786*min - 0.786*max |
| '3 Drives' | 1.272 - 1.618 | 0.618 - 0.786 | 1.272 - 1.618 | 1.618 - 2.618 |
| 'A 3 Drives' | 0.618 - 0.786 | 1.272 - 1.618 | 0.618 - 0.786 | 0.13 - 0.886 |
| '121' | 0.382 - 0.786 | 1.128 - 3.618 | 0.5 - 0.786 | 0.382 - 0.786 |
| 'A 121' | 1.272 - 2.0 | 0.5 - 0.786 | 1.272 - 2.0 | 1.272 - 2.618 |
| '121 BG' | 0.618 - 0.707 | 1.128 - 1.733 | 0.5 - 0.577 | 0.447 - 0.786 |
| 'Black Swan' | 1.128 - 2.0 | 0.236 - 0.5 | 1.382 - 2.618 | 1.128 - 2.618 |
| 'White Swan' | 0.5 - 0.886 | 2.0 - 4.237 | 0.382 - 0.786 | 0.238 - 0.886 |
| 'NN White Swan' | 0.5 - 0.886 | 2.0 - 4.236 | 0.382 - 0.724 | 0.382 - 0.886 |
| 'Sea Pony' | 1.618 - 2.618 | 0.382 - 0.5 | 0.128 - 3.618 | 0.618 - 3.618 |
| 'Navarro 200' | 0.886 - 3.618 | 0.886 - 1.128 | 0.382 - 0.786 | 0.886 - 1.128 |
| 'May-00' | 0.5 - 0.618 | 1.618 - 2.236 | 1.128 - 1.618 | 0.5 - 0.618 |
| 'SNORM' | 0.9 - 1.1 | 0.9 - 1.1 | 0.9 - 1.1 | 0.618 - 1.618 |
| 'COL Poruchik' | 1.0 *min - 1.0 *max | 0.382 - 2.618 | 0.128 - 3.618 | 0.618 - 3.618 |
| 'Henry – David' | 0.618 - 0.886 | 0.44 - 0.618 | 0.128 - 2.0 | 0.618 - 1.618 |
| 'DAVID VM 1' | 1.618 - 1.618 | 0.382*min - 0.382*max | 0.128 - 1.618 | 0.618 - 3.618 |
| 'DAVID VM 2' | 1.618 - 1.618 | 0.382*min - 0.382*max | 1.618 - 3.618 | 0.618 - 7.618 |
| 'Partizan' | 1.618*min - 1.618*max | 0.382*min - 0.382*max | 0.128 - 3.618 | 0.618 - 3.618 |
| 'Partizan 2' | 1.618 - 2.236 | 1.128 - 1.618 | 0.128 - 3.618 | 1.618 - 3.618 |
| 'Partizan 2.1' | 1.618*min - 1.618*max | 1.128*min - 1.128*max | 0.128 - 3.618 | 0.618 - 3.618 |
| 'Partizan 2.2' | 2.236*min - 2.236*max | 1.128*min - 1.128*max | 0.128 - 3.618 | 0.618 - 3.618 |
| 'Partizan 2.3' | 1.618*min - 1.618*max | 0.618 - 1.618 | 0.128 - 3.618 | 0.618 - 3.618 |
| 'Partizan 2.4' | 2.236*min - 2.236*max | 1.618*min - 1.618*max | 0.128 - 3.618 | 0.618 - 3.618 |
| 'TOTAL' | 1.272 - 3.618 | 0.382 - 2.618 | 0.276 - 0.786 | 0.618 - 1.618 |
| 'TOTAL NN' | 1.272 - 4.236 | 0.382 - 2.618 | 0.236 - 0.786 | 0.618 - 1.618 |
| 'TOTAL 1' | 1.272 - 2.618 | 0.382 - 0.886 | 0.382 - 0.786 | 0.786 - 0.886 |
| 'TOTAL 2' | 1.618 - 3.618 | 0.382 - 0.886 | 0.382 - 0.786 | 1.128 - 1.618 |
| 'TOTNN 2NN' | 1.618 - 4.236 | 0.382 - 0.886 | 0.382 - 0.786 | 1.128 - 1.618 |
| 'TOTAL 3' | 1.272 - 2.618 | 1.128 - 2.618 | 0.276 - 0.618 | 0.618 - 0.886 |
| 'TOTNN 3NN' | 1.272 - 2.618 | 1.128 - 2.618 | 0.236 - 0.618 | 0.618 - 0.886 |
| 'TOTAL 4' | 1.618 - 2.618 | 1.128 - 2.618 | 0.382 - 0.786 | 1.128 - 1.272 |
| 'BG 1' | 2.618*min - 2.618*max | 0.382*min - 0.382*max | 0.128 - 0.886 | 1.0 *min - 1.0 *max |
| 'BG 2' | 2.237*min - 2.237*max | 0.447*min - 0.447*max | 0.128 - 0.886 | 1.0 *min - 1.0 *max |
| 'BG 3' | 2.0 *min - 2.0 *max | 0.5 *min - 0.5 *max | 0.128 - 0.886 | 1.0 *min - 1.0 *max |
| 'BG 4' | 1.618*min - 1.618*max | 0.618*min - 0.618*max | 0.128 - 0.886 | 1.0 *min - 1.0 *max |
| 'BG 5' | 1.414*min - 1.414*max | 0.707*min - 0.707*max | 0.128 - 0.886 | 1.0 *min - 1.0 *max |
| 'BG 6' | 1.272*min - 1.272*max | 0.786*min - 0.786*max | 0.128 - 0.886 | 1.0 *min - 1.0 *max |
| 'BG 7' | 1.171*min - 1.171*max | 0.854*min - 0.854*max | 0.128 - 0.886 | 1.0 *min - 1.0 *max |
| 'BG 8' | 1.128*min - 1.128*max | 0.886*min - 0.886*max | 0.128 - 0.886 | 1.0 *min - 1.0 *max |
|-------------------|------------------------|------------------------|-----------------------|-----------------------|
🔶 SETTINGS
🔹 Swings
Minimum Swing Length: Minimum length used for the swing detection.
Maximum Swing Length: Maximum length used for the swing detection.
🔹 Patterns
Toggle Pattern Block
Toggle separate pattern in each Pattern Block
🔹 Tolerance
Fibonacci Ratio: Adds a percentage tolerance below/above the ratio when only one ratio applies, creating two limits.
Triangle Area Ratio: Filters patterns based on the ratio of the smallest triangle to the largest triangle.
🔹 Display
Labels: Display Pattern Names, Arrows or nothing
Patterns: Display or not
Last Line: Display previous C-D line when updated
🔹 Style
Colors: Pattern Lines/Names/Arrows - background color of patterns
Text Size: Text Size of Pattern Names/Arrows
🔹 Calculation
Calculated Bars: Allows the usage of fewer bars for performance/speed improvement
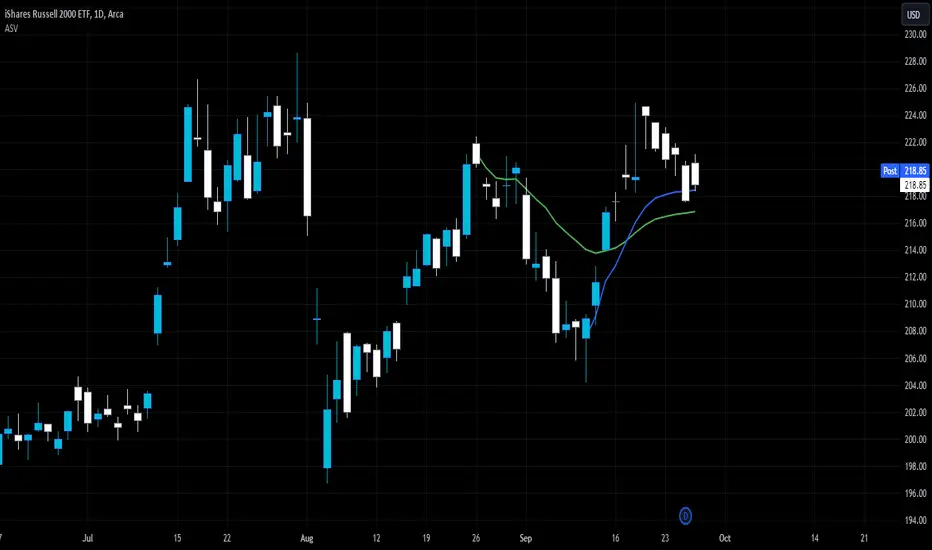
VD Zig Zag with SMAIntroduction
The VD Zig Zag with SMA indicator is a powerful tool designed to streamline technical analysis by combining Zig Zag swing lines with a Simple Moving Average (SMA). It offers traders a clear and intuitive way to analyze price trends, market structure, and potential reversals, all within a customizable framework.
Definition
The Zig Zag indicator is a trend-following tool that highlights significant price movements by filtering out smaller fluctuations. It visually connects swing highs and lows to reveal the underlying market structure. When paired with an SMA, it provides an additional layer of trend confirmation, helping traders align their strategies with market momentum.
Calculations
Zig Zag Logic:
Swing highs and lows are determined using a user-defined length parameter.
The highest and lowest points within the specified range are identified using the ta.highest() and ta.lowest() functions.
Zig Zag lines dynamically connect these swing points to visually map price movements.
SMA Logic:
The SMA is calculated using the closing prices over a user-defined period.
It smooths out price action to provide a clearer view of the prevailing trend.
The indicator allows traders to adjust the Zig Zag length and SMA period to suit their preferred trading timeframe and strategy.
Takeaways
Enhanced Trend Analysis: The Zig Zag lines clearly define the market's structural highs and lows, helping traders identify trends and reversals.
Customizable Parameters: Both the swing length and SMA period can be tailored for short-term or long-term trading strategies.
Visual Clarity: By filtering out noise, the indicator simplifies chart analysis and enables better decision-making.
Multi-Timeframe Support: Adapts seamlessly to the chart's timeframe, ensuring usability across all trading horizons.
Limitations
Lagging Nature: As with any indicator, the Zig Zag and SMA components are reactive and may lag during sudden price movements.
Sensitivity to Parameters: Improper parameter settings can lead to overfitting, where the indicator reacts too sensitively or misses significant trends.
Does Not Predict: This indicator identifies trends and structure but does not provide forward-looking predictions.
Summary
The VD Zig Zag with SMA indicator is a versatile and easy-to-use tool that combines the strengths of Zig Zag swing analysis and moving average trends. It helps traders filter market noise, visualize structural patterns, and confirm trends with greater confidence. While it comes with limitations inherent to all technical tools, its customizable features and multi-timeframe adaptability make it an excellent addition to any trader’s toolkit.
Additional Features
Have an idea or a feature you'd like to see added?
Feel free to reach out or share your suggestions here—I’m always open to updates!

Fibonacci Swing Trading BotStrategy Overview for "Fibonacci Swing Trading Bot"
Strategy Name: Fibonacci Swing Trading Bot
Version: Pine Script v5
Purpose: This strategy is designed for swing traders who want to leverage Fibonacci retracement levels and candlestick patterns to enter and exit trades on higher time frames.
Key Components:
1. Multiple Timeframe Analysis:
The strategy uses a customizable timeframe for analysis. You can choose between 4hour, daily, weekly, or monthly time frames to fit your preferred trading horizon. The high and low-price data is retrieved from the selected timeframe to identify swing points.
2. Fibonacci Retracement Levels:
The script calculates two key Fibonacci retracement levels:
0.618: A common level where price often retraces before resuming its trend.
0.786: A deeper retracement level, often used to identify stronger support/resistance areas.
These levels are dynamically plotted on the chart based on the highest high and lowest low over the last 50 bars of the selected timeframe.
3. Candlestick Based Entry Signals:
The strategy uses candlestick patterns as the only indicator for trade entries:
Bullish Candle: A green candle (close > open) that forms between the 0.618 retracement level and the swing high.
Bearish Candle: A red candle (close < open) that forms between the 0.786 retracement level and the swing low.
When these candlestick patterns align with the Fibonacci levels, the script triggers buy or sell signals.
4. Risk Management:
Stop Loss: The stop loss is set at 1% below the entry price for long trades and 1% above the entry price for short trades. This tight risk management ensures controlled losses.
Take Profit: The strategy uses a 2:1 risk-to-reward ratio. The take profit is automatically calculated based on this ratio relative to the stop loss.
5. Buy/Sell Logic:
Buy Signal: Triggered when a bullish candle forms above the 0.618 retracement level and below the swing high. The bot then places a long position.
Sell Signal: Triggered when a bearish candle forms below the 0.786 retracement level and above the swing low. The bot then places a short position.
The stop loss and take profit levels are automatically managed once the trade is placed.
Strengths of This Strategy:
Swing Trading Focus: The strategy is ideal for swing traders, targeting longer-term price moves that can take days or weeks to play out.
Simple Yet Effective Indicators: By only relying on Fibonacci retracement levels and basic candlestick patterns, the strategy avoids complexity while capitalizing on well-known support and resistance zones.
Automated Risk Management: The built-in stop loss and take profit mechanism ensures trades are protected, adhering to a strict 2:1 risk/reward ratio.
Multiple Timeframe Analysis: The script adapts to various market conditions by allowing users to switch between different timeframes (4hour, daily, weekly, monthly), giving traders flexibility.
Strategy Use Cases:
Retracement Traders: Traders who focus on entering the market at key retracement levels (0.618 and 0.786) will find this strategy especially useful.
Trend Reversal Traders: The strategy’s reliance on candlestick formations at Fibonacci levels helps traders spot potential reversals in price trends.
Risk Conscious Traders: With its 1% risk per trade and 2:1 risk/reward ratio, the strategy is ideal for traders who prioritize risk management in their trades.

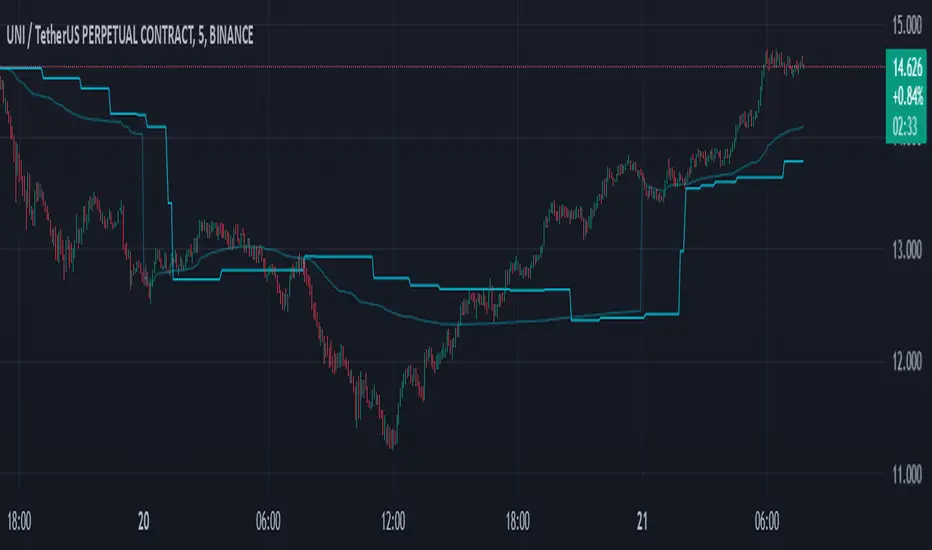
Auto Anchored Swing VWAP'sThe Auto Anchored Swing VWAP's indicator automatically anchors Volume-Weighted Average Price (VWAP) lines to recent swing highs and swing lows. VWAPs often act as key support or resistance levels because they represent the average price at which the majority of trading volume has occurred over a given time.
What is VWAP? VWAP is an essential tool in trading, representing the average price of a security over a specific period, weighted by volume. It helps traders identify the average price at which most trades have been executed, providing a balanced view of price action over time.
Anchored VWAPs: Unlike traditional VWAPs, which start from the beginning of the day, anchored VWAPs allow traders to "anchor" the calculation to a specific point in time or a pivot on the chart, in this case a swing high and swing low. This version of VWAP follows the price action from a selected point forward.
When the price is above the VWAP, it indicates that the majority of traders have paid less for the asset, creating a potential support zone as buyers may step in at or near this level. On the other hand, when the price is below the VWAP, it suggests that most traders have paid a higher price, which can lead to a resistance level where sellers may appear to defend their positions.
Anchored VWAPs, in particular, provide more precise support and resistance levels by starting from a specific swing high, swing low, or other significant point on the chart. This allows traders to track how price interacts with these levels after a certain bar.
The selectable pivot lookback length in this indicator defines the number of bars to the left and right of a potential swing high or swing low that must be lower (for a swing high) or higher (for a swing low) in order to confirm the pivot. In other words, it controls how many surrounding bars need to validate a local price extreme before it is considered a true swing point.
For example, if the lookback length is set to 9, a swing high is identified when there are 9 bars to the left and 9 bars to the right that all have lower highs than the current bar. The same logic applies for swing lows, where the price must be lower than the highs of the bars to the left and right for it to be considered a swing low.
This parameter allows traders to control the sensitivity of the swing points used to anchor VWAPs. A smaller lookback value will identify more frequent and short-term swing highs and lows, making the VWAPs more responsive to recent price action. Conversely, a larger lookback value will result in fewer but more significant swing points.
Pine Script
Utilization of Pine Script’s Enum Feature: This indicator leverages Pine Script's new enum feature for the selection of the VWAP lines (solid, dashed, or dotted) style.
Relative volume zone + Smart Order Flow Dynamic S/ROverview:
The Relative Volume Zone + Smart Order Flow with Dynamic S/R indicator is designed to help traders identify key trading opportunities by combining multiple technical components. This script integrates relative volume analysis, order flow detection, VWAP, RSI filtering, and dynamic support and resistance levels to offer a comprehensive view of the market conditions. It is particularly effective on shorter timeframes (M5, M15), making it suitable for scalping and day trading strategies.
Key Components:
1. Relative Volume Zones:
• The script calculates the relative volume by comparing the current volume with the average volume over a defined lookback period (volLookback). When the relative volume exceeds a specified multiplier (volMultiplier), it indicates a high volume zone, signaling potential accumulation or distribution areas.
• Purpose: Identifies high-volume trading zones that may act as significant support or resistance, indicating possible entry or exit points.
2. Smart Order Flow Analysis:
• The indicator uses Volume Delta (the difference between buying and selling volume) and a Cumulative Delta to detect order imbalances in the market.
• Order Imbalance is identified using a moving average of the Volume Delta (orderImbalance), which helps highlight hidden buying or selling pressure.
• Purpose: Reveals market sentiment by showing whether buyers or sellers dominate the market, aiding in the identification of trend reversals or continuations.
3. VWAP (Volume Weighted Average Price):
• VWAP is calculated over a default daily length (vwapLength) to show the average price a security has traded at throughout the day, based on both volume and price.
• Purpose: Provides insight into the fair value of the asset, indicating whether the market is in an accumulation or distribution phase.
4. RSI (Relative Strength Index) Filter:
• RSI is used to filter buy and sell signals, preventing trades in overbought or oversold conditions. It is calculated using a specified period (rsiPeriod).
• Purpose: Reduces false signals and improves trade accuracy by only allowing trades when RSI conditions align with volume and order flow signals.
5. Dynamic Support and Resistance Levels:
• The script dynamically plots support and resistance levels based on recent swing highs and lows (swingLookback).
• Purpose: Identifies potential reversal zones where price action may change direction, allowing for more precise entry and exit points.
How It Works:
• Buy Signal:
A buy signal is generated when:
• The price enters a high-volume zone.
• The price crosses above a 5-period moving average.
• The cumulative delta shows more buying pressure (cumulativeDelta > SMA of cumulativeDelta).
• The RSI is below 70 (not in overbought conditions).
• Sell Signal:
A sell signal is generated when:
• The price enters a high-volume zone.
• The price crosses below a 5-period moving average.
• The cumulative delta shows more selling pressure (cumulativeDelta < SMA of cumulativeDelta).
• The RSI is above 30 (not in oversold conditions).
• Dynamic Support and Resistance Lines:
Drawn based on recent swing highs and lows, these lines provide context for potential price reversals or breakouts.
• VWAP and Order Imbalance Lines:
Plotted to show the average traded price and highlight order flow shifts, helping to validate buy/sell signals.
How to Use:
1. Apply the Indicator:
Add the script to your chart and adjust the settings to match your trading style and preferred timeframe (optimized for M5/M15).
2. Interpret the Signals:
Use the buy and sell signals in conjunction with dynamic support/resistance, VWAP, and order imbalance lines to identify high-probability trade setups.
3. Monitor Alerts:
Set alerts for significant order flow events to receive notifications when there is a positive or negative order imbalance, indicating potential market shifts.
What Makes It Unique:
This script is unique because it combines multiple market analysis tools — relative volume zones, smart order flow, VWAP, RSI filtering, and dynamic support/resistance — to provide a well-rounded, multi-dimensional view of the market. This integration allows traders to make more informed decisions by validating signals across various indicators, enhancing overall trading accuracy and effectiveness.

Half Cup [LuxAlgo]The Half Cup indicator detects and displays patterns with the shape of a Half Cup , initiating a channel. From this channel, breakouts are detected and highlighted with dots.
Users can control the shape of the Half Cup and the channel length through various settings.
Do note that the displayed half cups are displayed retrospectively, making them subject to backpainting.
🔶 USAGE
The idea behind the indicator is derived from the Cup & Handle pattern, which requires waiting for the pattern full completion.
Our Half Cup publication aims to find opportunities when the potential cup is only formed halfway.
In this example, a green dot shows the first breakout of the upper channel extremity. A few bars later, the price went under it, after which it returned above, triggering a second green dot. Both triggers were good opportunities in this case, and the price rose afterward.
The Half Cup pattern can be the start of a potential complete Cup & Handle (As in the example above, a complete Cup pattern (without the Handle ) is shown, manually drawn with dashed lines).
Every green/red dot, whether on a bullish or bearish pattern, points to a breakout respectively above/below the channel.
Besides drawing patterns and the corresponding breakouts, the Half Cup indicator can also provide insights into trends and potential opportunities in the long run.
🔶 DETAILS
🔹 Validation
Several criteria must be fulfilled before a visible pattern on the chart is drawn.
Calculations are done beforehand to know where the Half Cup pattern would be positioned.
The pattern's bottom and top edges are checked for the number of bars whose closing price is outside the half-cup area. When the number of breakouts above/below is equal to or lower than the user-defined settings ( Max % Breaks Top/Bottom ), the pattern is drawn together with a brighter-colored channel next to it.
Dots highlighting the channel's breakout can be drawn from that moment until the end of both channel lines.
🔹 Positioning
Users can adjust the following settings to fit their needs:
% Broadness: Moves the Top/Bottom line (bullish or bearish) diagonally upwards/downwards.
Vertical Shift: Shifts the entire pattern up/down.
Channel Length: Sets the line length of the channel.
Note that adjusting the position of the pattern will change the validation; the script will be rerun to check if patterns are still valid or if new patterns can be drawn. Some patterns may disappear, while new ones may appear.
Before adjusting the position, the user can set Max % Breaks Top/Bottom at 100%. When the positioning is set, Max % Breaks Top/Bottom can be set as desired.
🔹 Updated Drawings
The Half Cup pattern is always drawn retrospectively (that is it is subject to backpainting), the channel is drawn from the bar from where the pattern is detected. Every breakout of the channel will remain visible as dots.
When a new swing high/low is found while the previous swing low/high remains the same, the pattern is updated to minimize clutter. The dots of earlier drawings will remain visible (to ensure no repainting occurs), but the color becomes faded, as such bright dots are associated with patterns that are visible on the chart, while faded dots are from removed/updated patterns.
🔶 SETTINGS
Swing Length: Period used for the swing detection, with higher values returning longer-term Swing Levels.
🔹 Validation
Max % Breaks Bottom: Allowed maximum amount of bars where the closing price is below the bottom of the Half Cup pattern against the total width of the pattern (bars).
Max % Breaks Top: Allowed maximum amount of bars where the closing price is above the top of the Half Cup pattern against the total width of the pattern (bars).
🔹 Positioning
% Broadness: Moves the Top/Bottom line (bullish or bearish) diagonally upwards/downwards.
Vertical Shift: Shifts the entire pattern up/down.
Channel Length: Sets the line length of the channel.

Liquidity Swings & SweepsThis Pine script indicator is designed to create a visual representation liquidity as identified by swing Highs/Lows along with an indication of the liquidity level that was swept, optionally rating the strength of the sweep based on time & price.
Relevance:
Liquidity levels & sweeps are crucial for many SMC/ICT setups and can indicate a point at which the price changes direction or may re-trace in an opposite direction to provide additional liquidity for continued move in the original direction. Additionally, liquidity levels may provide targets for setups, as price action will often seek to take out those levels as they main contain many buy/sell stops.
How It Works:
The indicator tracks all swing points, as identified using user-defined strength of the swing. Once a swing is formed that meets the criteria, it is represented by a horizontal line starting at the price of the current swing until the last bar on the chart. While the swing is valid, this line will continue to be extended until the swing is invalid or a new swing is formed. Upon identifying a new swing, the indicator then scans the earlier swings in the same direction looking for a point of greatest liquidity that was taken by the current swing. This level is then denoted by dashed horizontal line, connecting earlier swing point to the current. At the same time any liquidity zones between the two swings are automatically removed from the chart if they had previously been rendered on the chart. If the setting to enable scan for maximum liquidity is enabled, then while looking back, the indicator will look for lowest low or highest high that was taken by the current swing point, which may not be a swing itself, however, is a lowest/highest price point taken (mitigated) by the current swing, which in many cases will be better price then then the one represented by previous swing. If the option to render sweep label is enabled, the sweep line will also be completed by a label, that will score the sweep and a tooltip showing the details of the level swept and the time it took to sweep it. The score explained further in configurability section ranks the strength of the sweep based on time and is complemented by price (difference in price between the two liquidity levels).
Configurability:
A user may configure the strength of the swing using both left/right strength (number of bars) as well as optionally instruct the indicator to seek the lowest/highest price point which may not be previous swing that was taken out by newly formed swing.
From appearance perspective liquidity level colors & line width presenting the liquidity/swing can be configured. There is also an option to render the liquidity sweep label that will generate an icon-based rating of the liquidity sweep and a tooltip that provides details on the scope of the swing, which includes liquidity level swept and when it was formed along with the time it took to sweep the liquidity.
Rating is of sweeps is primarily based on time with a secondary reference to price
💥- Best rating, very strong sweep with an hourly or better liquidity sweep
🔥- Second rating, strong sweep with 15 – 59 minute liquidity sweep, or 5+ minute sweep of 10+ points
✅- Third rating, ok sweep with 5 - 15 minute liquidity sweep, or lower-time-frame sweep of 10+ points
❄️ - Weakest sweep, with liquidity of 5 or less minutes swept
What makes this indicator different:
Designed with high performance in mind, to reduce impact on chart render time.
Only keeps valid liquidity levels & sweeps on the chart
Automatically removes previously taken liquidity levels
Ranks liquidity sweeps to indicate strength of the sweep

Pure Price Action Structures [LuxAlgo]The Pure Price Action Structures indicator is a pure price action analysis tool designed to automatically identify real-time market structures.
The indicator identifies short-term, intermediate-term, and long-term swing highs and lows, forming the foundation for real-time detection of shifts and breaks in market structure.
Its distinctive/unique feature lies in its reliance solely on price patterns, without being limited by any user-defined input, ensuring a robust and objective analysis of market dynamics.
🔶 USAGE
Market structure is a crucial aspect of understanding price action. The script automatically identifies real-time market structure, enabling traders to comprehend market trends more easily. It assists traders in recognizing both trend changes and continuations.
Market structures are constructed from three sets of swing points, short-term swings, intermediary swings, and long-term swings. Market structures associated with longer-term swing points are indicative of longer-term trends.
A market structure shift (MSS), also known as a change of character (CHoCH), is a significant event in price action analysis that may signal a potential shift in market sentiment or direction. Conversely, a break of structure (BOS) is another significant event in price action analysis that typically indicates a continuation of the prevailing trend.
However, it's important to note that while an MSS can be the first indication of a trend reversal and a BOS signifies a continuation of the prevailing trend, they do not guarantee a complete reversal or continuation of the trend.
In some cases, MSS and BOS levels may also act as liquidity zones or areas of price consolidation, rather than indicating a definitive change in market direction or continuation. Traders should approach them with caution and consider additional factors to confirm the validity of the signal before making trading decisions.
🔶 DETAILS
🔹 Market Structures
Market structures are based on the analysis of price action and aim to identify key levels and patterns in the market, where swing point detection is one of the core concepts within ICT trading methodologies and teachings.
Swing points are automatically detected solely based on market movements, without any reliance on user-defined input.
🔹 Utilizing Swing Points
Swing points are not identified in real time as they occur. While short-term swing points may be displayed with a delay of at most one bar, the identification of intermediate and long-term swing points depends entirely on market movements. Furthermore, detection is not limited by any user-defined input but relies solely on pure price action. Consequently, swing points are not typically utilized in real-time trading scenarios.
Traders often analyze historical swing points to discern market trends and pinpoint potential entry and exit points for their trades. By identifying swing highs and lows, traders can:
Recognize Trends: Swing highs and lows help traders identify the direction of the trend. Higher swing highs and higher swing lows indicate an uptrend, while lower swing highs and lower swing lows indicate a downtrend.
Identify Support and Resistance Levels: Swing highs often serve as resistance levels, known in ICT terminology as Buyside Liquidity Levels, while swing lows function as support levels, also referred to in ICT terminology as Sellside Liquidity Levels. Traders can utilize these levels to strategize entry and exit points for their trades.
Spot Reversal Patterns: Swing points can form various reversal patterns, such as double tops or bottoms, head and shoulders patterns, and triangles. Recognizing these patterns can signal potential trend reversals, allowing traders to adjust their strategies accordingly.
Set Stop Loss and Take Profit Levels: In the context of ICT teachings, swing levels represent specific price levels where a concentration of buy or sell orders is anticipated. Traders can target these liquidity levels/pools to accumulate or distribute their positions, essentially using swing points to establish stop loss and take profit levels for their trades.
Overall, swing points provide valuable information about market dynamics and can assist traders in making more informed trading decisions.
🔶 SETTINGS
🔹 Structures
Swings and Size: Toggles the visibility of the structure's highs and lows, assigns an icon corresponding to the structures, and controls the size of the icons.
Market Structures: Toggles the visibility of the market structures.
Market Structure Labels: Controls the visibility of labels that highlight the type of market structure.
Line Style and Width: Customizes the style and width of the lines representing the market structure.
Swing and Line Colors: Customizes colors for the icons representing highs and lows, and the lines and labels representing the market structure.
🔶 RELATED SCRIPTS
Market-Structures-(Intrabar).
Buyside-Sellside-Liquidity.

Ichimoku Theories [LuxAlgo]The Ichimoku Theories indicator is the most complete Ichimoku tool you will ever need. Four tools combined into one to harness all the power of Ichimoku Kinkō Hyō.
This tool features the following concepts based on the work of Goichi Hosoda:
Ichimoku Kinkō Hyō: Original Ichimoku indicator with its five main lines and kumo.
Time Theory: automatic time cycle identification and forecasting to understand market timing.
Wave Theory: automatic wave identification to understand market structure.
Price Theory: automatic identification of developing N waves and possible price targets to understand future price behavior.
🔶 ICHIMOKU KINKŌ HYŌ
Ichimoku with lines only, Kumo only and both together
Let us start with the basics: the Ichimoku original indicator is a tool to understand the market, not to predict it, it is a trend-following tool, so it is best used in trending markets.
Ichimoku tells us what is happening in the market and what may happen next, the aim of the tool is to provide market understanding, not trading signals.
The tool is based on calculating the mid-point between the high and low of three pre-defined ranges as the equilibrium price for short (9 periods), medium (26 periods), and long (52 periods) time horizons:
Tenkan sen: middle point of the range of the last 9 candles
Kinjun sen: middle point of the range of the last 26 candles
Senkou span A: middle point between Tankan Sen and Kijun Sen, plotted 26 candles into the future
Senkou span B: midpoint of the range of the last 52 candles, plotted 26 candles into the future
Chikou span: closing price plotted 26 candles into the past
Kumo: area between Senkou pans A and B (kumo means cloud in Japanese)
The most basic use of the tool is to use the Kumo as an area of possible support or resistance.
🔶 TIME THEORY
Current cycles and forecast
Time theory is a critical concept used to identify historical and current market cycles, and use these to forecast the next ones. This concept is based on the Kihon Suchi (translating to "Basic Numbers" in Japanese), these are 9 and 26, and from their combinations we obtain the following sequence:
9, 17, 26, 33, 42, 51, 65, 76, 129, 172, 200, 257
The main idea is that the market moves in cycles with periods set by the Kihon Suchi sequence.
When the cycle has the same exact periods, we obtain the Taito Suchi (translating to "Same Number" in Japanese).
This tool allows traders to identify historical and current market cycles and forecast the next one.
🔹 Time Cycle Identification
Presentation of 4 different modes: SWINGS, HIGHS, KINJUN, and WAVES .
The tool draws a horizontal line at the bottom of the chart showing the cycles detected and their size.
The following settings are used:
Time Cycle Mode: up to 7 different modes
Wave Cycle: Which wave to use when WAVE mode is selected, only active waves in the Wave Theory settings will be used.
Show Time Cycles: keep a cleaner chart by disabling cycles visualisation
Show last X time cycles: how many cycles to display
🔹 Time Cycle Forecast
Showcasing the two forecasting patterns: Kihon Suchi and Taito Suchi
The tool plots horizontal lines, a solid anchor line, and several dotted forecast lines.
The following settings are used:
Show time cycle forecast: to keep things clean
Forecast Pattern: comes in two flavors
Kihon Suchi plots a line from the anchor at each number in the Kihon Suchi sequence.
Taito Suchi plot lines from the anchor with the same size detected in the anchored cycle
Anchor forecast on last X time cycle: traders can place the anchor in any detected cycle
🔶 WAVE THEORY
All waves activated with overlapping
The main idea behind this theory is that markets move like waves in the sea, back and forth (making swing lows and highs). Understanding the current market structure is key to having realistic expectations of what the market may do next. The waves are divided into Simple and Complex.
The following settings are used:
Basic Waves: allows traders to activate waves I, V and N
Complex Waves: allows traders to activate waves P, Y and W
Overlapping waves: to avoid missing out on any of the waves activated
Show last X waves: how many waves will be displayed
🔹 Basic Waves
The three basic waves
The basic waves from which all waves are made are I, V, and N
I wave: one leg moves
V wave: two legs move, one against the other
N wave: Three legs move, push, pull back, and another push
🔹 Complex Waves
Three complex waves
There are other waves like
P wave: contracting market
Y wave: expanding market
W wave: double top or double bottom
🔶 PRICE THEORY
All targets for the current N wave with their calculations
This theory is based on identifying developing N waves and predicting potential price targets based on that developing wave.
The tool displays 4 basic targets (V, E, N, and NT) and 3 extended targets (2E and 3E) according to the calculations shown in the chart above. Traders can enable or disable each target in the settings panel.
🔶 USING EVERYTHING TOGETHER
Please DON'T do this. This is not how you use it
Now the real example:
Daily chart of Nasdaq 100 futures (NQ1!) with our Ichimoku analysis
Time, waves, and price theories go together as one:
First, we identify the current time cycles and wave structure.
Then we forecast the next cycle and possible key price levels.
We identify a Taito Suchi with both legs of exactly 41 candles on each I wave, both together forming a V wave, the last two I waves are part of a developing N wave, and the time cycle of the first one is 191 candles. We forecast this cycle into the future and get 22nd April as a key date, so in 6 trading days (as of this writing) the market would have completed another Taito Suchi pattern if a new wave and time cycle starts. As we have a developing N wave we can see the potential price targets, the price is actually between the NT and V targets. We have a bullish Kumo and the price is touching it, if this Kumo provides enough support for the price to go further, the market could reach N or E targets.
So we have identified the cycle and wave, our expectations are that the current cycle is another Taito Suchi and the current wave is an N wave, the first I wave went for 191 candles, and we expect the second and third I waves together to amount to 191 candles, so in theory the N wave would complete in the next 6 trading days making a swing high. If this is indeed the case, the price could reach the V target (it is almost there) or even the N target if the bulls have the necessary strength.
We do not predict the future, we can only aim to understand the current market conditions and have future expectations of when (time), how (wave), and where (price) the market will make the next turning point where one side of the market overcomes the other (bulls vs bears).
To generate this chart, we change the following settings from the default ones:
Swing length: 64
Show lines: disabled
Forecast pattern: TAITO SUCHI
Anchor forecast: 2
Show last time cycles: 5
I WAVE: enabled
N WAVE: disabled
Show last waves: 5
🔶 SETTINGS
Show Swing Highs & Lows: Enable/Disable points on swing highs and swing lows.
Swing Length: Number of candles to confirm a swing high or swing low. A higher number detects larger swings.
🔹 Ichimoku Kinkō Hyō
Show Lines: Enable/Disable the 5 Ichimoku lines: Kijun sen, Tenkan sen, Senkou span A & B and Chikou Span.
Show Kumo: Enable/Disable the Kumo (cloud). The Kumo is formed by 2 lines: Senkou Span A and Senkou Span B.
Tenkan Sen Length: Number of candles for Tenkan Sen calculation.
Kinjun Sen Length: Number of candles for the Kijun Sen calculation.
Senkou Span B Length: Number of candles for Senkou Span B calculation.
Chikou & Senkou Offset: Number of candles for Chikou and Senkou Span calculation. Chikou Span is plotted in the past, and Senkou Span A & B in the future.
🔹 Time Theory
Show Time Cycle Forecast: Enable/Disable time cycle forecast vertical lines. Disable for better performance.
Forecast Pattern: Choose between two patterns: Kihon Suchi (basic numbers) or Taito Suchi (equal numbers).
Anchor forecast on last X time cycle: Number of time cycles in the past to anchor the time cycle forecast. The larger the number, the deeper in the past the anchor will be.
Time Cycle Mode: Choose from 7 time cycle detection modes: Tenkan Sen cross, Kijun Sen cross, Kumo change between bullish & bearish, swing highs only, swing lows only, both swing highs & lows and wave detection.
Wave Cycle: Choose which type of wave to detect from 6 different wave types when the time cycle mode is set to WAVES.
Show Time Cycles: Enable/Disable time cycle horizontal lines. Disable for better performance.
how last X time cycles: Maximum number of time cycles to display.
🔹 Wave Theory
Basic Waves: Enable/Disable the display of basic waves, all at once or one at a time. Disable for better performance.
Complex Waves: Enable/Disable complex wave display, all at once or one by one. Disable for better performance.
Overlapping Waves: Enable/Disable the display of waves ending on the same swing point.
Show last X waves: 'Maximum number of waves to display.
🔹 Price Theory
Basic Targets: Enable/Disable horizontal price target lines. Disable for better performance.
Extended Targets: Enable/Disable extended price target horizontal lines. Disable for better performance.

swinglibraryLibrary "swinglibrary"
This library is for calculating non-repainting swings for further calculation on them.
These swings can later be drawn, but drawing is not part of this library, only the calculation.
What do I need to use the library?
You better include the following constants into your script using this library:
int SWING_NO_ACTION = 0
int SWING_FLIP = 1
int SWING_FLIP_NEW_SWING = 2
int SWING_FLIP_UPDATED = 3
int RELATION_HIGHER = 1
int RELATION_EQUAL = 0
int RELATION_LOWER = -1
Choosing the function, that fits your needs
This library contains 4 functions for calculating swings, the difference between them are the data you get for every swing point and additional average values for length and duration:
swings()
swingsR()
swingsL()
swingsLDR()
The naming scheme of these functions is the following:
The base version swings() is only for the swings containing the following swingPoint type:
swingPoint
Fields:
x (integer) : bar index
y (float) : price
hilo (integer) 1 -> high, -1 -> low
and the return type:
swingReturn
Fields:
swings (array) : array of the last x swing points
newSwingHigh (integer) : flag to detect changes for swing highs see constants (SWING_NO_ACTION, SWING_FLIP_NEW_SWING, SWING_FLIP_UPDATED)
newSwingLow (integer) : flag to detect changes for swing lows see constants (SWING_NO_ACTION, SWING_FLIP_NEW_SWING, SWING_FLIP_UPDATED)
The R in swingsR() stands for relation where the previously shown types do also contain the relation between the swings of the same swing type (highs and lows respectively).
The same goes for L in swingsL() for length containing the price difference between the current and previous swing point in ticks.
And in the following version swingsLDR() there is also the duration between the current and previous point included.
The parameters for the other functions and type definitions include only the ones, that are needed, the "full" version of the function is described here:
swingsLDR(swingSize, dtbStrength, init, SWING_HISTORY_NUM)
Parameters:
swingSize (int) This parameter defines the size of the swings to look after, meaning higher values will lead to bigger swings
dtbStrength (int) Value between 0 and 100 is a factor (%) to the ATR that is used to calculate equal highs/lows (double tops / bottoms).
Higher values will result in a higher tolerance of price difference between the swings.
init (bool) This value is usually set to false on default.
It has a special use case, where we need to reduce memory usage and calculation time on the script using this library by start calculating at x bars back instead of the beginning of the chart.
In this case, we set init = true on the first bar we start calculating the swings on to perform the correct initialization.
SWING_HISTORY_NUM (int) This is the max number of swings that are stored in the array, so only the last SWING_HISTORY_NUM swings are stored in the array to reduce the memory usage.
New ones remove the oldest ones like in a ring buffer.
This is also influencing the average duration and average swing length.
swingPointLDR
Fields:
x (integer) : bar index
y (float) : price
hilo (integer) : 1 -> high, -1 -> low
length (float) : price difference to the previous swing point in ticks
duration (integer) : duration difference to the previous swing point in number of bars
relation (integer) : see constants RELATION_HIGHER, RELATION_EQUAL, RELATION_LOWER: reelation to the previous swing points of the same type (previous high or previous low respectively)
swingReturnLDR
Fields:
swings (array) : array of the last x swing points
newSwingHigh (integer) : flag to detect changes for swing highs see constants (SWING_NO_ACTION, SWING_FLIP_NEW_SWING, SWING_FLIP_UPDATED)
newSwingLow (integer) : flag to detect changes for swing lows see constants (SWING_NO_ACTION, SWING_FLIP_NEW_SWING, SWING_FLIP_UPDATED)
avSwLength (float) : average swing length for the last x swings (depending on the max number of swings)
avSwingDuration (float) : average swing duration for the last x swings (depending on the max number of swings)
ka66: Swing/Pivot Point LinesThis indicator draws swing-highs and swing-lows, also called pivot highs and lows.
A swing high is a bar which has a higher-high than its surrounding bars (to the left and the right).
A swing low is a bar which has a lower-low than its surrounding bars (to the left and the right).
A common example of a pivot is Bill Williams' Fractal, which specifies that the centre bar must have a higher high than 2 bars to its left, and 2 bars to its right for a swing high, taking into account 5 bars at a time. Similarly, for a swing low, the centre bar must have a lower low than the 2 bars to its left and right.
This indicator allows configurable adjacent bars as input. Entering 2, means it essentially picks out a Williams Fractal. But you can select 1 (say for higher timeframes), using one 1 bar to the left and right of the centre bar.
The indicator will draw Swing/Pivot High/Low as circles at the same price level as the centre bar, till the next one shows up. Drawing is offset so it starts at the centre bar (the swing bar), showing exactly where the pivot bar is.
There are 2 main uses of pivot points, in various strategies:
Market Structure: to objectively define higher-highs/lows and lower-highs/lows in Trend Analysis.
More generally, to then determine if a trend might reverse, or continue as pivot levels are broken.
Messy pivot structures easily point out ranging markets.
There are a few of these, some closed source, which I don't like, since I think people should generally know what they are trading with, and I want to make sure I understand the logic exactly.
Session Sweeps [LuxAlgo]The Session Sweeps indicator combines ICT-based features for a complete trading methodology involving market sessions, market structure, and fair value gaps to find optimal entry conditions for trading price action.
Traders frequently tend to place stop/limit orders at the high and low points of major trading sessions such as Asian (Tokyo), European (London), and North American (New York), resulting in the establishment of liquidity pools at those particular levels. The Session Sweeps indicator is crafted to recognize and underscore occurrences of session sweeps or liquidity sweeps during these major trading sessions.
🔶 USAGE
Default settings utilize major forex trading sessions, yet users can select their preferred opening and closing times, rename the sessions, or adjust the colors. It's important to note that the specified times for each session align with the respective local timezones: Asian (Tokyo) UTC+9, European (London) UTC, and North American (New York) UTC-5.
If the price briefly crosses either the highest or lowest point of a market session. These movements, aiming at triggering stop losses, suggest potential shifts in the market direction. Detecting such movements is the fundamental purpose and core functionality of the script.
🔹Market Structure Shifts
A Market Structure Shift refers to a change in market direction, either from an uptrend to a downtrend or vice versa. A part of a common entry model when using session sweeps is waiting for the formation of a CHoCH after a session sweep.
🔹Fair Value Gaps
A Fair Value Gap (FVG) holds particular appeal for price action traders, emerging when there are inefficiencies or imbalances in the market, often a result of uneven buying and selling activity. The underlying concept of FVGs is that the market tends to revisit these inefficiencies before resuming its trajectory in alignment with the initial impulsive move.
After the formation of a CHoCH traders can enter a position when the price enters the area of a Fair Value Gap (FVG).
🔹Setup Examples
This entry setup is commonly used by ICT traders and is shared for informational & educational purposes only.
Long Positions (5-Minute Timeframe):
Wait for the previous session's low to be swept.
Look for a Bullish Choch.
Find a Bullish FVG formed by or before the Choch.
Entry Point: At the FVG.
Take Profit (TP): At the session high or aim for a 1:2 Risk-Reward Ratio.
Stop Loss (SL): At the session low or nearest Swing Low.
Take partial profits at intermediate swings, but don’t shift SL prematurely.
Short Positions (5-Minute Timeframe):
Wait for the previous session's high to be swept.
Look for a Bearish Choch.
Find a FVG formed by or before the Choch.
Entry Point: At the FVG.
Take Profit (TP): At the previous session's low or aim for a 1:2 RR.
Stop Loss (SL): At the session high or nearest Swing High.
Take partial profits at intermediate swings, but don’t shift SL prematurely.
🔶 SETTINGS
🔹Session Sweeps
Buyside Sweep Zones, Color, and Margin: toggles the visibility of bullside sweep zones, customizes the associated color, and sets the margin value defining the range of a bullside sweep zone.
Sellside Sweep Zones, Color, and Margin: toggles the visibility of sell-side sweep zones, customizes the associated color, and sets the margin value defining the range of a sell-side sweep zone.
Sweep Margin Length: specifies the maximum allowed length of a sweep zone invalidation, the length over which the price slightly invalidated the margin range.
Detect Sweeps Once per Session: if enabled will detect only once a sweep zone within a session.
Hide Fake Sweep Zones, and Color: controls the visibility and color of the fake sweep zones.
🔹Sessions
Session (Asia, London, New York AM, and New York PM), Start Time, and End Time: enables or disables the visibility of the named market session range, and customization of the session hours.
Color: color customization option of the named session.
Extend Max/Min: extends the highest and lowest price levels of the named session until the end of the next enabled session. This option is recommended to be enabled when sweep zone detection is activated to observe the relationship between the sweep zone and previous session extreme levels.
Extend Mid: extends the mean price levels of the named session until the end of the next enabled session. The extended line may serve as potential support and resistance levels.
Fill: enables/disables background coloring of the named session.
New York DST | London DST: enabling this option initiates Daylight Saving Time (DST) for New York or London. Note: Daylight Saving Time is not applied to the Asian (Tokyo) session.
Sessions Extreme Lines | Sessions Names: toggles the visibility of the highest and lowest price levels, as well as the names, for all market sessions.
Session Lines Width: sets the width of the lines for all sessions.
Session Fill Transparency: sets the background color transparency of the range for all sessions.
🔹Market Structure Shifts
Market Structure Shifts: toggles the visibility of market structure shifts, also known as change of character (CHoCH).
Detection Length: specifies the detection length.
Market Structure Shifts; Bull & Bear: color customization options.
🔹Fair Value Gaps
Fair Value Gaps: toggles the visibility of the fair value gaps.
Fair Value Gap Width Filter: specifies the filtering multiplier; additional details can be found in the tooltip of the respective input option.
Bullish & Bearish Imbalance: color customization options.
🔹Sessions Tabular View
Sessions Tabular View: toggles the visibility of the tabular view of the sessions, displaying date &time, status, and countdown counter.
Hide if not Forex Market Instrument: checks the market and automatically enables/disables the option based on the market instrument.
Table Text Size & Position: size and placement customization options
🔶 LIMITATIONS
Please be aware that fair value gap filtering cannot be applied to the initial 144 candles (with a fixed-length ATR) as the ATR value necessary for filtering won't be available during this period.
🔶 RELATED SCRIPTS
Buyside-Sellside-Liquidity
Sessions
Liquidity-Voids-FVG
Thank you to our community for the recommendation of this script. To explore additional conceptual scripts and related content, we invite you to visit >>> LuxAlgo-Scripts .

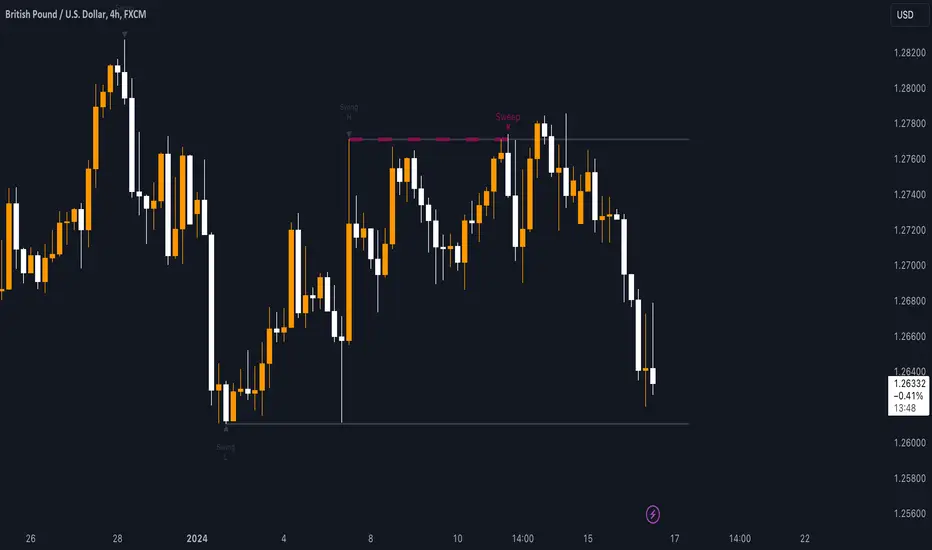
Sweep institutionalThis indicator focuses on identifying "SWEEPs" based on taking liquidity at highs and lows. The application of the SWEEP strategy is highly determinant in the Swing points, as they serve as the target of our operations.
ALERTS INCLUDED
🔹Example of Strategy Application
1.-Create the BULLISH SWEEP.
2.-You can enter LONG.
3.-If it is a BULLISH SWEEP, take a long with a SWING HIGH target (2-3 pips up).
4.-If it is a BULLISH SWEEP, place your SL behind the SWEEP (2-3 pips).
(This example is bullish, but it would be the same in a bearish setup, applying everything in the opposite way)
t's very crucial for the strategy to reference SWING POINTS, as these points will be our take profit and stop loss points.
The strategy is based on identifying a SWEEP. After this, we can look for trading opportunities with targets on the opposite side of the fractal. Remember, if you decide to enter, the Stop Loss should be placed protected by the Sweep, and the Take Profit should be set at the opposite Swing, as seen in the example.
Use this STRATEGY IN TIMEFRAMES GREATER THAN 30M. If you decide to use it in timeframes <30M, there's a higher probability of encountering false SWEEPs (the most optimal are 1h & 4h)
🔹Use
The Sweep strategy involves identifying potential trades based on the creation of a "SWEEP" (liquidity grab) at the Swing High or Swing Low. Below is an example of a bearish opportunity after taking liquidity from a Swing High with a wick and no candle body closing above it.
🔹Details
As you have seen, it indicates the surpassing of a high without the candle body, this is called a “SWEEP.” Each time this occurs, the price is likely to surpass the opposite SWING High/Low. The following example will show more clearly how it works in both bullish and bearish scenarios.
🔹Configuration
-Cooldown period: is the length of the operating Range line
-Swing detection: determines the points to be used as SL and TP protection
Bullish/Berish Sweep
-Line Width: size of the line
-Line Style: design type
-Color
Liquidity Sentiment Profile (Auto-Anchored) [LuxAlgo]
The Liquidity Sentiment Profile (Auto-Anchored) is an advanced charting tool that measures by combining PRICE and VOLUME data over specified anchored periods and highlights the distribution of the liquidity and the market sentiment at specific price levels. This version is a variation of the previously published Liquidity Sentiment Profile , wherewith this version allows users to select a variety of different anchoring periods, such as 'Auto', 'Fixed Range', 'Swing High', 'Swing Low', 'Session', 'Day', 'Week', 'Month', 'Quarter', and 'Year'
Liquidity refers to the availability of orders at specific price levels in the market, allowing transactions to occur smoothly.
🔶 USAGE
A Liquidity Sentiment Profile (Auto-Anchored) is a combination of liquidity and a sentiment profile, where the right side of the profile highlights the distribution of the traded activity at different price levels, and the left side of the profile highlights the market sentiment at those price levels
The liquidity profile is categorized by assigning different colors based on the significance of the traded activity of the specific price levels, allowing traders to reveal significant price levels, such as support and resistance levels, supply and demand zones, liquidity gaps, consolidation zones, etc
The Liquidity Sentiment Profiles aim to present Value Areas based on the significance of price levels, thus allowing users to identify value areas that can be formed more than once within the range of a single profile
Level of Significance Line - displays the changes in the price levels with the highest traded activity (developing POC)
Buyside & Sellside Liquidity Zones - displays Liquidity Levels, also known as Supply and Demand Zones
🔶 SETTINGS
The script takes into account user-defined parameters and plots the profiles, where detailed usage for each user-defined input parameter in indicator settings is provided with the related input's tooltip.
🔹 Liquidity Sentiment Profile
Anchor Period: The indicator resolution is set by the input of the Anchor Period.
Fixed Period: Applicable if the Anchor Period is set to 'Fixed Range' then the period of the profile is defined with this option
Swing Detection Length: Applicable if the Anchor Period is set to 'Swing High' or 'Swing Low' then the length required to detect the Swing Levels is defined with this option which is then used to determine the period of the profile
🔹 Liquidity Profile
Liquidity Profile: Toggles the visibility of the Liquidity Profiles
High Traded Nodes: Threshold and Color option for High Traded Nodes
Average Traded Nodes: Color option for Average Traded Nodes
Low Traded Nodes: Threshold and Color option for Low Traded Nodes
🔹 Sentiment Profile
Sentiment Profile: Toggles the visibility of the Sentiment Profiles
Bullish Nodes: Color option for Bullish Nodes
Bearish Nodes: Color option for Bearish Nodes
🔹 Buyside & Sellside Liquidity Zones
Buyside & Sellside Liquidity Zones: Toggles the visibility of the Liquidity Levels
Buyside Liquidity Nodes: Color option for Buyside Liquidity Nodes
Sellside Liquidity Nodes: Color option for Sellside Liquidity Nodes
🔹 Other Settings
Level of Significance: Toggles the visibility of the Level of Significance Line
Price Levels, Color: Toggles the visibility of the Profile Price Levels
Number of Rows: Specify how many rows each profile histogram will have. Caution, having it set to high values will quickly hit Pine Script™ drawing objects limit and fewer historical profiles will be displayed
Profile Width %: Alters the width of the rows in the histogram, relative to the profile length
Profile Range Background Fill: Toggles the visibility of the Profiles Range
🔶 RELATED SCRIPTS
Liquidity-Sentiment-Profile
Buyside-Sellside-Liquidity
ICT-Concepts

Swing Action PriceEnglish:
**Description of "Swing Action Price" TradingView Script**
"Swing Action Price" is a custom technical indicator designed to identify swing highs and swing lows in a financial market. The script calculates and plots various lines on the chart to visualize these swing points. Swing highs are points where the price has made a local peak, while swing lows are points where the price has made a local trough.
The indicator displays the following lines on the chart:
1. Dotted lines representing each individual swing high and swing low identified on different timeframes (10, 30, 60, 100, 150, 200, 700, and 1000 bars).
2. Dotted lines representing the most recent swing high and swing low for the current bar.
How the indicator works:
1. The script uses historical price data to calculate swing highs and swing lows based on specific conditions.
2. For each of the mentioned timeframes, the indicator identifies the highest high and lowest low within a defined number of bars (10, 30, 60, etc.).
3. Once a new swing high or swing low is identified, the corresponding dotted lines are drawn on the chart, extending from the previous swing point to the current one.
The "Swing Action Price" indicator can be used by traders to visually identify key support and resistance levels in the market. It helps them recognize potential trend reversals or continuation points, which may be valuable for making trading decisions.
Please note that trading indicators should always be used in conjunction with other technical and fundamental analysis tools to make informed trading choices. The "Swing Action Price" indicator is offered under the Mozilla Public License 2.0, and the developer's username is "damianjorgeportillo."
Remember that past performance is not indicative of future results, and it's essential to exercise caution and apply risk management strategies when trading financial markets.
/******************************/
Spanish:
**Descripción del Script "Swing Action Price" en TradingView**
"Swing Action Price" es un indicador técnico personalizado diseñado para identificar máximos y mínimos en un mercado financiero. El script calcula y muestra diversas líneas en el gráfico para visualizar estos puntos de inflexión. Los máximos se producen cuando el precio alcanza un pico local, mientras que los mínimos ocurren cuando el precio alcanza un valle local.
El indicador muestra las siguientes líneas en el gráfico:
1. Líneas punteadas que representan cada máximo y mínimo individual identificado en diferentes marcos de tiempo (10, 30, 60, 100, 150, 200, 700 y 1000 barras).
2. Líneas punteadas que representan el máximo y mínimo más reciente para la barra actual.
Cómo funciona el indicador:
1. El script utiliza datos históricos de precios para calcular los máximos y mínimos en función de ciertas condiciones.
2. Para cada uno de los marcos de tiempo mencionados, el indicador identifica el máximo más alto y el mínimo más bajo dentro de un número específico de barras (10, 30, 60, etc.).
3. Una vez que se identifica un nuevo máximo o mínimo, se dibujan las líneas punteadas correspondientes en el gráfico, extendiéndose desde el punto de inflexión anterior hasta el actual.
El indicador "Swing Action Price" puede ser utilizado por traders para identificar visualmente niveles clave de soporte y resistencia en el mercado. Ayuda a reconocer posibles puntos de inversión o continuación de tendencia, lo que puede ser valioso para tomar decisiones comerciales.
Por favor, ten en cuenta que los indicadores de trading siempre deben utilizarse junto con otras herramientas de análisis técnico y fundamental para tomar decisiones comerciales informadas. El indicador "Swing Action Price" se ofrece bajo la Licencia Pública de Mozilla 2.0, y el nombre de usuario del desarrollador es "damianjorgeportillo".
Recuerda que el rendimiento pasado no garantiza resultados futuros, y es esencial ser cauteloso y aplicar estrategias de gestión de riesgos al operar en los mercados financieros.
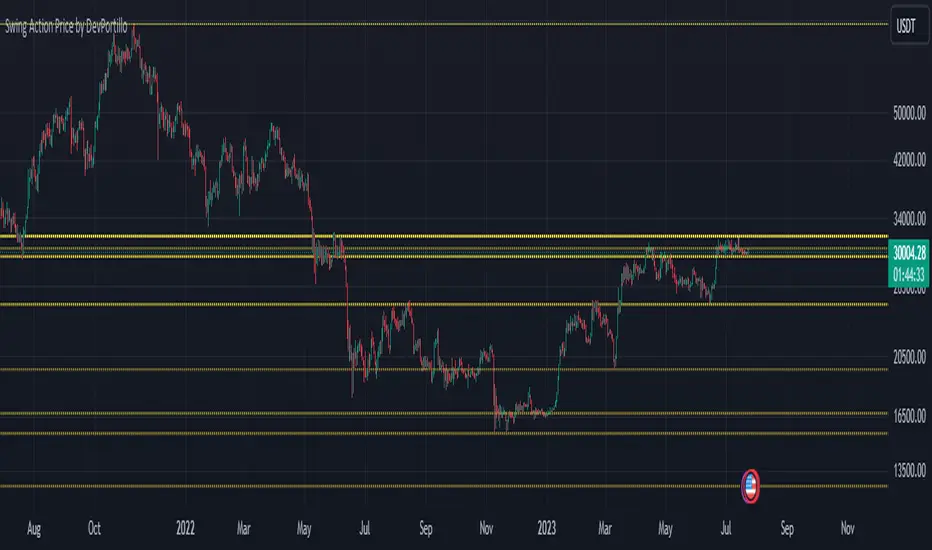
Triple Top Patterns [theEccentricTrader]█ OVERVIEW
This indicator automatically draws triple top patterns and price projections derived from the ranges that constitute the patterns.
█ CONCEPTS
Green and Red Candles
• A green candle is one that closes with a close price equal to or above the price it opened.
• A red candle is one that closes with a close price that is lower than the price it opened.
Swing Highs and Swing Lows
• A swing high is a green candle or series of consecutive green candles followed by a single red candle to complete the swing and form the peak.
• A swing low is a red candle or series of consecutive red candles followed by a single green candle to complete the swing and form the trough.
Peak and Trough Prices (Basic)
• The peak price of a complete swing high is the high price of either the red candle that completes the swing high or the high price of the preceding green candle, depending on which is higher.
• The trough price of a complete swing low is the low price of either the green candle that completes the swing low or the low price of the preceding red candle, depending on which is lower.
Historic Peaks and Troughs
The current, or most recent, peak and trough occurrences are referred to as occurrence zero. Previous peak and trough occurrences are referred to as historic and ordered numerically from right to left, with the most recent historic peak and trough occurrences being occurrence one.
Broken and Unbroken Peaks and Troughs
Upon the completion of a new swing low the high of the green candle that completes the swing low will be above, below or equal to the current peak price. And similarly, upon the completion of a new swing high the low of the red candle that completes the swing high will be above, below or equal to the current trough price.
If the high price of the green candle that completes the current swing low is higher than or equal to the current peak price then the current peak is broken. If the high of the green candle that completes the current swing low is below the current peak price, then the current peak is unbroken.
Similarly, if the low price of the red candle that completes the current swing high is lower than or equal to the current trough price then the current trough is broken. If the low price of the red candle that completes the current swing high is above the current trough price, then the current trough is unbroken.
Range
The range is simply the difference between the current peak and current trough prices, generally expressed in terms of points or pips.
Retracement and Extension Ratios
Retracement and extension ratios are calculated by dividing the current range by the preceding range and multiplying the answer by 100. Retracement ratios are those that are equal to or below 100% of the preceding range and extension ratios are those that are above 100% of the preceding range.
Triple Bottom and Triple Top Patterns
• Triple bottom patterns are composed of two peaks and three troughs, with the second and third troughs being roughly equal to the first trough.
• Triple top patterns are composed of two troughs and three peaks, with the second and third peaks being roughly equal to the first peak.
Measurement Tolerances
In general, tolerance in measurements refers to the allowable variation or deviation from a specific value or dimension. It is the range within which a particular measurement is considered to be acceptable or accurate. In this script I have applied this concept to the measurement of triple bottom and triple top patterns to increase to the frequency of pattern occurrences.
For example, a perfect triple bottom is very rare. We can increase the frequency of pattern occurrences by setting a tolerance. A ratio tolerance of 10% to both downside and upside, which is the default setting, means we would have a tolerable ratio measurement range between 90-110% for the second and third troughs as ratios of the first trough, thus increasing the frequency of occurrence.
█ FEATURES
Inputs
• Unbroken Troughs
• Lower Tolerance
• Upper Tolerance
• Pattern Color
• Neckline Color
• Extend Current Neckline
• Show Labels
• Label Color
• Show Projection Lines
• Extend Current Projection Lines
Alerts
Users can set alerts for when the patterns occur.
█ LIMITATIONS
All green and red candle calculations are based on differences between open and close prices, as such I have made no attempt to account for green candles that gap lower and close below the close price of the preceding candle, or red candles that gap higher and close above the close price of the preceding candle. This may cause some unexpected behaviour on some markets and timeframes. I can only recommend using 24-hour markets, if and where possible, as there are far fewer gaps and, generally, more data to work with.

Triple Bottom Patterns [theEccentricTrader]█ OVERVIEW
This indicator automatically draws triple bottom patterns and price projections derived from the ranges that constitute the patterns.
█ CONCEPTS
Green and Red Candles
• A green candle is one that closes with a close price equal to or above the price it opened.
• A red candle is one that closes with a close price that is lower than the price it opened.
Swing Highs and Swing Lows
• A swing high is a green candle or series of consecutive green candles followed by a single red candle to complete the swing and form the peak.
• A swing low is a red candle or series of consecutive red candles followed by a single green candle to complete the swing and form the trough.
Peak and Trough Prices (Basic)
• The peak price of a complete swing high is the high price of either the red candle that completes the swing high or the high price of the preceding green candle, depending on which is higher.
• The trough price of a complete swing low is the low price of either the green candle that completes the swing low or the low price of the preceding red candle, depending on which is lower.
Historic Peaks and Troughs
The current, or most recent, peak and trough occurrences are referred to as occurrence zero. Previous peak and trough occurrences are referred to as historic and ordered numerically from right to left, with the most recent historic peak and trough occurrences being occurrence one.
Broken and Unbroken Peaks and Troughs
Upon the completion of a new swing low the high of the green candle that completes the swing low will be above, below or equal to the current peak price. And similarly, upon the completion of a new swing high the low of the red candle that completes the swing high will be above, below or equal to the current trough price.
If the high price of the green candle that completes the current swing low is higher than or equal to the current peak price then the current peak is broken. If the high of the green candle that completes the current swing low is below the current peak price, then the current peak is unbroken.
Similarly, if the low price of the red candle that completes the current swing high is lower than or equal to the current trough price then the current trough is broken. If the low price of the red candle that completes the current swing high is above the current trough price, then the current trough is unbroken.
Range
The range is simply the difference between the current peak and current trough prices, generally expressed in terms of points or pips.
Retracement and Extension Ratios
Retracement and extension ratios are calculated by dividing the current range by the preceding range and multiplying the answer by 100. Retracement ratios are those that are equal to or below 100% of the preceding range and extension ratios are those that are above 100% of the preceding range.
Triple Bottom and Triple Top Patterns
• Triple bottom patterns are composed of two peaks and three troughs, with the second and third troughs being roughly equal to the first trough.
• Triple top patterns are composed of two troughs and three peaks, with the second and third peaks being roughly equal to the first peak.
Measurement Tolerances
In general, tolerance in measurements refers to the allowable variation or deviation from a specific value or dimension. It is the range within which a particular measurement is considered to be acceptable or accurate. In this script I have applied this concept to the measurement of triple bottom and triple top patterns to increase to the frequency of pattern occurrences.
For example, a perfect triple bottom is very rare. We can increase the frequency of pattern occurrences by setting a tolerance. A ratio tolerance of 10% to both downside and upside, which is the default setting, means we would have a tolerable ratio measurement range between 90-110% for the second and third troughs as ratios of the first trough, thus increasing the frequency of occurrence.
█ FEATURES
Inputs
• Unbroken Peaks
• Lower Tolerance
• Upper Tolerance
• Pattern Color
• Neckline Color
• Extend Current Neckline
• Show Labels
• Label Color
• Show Projection Lines
• Extend Current Projection Lines
Alerts
Users can set alerts for when the patterns occur.
█ LIMITATIONS
All green and red candle calculations are based on differences between open and close prices, as such I have made no attempt to account for green candles that gap lower and close below the close price of the preceding candle, or red candles that gap higher and close above the close price of the preceding candle. This may cause some unexpected behaviour on some markets and timeframes. I can only recommend using 24-hour markets, if and where possible, as there are far fewer gaps and, generally, more data to work with.

Double Top Patterns [theEccentricTrader]█ OVERVIEW
This indicator automatically draws double top patterns and price projections derived from the ranges that constitute the patterns.
█ CONCEPTS
Green and Red Candles
• A green candle is one that closes with a close price equal to or above the price it opened.
• A red candle is one that closes with a close price that is lower than the price it opened.
Swing Highs and Swing Lows
• A swing high is a green candle or series of consecutive green candles followed by a single red candle to complete the swing and form the peak.
• A swing low is a red candle or series of consecutive red candles followed by a single green candle to complete the swing and form the trough.
Peak and Trough Prices (Basic)
• The peak price of a complete swing high is the high price of either the red candle that completes the swing high or the high price of the preceding green candle, depending on which is higher.
• The trough price of a complete swing low is the low price of either the green candle that completes the swing low or the low price of the preceding red candle, depending on which is lower.
Historic Peaks and Troughs
The current, or most recent, peak and trough occurrences are referred to as occurrence zero. Previous peak and trough occurrences are referred to as historic and ordered numerically from right to left, with the most recent historic peak and trough occurrences being occurrence one.
Broken and Unbroken Peaks and Troughs
Upon the completion of a new swing low the high of the green candle that completes the swing low will be above, below or equal to the current peak price. And similarly, upon the completion of a new swing high the low of the red candle that completes the swing high will be above, below or equal to the current trough price.
If the high price of the green candle that completes the current swing low is higher than or equal to the current peak price then the current peak is broken. If the high of the green candle that completes the current swing low is below the current peak price, then the current peak is unbroken.
Similarly, if the low price of the red candle that completes the current swing high is lower than or equal to the current trough price then the current trough is broken. If the low price of the red candle that completes the current swing high is above the current trough price, then the current trough is unbroken.
Range
The range is simply the difference between the current peak and current trough prices, generally expressed in terms of points or pips.
Retracement and Extension Ratios
Retracement and extension ratios are calculated by dividing the current range by the preceding range and multiplying the answer by 100. Retracement ratios are those that are equal to or below 100% of the preceding range and extension ratios are those that are above 100% of the preceding range.
Double Bottom and Double Top Patterns
• Double bottom patterns are composed of one peak and two troughs, with the second trough being roughly equal to the first trough.
• Double top patterns are composed of one trough and two peaks, with the second peak being roughly equal to the first peak.
Measurement Tolerances
In general, tolerance in measurements refers to the allowable variation or deviation from a specific value or dimension. It is the range within which a particular measurement is considered to be acceptable or accurate. In this script I have applied this concept to the measurement of double bottom and double top patterns to increase to the frequency of pattern occurrences.
For example, a perfect double bottom is very rare. We can increase the frequency of pattern occurrences by setting a tolerance. A ratio tolerance of 10% to both downside and upside, which is the default setting, means we would have a tolerable ratio measurement range between 90-110% for the second trough, thus increasing the frequency of occurrence.
█ FEATURES
Inputs
• Unbroken Troughs
• Lower Tolerance
• Upper Tolerance
• Pattern Color
• Neckline Color
• Extend Current Neckline
• Show Labels
• Label Color
• Show Projection Lines
• Extend Current Projection Lines
Alerts
Users can set alerts for when the patterns occur.
█ LIMITATIONS
All green and red candle calculations are based on differences between open and close prices, as such I have made no attempt to account for green candles that gap lower and close below the close price of the preceding candle, or red candles that gap higher and close above the close price of the preceding candle. This may cause some unexpected behaviour on some markets and timeframes. I can only recommend using 24-hour markets, if and where possible, as there are far fewer gaps and, generally, more data to work with.
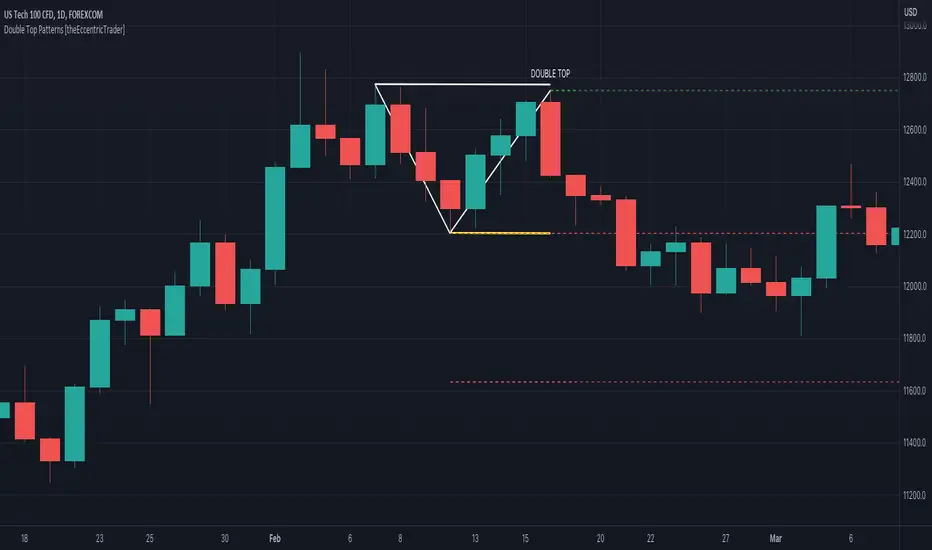
Double Bottom Patterns [theEccentricTrader]█ OVERVIEW
This indicator automatically draws double bottom patterns and price projections derived from the ranges that constitute the patterns.
█ CONCEPTS
Green and Red Candles
• A green candle is one that closes with a close price equal to or above the price it opened.
• A red candle is one that closes with a close price that is lower than the price it opened.
Swing Highs and Swing Lows
• A swing high is a green candle or series of consecutive green candles followed by a single red candle to complete the swing and form the peak.
• A swing low is a red candle or series of consecutive red candles followed by a single green candle to complete the swing and form the trough.
Peak and Trough Prices (Basic)
• The peak price of a complete swing high is the high price of either the red candle that completes the swing high or the high price of the preceding green candle, depending on which is higher.
• The trough price of a complete swing low is the low price of either the green candle that completes the swing low or the low price of the preceding red candle, depending on which is lower.
Historic Peaks and Troughs
The current, or most recent, peak and trough occurrences are referred to as occurrence zero. Previous peak and trough occurrences are referred to as historic and ordered numerically from right to left, with the most recent historic peak and trough occurrences being occurrence one.
Broken and Unbroken Peaks and Troughs
Upon the completion of a new swing low the high of the green candle that completes the swing low will be above, below or equal to the current peak price. And similarly, upon the completion of a new swing high the low of the red candle that completes the swing high will be above, below or equal to the current trough price.
If the high price of the green candle that completes the current swing low is higher than or equal to the current peak price then the current peak is broken. If the high of the green candle that completes the current swing low is below the current peak price, then the current peak is unbroken.
Similarly, if the low price of the red candle that completes the current swing high is lower than or equal to the current trough price then the current trough is broken. If the low price of the red candle that completes the current swing high is above the current trough price, then the current trough is unbroken.
Range
The range is simply the difference between the current peak and current trough prices, generally expressed in terms of points or pips.
Retracement and Extension Ratios
Retracement and extension ratios are calculated by dividing the current range by the preceding range and multiplying the answer by 100. Retracement ratios are those that are equal to or below 100% of the preceding range and extension ratios are those that are above 100% of the preceding range.
Double Bottom and Double Top Patterns
• Double bottom patterns are composed of one peak and two troughs, with the second trough being roughly equal to the first trough.
• Double top patterns are composed of one trough and two peaks, with the second peak being roughly equal to the first peak.
Measurement Tolerances
In general, tolerance in measurements refers to the allowable variation or deviation from a specific value or dimension. It is the range within which a particular measurement is considered to be acceptable or accurate. In this script I have applied this concept to the measurement of double bottom and double top patterns to increase to the frequency of pattern occurrences.
For example, a perfect double bottom is very rare. We can increase the frequency of pattern occurrences by setting a tolerance. A ratio tolerance of 10% to both downside and upside, which is the default setting, means we would have a tolerable ratio measurement range between 90-110% for the second trough, thus increasing the frequency of occurrence.
█ FEATURES
Inputs
• Unbroken Peaks
• Lower Tolerance
• Upper Tolerance
• Pattern Color
• Neckline Color
• Extend Current Neckline
• Show Labels
• Label Color
• Show Projection Lines
• Extend Current Projection Lines
Alerts
Users can set alerts for when the patterns occur.
█ LIMITATIONS
All green and red candle calculations are based on differences between open and close prices, as such I have made no attempt to account for green candles that gap lower and close below the close price of the preceding candle, or red candles that gap higher and close above the close price of the preceding candle. This may cause some unexpected behaviour on some markets and timeframes. I can only recommend using 24-hour markets, if and where possible, as there are far fewer gaps and, generally, more data to work with.
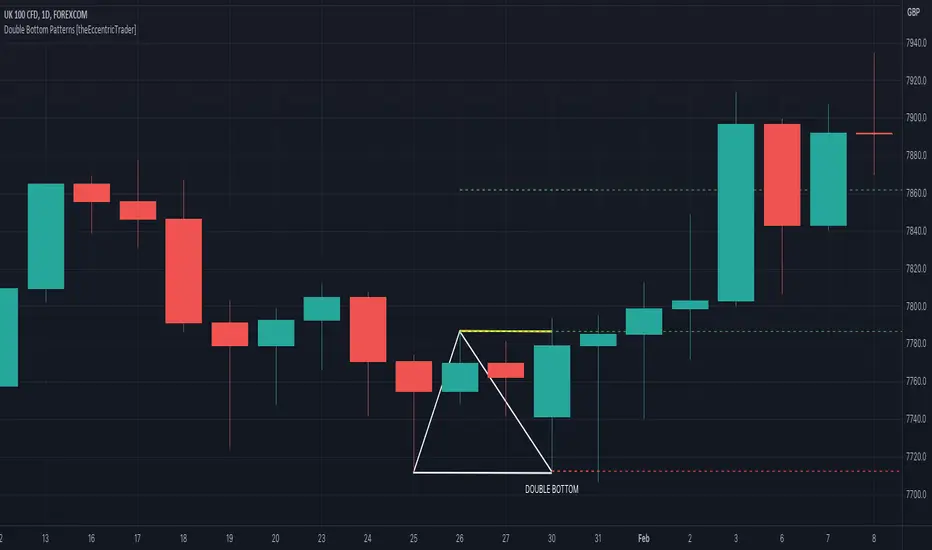
Retracement and Extension Ratios [theEccentricTrader]█ OVERVIEW
This indicator displays retracement and extension ratios above or below the relevant peaks and troughs.
█ CONCEPTS
Green and Red Candles
• A green candle is one that closes with a close price equal to or above the price it opened.
• A red candle is one that closes with a close price that is lower than the price it opened.
Swing Highs and Swing Lows
• A swing high is a green candle or series of consecutive green candles followed by a single red candle to complete the swing and form the peak.
• A swing low is a red candle or series of consecutive red candles followed by a single green candle to complete the swing and form the trough.
Peak and Trough Prices (Basic)
• The peak price of a complete swing high is the high price of either the red candle that completes the swing high or the high price of the preceding green candle, depending on which is higher.
• The trough price of a complete swing low is the low price of either the green candle that completes the swing low or the low price of the preceding red candle, depending on which is lower.
Historic Peaks and Troughs
The current, or most recent, peak and trough occurrences are referred to as occurrence zero. Previous peak and trough occurrences are referred to as historic and ordered numerically from right to left, with the most recent historic peak and trough occurrences being occurrence one.
Range
The range is simply the difference between the current peak and current trough prices, generally expressed in terms of points or pips.
Retracement and Extension Ratios
Retracement and extension ratios are calculated by dividing the current range by the preceding range and multiplying the answer by 100. Retracement ratios are those that are equal to or below 100% of the preceding range and extension ratios are those that are above 100% of the preceding range.
█ FEATURES
Inputs
• Label Color
█ HOW TO USE
This indicator is intended for research purposes, strategy development and strategy optimisation. I hope it will be useful in helping to gain a better understanding of the underlying dynamics at play on any given market and timeframe.
█ LIMITATIONS
All green and red candle calculations are based on differences between open and close prices, as such I have made no attempt to account for green candles that gap lower and close below the close price of the preceding candle, or red candles that gap higher and close above the close price of the preceding candle. This may cause some unexpected behaviour on some markets and timeframes. I can only recommend using 24-hour markets, if and where possible, as there are far fewer gaps and, generally, more data to work with.