WLI Swing High/Low advnc indicatorfor Class members
else
label.set_xy(lowMsg, bar_index, close)
label.set_text(lowMsg, "making New Low")
label.set_color(lowMsg, newSwingLowColor)
label.set_textcolor(lowMsg, color.white)
else
if not na(lowMsg)
label.delete(lowMsg)
lowMsg := na
Wyszukaj w skryptach "swing high low"

Market StructureThis is an advanced, non-repainting Market Structure indicator that provides a robust framework for understanding market dynamics across any timeframe and instrument.
Key Features:
- Non-repainting market structure detection using swing highs/lows
- Clear identification of internal and general market structure levels
- Breakout threshold system for structure adjustments
- Integrated multi-timeframe compatibility
- Rich selection of 30+ moving average types, from basic to advanced adaptive variants
What Makes It Different:
Unlike most market structure indicators that repaint or modify past signals, this implementation uses a fixed-length lookback period to identify genuine swing points.
This means once a structure level or pivot is identified, it stays permanent - providing reliable signals for analysis and trading decisions.
The indicator combines two layers of market structure:
1. Internal Structure (lighter lines) - More sensitive to local price action
2. General Structure (darker lines) - Shows broader market context
Technical Details:
- Uses advanced pivot detection algorithm with customizable swing size
- Implements consecutive break counting for structure adjustments
- Supports both close and high/low price levels for breakout detection
- Includes offset option for better visual alignment
- Each structure break is validated against multiple conditions to prevent false signals
Offset on:
Offset off:
Moving Averages Library:
Includes comprehensive selection of moving averages, from traditional to advanced adaptive types:
- Basic: SMA, EMA, WMA, VWMA
- Advanced: KAMA, ALMA, VIDYA, FRAMA
- Specialized: Hull MA, Ehlers Filter Series
- Adaptive: JMA, RPMA, and many more
Perfect for:
- Price action analysis
- Trend direction confirmation
- Support/resistance identification
- Market structure trading strategies
- Multiple timeframe analysis
This open-source tool is designed to help traders better understand market dynamics and make more informed trading decisions. Feel free to use, modify, and enhance it for your trading needs.

Master Pattern [LuxAlgo]The Master Pattern indicator is derived from the framework proposed by Wyckoff and automatically displays major/minor patterns and their associated expansion lines on the chart.
Liquidity levels are also included and can be used as targets/stops. Note that the Liquidity levels are plotted retrospectively as they are based on pivots.
🔶 USAGE
The Master Pattern indicator detects contraction phases in the markets (characterized by a lower high and higher low). The resulting average from the latest swing high/low is used as expansion line. Price breaking the contraction range upwards highlights a bullish master pattern, while a break downward highlights a bearish master pattern.
During the expansion phase price can tend to be stationary around the expansion level. This phase is then often followed by the price significantly deviating from the expansion line, highlighting a markup phase.
Expansion lines can also be used as support/resistance levels.
🔹 Major/Minor Patterns
The script can classify patterns as major or minor patterns.
Major patterns occur when price breaks both the upper and lower extremity of a contraction range, with their contraction area highlighted with a border, while minor patterns have only a single extremity broken.
🔶 SETTINGS
Contraction Detection Lookback: Lookback used to detect the swing points used to detect the contraction range.
Liquidity Levels: Lookback for the swing points detection used as liquidity levels. Higher values return longer term liquidity levels.
Show Major Pattern: Display major patterns.
Show Minor Pattern: Display minor patterns.

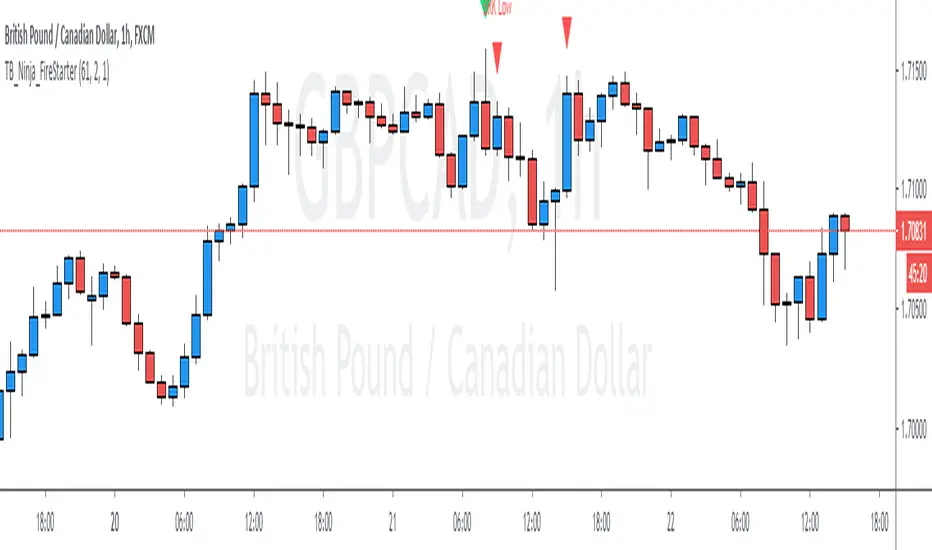
TB_Ninja_FireStarterTB_Ninja_FireStarter v1.0
This indicator measures a break out and retracement on swing HIGH/LOW Candles.
The swing may be marked manually by the user and the bar count adjusted ahead for a retracement range. Fib zones are utilised.
The swing HIGH/LOW Pattern is identified by the user based on market analysis and the indicator applied in accordance with those decisions.
Alerts are available for the Break Out and Retracement zones.
This is NOT a trading system and should be used with supporting information and data. It is not identifying or is meant to represent a standalone trading system.
If you would like to enquire about access to this invite only script please send me a private message on trading view and I will be happy to assist. Thank you.
Adaptive Heikin Ashi [CHE]Adaptive Heikin Ashi — volatility-aware HA with fewer fake flips
Summary
Adaptive Heikin Ashi is a volatility-aware reinterpretation of classic Heikin Ashi that continuously adjusts its internal smoothing based on the current ATR regime, which means that in quiet markets the indicator reacts more quickly to genuine directional changes, while in turbulent phases it deliberately increases its smoothing to suppress jitter and color whipsaws, thereby reducing “noise” and cutting down on fake flips without resorting to heavy fixed smoothing that would lag everywhere.
Motivation: why adapt at all?
Classic Heikin Ashi replaces raw OHLC candles with a smoothed construction that averages price and blends each new candle with the previous HA state, which typically cleans up trends and improves visual coherence, yet its fixed smoothing amount treats calm and violent markets the same, leading to the usual dilemma where a setting that looks crisp in a narrow range becomes too nervous in a spike, and a setting that tames high volatility feels unnecessarily sluggish as soon as conditions normalize; by allowing the smoothing weight to expand and contract with volatility, Adaptive HA aims to keep candles readable across shifting regimes without constant manual retuning.
What is different from normal Heikin Ashi?
Fixed vs. adaptive blend:
Classic HA implicitly uses a fixed 50/50 blend for the open update (`HA_open_t = 0.5 HA_open_{t-1} + 0.5 HA_close_{t-1}`), while this script replaces the constant 0.5 with a dynamic weight `w_t` that oscillates around 0.5 as a function of observed volatility, which turns the open update into an EMA-like filter whose “alpha” automatically changes with market conditions.
Volatility as the steering signal:
The script measures volatility via ATR and compares it to a rolling baseline (SMA of ATR over the same length), producing a normalized deviation that is scaled by sensitivity, clamped to ±1 for stability, and then mapped to a bounded weight interval ` `, so the adaptation is strong enough to matter but never runs away.
Outcome that matters to traders:
In high volatility, the weight shifts upward toward the prior HA open, which strengthens smoothing exactly where classic HA tends to “chatter,” while in low volatility the weight shifts downward toward the most recent HA close, which speeds up reaction so quiet trends do not feel artificially delayed; this is the practical mechanism by which noise and fake signals are reduced without accepting blanket lag.
How it works
1. HA close matches classic HA:
`HA_close_t = (Open_t + High_t + Low_t + Close_t) / 4`
2. Volatility normalization:
`ATR_t` is computed over `atr_length`, its baseline is `ATR_SMA_t = SMA(ATR, atr_length)`, and the raw deviation is `(ATR_t / ATR_SMA_t − 1)`, which is then scaled by `adapt_sensitivity` and clamped to ` ` to obtain `v_t`, ensuring that pathological spikes cannot destabilize the weighting.
3. Adaptive weight around 0.5:
`w_t = 0.5 + oscillation_range v_t`, giving `w_t ∈ `, so with a default `range = 0.20` the weight stays between 0.30 and 0.70, which is wide enough to matter but narrow enough to preserve HA identity.
4. EMA-like open update:
On the very first bar the open is seeded from a stable combination of the raw open and close, and thereafter the update is
`HA_open_t = w_t HA_open_{t−1} + (1 − w_t) HA_close_{t−1}`,
which is equivalent to an EMA where higher `w_t` means heavier inertia (more smoothing) and lower `w_t` means stronger pull to the latest price information (more responsiveness).
5. High and low follow classic HA composition:
`HA_high_t = max(High_t, max(HA_open_t, HA_close_t))`,
`HA_low_t = min(Low_t, min(HA_open_t, HA_close_t))`,
thereby keeping visual semantics consistent with standard HA so that your existing reading of bodies, wicks, and transitions still applies.
Why this reduces noise and fake signals in practice
Fake flips in HA typically occur when a fixed blending rule is forced to process candles during a volatility surge, producing rapid alternations around pivots or within wide intrabar ranges; by increasing smoothing exactly when ATR jumps relative to its baseline, the adaptive open stabilizes the candle body progression and suppresses transient color changes, while in the opposite scenario of compressed ranges, the reduced smoothing allows small but persistent directional pressure to reflect in candle color earlier, which reduces the tendency to enter late after multiple slow transitions.
Parameter guide (what each input really does)
ATR Length (default 14): controls both the ATR and its baseline window, where longer values dampen the adaptation by making the baseline slower and the deviation smaller, which is helpful for noisy lower timeframes, while shorter values make the regime detector more reactive.
Oscillation Range (default 0.20): sets the maximum distance from 0.5 that the weight may travel, so increasing it towards 0.25–0.30 yields stronger smoothing in turbulence and faster response in calm periods, whereas decreasing it to 0.10–0.15 keeps the behavior closer to classical HA and is useful if your strategy already includes heavy downstream smoothing.
Adapt Sensitivity (default 6.0): multiplies the normalized ATR deviation before clamping, such that higher sensitivity accelerates adaptation to regime shifts, while lower sensitivity produces gradual transitions; negative values intentionally invert the mapping (higher vol → less smoothing) and are generally not recommended unless you are testing a counter-intuitive hypothesis.
Reading the candles and the optional diagnostic
You interpret colors and bodies just like with normal HA, but you can additionally enable the Adaptive Weight diagnostic plot to see the regime in real time, where values drifting up toward the upper bound indicate a turbulent context that is being deliberately smoothed, and values gliding down toward the lower bound indicate a calm environment in which the indicator chooses to move faster, which can be valuable for discretionary confirmation when deciding whether a fresh color shift is likely to stick.
Practical workflows and combinations
Trend-following entries: use color continuity and body expansion as usual, but expect fewer spurious alternations around news spikes or into liquidity gaps; pairing with structure (swing highs/lows, breaks of internal ranges) keeps entries disciplined.
Exit management: when the diagnostic weight remains elevated for an extended period, you can be stricter with exit triggers because flips are less likely to be accidental noise; conversely, when the weight is depressed, consider earlier partials since the indicator is intentionally more nimble.
Multi-asset, multi-TF: the adaptation is especially helpful if you rotate instruments with very different vol profiles or hop across timeframes, since you will not need to retune a fixed smoothing parameter every time conditions change.
Behavior, constraints, and performance
The script does not repaint historical bars and uses only past information on closed candles, yet just like any candle-based visualization the current live bar will update until it closes, so you should avoid acting on mid-bar flips without a rule that accounts for bar close; there are no `security()` calls or higher-timeframe lookups, which keeps performance light and execution deterministic, and the clamping of the volatility signal ensures numerical stability even during extreme ATR spikes.
Sensible defaults and quick tuning
Start with the defaults (`ATR 14`, `Range 0.20`, `Sensitivity 6.0`) and observe the weight plot across a few volatile events; if you still see too many flips in turbulence, either raise `Range` to 0.25 or trim `Sensitivity` to 4–5 so that the weight can move high but does not overreact, and if the indicator feels too slow in quiet markets, lower `Range` toward 0.15 or raise `Sensitivity` to 7–8 to bias the weight a bit more aggressively downward when conditions compress.
What this indicator is—and is not
Adaptive Heikin Ashi is a context-aware visualization layer that improves the signal-to-noise ratio and reduces fake flips by modulating smoothing with volatility, but it is not a complete trading system, it does not predict the future, and it should be combined with structure, risk controls, and position management that fit your market and timeframe; always forward-test on your instruments, and remember that even adaptive smoothing can delay recognition at sharp turning points when volatility remains elevated.
Disclaimer
The content provided, including all code and materials, is strictly for educational and informational purposes only. It is not intended as, and should not be interpreted as, financial advice, a recommendation to buy or sell any financial instrument, or an offer of any financial product or service. All strategies, tools, and examples discussed are provided for illustrative purposes to demonstrate coding techniques and the functionality of Pine Script within a trading context.
Any results from strategies or tools provided are hypothetical, and past performance is not indicative of future results. Trading and investing involve high risk, including the potential loss of principal, and may not be suitable for all individuals. Before making any trading decisions, please consult with a qualified financial professional to understand the risks involved.
By using this script, you acknowledge and agree that any trading decisions are made solely at your discretion and risk.
Best regards and happy trading
Chervolino

Madness StyleFinally a Indicator that has it all in one place for those on free accounts that can only use just one or two indicators. This indicator includes the following features;
• EMA Fast/Slow, Balance Zone Band
• Previous Day Highs/Lows/Mid
• Session Highs/Lows
• ZigZag Based on Pivots
• Equal Highs/Lows
• Swing Highs/Lows Markers
• Liquidity Pools
• Daily Bias + MTF Trend Table
I hope you enjoy!

Hopiplaka Goldbach System with SignalsThis tool builds a dynamic price framework around the current market using a PO3 range and a set of mathematically derived Goldbach levels. It then scores nearby levels for quality (reliability) and produces Buy/Sell signals only when multiple, independent factors line up (price level quality, trend/“Tesla Vortex” state, ICT AMD phase, time confluence, volume bias, and momentum). The goal is to identify high-confluence inflection points rather than constant signals.
Core Concepts & Why They’re Combined
1. PO3 Range Framework
Price is segmented into a primary range (lower → upper) determined by a configurable size (3× ladder: 3, 9, 27, …, 2187).
⦁ If price sits near a boundary (configurable sensitivity), the range can auto-expand to the next 3× size to better fit current volatility.
⦁ This gives a stable “map” of the active trading area and its boundaries.
2. Goldbach Levels (Pure Hopiplaka implementation)
For each even number ≤ your precision limit, the script evaluates all prime-sum partitions (Goldbach partitions) and converts their prime ratios into price levels inside the PO3 range.
⦁ Levels are classified as Premium / Standard / Discount based on properties of the prime pair and a mathematical weighting.
⦁ Strict minimum spacing rules (exact %, OB %, liquidity-void %) prevent clutter and keep only the most meaningful levels.
3. Tesla Vortex (trend/phase strength)
A volatility/trend-aware state machine estimates whether market is in MMxM (accumulation/mean-revert like) or TREND conditions and maps price interaction with high-quality levels to phases (e.g., Order Block Formation, Distribution).
⦁ This helps filter signals: buys favored in MMxM near supportive levels; sells favored in TREND near premium/liquidity levels, etc.
4. ICT Integration (AMD, IPDA bias hooks)
A lightweight AMD phase detector classifies the recent window into Accumulation / Manipulation / Distribution and marks market structure bias. This is used as confluence with level quality and trend state.
5. Time Confluence (Goldbach time)
Swing highs/lows are checked against Goldbach-valid timestamps (based on hour+minute sums decomposable into prime pairs). Repeated alignment adds time-bias confidence. When price and time align, level reliability is boosted.
6. Volume & Liquidity Context
A rolling volume baseline marks High/Low Volume Bias; levels can be volume-weighted (raising or lowering their reliability). Proximity to PO3 extremes flags pending liquidity sweeps.
Why this mashup?
The system blends price geometry (PO3 + Goldbach), state/trend (Tesla Vortex), market-microstructure (ICT AMD), time confluence, and volume/liquidity into one numerically scored signal. Each component answers a different question; together they reduce false positives and favor high-quality trades near meaningful levels.
What You’ll See on the Chart
⦁ PO3 Range Boundaries: two dashed lines (“lower” and “upper”). Auto-expand darkens the boundary style slightly.
⦁ Goldbach Levels: horizontal lines colored by classification and context:
⦁ Premium (strong premium band), Standard, Discount
⦁ OB (Order-Block candidate), LV (Liquidity Void)
⦁ TESLA node (trend/phase aligned)
⦁ Heavier width = higher reliability; dashed/dotted styles encode class differences.
⦁ PO3 Liquidity Boxes: narrow yellow shaded bands above/below each level (configurable pip distance).
⦁ Markers
⦁ ▲ Buy arrow below bar when a Buy signal triggers
⦁ ▼ Sell arrow above bar when a Sell signal triggers
⦁ ● Small dot when price touches a Goldbach level
⦁ Data-window plots:
⦁ Tesla Vortex Strength (numeric)
⦁ Time Bias (positive = bullish, negative = bearish)
⦁ Volume Bias (+1 high / −1 low)
⦁ Signal Strength (+ for buy / − for sell, zero when no signal)
⦁ Label Legend (on level tags)
⦁ TESLA – Tesla-aligned level node
⦁ OB – Order-block-quality zone
⦁ LV – Liquidity-void zone
⦁ Premium / Standard / Discount – Level class
⦁ Gxx – Even number used to build the level (Goldbach reference)
⦁ Reliability – Final score after time/volume/tesla weighting
⦁ Optional extras: Vol (relative volume weight), Time (time-confluence strength)
How Signals Are Generated
A signal is proposed when price comes within a minimum distance of a high-reliability level. It is then accepted only if enough of these independent checks pass (you control the required count):
1. Tesla Vortex state matches direction (e.g., MMxM with buy; TREND with sell).
2. ICT AMD phase aligns (Accumulation → buy bias; Distribution → sell bias).
3. Goldbach time bias supports the direction.
4. Volume bias supportive (high-volume context boosts conviction).
5. Level quality (TESLA node or Premium class) is high.
6. Momentum alignment (recent 2–3 bars in the same direction).
Only when confluence ≥ your threshold and confidence ≥ 0.5 (scaled by sensitivity) will a Buy/Sell arrow print. Cooldown prevents rapid repeats.
Inputs (key ones)
⦁ PO3 Settings: range size, auto-expansion toggle, expansion sensitivity, liquidity band distance.
⦁ Goldbach Mathematics: precision limit, exact spacing rules, spacing for OB/LV classes.
⦁ Trading Signals: master toggle, sensitivity, min reliability, confluence required, cooldown, min distance to level, markers on/off.
⦁ Tesla Vortex / ICT: enable Vortex, sensitivity; enable AMD/IPDA analysis and lookback.
⦁ Time & Volume: enable Goldbach time and weighting; volume lookback; liquidity-pool detection.
⦁ Display: show historical/future projections, number of future bars, labels, path/phase overlays.
⦁ Colors: full palette per class/context (premium/discount/OB/LV/Tesla/time/volume, buy/sell/goldbach hit).
Alerts Included
⦁ Signals: “BUY Signal Generated”, “SELL Signal Generated”
⦁ Level Interactions: “Goldbach Level Hit”; “Near Goldbach Level”; “Tesla Vortex Node”; “Premium Level Alert”
⦁ PO3: “PO3 Upper Break”, “PO3 Lower Break”, “PO3 Range Expansion”
⦁ State Changes: “Tesla Vortex Phase Change”
⦁ Context: “Liquidity Sweep Imminent”, “Strong Time Confluence”
You can wire these to webhooks or notifications.
Suggested Workflow
1. Choose PO3 size that matches your instrument’s volatility; keep Auto-Expansion ON initially.
2. Set confluence threshold (start at 3–4) and cooldown (e.g., 10 bars).
3. Keep Time and Volume modules ON for additional reliability weighting.
4. Use arrows as filters, not blind entries—confirm with your execution plan and risk rules.
5. Prefer signals near Premium/Discount TESLA nodes that also show time confluence and supportive volume.
Practical Notes & Limitations
⦁ The mathematical framework is deterministic, but market execution is not—always manage risk.
⦁ Future projections and heavy labeling can be resource-intensive; tune visibility if performance drops.
⦁ If a market is extremely illiquid or gap-prone, spacing/filters may hide many levels (by design).
Disclaimer
This script is for educational and research purposes only and is not financial advice. Trading involves risk. You are responsible for your own decisions.

Lumiere’s Indicator BundleThe Lumiere’s Indicator Bundle combines three of Lumiere’s most used tools into one script:
🔹 BOS Mark-out – Marks Breaks of Structure with clear bullish/bearish levels and optional alerts.
🔹 Liquidity Mark-ou t – Draws significant swing highs/lows and automatically removes them once swept.
🔹 Trading Session High/Low – Tracks Asia, London, and New York session ranges with customizable timezone.
Why this bundle?
I made this bundle so everyone can run all my indicators at once without having to pick and choose between them or worry about chart space limits.
Instead of loading 3 separate indicators, this package gives you everything in one place. You can toggle each module (BOS, Liquidity, Sessions) on or off from the settings. All inputs are kept clean and organized in their own sections for easy adjustments.
What to expect
BOS lines always plotted on top for maximum clarity.
Liquidity highs/lows update in real time and get removed when taken out.
Session ranges show the active session’s high/low and can mark sweeps after the session closes.
Default timezone is New York (UTC-4), but you can switch to any TradingView-supported timezone.
BOS alerts are included, so you’ll never miss a structural break.

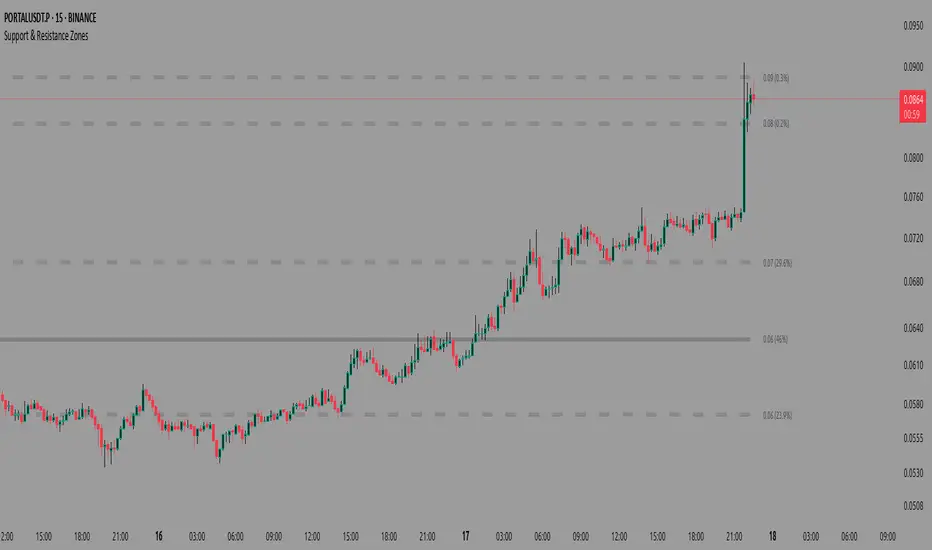
Support & Resistance ZonesAdvanced Support & Resistance Detection Algorithm
This indicator identifies meaningful price levels by analyzing market structure using a proprietary statistical approach. Unlike traditional methods that rely on simple swing highs/lows or moving averages, this system dynamically detects zones where price has shown consistent interaction, revealing true areas of supply and demand.
Core Methodology
Price Data Aggregation
Collects highs and lows over a configurable lookback period.
Normalizes price data to account for volatility, ensuring levels remain relevant across different market conditions.
Statistical Significance Filtering
Rejection of random noise: Eliminates insignificant price fluctuations using adaptive thresholds.
Volume-weighted analysis (implied): Stronger reactions at certain price levels are given higher priority, even if volume data is unavailable.
Dynamic Level Extraction
Density-based S/R Zones: Instead of fixed swing points, the algorithm identifies zones where price has repeatedly consolidated.
Time decay adjustment: Recent price action has more influence, ensuring levels adapt to evolving market structure.
Strength Quantification
Each level is assigned a confidence score based on:
Touch frequency: How often price revisited the zone.
Reaction intensity: The magnitude of bounces/rejections.
Time relevance: Whether the level remains active or has been broken decisively.
Adaptive Level Merging & Pruning
Proximity-based merging: If two levels are too close (within a volatility-adjusted threshold), they combine into one stronger zone.
Decay mechanism: Old, untested levels fade away if price no longer respects them.
Why This Approach Works Better Than Traditional Methods
✅ No subjective drawing required – Levels are generated mathematically, removing human bias.
✅ Self-adjusting sensitivity – Works equally well on slow and fast-moving markets.
✅ Focuses on statistically meaningful zones – Avoids false signals from random noise.
✅ Non-repainting & real-time – Levels only update when new data confirms their validity.
How Traders Can Use These Levels
Support/Resistance Trading: Fade bounces off strong levels or trade breakouts with confirmation.
Confluence with Other Indicators: Combine with RSI, MACD, or volume profiles for higher-probability entries.
Stop Placement: Place stops just beyond key levels to avoid premature exits.
Technical Notes (For Advanced Users)
The algorithm avoids overfitting by dynamically adjusting zones sensitivity based on market conditions.
Unlike fixed pivot points, these levels adapt to trends, making them useful in both ranging and trending markets.
The strength percentage helps filter out weak levels—only trade those with a high score for better accuracy.
Note: Script takes some time to load.
Adaptive Support & Resistance Levels [StabTrading]The Adaptive S&R Levels indicator is designed to study support and resistance levels by synthesizing multiple well-known techniques for identifying these zones. It aims to provide traders with reliable price levels that reflect the collective perspective of market participants, using historical price action and projective techniques for extreme conditions.
💡 Introduction: Identified Problem
Traders often draw support and resistance lines using varied methods, leading to inconsistencies in where these levels are placed on charts. This variability can reduce the effectiveness of individual levels, as price may not react strongly to zones that lack broad recognition. The Adaptive S&R Levels indicator addresses this by aggressively averaging multiple established techniques to create support and resistance lines that align with what most traders are likely to identify, increasing the probability of price reactions.
🚀 How it Works: Overview
The indicator employs a multi-technique algorithm to generate support and resistance levels, ensuring they represent a consensus of trader perspectives.
🚀 How it Works: Chart Levels Display and Styling
Support levels, displayed in green below the current price, and resistance levels, shown in red above the price, are plotted clearly on the chart. Levels are numbered sequentially (e.g., v1, v2) as they move further from the current price, providing a visual hierarchy of proximity. Extreme levels, labeled as "Extreme Support" or "Extreme Resistance," are plotted in a bolder color to distinguish them as the outermost boundaries, maintaining the same green (support) and red (resistance) color scheme for consistency.
🚀 How it Works: Historical Price Action Algorithm
For areas with available historical data, the algorithm analyzes price action using a variety of recognized methods for drawing support and resistance, such as pivot points, swing highs/lows, and volume-based zones. It calculates a weighted average of these techniques to produce a “regression fit” line that reflects the accumulation of levels traders might draw. By prioritizing areas where multiple methods converge, the indicator identifies zones likely to be significant to a wide audience, enhancing their relevance.
🚀 How it Works: Projective Techniques Algorithm
In scenarios without recent historical price action—such as all-time highs or lows—the indicator employs an alternative algorithm that combines projective techniques commonly used by traders. These include Fibonacci extensions, Measured Moves (price projections), Psychological Milestones (e.g., round numbers), Channel/Trendline Extrapolation, and Time-Based Targets (inspired by methods like Gann techniques). The algorithm seeks a confluence of these methods to draw support and resistance levels that align with what most traders would consider significant in such conditions. These levels maintain the same green (support) and red (resistance) color scheme, with numbering based on their distance from the price.
🚀 How it Works: Noise Parameter Adjustment
Users can adjust a noise parameter to control the number of displayed levels. Lower settings show more lines, reflecting a broader range of potential zones but with less confluence. Higher settings increase the required confluence of techniques, resulting in fewer lines that have a higher probability of eliciting a price reaction. This customization allows traders to tailor the indicator to their preferred timeframe or trading style.
🔥 Features
Confluence-Based Levels: Support and resistance lines are derived from a weighted average of multiple techniques, aiming to mirror the levels most traders would recognize.
Extreme Levels: Generates support and resistance in areas without historical price action, using techniques like Fibonacci extensions and Measured Moves.
Color-Coded Display: Green support levels appear below the current price, and red resistance levels appear above, with extreme levels in a bolder shade for distinction.
Adjustable Noise Parameter: Users can modify the confluence threshold to display more lines (lower settings) or fewer, higher-probability lines (higher settings).
📈 Implementing the System
1. Adjust Settings
Set the noise parameter based on your trading style (0.1 to 10).
Use lower values for more frequent levels, suitable for scalping or short-term analysis.
Use higher values for fewer, higher-confluence levels, ideal for swing trading or longer-term strategies.
Adjust for your timeframe: Settings tend to be lower on shorter timeframes and higher on longer timeframes.
2. Identify Levels
Monitor green support levels below the price for potential buying zones, noting their numbered proximity (v1, v2, etc.).
Observe red resistance levels above the price for potential selling or shorting zones, noting their numbered proximity.
Note extreme levels (labeled "Extreme Support" or "Extreme Resistance") in areas like all-time highs, which may act as key reversal points.
3. Evaluate Price Reactions
Track how price interacts with the plotted levels to assess their effectiveness, considering their proximity to price.
Observe performance in bullish, bearish, or ranging markets to understand the indicator’s behavior at different levels.
Test different noise parameter settings across various assets and timeframes to find the optimal balance for your approach.
4. Layering Trades with Levels
Use the numbered levels to layer into a trade: for example, enter a partial position at a closer support level (e.g., v1) and add to it at a further level (e.g., v2) if price continues to decline, spreading risk across multiple zones.
Layer out of a trade by taking partial profits at each resistance level as price rises (e.g., reduce position at v1, then v2), or fully exit at an "Extreme Resistance" level to maximize gains while managing exposure.
🔶 Conclusion
The Adaptive S&R Levels indicator provides a framework for studying support and resistance by averaging multiple trader-recognized techniques. With its ability to handle both historical and extreme price scenarios, numbered levels for visual hierarchy, and customizable noise settings, it offers a versatile tool for analyzing key price levels. Designed for educational use, it encourages traders to test and observe how these consensus-driven levels align with market behavior within broader analysis.

BitAlgo Signals HA
If you have any question regarding this indicator, feel free to get in touch with us.
_______________________________________________________________________________________________________________________________________
📈 Overview
"BitAlgo Signals HA" aims to give Long and Short signals at the most opportune time to get the earliest market entries. To do so, it uses a base of Heikin Ashi candles price action crossed with it's relative momentum. More precisely, Heikin Ashi candles are great to spot quick trend of the market and by calculating the relative bar size of multiple candles with the momentum paired with the steepness of the trend we are able to find a market's weak point where the price should stagnate before giving a key reversal signals. And to make this indicator more powerful, we added ways of filtering signals such as different type of personalized price action, for example a change of character is often used alone but for this indicator we combined swing and internal structure to get high confirmation... We also inputed fear/greed zone to make sure our signals appeared at the limits of the market and not in the middle where the price ranges. Moreover, we revisited the way of seeing the Fibonacci retracement to create a special channel showing key market points where the price should either make a drop or climb up, if selected this filter waits for the price to retest those level to gain high confirmation.
A unique way of making those clear signals was made by an automatic filter action depending on the current swing points. Most buy/sell indicators are useless and do the opposite of the market, but not only did we manage to avoid this as as much as possible but also kept most of our invalid signals to compare their relative position in the market depending on swing structure as well as their volume strength to automatically reverse or not the signals to either predict a reversal or a huge continuation movement instead of just losing this signal.
📈 How to use
Considering all the elements of this indicator, it is clear that this indicator is purely made to catch reversals and sometimes trend continuation. Add alerts and get ready to analyze the market only when you get the signals to save time and money ;) or simply buy and sell immediately after the signals. Try playing with the indicator's filter to find the best signals depending on your market, timeframe...
One setting that almost never gives false signals is:
- BTC/USDT Future
- 15 min
- Filter type: Fear/Greed zone
- Fibonacci retracement: ON
- Automatically Reverse: ON
- Fiblength: 100
- Swing High/Low length: 225
📈 Features
- Long and Short signals
- Various filter type
- Fibonacci setting for the filter
- Automatic reverse option to use every signals
- Possibility of reversing the signals: if you find the worst setting possible, don’t worry, simply use this features to reverse all you signals to make the best indicator

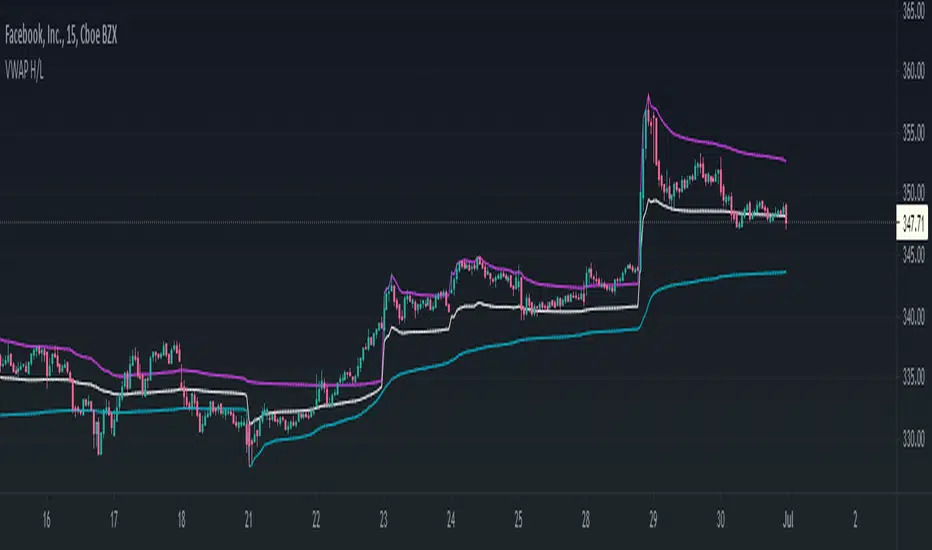
VWAP High/Low ChannelIn short, the VWAP High/Low Channel is based on VWAP "newsession" on swing high/low, with a basis of the two.
The VWAP High/Low channel seems to act like Bollinger bands or Donchain Channels when squeezing for a breakout, while also acting as a pivot after a breakout.
Variable Swing High/Low [Sim]This script finds the highest high and lowest low for 3 seperate lookbacks. By default, the lookbacks are 2, 5, and 7-days. Fractions of days may be used (e.g. .33, .66, 1-day). These can all be adjusted in the inputs section.
Trade on,
Sim

Gold Killzone Bias Suite🟡 Gold Killzone Bias Suite
The Gold Killzone Bias Suite is an advanced institutional-grade tool designed to generate high-confidence directional bias for XAU/USD (Gold) during the London and New York killzones.
Built for traders using a structured, confluence-driven approach, this tool blends price action, smart money principles, momentum, and volume into a real-time bias engine with a clean, easy-to-read dashboard.
🔧 Key Features
🕰️ Session-Based Bias (London / New York)
Independent bias calculation per session
Killzone times customizable with timezone support
Background highlighting (blue/red) for each session
📊 VWAP Engine
Reclaim & rejection detection
VWAP deviation alerts
Daily HTF VWAP integration
Score impact based on VWAP behaviour
📉 Market Structure (CHoCH / BOS)
Detects swing highs/lows
Labels bullish/bearish CHoCHs
Structure score contributes to session bias
💧 Liquidity Grabs
Detects stop hunts above highs / below lows
Confirms with candle rejection (body % filter)
Plots labels and adds to bias scoring
⚡ Momentum Filters
RSI: Bullish >55, Bearish <45
MACD: Histogram + Signal Line crossovers
Combined momentum score used in bias
🧠 Smart Money Proximity
Optional FVG/OB score toggle (placeholder for custom logic)
Adds static confluence for proximity-based setups
⏫ Higher Time Frame Context
Daily VWAP comparison
4H high/low structure breaks
Adds trend score to current session bias
🧠 How Bias Works
The suite uses a scoring model. Each confluence adds or subtracts points:
VWAP reclaim/reject: ±30
CHoCH/BOS: ±30
Liquidity grab: ±20
RSI/MACD: ±10
FVG/OB Proximity: +10
Daily VWAP trend: ±10
H4 Trend Break: ±10
Final Bias:
Bullish if score ≥ +20
Bearish if score ≤ -20
Neutral if between -19 and +19
A confidence % (capped at 100) is also shown, along with the contributing confluences (VWAP, Structure, Liquidity, etc.).
📋 Dashboard
A real-time dashboard shows for each session:
Session name and time
Bias (Bullish / Bearish / Neutral)
Confidence (%)
Confluences used
Position can be moved (Top Left, Top Right, etc.). Designed to be unobtrusive yet informative.
🧪 Best Practices
Use on 15m / 5m charts for intraday setups
Confirm with D1 or H4 structure for directional context
Combine with OB/FVG zones or SMT for entries
Use Trading View alerts for bias flips or liquidity grabs (custom logic can be added)
Bar Replay compatible for back testing and journaling bias shifts
🔐 Notes
Does not generate trade signals or alerts by default
Focused on bias generation and confluence stacking
Compatible with funded account trading models
📈 Built for traders who want a systematic, score-based approach to identifying directional edge in high-volume gold sessions.

Option Jackpot Indicator# ATR Option Signal Enhanced - Smart Filtering System
🚀 **Professional Options Trading Indicator with Advanced Signal Filtering**
## 📊 Overview
This advanced Pine Script indicator is specifically designed for Indian options traders, providing intelligent buy/sell signals for BANKNIFTY, NIFTY, FINNIFTY, MIDCAP, and custom stocks. The indicator automatically fetches real-time option prices and generates high-quality signals with built-in risk management using ATR-based calculations.
## 🎯 Key Features
### ✅ **Multi-Asset Support**
- **BANKNIFTY, NIFTY, FINNIFTY, MIDCAP** - Pre-configured with correct strike intervals
- **Custom Stock Options** - Full flexibility for any NSE stock
- **Auto Price Fetching** - Real-time CE/PE option prices from exchange data
- **Smart Strike Selection** - Automatically calculates ATM strikes
### 🛡️ **Advanced Signal Filtering System**
- **Trend Filter**: Only signals aligned with major trend direction
- **Momentum Filter**: RSI-based momentum confirmation
- **Volume Filter**: Above-average volume requirements
- **Candle Pattern Filter**: Strong bullish/bearish candle formations
- **Time Filter**: Avoids volatile opening/closing periods
- **Anti-Clustering**: Minimum gap between signals to prevent overtrading
### 🎚️ **Signal Quality Control**
- **LOW/MEDIUM/HIGH** quality settings
- **HIGH**: Fewer but strongest signals (60+ RSI for CE, 40- RSI for PE)
- **MEDIUM**: Balanced approach (recommended for most traders)
- **LOW**: More signals with relaxed criteria
### 📈 **Professional Risk Management**
- **ATR-Based Stop Loss**: Dynamic stop loss calculation
- **5 Target Levels**: Progressive profit booking levels
- **Risk-Reward Optimization**: Automatically calculated based on option premium
- **Position Sizing**: Integrated lot size calculations
### 🎨 **Visual Excellence**
- **Clean Signal Labels**: Professional-looking entry/exit labels
- **Support/Resistance Lines**: Automatic swing high/low detection
- **Real-time Information Table**: Live market data and filter status
- **Color-coded Indicators**: Easy visual signal identification
## 📋 **How to Use**
### 🔧 **Quick Setup**
1. **Select your instrument** (BANKNIFTY/NIFTY/FINNIFTY/MIDCAP/Custom)
2. **Set expiry date** (Day/Month/Year format)
3. **Choose signal quality** (Start with MEDIUM)
4. **Enable desired filters** (All recommended initially)
5. **Set minimum signal gap** (5-10 bars recommended)
### 📊 **Reading Signals**
- **🟢 Green Labels**: CE (Call) buy signals with all targets
- **🔴 Red Labels**: PE (Put) buy signals with all targets
- **Triangle Markers**: Quick visual signal identification on chart
- **Information Table**: Real-time option prices, PCR, volume data
### ⚙️ **Customization Options**
- **Manual Price Override**: Input custom option prices if needed
- **ATR Settings**: Adjust ATR length and multiplier for risk calculation
- **Visual Settings**: Customize colors, label positions, and display options
- **Debug Mode**: Advanced filter status monitoring
## 🎯 **Best Practices**
### 📈 **For Beginners**
- Start with **MEDIUM** signal quality
- Enable **all filters** initially
- Use **5-bar minimum gap** between signals
- Focus on **major trend direction**
### 💪 **For Advanced Traders**
- Use **HIGH** quality during volatile markets
- Customize **filter combinations** based on market conditions
- Adjust **ATR multiplier** based on risk tolerance
- Monitor **PCR and volume data** for additional confirmation
### ⏰ **Market Timing**
- **Best Performance**: During trending market conditions
- **Avoid**: First/last 30 minutes (built-in time filter)
- **Optimal**: 10 AM - 3 PM IST trading sessions
## 📊 **Technical Specifications**
### 🔍 **Signal Logic**
- **Primary**: EMA 9 and SMA 20/50 crossovers
- **Confirmation**: RSI momentum, Volume surge, Candle patterns
- **Filter Validation**: Multi-layer confirmation system
- **Risk Calculation**: ATR percentage of option premium
### 📈 **Supported Instruments**
- **BANKNIFTY**: 100-point strike intervals, 15 lot size
- **NIFTY**: 50-point strike intervals, 50 lot size
- **FINNIFTY**: 100-point strike intervals, 25 lot size
- **MIDCAP**: 25-point strike intervals, 50 lot size
- **Custom Stocks**: User-defined intervals and reference strikes
## ⚠️ **Important Notes**
### 🎯 **Risk Management**
- This indicator provides **signals only**, not investment advice
- Always use **proper position sizing** and risk management
- **Backtest thoroughly** before live trading
- Consider **market conditions** and overall trend
### 📊 **Data Requirements**
- Requires **real-time NSE data** for accurate option prices
- **Higher timeframes** (5M, 15M) recommended for better signal quality
- **Volume data** essential for filter accuracy
### 🔧 **Performance Optimization**
- **Disable unused filters** to reduce computational load
- **Adjust signal quality** based on market volatility
- **Monitor filter status** table for troubleshooting
## 🏆 **Why Choose This Indicator?**
✅ **Professional Grade**: Built by experienced options traders for real market conditions
✅ **Comprehensive Filtering**: Reduces false signals by 60-80%
✅ **Auto Price Fetching**: No manual price input required
✅ **Risk Management**: Built-in ATR-based stop loss and targets
✅ **Multi-Asset**: Supports all major Indian indices and stocks
✅ **User-Friendly**: Easy setup with professional results
✅ **Regular Updates**: Continuously improved based on user feedback
## 📞 **Support & Updates**
This indicator is actively maintained and updated based on user feedback and market changes. For support, suggestions, or custom modifications, please reach out through TradingView messages.
---
**⚡ Transform your options trading with intelligent signals and professional risk management!**
*Disclaimer: This indicator is for educational and informational purposes only. Trading involves significant risk of loss. Always trade responsibly and consider your risk tolerance.*

MomentumQ MS/OBMomentumQ MS/OB - Market Structure & Order Blocks Indicator
________________________________________
The MomentumQ MS/OB Indicator is a professional-grade tool designed to help traders analyze market structure, institutional order flow, and dynamic support/resistance levels.
Unlike traditional indicators, MomentumQ MS/OB leverages advanced liquidity analysis to identify key market zones, enabling traders to spot high-probability trade setups with institutional-grade precision.
A unique advantage of this indicator is its ability to generate more order blocks across all timeframes using a custom lookback setting. This feature enhances intraday order block creation, giving traders a clearer view of market liquidity shifts in lower timeframes while remaining effective in higher timeframes.
Additionally, the dynamic support and resistance plotting system automatically adjusts based on market structure, ensuring traders have a real-time, adaptive view of key price levels. Unlike static support/resistance indicators, these dynamic zones shift based on price action, helping traders identify breakouts, retests, and liquidity traps more accurately.
________________________________________
Key Features
1. Market Structure & Institutional Order Blocks
Detects institutional bullish and bearish order blocks, helping traders locate high-liquidity zones.
Real-time zone updates keep traders focused on the most relevant price levels.
Generates more order blocks in every timeframe, making it ideal for intraday and long-term trading strategies.
2. Smart Dynamic Support & Resistance Detection
Uses historical price action to identify high-impact support and resistance zones dynamically.
Updates automatically in response to price action, keeping traders focused on valid trading zones.
Helps traders anticipate breakouts, reversals, and liquidity traps in real time.
3. Institutional-Grade Price Action Analysis
Advanced algorithmic validation filters weak order blocks, ensuring only the strongest setups are displayed.
Customizable settings allow traders to adjust the indicator’s sensitivity based on their trading style.
4. Professional-Level Charting & Customization
Fully adjustable visuals – Traders can toggle features such as:
Bullish/Bearish Order Block Zones
Boundary Lines
Market Structure Levels
________________________________________
How It Works
Institutional Order Blocks
The indicator scans for swing highs/lows and detects liquidity zones based on institutional price movements.
Bullish Order Blocks indicate where institutions accumulated buy orders.
Bearish Order Blocks indicate where institutions placed aggressive sell orders.
The lookback setting enhances detection, allowing traders to see more order block formations across multiple timeframes.
Market Structure & Dynamic Support/Resistance
The algorithm continuously evaluates price action and key rejection levels, dynamically adjusting support and resistance zones.
Unlike traditional static support and resistance levels, these zones shift with real-time market conditions.
Helps traders determine trend direction and anticipate market reversals.
Order Block Validation
Only high-probability order blocks are displayed, eliminating weak signals and providing stronger trade opportunities.
The indicator produces more order blocks at lower timeframes, allowing for better intraday trade execution insights.
________________________________________
How to Use This Indicator
Confirm institutional trading areas by analyzing bullish and bearish order block zones.
Use dynamic support and resistance levels to identify high-probability trade zones for breakouts and reversals.
Adjust the lookback setting to control the frequency of order block detection, optimizing for intraday vs. long-term trading strategies.
Combine with price action strategies to validate trade entries and exits using breakouts, retests, and rejection signals.
This indicator works for all markets, including Forex, Stocks, Crypto, Futures, and Commodities.
Supports multiple timeframes, making it suitable for scalping, swing trading, and position trading.
________________________________________
Why Is This Indicator Valuable?
Unlike traditional indicators that only plot support/resistance or trend-based signals, MomentumQ MS/OB provides a complete institutional-grade trading system:
Advanced Order Block Detection – Not just generic support and resistance, but real institutional footprints.
Smart Market Structure Recognition – Tracks trend shifts before they happen.
Adjustable Lookback Feature – Generates more order blocks on lower timeframes for precise intraday trading.
Dynamic Support and Resistance Zones – Adapts in real-time, ensuring accurate trade setups.
Customizable and Professional-Grade – Suitable for traders looking for high-probability setups.
________________________________________
Example Trading Strategies
1. Order Block & Break of Structure (BoS) Confirmation
Wait for price to break structure near an institutional order block.
Enter on the first retest of the order block for a high-probability trade setup.
Set stop-loss behind the order block and target the next key level.
2. Using Dynamic Support & Resistance for Reversal Trades
If price reaches a dynamic resistance level, wait for bearish confirmation such as a rejection wick or engulfing candle.
Enter short with stop-loss above resistance and target the next dynamic support level.
Works for long trades at dynamic support levels as well.
________________________________________
Disclaimer
This indicator does not guarantee profits and should be used as part of a complete trading strategy. Past performance is not indicative of future results.

Market Structure DashboardThis indicator displays a **multi-timeframe dashboard** that helps traders track market structure across several horizons: Monthly, Weekly, Daily, H4, H1, M15, and M5.
It identifies the current trend (Bullish, Bearish, or Neutral) based on the progression of **swing highs and lows** (HH/HL, LH/LL).
For each timeframe, the dashboard shows:
* The **current structure** (Bullish, Bearish, Neutral) with a clear color code (green, red, gray).
* **Pivot information**:
* either the latest swing high/low values,
* or the exact date and time of their occurrence (user-selectable in the settings).
An integrated **alert system** notifies you whenever the market structure changes (e.g., "Daily: Neutral → Bullish").
### Key Features:
* Clear overview of multi-timeframe market structures.
* Customizable pivot info display (values or timestamps).
* Built-in alerts on trend changes.
* Compact and readable dashboard, displayed in the top-right corner of the chart.
This tool is ideal for traders who want to quickly assess the **overall market structure** across multiple timeframes and be instantly alerted to potential reversals.

Double Top/Bottom Screener - Today Only V4//@version=6
indicator("Double Top/Bottom Screener - Today Only", overlay=true, max_lines_count=500)
// Inputs
leftBars = input.int(5, "Left Bars")
rightBars = input.int(5, "Right Bars")
tolerance = input.float(0.02, "Max Difference (e.g., 0.02 for 2 cents)", step=0.01)
atrLength = input.int(14, "ATR Length for Normalized Distance", minval=1)
requiredPeaks = input.int(3, "Required Identical Peaks", minval=2, maxval=5)
// Declarations of persistent variables and arrays
var array resistanceLevels = array.new(0)
var array resistanceCounts = array.new(0)
var array supportLevels = array.new(0)
var array supportCounts = array.new(0)
var array resLines = array.new(0)
var array supLines = array.new(0)
var bool hasDoubleTop = false
var bool hasDoubleBottom = false
var float doubleTopLevel = na
var float doubleBottomLevel = na
var int todayStart = na
var float nearestDoubleLevel = na // Explicitly declared as na by default
// Step 1: Identify Swing Highs/Lows
swingHigh = ta.pivothigh(high, leftBars, rightBars)
swingLow = ta.pivotlow(low, leftBars, rightBars)
// Today's premarket start (04:00 AM ET)
todayStart := timestamp(syminfo.timezone, year, month, dayofmonth, 4, 0, 0)
// Clear arrays and delete lines on the first bar or new day
if barstate.isfirst or (dayofmonth != dayofmonth and time >= todayStart)
// Delete all existing lines only if arrays are not empty
if array.size(resLines) > 0
for i = array.size(resLines) - 1 to 0
line.delete(array.get(resLines, i))
if array.size(supLines) > 0
for i = array.size(supLines) - 1 to 0
line.delete(array.get(supLines, i))
// Clear arrays
array.clear(resistanceLevels)
array.clear(supportLevels)
array.clear(resistanceCounts)
array.clear(supportCounts)
array.clear(resLines)
array.clear(supLines)
// Reset flags and levels
hasDoubleTop := false
hasDoubleBottom := false
doubleTopLevel := na
doubleBottomLevel := na
nearestDoubleLevel := na // Ensure reset on new day
// Add new swings only if today and after premarket
if not na(swingHigh) and time >= todayStart and dayofmonth == dayofmonth
bool isEqualHigh = false
int peakIndex = -1
float prevLevel = na
if array.size(resistanceLevels) > 0
for i = 0 to array.size(resistanceLevels) - 1
prevLevel := array.get(resistanceLevels, i)
if math.abs(swingHigh - prevLevel) <= tolerance
isEqualHigh := true
peakIndex := i
break
if isEqualHigh and peakIndex >= 0
array.set(resistanceCounts, peakIndex, array.get(resistanceCounts, peakIndex) + 1)
if array.get(resistanceCounts, peakIndex) == requiredPeaks
hasDoubleTop := true
doubleTopLevel := prevLevel
else
array.push(resistanceLevels, swingHigh)
array.push(resistanceCounts, 1)
line newResLine = line.new(bar_index - rightBars, swingHigh, bar_index, swingHigh, color=color.red, width=2, extend=extend.none)
array.push(resLines, newResLine)
if not na(swingLow) and time >= todayStart and dayofmonth == dayofmonth
bool isEqualLow = false
int peakIndex = -1
float prevLevel = na
if array.size(supportLevels) > 0
for i = 0 to array.size(supportLevels) - 1
prevLevel := array.get(supportLevels, i)
if math.abs(swingLow - prevLevel) <= tolerance
isEqualLow := true
peakIndex := i
break
if isEqualLow and peakIndex >= 0
array.set(supportCounts, peakIndex, array.get(supportCounts, peakIndex) + 1)
if array.get(supportCounts, peakIndex) == requiredPeaks
hasDoubleBottom := true
doubleBottomLevel := prevLevel
else
array.push(supportLevels, swingLow)
array.push(supportCounts, 1)
line newSupLine = line.new(bar_index - rightBars, swingLow, bar_index, swingLow, color=color.green, width=2, extend=extend.none)
array.push(supLines, newSupLine)
// Monitor and remove broken levels/lines; reset pattern if the equal level breaks
if array.size(resistanceLevels) > 0
for i = array.size(resistanceLevels) - 1 to 0
float level = array.get(resistanceLevels, i)
if close > level
line.delete(array.get(resLines, i))
array.remove(resLines, i)
array.remove(resistanceLevels, i)
array.remove(resistanceCounts, i)
if level == doubleTopLevel
hasDoubleTop := false
doubleTopLevel := na
nearestDoubleLevel := na // Reset if level breaks
if array.size(supportLevels) > 0
for i = array.size(supportLevels) - 1 to 0
float level = array.get(supportLevels, i)
if close < level
line.delete(array.get(supLines, i))
array.remove(supLines, i)
array.remove(supportLevels, i)
array.remove(supportCounts, i)
if level == doubleBottomLevel
hasDoubleBottom := false
doubleBottomLevel := na
nearestDoubleLevel := na // Reset if level breaks
// Limit arrays (after removals)
if array.size(resistanceLevels) > 10
line oldLine = array.shift(resLines)
line.delete(oldLine)
array.shift(resistanceLevels)
array.shift(resistanceCounts)
if array.size(supportLevels) > 10
line oldLine = array.shift(supLines)
line.delete(oldLine)
array.shift(supportLevels)
array.shift(supportCounts)
// Pattern Signal: 1 only if the exact required number of peaks is met
patternSignal = (hasDoubleTop or hasDoubleBottom) ? 1 : 0
// New: Nearest Double Level Price - Only update if pattern is active today and on current day
if time >= todayStart and dayofmonth == dayofmonth // Restrict to today
if patternSignal == 1 // Only set if pattern is active
if hasDoubleTop and not na(doubleTopLevel)
nearestDoubleLevel := doubleTopLevel
if hasDoubleBottom and not na(doubleBottomLevel)
nearestDoubleLevel := na(nearestDoubleLevel) ? doubleBottomLevel : (math.abs(close - doubleBottomLevel) < math.abs(close - nearestDoubleLevel) ? doubleBottomLevel : nearestDoubleLevel)
else
nearestDoubleLevel := na // Reset to na if no pattern today
else
nearestDoubleLevel := na // Reset for all historical bars
// New: Distance to Nearest Level (using ATR for normalization)
var float atr = ta.atr(atrLength)
var float distanceNormalizedATR = na
if not na(nearestDoubleLevel) and not na(atr) and atr > 0
distanceNormalizedATR := math.abs(close - nearestDoubleLevel) / atr
// Outputs
plot(patternSignal, title="Pattern Signal", color=patternSignal == 1 ? color.purple : na, style=plot.style_circles)
plot(nearestDoubleLevel, title="Nearest Double Level Price", color=color.orange)
plot(distanceNormalizedATR, title="Normalized Distance (ATR)", color=color.green)
bgcolor(patternSignal == 1 ? color.new(color.purple, 80) : na)
if patternSignal == 1 and barstate.isconfirmed
alert("Double Pattern detected on " + syminfo.ticker + " at " + str.tostring(close), alert.freq_once_per_bar_close)
if barstate.islast
var table infoTable = table.new(position.top_right, 1, 3, bgcolor=color.new(color.black, 50))
table.cell(infoTable, 0, 0, "Pattern: " + str.tostring(patternSignal), bgcolor=patternSignal == 1 ? color.purple : color.gray)
table.cell(infoTable, 0, 1, "Level: " + str.tostring(nearestDoubleLevel, "#.##"), bgcolor=color.orange)
table.cell(infoTable, 0, 2, "ATR Dist: " + str.tostring(distanceNormalizedATR, "#.##"), bgcolor=color.green)

Double Top/Bottom Screener - Today Only v3 //@version=6
indicator("Double Top/Bottom Screener - Today Only", overlay=true, max_lines_count=500)
// Inputs
leftBars = input.int(5, "Left Bars")
rightBars = input.int(5, "Right Bars")
tolerance = input.float(0.02, "Max Difference (e.g., 0.02 for 2 cents)", step=0.01)
atrLength = input.int(14, "ATR Length for Normalized Distance", minval=1)
requiredPeaks = input.int(3, "Required Identical Peaks", minval=2, maxval=5)
// Declarations of persistent variables and arrays
var array resistanceLevels = array.new(0)
var array resistanceCounts = array.new(0)
var array supportLevels = array.new(0)
var array supportCounts = array.new(0)
var array resLines = array.new(0)
var array supLines = array.new(0)
var bool hasDoubleTop = false
var bool hasDoubleBottom = false
var float doubleTopLevel = na
var float doubleBottomLevel = na
var int todayStart = na
var float nearestDoubleLevel = na // Explicitly declared as na by default
// Step 1: Identify Swing Highs/Lows
swingHigh = ta.pivothigh(high, leftBars, rightBars)
swingLow = ta.pivotlow(low, leftBars, rightBars)
// Today's premarket start (04:00 AM ET)
todayStart := timestamp(syminfo.timezone, year, month, dayofmonth, 4, 0, 0)
// Clear arrays and delete lines on the first bar or new day
if barstate.isfirst or (dayofmonth != dayofmonth and time >= todayStart)
// Delete all existing lines only if arrays are not empty
if array.size(resLines) > 0
for i = array.size(resLines) - 1 to 0
line.delete(array.get(resLines, i))
if array.size(supLines) > 0
for i = array.size(supLines) - 1 to 0
line.delete(array.get(supLines, i))
// Clear arrays
array.clear(resistanceLevels)
array.clear(supportLevels)
array.clear(resistanceCounts)
array.clear(supportCounts)
array.clear(resLines)
array.clear(supLines)
// Reset flags and levels
hasDoubleTop := false
hasDoubleBottom := false
doubleTopLevel := na
doubleBottomLevel := na
nearestDoubleLevel := na // Ensure reset on new day
// Add new swings only if today and after premarket
if not na(swingHigh) and time >= todayStart and dayofmonth == dayofmonth
bool isEqualHigh = false
int peakIndex = -1
float prevLevel = na
if array.size(resistanceLevels) > 0
for i = 0 to array.size(resistanceLevels) - 1
prevLevel := array.get(resistanceLevels, i)
if math.abs(swingHigh - prevLevel) <= tolerance
isEqualHigh := true
peakIndex := i
break
if isEqualHigh and peakIndex >= 0
array.set(resistanceCounts, peakIndex, array.get(resistanceCounts, peakIndex) + 1)
if array.get(resistanceCounts, peakIndex) == requiredPeaks
hasDoubleTop := true
doubleTopLevel := prevLevel
else
array.push(resistanceLevels, swingHigh)
array.push(resistanceCounts, 1)
line newResLine = line.new(bar_index - rightBars, swingHigh, bar_index, swingHigh, color=color.red, width=2, extend=extend.none)
array.push(resLines, newResLine)
if not na(swingLow) and time >= todayStart and dayofmonth == dayofmonth
bool isEqualLow = false
int peakIndex = -1
float prevLevel = na
if array.size(supportLevels) > 0
for i = 0 to array.size(supportLevels) - 1
prevLevel := array.get(supportLevels, i)
if math.abs(swingLow - prevLevel) <= tolerance
isEqualLow := true
peakIndex := i
break
if isEqualLow and peakIndex >= 0
array.set(supportCounts, peakIndex, array.get(supportCounts, peakIndex) + 1)
if array.get(supportCounts, peakIndex) == requiredPeaks
hasDoubleBottom := true
doubleBottomLevel := prevLevel
else
array.push(supportLevels, swingLow)
array.push(supportCounts, 1)
line newSupLine = line.new(bar_index - rightBars, swingLow, bar_index, swingLow, color=color.green, width=2, extend=extend.none)
array.push(supLines, newSupLine)
// Monitor and remove broken levels/lines; reset pattern if the equal level breaks
if array.size(resistanceLevels) > 0
for i = array.size(resistanceLevels) - 1 to 0
float level = array.get(resistanceLevels, i)
if close > level
line.delete(array.get(resLines, i))
array.remove(resLines, i)
array.remove(resistanceLevels, i)
array.remove(resistanceCounts, i)
if level == doubleTopLevel
hasDoubleTop := false
doubleTopLevel := na
nearestDoubleLevel := na // Reset if level breaks
if array.size(supportLevels) > 0
for i = array.size(supportLevels) - 1 to 0
float level = array.get(supportLevels, i)
if close < level
line.delete(array.get(supLines, i))
array.remove(supLines, i)
array.remove(supportLevels, i)
array.remove(supportCounts, i)
if level == doubleBottomLevel
hasDoubleBottom := false
doubleBottomLevel := na
nearestDoubleLevel := na // Reset if level breaks
// Limit arrays (after removals)
if array.size(resistanceLevels) > 10
line oldLine = array.shift(resLines)
line.delete(oldLine)
array.shift(resistanceLevels)
array.shift(resistanceCounts)
if array.size(supportLevels) > 10
line oldLine = array.shift(supLines)
line.delete(oldLine)
array.shift(supportLevels)
array.shift(supportCounts)
// Pattern Signal: 1 only if the exact required number of peaks is met
patternSignal = (hasDoubleTop or hasDoubleBottom) ? 1 : 0
// New: Nearest Double Level Price - Only update if pattern is active today
if time >= todayStart and dayofmonth == dayofmonth // Restrict to today
if (hasDoubleTop and not na(doubleTopLevel)) or (hasDoubleBottom and not na(doubleBottomLevel))
if hasDoubleTop and not na(doubleTopLevel)
nearestDoubleLevel := doubleTopLevel
if hasDoubleBottom and not na(doubleBottomLevel)
nearestDoubleLevel := na(nearestDoubleLevel) ? doubleBottomLevel : (math.abs(close - doubleBottomLevel) < math.abs(close - nearestDoubleLevel) ? doubleBottomLevel : nearestDoubleLevel)
else
nearestDoubleLevel := na // Reset to na if no pattern today
else
nearestDoubleLevel := na // Reset for historical bars
// New: Distance to Nearest Level (using ATR for normalization)
var float atr = ta.atr(atrLength)
var float distanceNormalizedATR = na
if not na(nearestDoubleLevel) and not na(atr) and atr > 0
distanceNormalizedATR := math.abs(close - nearestDoubleLevel) / atr
// Outputs
plot(patternSignal, title="Pattern Signal", color=patternSignal == 1 ? color.purple : na, style=plot.style_circles)
plot(nearestDoubleLevel, title="Nearest Double Level Price", color=color.orange)
plot(distanceNormalizedATR, title="Normalized Distance (ATR)", color=color.green)
bgcolor(patternSignal == 1 ? color.new(color.purple, 80) : na)
if patternSignal == 1 and barstate.isconfirmed
alert("Double Pattern detected on " + syminfo.ticker + " at " + str.tostring(close), alert.freq_once_per_bar_close)
if barstate.islast
var table infoTable = table.new(position.top_right, 1, 3, bgcolor=color.new(color.black, 50))
table.cell(infoTable, 0, 0, "Pattern: " + str.tostring(patternSignal), bgcolor=patternSignal == 1 ? color.purple : color.gray)
table.cell(infoTable, 0, 1, "Level: " + str.tostring(nearestDoubleLevel, "#.##"), bgcolor=color.orange)
table.cell(infoTable, 0, 2, "ATR Dist: " + str.tostring(distanceNormalizedATR, "#.##"), bgcolor=color.green)

Pullback & ATR Trailing Strategy※日本語は英文の次に記載あります。
Overview
This indicator combines short-term RSI pullback/rebound signals with long-term RSI divergence to visualize potential buy and sell opportunities.
It also plots ATR-based trailing stops and partial take-profit lines, making it suitable for day trading and short-term trading.
Alerts are triggered when signal conditions are met.
Key Features
Detect short-term RSI pullbacks/rebounds (default 6 periods)
Detect divergences on long-term RSI
Visualize buy/sell signals with labels
Display ATR-based trailing stop and partial take-profit lines
Trigger alerts when conditions are met
Settings Explanation
Short-term RSI Length (rsiShortLen) Period for short-term RSI used to detect pullbacks or rebounds
Pullback Threshold (levelLow) RSI level below which a buy signal is considered
Rebound Threshold (levelHigh) RSI level above which a sell signal is considered
Long-term Timeframe (longTF) Timeframe used for divergence detection
Long-term RSI Length (longRSILen) Period for RSI on the long-term timeframe, used for divergence detection
Pivot Width Left / Right (pivotLeft / pivotRight)
Determines how we detect swing highs/lows (peaks and valleys).
For example, with pivotLeft=3 and pivotRight=3, a bar is considered a swing high if it is higher than the 3 bars to its left and 3 bars to its right.
Larger numbers detect only bigger swings, smaller numbers also detect smaller swings.
ATR Length (atrLen) Period for ATR calculation for trailing stops
ATR Multiplier (atrMult) Multiplier for ATR to calculate trailing stop distance
Partial Take-Profit Multiplier (tpMult) Multiplier to calculate half-profit level based on swing amplitude
Green line (Long Trail / translucent green)
ATR-based trailing stop line for long positions.
Used as a stop-loss or trailing stop for open buy trades.
Dark green line shows partial take-profit (TP), translucent green shows trailing stop level.
Red line (Short Trail / translucent red)
ATR-based trailing stop line for short positions.
Used as a stop-loss or trailing stop for open sell trades.
Dark red line shows partial take-profit (TP), translucent red shows trailing stop level.
Note: TP lines indicate partial take-profit targets, while ATR trailing lines indicate stop-loss/trailing stop levels if the price moves against the position.
日本語説明ーーーーーーーーーーーーーーーーーーーーーーーーーーーー
概要
このインジケーターは、短期RSIの押し目/戻りシグナルと、長期足RSIによるダイバージェンスを組み合わせて、買い・売りのチャンスを可視化します。
さらに、ATRベースのトレールストップラインや半分利確ラインも表示し、デイトレードや短期トレードに最適化しています。
シグナル条件に一致した場合にアラートも作動します。
主な機能
短期RSI(デフォルト6期間)で押し目・戻りを検出
長期足RSIでのダイバージェンスを検出
BUY/SELLラベルでシグナルを視覚化
ATRベースのトレールライン・半分利確ラインを表示
条件一致時にアラート発動
各設定の説明
短期RSI期間 (rsiShortLen) デイトレ用の短期RSIの期間。押し目や戻りのシグナルに使用
押し目閾値 (levelLow) RSIが下回ったら買いシグナル判定に使用
戻り閾値 (levelHigh) RSIが上回ったら売りシグナル判定に使用
長期足 (longTF) ダイバージェンス判定用の長期足の時間軸
長期RSI期間 (longRSILen) 長期足で計算するRSIの期間。ダイバージェンス判定に使用
左右ピボット幅 (pivotLeft / pivotRight) 高値や安値を「スイングの山・谷」として判定する時に使う幅です。
例えば pivotLeft=3, pivotRight=3 の場合、「左に3本、右に3本のローソク足より高い/低い点」をスイングの頂点や底と見なします。
数値を大きくすると大きな波だけを拾い、小さくすると小さな波も拾いやすくなります。
ATR期間 (atrLen) トレールライン計算用ATRの期間
ATR倍率 (atrMult) トレールラインの距離をATRに掛ける倍率
半分利確倍率 (tpMult) 押し目/戻り幅に対して半分利確ラインを設定する倍率
緑の線(Long Trail / 半透明緑)
ATRベースのトレールストップラインです。
買いポジション中の損切り目安やトレーリングストップとして使います。
緑の濃い線は半分利確ライン(TP)、薄い緑の線はトレールストップの位置を示します。
赤い線(Short Trail / 半透明赤)
ATRベースのトレールストップラインです。
売りポジション中の損切り目安やトレーリングストップとして使います。
赤の濃い線は半分利確ライン(TP)、薄い赤の線はトレールストップの位置を示します。
補足:TP(Take Profit)線は半分利確の目安で、ATRトレールラインはポジションが逆行した時の損切り目安です。

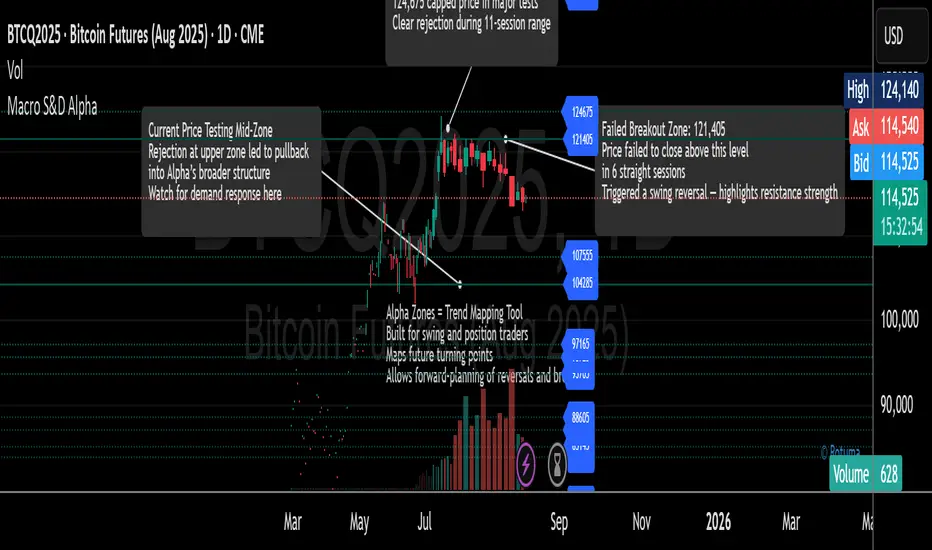
Macro S&D AlphaMacro S&D Suite: Part 1 — Alpha Zones (Macro Structure S&D)
Title: Macro S&D Suite: Part 1 — Alpha Zones (Macro Structure S&D)
Description:
Overview
Macro S&D Alpha is the foundational component of our system, designed to identify institutional-level supply and demand zones across Weekly, Daily, and 4H timeframes. It captures the structural blueprint of the market by filtering out weak swings and highlighting zones that historically attract major liquidity.
How It Works
• Volatility-Weighted Swings: Detects key pivot points using swing duration, price rejection intensity, and volatility scores
• Auto-Zone Drawing: Plots supply (resistance) and demand (support) zones from validated macro pivots
• Dynamic Updates: Zones extend and adjust only when the structure confirms a significant change
• Noise Reduction: Filters minor or untested pivots to highlight meaningful levels with proven historical relevance
Use Case
Add Alpha to your higher-timeframe charts (Daily/4H) to define your structural market bias. These zones help identify potential reversals, trend continuations, and breakout regions. Alpha serves as the macro map for directional decision-making.
How It Integrates with Beta
Alpha defines where the market is most likely to respond — at key macro structural zones.
Beta sharpens the focus with precise entry and exit zones on lower timeframes.
When the two align — for example, a Micro 1 or 5 rejection within an Alpha zone — this often marks a high-probability reversal, breakout, or pullback setup with reduced risk and increased conviction.
What Makes It Unique
Alpha is not a standard support/resistance or swing high/low script. It uses a proprietary multi-factor scoring model to determine which historical pivots carry institutional weight. This allows traders to focus only on the most reliable structural zones over multi-week horizons.
Technical Note
This script is Part 1 of the Macro S&D Suite. Due to TradingView's line and object limits, the suite is divided into modular tools:
• Part 1 – Alpha: Macro structure zones (this script)
• Part 2 – Beta: Intraday tactical zones (published separately)
Educational Support & System Guide
This script is accompanied by a 25-page Trading Rules Guide, outlining how to apply our zone logic, entry/exit rules, and execution structure.
All approved users receive daily support and real-time guidance, applying the exact identical setups we use in live trading — across indices, FX, crypto, and commodities.
Compatibility Note
Alpha is primarily designed for structure-based price action trading, but it also works well in conjunction with external tools such as VWAP, volume profile, or basic trend overlays.
Traders can keep their workflow clean or layer additional confluence to suit their strategy.
Invite-Only Access
Access to this script is reserved for active members of our MacroStructure community.
If you're interested in exploring the system, we offer a 14-day no-obligation trial — no signup, no credit card, and no risk.
Send us your TradingView username via direct message, and we'll activate full access so you can test the tool in live market conditions.
We also provide a daily playbook and real-time guidance during the London and New York sessions to help you apply the system the same way we do in our trades.
If it fits your workflow and improves your consistency, you're welcome to continue with a monthly subscription after the trial.
P3 Weekly Goldbach levelsP3 Weekly Session Projections
Originality and Uniqueness:
Novel Time-Based Approach:
This indicator uniquely combines the previous weeks range analysis with mathematical Goldbach number sequences
Unlike standard Fibonacci retracements that use swing highs/lows, this script uses a specific weekly session window for consistent anchor points
The weekly reset mechanism ensures levels are always based on the most recent Sunday session, providing fresh, relevant levels
2. Mathematical Innovation:
First-of-its-kind application weekly Goldbach numbers (100, 97, 89, 83, 71, 59, 50, 47, 41, 29, 17, 11, 3, 0) as support/resistance levels
Dual-range projection system: Projects both standard deviations internally and overlays Goldbach levels for precise mathematical alignment
Auto-extending ranges when price breaks beyond 100/0 levels – automatically adds upper and lower GB ranges
3. Advanced Technical Features:
Dynamic label positioning with 4 different modes (Right Edge, Left of Line, Right of Line, Fixed Position)
Color-coded level hierarchy: Red (G:100), Green (G:0), Yellow (G:111/-111) for instant visual recognition
Session-based calculations using real market hours rather than arbitrary chart points
Clean weekly management – automatically removes previous levels and draws fresh ones each Sunday
Practical Usefulness:
1. Professional Trading Application:
Institutional session timing: plots when major institutions begin weekly positioning
Objective level placement: Eliminates subjective swing high/low selection - uses concrete session data
Multi-market applicability: Works on forex, indices, commodities, and crypto that trade during this session
2. Risk Management Benefits:
Predefined support/resistance zones based on mathematical progression rather than subjective analysis
Extension levels provide targets when price moves beyond normal ranges
Weekly refresh ensures levels remain relevant to current market structure
3. Unique Market Insights:
Goldbach number spacing provides mathematically-derived levels that often align with natural market movements
Session-based anchoring captures institutional weekly bias and positioning
Visual clarity with customizable labels and positioning for different trading styles
How It Differs from Existing Scripts:
Not a standard Fibonacci tool - uses specific mathematical sequence with weekly session anchoring
Not a generic pivot indicator - focuses on Sunday institutional session range
Not a simple support/resistance script - combines time-based analysis with mathematical projections
Not a rehash of existing indicators - genuinely novel approach combining session analysis with Goldbach mathematics
Target Audience:
Institutional traders using weekly analysis
Mathematical traders interested in number theory applications
Session-based analysts focusing on specific market opening periods
Risk management specialists needing objective level placement
This script represents genuine innovation in combining specific market session analysis with mathematical number theory, providing traders with a unique tool that doesn't exist elsewhere in the TradingView library.
Ayman Entry Signal – Ultimate PRO (Scalping Gold Settings)1. Overview
This indicator is a professional gold scalping tool built for TradingView using Pine Script v6.
It combines multiple price action and technical filters to generate high-probability Buy/Sell signals with built-in trade management features (TP1, TP2, SL, Break Even, Partial Close, Stats tracking).
It is optimized for XAUUSD but can be applied to other assets with proper setting adjustments.
2. Key Features
Multi-Condition Trade Signals – EMA trend, Break of Structure, Order Blocks, FVG, Liquidity Sweeps, Pin Bars, Higher Timeframe confirmation, Trend Cloud, SMA Cross, and ADX.
Full Trade Management – Auto-calculates lot size, SL, TP1, TP2, Break Even, Partial Close.
Dynamic Chart Drawing – Entry lines, SL/TP lines, trade boxes, and real-time PnL.
Statistics Panel – Tracks wins, losses, breakeven trades, and total PnL over selected dates.
Customizable Filters – All filters can be turned ON/OFF to match your strategy.
3. Main Inputs & Settings
Account Settings
Capital ($) – Total trading capital.
Risk Percentage (%) – Risk per trade.
TP to SL Ratio – Risk-to-reward ratio.
Value Per Point ($) – Value per pip/point for lot size calculation.
SL Buffer – Extra points added to SL to avoid stop hunts.
Take Profit Settings
TP1 % of Full Target – Fraction of TP1 compared to TP2.
Move SL to Entry after TP1? – Activates Break Even after TP1.
Break Even Buffer – Extra points when moving SL to BE.
Take Partial Close at TP1 – Option to close half at TP1.
Signal Filters
ATR Period – For SL/TP calculation buffer.
EMA Trend – Uses EMA 9/21 crossover for trend.
Break of Structure (BoS) – Requires structure break confirmation.
Order Block (OB) – Validates trades within OB zones.
Fair Value Gap (FVG) – Confirms trades inside FVGs.
Liquidity Sweep – Checks if liquidity zones are swept.
Pin Bar Confirmation – Uses candlestick patterns for extra confirmation.
Pin Bar Body Ratio – Controls strictness of Pin Bar filter.
Higher Timeframe Filters (HTF)
HTF EMA Confirmation – Confirms lower timeframe trades with higher timeframe trend.
HTF BoS – Confirms with higher timeframe structure break.
HTF Timeframe – Selects higher timeframe.
Advanced Filters
SuperTrend Filter – Confirms trades based on SuperTrend.
ADX Filter – Filters out low volatility periods.
SMA Cross Filter – Uses SMA 8/9 cross as filter.
Trend Cloud Filter – Uses EMA 50/200 as a cloud trend filter.
4. How It Works
Buy Signal Conditions
EMA 9 > EMA 21 (trend bullish)
Optional filters (BoS, OB, FVG, Liquidity Sweep, Pin Bar, HTF confirmations, ADX, SMA Cross, Trend Cloud) must pass if enabled.
When all active filters pass → Buy signal triggers.
Sell Signal Conditions
EMA 9 < EMA 21 (trend bearish)
Same filtering process but for bearish conditions.
When all active filters pass → Sell signal triggers.
5. Trade Execution & Management
When a signal triggers:
Lot size is auto-calculated based on risk % and SL distance.
SL is placed beyond recent swing high/low + ATR buffer.
TP1 and TP2 are calculated from the SL using the reward-to-risk ratio.
Break Even: If enabled, SL moves to entry price after TP1 is hit.
Partial Close: If enabled, half of the position closes at TP1.
Trade Exit: Full exit at TP2, SL hit, or partial close at TP1.
6. Chart Display
Entry Line – Shows entry price.
SL Line – Red dashed line at stop loss level.
TP1 Line – Lime dashed line for TP1.
TP2 Line – Green dashed line for TP2.
PnL Labels – Displays real-time profit/loss in $.
Trade Box – Visual area showing trade range.
Pin Bar Shapes – Optional, marks Pin Bars.
7. Statistics Panel
Stats Header – Shows “Stats”.
Total Trades
Wins
Losses
Breakeven Trades
Total PnL
Can be reset or filtered by date.
8. How to Use
Load the Indicator in TradingView.
Select Gold (XAUUSD) on your preferred scalping timeframe (1m, 5m, 15m).
Adjust settings:
Use default gold scalping settings for quick start.
Enable/disable filters according to your style.
Wait for a Buy/Sell alert.
Confirm visually that all desired conditions align.
Place trade with calculated lot size, SL, and TP levels shown on chart.
Let trade run – the indicator manages Break Even & Partial Close if enabled.
9. Recommended Timeframes
Scalping: 1m, 5m, 15m
Day Trading: 15m, 30m, 1H
Swing: 4H, Daily (adjust settings accordingly)
