CandelaCharts - Swing Failure Pattern (SFP)# SWING FAILURE PATTERN
📝 Overview
The Swing Failure Pattern (SFP) indicator is designed to identify and highlight Swing Failure Patterns on a user’s chart. This pattern typically emerges when significant market participants generate liquidity by driving price action to key levels. An SFP occurs when the price temporarily breaks above a resistance level or below a support level, only to quickly reverse and return within the previous range. These movements are often associated with stop-loss hunting or liquidity grabs, providing traders with potential opportunities to anticipate reversals or key market turning points.
A Bullish SFP occurs when the price dips below a key support level, triggering stop-loss orders, but then swiftly reverses upward, signaling a potential upward trend or reversal.
A Bearish SFP happens when the price spikes above a key resistance level, triggering stop-losses of short positions, but then quickly reverses downward, indicating a potential bearish trend or reversal.
The indicator is a powerful tool for traders, helping to identify liquidity grabs and potential reversal points in real-time. Marking bullish and bearish Swing Failure Patterns on the chart, it provides clear visual cues for spotting market traps set by major players, enabling more informed trading decisions and improved risk management.
📦 Features
Bullish/Bearish SFPs
Styling
⚙️ Settings
Length: Determines the detection length of each SFP
Bullish SFP: Displays the bullish SFPs
Bearish SFP: Displays the bearish SFPs
Label: Controls the size of the label
⚡️ Showcase
Bullish
Bearish
Both
📒 Usage
The best approach is to combine a few complementary indicators to gain a clearer market perspective. This doesn’t mean relying on the Golden Cross, RSI divergences, SFPs, and funding rates simultaneously, but rather focusing on one or two that align well in a given scenario.
The example above demonstrates the confluence of a Bearish Swing Failure Pattern (SFP) with an RSI divergence. This combination strengthens the signal, as the Bearish SFP indicates a potential reversal after a liquidity grab, while the RSI divergence confirms weakening momentum at the key level. Together, these indicators provide a more robust setup for identifying potential market reversals with greater confidence.
🚨 Alerts
This script provides alert options for all signals.
Bearish Signal
A bearish signal is triggered when a Bearish SFP is formed.
Bullish Signal
A bullish signal is triggered when a Bullish SFP is formed.
⚠️ Disclaimer
Trading involves significant risk, and many participants may incur losses. The content on this site is not intended as financial advice and should not be interpreted as such. Decisions to buy, sell, hold, or trade securities, commodities, or other financial instruments carry inherent risks and are best made with guidance from qualified financial professionals. Past performance is not indicative of future results.
Wyszukaj w skryptach "stop loss"

4Vietnamese 3x SupertrendThis strategy attempts to capture long positions in the Vietnamese stock market using a combination of three Supertrend indicators and additional filters. It utilizes pyramiding to enter up to three long positions with a 33.33% allocation each.
Key Elements:
Supertrend Indicators: Three Supertrend indicators are used with different lengths and multipliers to identify potential trend changes.
Entry Conditions:
The strategy looks for a downtrend on the slowest Supertrend (Supertrend3) followed by uptrends on the medium (Supertrend2) and fast (Supertrend1) Supertrends.
Alternatively, if Supertrend3 is still downtrending, but Supertrend1 is downtrending and a significant previous high (highestGreen) exists, an entry signal is generated.
An optional filter allows using the highest of the last two red candles for highestGreen calculation.
Entry Stop Loss:
An optional stop loss can be set based on the entry price of previous long positions, preventing further losses if the price falls below entry prices.
Exit Conditions:
Three exit options are available:
- All Downtrend Exit: Close all positions if all Supertrends turn uptrend and a bearish candlestick pattern (close price lower than open price) is formed.
- Average Price in Loss Exit: Close all positions if the average entry price of open positions is higher than the current closing price (indicating a loss).
- All Positions in Loss Exit: Close all positions if any of the following conditions are met:
A single open position exists, and its entry price is higher than the current close price.
Two open positions exist, and their entry prices are both higher than the current close price.
Three open positions exist, and their entry prices are all higher than the current close price.
Pyramiding: The strategy allows entering up to three long positions with a fixed allocation of 33.33% each.
Customization Options:
The strategy provides various input parameters to customize its behavior:
Supertrend lengths and multipliers for each indicator.
Option to use the highest of the last two red candles for highestGreen calculation.
Enabling/disabling Entry Stop Loss and different exit conditions.
Further Enhancements:
Explore additional entry and exit filters to refine trade signals.
Consider incorporating risk management techniques like position sizing and trailing stops.
Backtest the strategy with historical data to evaluate its effectiveness and identify potential areas for improvement.

DCA Alpha 1.0 Trading Tool for Dollar-Cost Averaging
Description:
DCA Alpha 1.0 is a precision-engineered trading tool designed to assist traders and investors in accumulating assets during market downturns. Using proprietary algorithms that combine momentum decay, extreme price deviation metrics, trend dynamics, divergence analysis, and mean regression, it identifies potential bottom extreme zones in various asset classes such as indices, stocks, crypto, and commodities.
This indicator highlights market conditions where assets are oversold, undervalued, or experiencing capitulation—providing disciplined, unleveraged dollar-cost averaging (DCA) opportunities. Ideal for long-term growth strategies, DCA Alpha 1.0 helps cut through market noise, pinpointing moments of peak fear and maximum reward potential.
Whether navigating volatile crypto markets, timing corrections in indices, or accumulating commodities, DCA Alpha 1.0 serves as a vital tool for mastering the art of buying low and building your assets up strategically.
Instructions:
Getting Started:
Add the Indicator:
Install DCA Alpha 1.0 on your TradingView chart.
Select your preferred asset class: stocks, indices, crypto, or commodities.
Choose an appropriate timeframe (e.g., daily or weekly for long-term DCA strategies).
Customize Inputs: Adjust the following settings to align with your strategy:
Percentage of Equity to Trade: Define the portion of your portfolio to allocate per signal (default: 1% equity).
Profit Target Percentages: Set thresholds for locking in gains (default: 50% on lower timeframes, 500% on higher timeframes).
Zones and Signals:
Extreme Negative Zones:
What It Represents:
These zones highlight conditions where prices are deeply oversold, indicating extreme bearish sentiment. The market is likely nearing a bottom, offering high-probability buying opportunities.
Entry Signals:
When the price enters these extreme negative zones, visual markers (e.g., green triangles or other indicators) will signal a potential buying opportunity. These moments are indicative of market exhaustion, signaling that a reversal could be imminent.
Momentum Decay & Divergence:
Momentum decay occurs when price movement slows over time. In extreme negative zones, if prices continue to fall but at a diminishing rate (e.g., decreased volume or a fading oscillator), it suggests weakening bearish momentum. This, coupled with bullish divergence (oscillator forming higher lows while price makes lower lows), signifies a reversal, making it an ideal point to consider dollar-cost averaging into the asset.
Neutral Zones:
What It Represents:
The neutral zone is a state of market equilibrium, where prices are neither overbought nor oversold. The market is in a balanced state, with no strong trend emerging.
Mean Regression:
In a neutral zone, the market is reverting to its mean or average price after overreacting in either direction. A price transition from extreme zones (overbought/oversold) to the neutral zone suggests a reversion to the market's long-term average, making this a period of reduced volatility and uncertainty.
Entering or Exiting Neutral Zones:
Traders should avoid entering or exiting positions during neutral zone conditions unless transitioning from an extreme zone (negative or positive). Transitioning from an extreme negative zone to neutral may suggest an opportunity to accumulate assets gradually, while a shift from neutral to an extreme negative zone may indicate a deeper correction and warrant caution.
Momentum Decay & Divergence (Exiting Neutral Zone):
If prices are rising but the oscillator shows lower highs (bearish divergence), and momentum is fading, this could signal a pullback. A transition out of the neutral zone in this context may prompt traders to hold off on new positions or consider profit-taking.
Extreme Positive Zones:
What It Represents:
Markets can also become overbought or overvalued. When price enters extreme positive zones, the asset may be overvalued, suggesting potential selling or a waiting period.
Exit Signals:
Red triangle indicators signal potential exit points when prices reach overbought conditions, signaling a time to lock in profits and reduce exposure.
Momentum Decay & Divergence (Exiting Positive Zone):
When prices are making new highs but momentum is weakening (momentum decay) and the oscillator is showing lower highs (bearish divergence), this could indicate a faltering rally. Such conditions represent an ideal time to reduce exposure or exit positions.
Key Inputs for Customization:
Percentage of Equity to Trade:
This setting allows you to allocate a portion of your total portfolio per buy signal. By default, 1% of equity is used per signal, but this can be adjusted based on your risk tolerance and strategy.
Profit Target Percentages:
These thresholds help lock in gains once the price moves a set percentage in your favor.
Lower Timeframes: Default profit target of 50%.
Higher Timeframes: Default profit target of 500%.
These settings can be customized for specific risk/reward preferences.
Warning!!! : Aggressive Mode
Aggressive Mode is an advanced feature designed for traders who want to increase the frequency of signals during periods of market volatility. This mode will trigger more frequent entries, even into slightly less extreme zones, capturing short-term reversals.
What Aggressive Mode Does:
It amplifies signals by allowing the tool to identify more frequent price reversals, including brief market corrections, increasing trade frequency. While this can offer more trading opportunities, it also exposes you to higher risk.
Warning:
Aggressive Mode should be used only by experienced traders familiar with short-term volatility. The increased frequency of signals could lead to higher risk exposure. Ensure robust risk management practices, such as stop-loss orders and profit-taking strategies, are in place before activating this mode.
Default Setting:
Aggressive Mode is disabled by default. It can be activated at your discretion based on your experience level and risk appetite.
Best Practices:
Focus on High-Quality Assets: Prioritize assets with strong recovery potential (e.g., major indices, blue-chip cryptocurrencies).
Use Longer Timeframes: Minimize market noise and optimize your DCA strategy by focusing on higher timeframes (e.g., daily or weekly charts).
Review Trading Inputs: Regularly adjust your inputs to ensure they align with your financial goals and risk tolerance.
Implement Risk Management: Use stop-loss orders and profit targets to manage risk, especially when using Aggressive Mode.
Disclaimer:
DCA Alpha 1.0 is designed specifically for unleveraged, long-term dollar-cost averaging strategies. It is not intended for day trading or leveraged positions. The tool excels at identifying market dips but cannot guarantee success. Users are fully responsible for their own risk management, including the use of stop-losses, profit targets, and position sizing.
Aggressive Mode increases trade frequency and may lead to higher exposure and potential losses. Only experienced traders should consider using this mode. Always understand the risks involved before incorporating this tool into your trading strategy.

Ask-Weighted Averages This indicator provides two price-based reference lines derived from volume dynamics within each bar. Specifically, it calculates a volume-weighted average price using only the portion of trading volume that occurred on the "ask" side, implying more aggressive buying activity. The logic behind this approach is to highlight potential support and resistance levels where buyers have shown greater conviction.
Key Features:
Ask-Weighted Average Prices:
Instead of using the entire trade volume, the lines focus on "ask volume" (volume associated with trades occurring at or near the ask price). This helps to spotlight areas where buyers have been dominant, potentially revealing more meaningful price levels for future market behavior.
Conditional vs. Continuous Lines:
Conditional Line: This line is only plotted if the dollar volume (a rough measure of trade value) exceeds a specified threshold, ensuring that the highlighted level is backed by substantial trading activity.
Continuous Line: A second line is always displayed, providing a running ask-weighted average price reference for additional context, regardless of dollar volume.
Supports Identifying Key Price Zones:
By focusing on where more motivated buyers have been active, the indicator helps traders identify potential inflection points in price, such as areas where the market might find support on pullbacks or resistance during rallies.
Overall, this indicator serves as a specialized tool for traders interested in volume-driven price analysis. It aims to refine the understanding of where buyers are most engaged and how that might shape future price movements.
Risks Associated with Trading:
No indicator can guarantee profitable trades or accurately predict future price movements. Market conditions are inherently unpredictable, and reliance on any single tool or combination of tools carries the risk of financial loss. Traders should practice sound risk management, including the use of stop losses and position sizing, and should not trade with funds they cannot afford to lose. Ultimately, decisions should be guided by a thorough trading plan and possibly supplemented with other forms of market analysis or professional advice.
Risks and Important Considerations:
• Not a Standalone Tool:
• This indicator should not be used in isolation. It is essential to incorporate additional technical analysis tools, fundamental analysis, and market context when making trading decisions.
• Relying solely on this indicator may lead to incomplete assessments of market conditions.
• Market Volatility and False Signals:
• Financial markets can be highly volatile, and indicators based on historical data may not accurately predict future movements.
• The indicator may produce false signals due to sudden market changes, low liquidity, or atypical trading activity.
• Risk Management:
• Always employ robust risk management strategies, including setting stop-loss orders, diversifying your portfolio, and not over-leveraging positions.
• Understand that no indicator guarantees success, and losses are a natural part of trading.
• Emotional Discipline:
• Avoid making impulsive decisions based on indicator signals alone.
• Emotional trading can lead to significant financial losses; maintain discipline and adhere to a well-thought-out trading plan.
• Continuous Learning and Adaptation:
• Stay informed about market news, economic indicators, and global events that may impact trading conditions.
• Continuously evaluate and adjust your trading strategies as market dynamics evolve.
• Consultation with Professionals:
• Consider seeking advice from financial advisors or professional traders to understand better how this indicator can fit into your overall trading strategy.
• Professional guidance can provide personalized insights based on your financial goals and risk tolerance.
Disclaimer:
Trading financial instruments involves substantial risk and may not be suitable for all investors. Past performance is not indicative of future results. This indicator is provided for informational and educational purposes only and should not be considered investment advice. Always conduct your own research and consult with a licensed financial professional before making any trading decisions.
Note: The effectiveness of any technical indicator can vary based on market conditions and individual trading styles. It's crucial to test indicators thoroughly using historical data and possibly paper trading before applying them in live trading scenarios.

Lot Size & Risk Calculator (All Pairs)this indicator is designed to simplify and optimize risk management. It automatically calculates the ideal lot size based on your account balance, risk percentage, and defined entry and exit levels. Additionally, it includes visual tools to represent stop-loss (SL) and take-profit (TP) levels, helping you trade with precision and consistency.
WHAT IS THIS INDICATOR FOR?
This indicator is essential for traders who want to:
Maintain consistent risk in their trades.
Quickly calculate lot sizes for Forex, XAUUSD, BTCUSD, and US100.
Visualize key levels (Entry, SL, and TP) on the chart.
Monitor potential losses and gains in real time.
COMPATIBLE ASSETS
The Lot Size Calculator works with the following assets:
Forex: Standard currency pairs.
XAUUSD: Gold versus the US dollar.
BTCUSD: Bitcoin versus the US dollar.
US100: Nasdaq 100 index.
Calculations adjust automatically based on the selected asset.
TAKE-PROFIT (TP) LEVELS
The indicator allows you to define up to three take-profit levels:
TP1
TP2
TP3
.
Each level is configurable based on your exit strategy.
DASHBOARD
The dashboard is a visual tool that consolidates key information about your trade:
Account balance: Total amount available in your account.
Lot size: Calculated based on your risk and parameters.
Potential loss (SL): Amount you could lose if the price hits your stop-loss.
Potential gain (TP): Expected profit if the take-profit level is reached.
SETTINGS
The indicator offers multiple configurable options to adapt to your trading style:
Levels
Entry: Initial trade price.
Stop-Loss (SL): Maximum allowed loss level.
Take-Profit (TP): Up to three configurable levels.
Risk Management
Account balance ($): Enter your total available balance.
Risk percentage: Define how much you're willing to risk per trade
.
Visual Options
Visualization style: Choose between simple lines or visual fills.
Colors: Customize the colors of lines and labels.
Dashboard Settings
Statistics: Enable or disable key data display.
Size and position: Adjust the dashboard's size and location on the chart.
HOW TO CHANGE AN ENTRY?
Open the indicator settings in TradingView and entering the new data manually
Removing and re-adding the indicator to the chart

Dynamic RSI Mean Reversion StrategyDynamic RSI Mean Reversion Strategy
Overview:
This strategy uses an RSI with ATR-Adjusted OB/OS levels in order to enhance the quality of it's mean reversion trades. It also incorporates a form of trend filtering in an effort to minimize downside and maximize upside. The backtest has fewer trades, as it uses substantial filtering to enhance trade quality. As you can see, I didn't cherry pick the results, so the results aren't the most beautiful thing you'll see in your life. I did this to ensure nobody gets misled. If you need a higher frequency of trades, consider removing the trend filter or increasing the length of the EMAs used for trend detection.
Features:
Dynamic OB/OS Levels: Uses ATR to adjust overbought and oversold thresholds dynamically, making the RSI more responsive in varying volatility conditions. This approach enhances signal strength by expanding the RSI range in high volatility and tightening it in low volatility.
Mean Reversion Focus: Designed for mean reversion but incorporates a trend-following filter to reduce countertrend trades. When the RSI is high, it often indicates an uptrend, so a trend filter prevents shorting in these cases and the same goes for downtrends and longing.
Trend Filtering: A moving average cross trend filter checks for the trend direction, with the RSI signal line color-coded to reflect trend shifts. Entries occur when the RSI crosses above or below the dynamic thresholds and is not a countertrend trade.
Stop Losses: Stop losses are set based on ATR distance from the entry price, providing volatility-adjusted protection.
Note:
If you're using this strategy on assets with a higher price, remember to increase the initial capital in the strategy settings. Otherwise, the strategy won't generate any (or many) trades and you'll end up with some inaccurate results.
Recommended Use:
Test it on different assets and timeframes. I’ve found the best results with standard RSI inputs, a relatively slow ATR, and a slower MA cross for trend filtering. Thus, the defaults are set that way. If the trend metrics are too slow, you’ll filter out too many good trades while allowing crummy ones; if too fast, most trades may be filtered out. As always, this has a lot of configurability so experiment to find the balance that works for your trading style.

Price-Volume w Trendline - Strategy [presentTrading]█ Introduction and How it is Different
The Price-Volume with Trendline Strategy is an innovative strategy that combines volume profile analysis, price-based Z-scores, and dynamic trendline filtering to identify optimal entry and exit points in the market. What sets this strategy apart is the integration of volume concentration (Point of Control or PoC) with dynamic volatility thresholds. Additionally, this strategy introduces a multi-step take profit (TP) mechanism that adjusts based on predefined levels, allowing traders to exit trades progressively while capitalizing on market momentum.
BTCUSD 6hr LS Performance
█ Strategy, How it Works: Detailed Explanation
The combination of multiple indicators and methodologies serves to create a more robust and reliable trading system. Each element is carefully chosen for its complementary role in providing accurate signals while minimizing false entries and exits. Here’s why the different components were chosen and how they work together:
- PoC and Z-Scores: The volume profile identifies key price areas, while the Z-score measures deviations from the mean. Together, they highlight points where the market is likely to react. For example, when the Z-score indicates an oversold condition near a PoC support level, it increases the probability of a reversal, providing a clear entry signal.
- Trendlines and Z-Scores: Trendlines serve as a secondary filter to ensure that price deviations identified by Z-scores align with broader market trends. This ensures that trades are only entered when the price has both deviated from its average and broken through a significant trendline level, reducing the likelihood of false signals.
- Multi-Step TP and Risk Management: Finally, the multi-step take profit logic works in tandem with the entry signals generated by the PoC, Z-scores, and trendlines. As the price moves in favor of the trade, profits are gradually locked in, ensuring the trader captures gains while still leaving room for further upside.
🔶 Point of Control (PoC) and Volume Profile Analysis
The PoC identifies the price level with the highest volume concentration within a specified lookback period. This price level represents where the most trading activity has occurred, often acting as a strong support or resistance. By breaking down the range into several rows (bins), the strategy identifies how much volume was traded at each price level.
🔶 Z-Score Calculation
The Z-score is a statistical metric that measures how far the current price is from its mean, expressed in terms of standard deviations. This is calculated both for price deviation and PoC-based deviation.
🔶 Trendline Breakout Filtering
The trendline filtering is a crucial aspect that refines entry signals by confirming trend continuation or reversals. It calculates trendlines based on pivot highs and lows using the selected method (e.g., ATR or standard deviation).
🔶 Multi-Step Take Profit
The multi-step take profit mechanism allows the strategy to take partial profits at several predefined levels. For example, when the price reaches 3%, 8%, 14%, or 21% above (or below) the entry price, it exits portions of the position. This is a useful technique for locking in profits as the market moves favorably.
Local
█ Usage
The Price-Volume with Trendline Strategy can be applied to various asset classes, including stocks, cryptocurrencies, and commodities. It is particularly effective in volatile markets where price deviations and volume concentrations signal potential reversals or trend continuations. By adjusting the settings for volatility and the lookback period, this strategy can be tailored to both short-term intraday trades and longer-term swing trades.
█ Default Settings
The default settings in the strategy play a vital role in shaping its performance.
- POC_lookbackLength (144): This defines the number of bars used to calculate the PoC. A longer lookback captures more data, leading to a more stable PoC, but may result in delayed signals. A shorter lookback increases responsiveness but may introduce noise.
- priceDeviationLength (200): This determines the period for calculating the standard deviation of price. A higher length smooths out the volatility, reducing the likelihood of false signals. Shorter lengths make the strategy more sensitive to sudden price movements.
- TL_length (14): Controls the swing detection period for trendline calculation. A shorter length will generate more frequent trendline breakouts, while a longer length captures only significant moves.
- Stop Loss and Take Profit: The strategy offers both fixed and SuperTrend-based stop losses. SuperTrend is adaptive to volatility, while fixed stop losses provide simpler risk control. The multi-step take profit ensures that profits are secured progressively, which can improve performance in trending markets by reducing the risk of full reversals.
Each of these settings can significantly affect the strategy’s risk-reward balance. For instance, increasing the stop loss level or the take profit percentages allows the strategy to stay in trades longer, potentially increasing profit per trade but at the cost of larger drawdowns. Conversely, tighter stops and smaller profit targets result in more frequent trades with lower average profit per trade.

Qty CalculatorThis Pine Script indicator, titled "Qty Calculator," is a customizable tool designed to assist traders in managing their trades by calculating key metrics related to risk management. It takes into account your total capital, entry price, stop-loss level, and desired risk percentage to provide a comprehensive overview of potential trade outcomes.
Key Features:
User Inputs:
Total Capital: The total amount of money available for trading.
Entry Price: The price at which the trader enters the trade.
Stop Loss: The price level at which the trade will automatically close to prevent further losses.
Risk Percentage: The percentage of the total capital that the trader is willing to risk on a single trade.
Customizable Table:
Position: The indicator allows you to choose the position of the table on the chart, with options including top-left, top-center, top-right, bottom-left, bottom-center, and bottom-right.
Size: You can adjust the number of rows and columns in the table to fit your needs.
Risk Management Calculations:
Difference Calculation: The difference between the entry price and the stop-loss level.
Risk Per Trade: Calculated as a percentage of your total capital.
Risk Levels: The indicator evaluates multiple risk levels (0.10%, 0.25%, 0.50%, 1.00%) and calculates the quantity, capital per trade, percentage of total capital, and the risk amount associated with each level.
R-Multiples Calculation:
The indicator calculates potential profit levels at 2x, 3x, 4x, and 5x the risk (R-Multiples), showing the potential gains if the trade moves in your favor by these multiples.
Table Display:
The table includes the following columns:
CapRisk%: Displays the risk percentage.
Qty: The quantity of the asset you should trade.
Cap/Trade: The capital allocated per trade.
%OfCapital: The percentage of total capital used in the trade.
Risk Amount: The monetary risk taken on each trade.
R Gains: Displays potential gains at different R-Multiples.
This indicator is particularly useful for traders who prioritize risk management and want to ensure that their trades are aligned with their capital and risk tolerance. By providing a clear and customizable table of critical metrics, it helps traders make informed decisions and better manage their trading strategies.

Monthly Day Long Strategy with VIX and Risk ManagementThis trading strategy is designed to open long positions on a specific day of the month, with the conditions for entry and exit based on the VIX index and additional risk management techniques. The strategy includes stop-loss and take-profit features to manage risk and lock in profits.
Inputs:
Entry Day of the Month (entry_day): Specifies which day of the month to consider for initiating a trade. The default value is the 27th.
Hold Duration (Days) (hold_duration_days): Defines how many days to hold the position after opening. The default value is 4 days.
VIX Threshold (vix_threshold): Sets the maximum acceptable value for the VIX index to consider an entry. If the VIX is below this threshold, it signals a potential trade. The default value is 20.0.
Stop Loss (%) (stop_loss_percentage): Determines the percentage below the entry price where the stop-loss will be triggered. The default value is 2.0%.
Take Profit (%) (take_profit_percentage): Sets the percentage above the entry price where the take-profit will be triggered. The default value is 5.0%.
Functions:
next_weekday(date): Adjusts the entry date to the next Monday if it falls on a weekend (Saturday or Sunday). This ensures trades do not occur on non-trading days.
Logic:
Entry Conditions:
Date Check: Opens a long position if the current date matches the adjusted entry date (the 27th or the next Monday if the 27th falls on a weekend).
VIX Filter: The VIX index value must be below the specified threshold (e.g., 20.0) to consider an entry.
Exit Conditions:
Time-Based Exit: Closes the position after the hold duration of 4 days.
Stop-Loss: Automatically closes the position if the price drops to a level that is a specified percentage below the entry price (e.g., 2.0%).
Take-Profit: Closes the position if the price rises to a level that is a specified percentage above the entry price (e.g., 5.0%).
Plots:
VIX Plot: Displays the VIX index on the chart for visual reference.
VIX Threshold Line: A horizontal line representing the VIX threshold value.
Summary:
The strategy aims to take advantage of specific entry days while filtering trades based on VIX levels to ensure market conditions are favorable. Risk management is enhanced through stop-loss and take-profit settings, which help in controlling potential losses and securing profits. The strategy ensures trades are only made on trading days and not on weekends, adjusting automatically to the next Monday if needed.
ChatGPT kann Fehler machen. Überprüfe wichtige Informationen.

Supertrend (Buy/Sell) With TP & SLSupertrend (Buy/Sell) with TP & SL: An Enhanced Trading Tool
This Pine Script indicator combines the popular Supertrend indicator with multiple take-profit (TP) and stop-loss (SL) levels, providing traders with a comprehensive visual aid for potential entries, exits, and risk management.
Originality
Buffer Zones for Precision: Instead of relying solely on the Supertrend line, this script incorporates buffer zones around it. This helps filter out false signals, especially in volatile markets, leading to more accurate buy/sell signals.
Flexible Stop-Loss: Offers the choice between a fixed or trailing stop-loss, allowing traders to tailor their risk management approach based on their preferences and market conditions.
Multiple Take-Profit Levels: Provides three potential take-profit levels, giving traders the flexibility to secure profits at different stages of a trend.
Heikin Ashi Candles & VWAP: Incorporates Heikin Ashi candles for smoother trend visualization and adds a VWAP line for potential support/resistance levels.
Clear Table Display: Presents key information like Stop Loss and Take Profit levels in a user-friendly table, making it easier to track trade targets.
How It Works
Supertrend Calculation: The Supertrend is calculated using ATR (Average True Range) to gauge market volatility. The script then creates buffer zones around the Supertrend line for refined signal generation.
Buy/Sell Signals:
Buy: When the close price crosses above the upper buffer zone, indicating a potential uptrend.
Sell: When the close price crosses below the lower buffer zone, suggesting a potential downtrend.
Take Profit & Stop Loss:
Take Profits: Three TP levels are calculated based on ATR and a customizable profit factor.
Stop Loss: The stop-loss can be set as either a fixed value based on ATR or as a trailing stop-loss that dynamically adjusts to lock in profits.
How To Use
Add the Indicator: Search for "Supertrend (Buy/Sell) With TP & SL" in the TradingView indicators list and add it to your chart.
Customize Inputs: Adjust parameters like ATR Period, Factor, Take Profit Factor, Stop Loss Factor, Stop Loss Type, etc., based on your trading style and preferences.
Interpret Signals: Look for buy signals when the price crosses above the upper buffer and sell signals when it crosses below the lower buffer.
Manage Risk: Use the plotted Take Profit and Stop Loss levels to manage your risk and potential rewards.
Concepts
Supertrend: A trend-following indicator that helps identify the direction of the prevailing trend.
ATR (Average True Range): A measure of market volatility.
Buffer Zones: Used to filter out false signals by creating a zone around the Supertrend line.
Trailing Stop Loss: A dynamic stop-loss that moves with the price to protect profits.
Heikin Ashi: A type of candlestick chart designed to filter out market noise and make trends easier to identify.
VWAP (Volume Weighted Average Price): An indicator that shows the average price at which a security has traded throughout the day, based on both volume and price.
Important Note: This script is for educational and informational purposes only. Backtest thoroughly and use with caution in live trading. Always manage your risk appropriately.

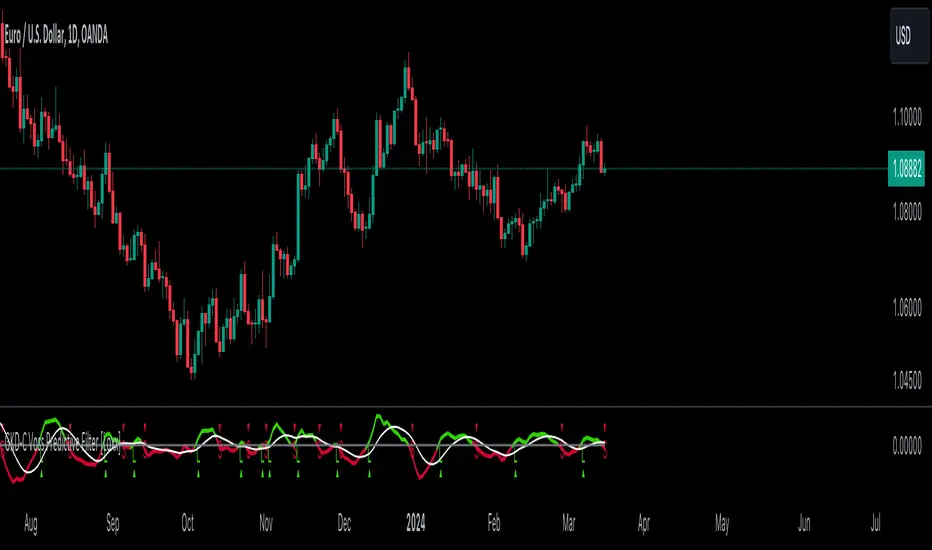
Volume Based Volatility Trail [UAlgo]"Volume Based Volatility Trail ", is designed to identify potential trading opportunities based on volatility and volume analysis. It calculates the Average True Range (ATR) to gauge market volatility and uses a volume-based multiplier to dynamically adjust a trailing stop level. The indicator also incorporates volume analysis to identify high volume periods that might signal potential breakouts.
🔶 Key Features
Volume-Based Volatility Trail: The indicator calculates a trailing stop level based on the ATR, which is then adjusted based on volume. Higher volume periods can lead to a wider trailing stop to account for increased volatility.
Price Source: Users can select the price source (e.g., close, open) for volume calculations.
Customizable Inputs: Users can adjust various parameters like the ATR period, multiplier, smoothing period, volume SMA period, ATR adjustment factor, and colors for buy/sell signals and the trailing stop area.
Buy/Sell Alerts: The indicator generates alerts for potential buy and sell opportunities based on the trailing stop crossing the price.
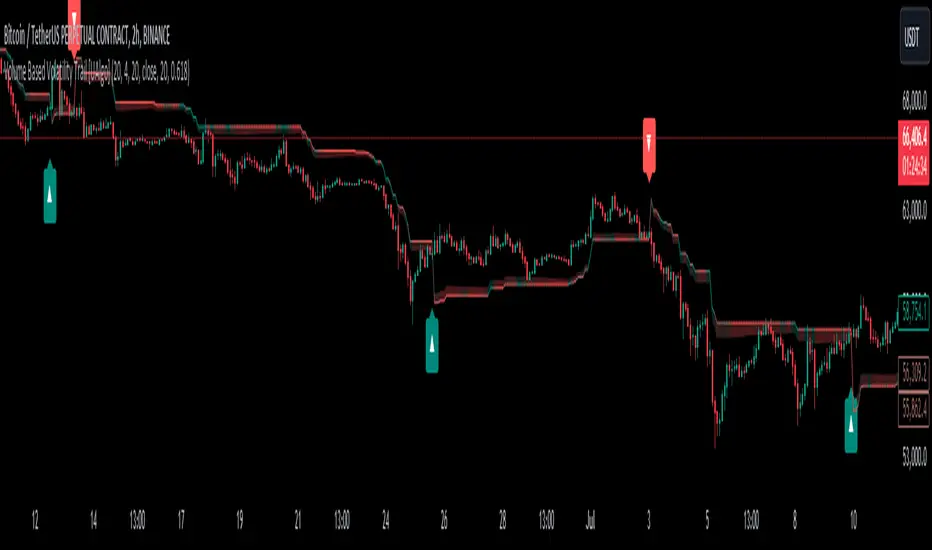
🔶 Usage
Look for buy signals (▲ marker) when the price crosses above the trailing stop level, potentially indicating a bullish trend.
Conversely, sell signals (▼ marker) appear when the price falls below the trailing stop, suggesting a bearish trend.
The shaded area around the trailing stop represents a buffer zone that might offer some protection against price fluctuations, but it can also indicate areas of potential pullbacks. During volatile periods or after strong price movements, the price might retrace back towards the trailing stop before continuing its trend. This shaded area can help visualize these potential retracement zones.
High volume periods (highlighted by the indicator) can be used in conjunction with other technical analysis to confirm potential breakouts. Analyze these high volume periods alongside price action and other indicators to assess the strength of the breakout and the likelihood of the price continuing its upward move.
🔶 Disclaimer:
Use with Caution: This indicator is provided for educational and informational purposes only and should not be considered as financial advice. Users should exercise caution and perform their own analysis before making trading decisions based on the indicator's signals.
Not Financial Advice: The information provided by this indicator does not constitute financial advice, and the creator (UAlgo) shall not be held responsible for any trading losses incurred as a result of using this indicator.
Backtesting Recommended: Traders are encouraged to backtest the indicator thoroughly on historical data before using it in live trading to assess its performance and suitability for their trading strategies.
Risk Management: Trading involves inherent risks, and users should implement proper risk management strategies, including but not limited to stop-loss orders and position sizing, to mitigate potential losses.
No Guarantees: The accuracy and reliability of the indicator's signals cannot be guaranteed, as they are based on historical price data and past performance may not be indicative of future results.
Master Pattern [UAlgo]🔶 Description:
"Master Pattern by UAlgo" aims to identify and visualize "Master Patterns" in price movements on financial charts, and focusing on detecting liquidity levels and sweeps. The indicator provides users with the ability to customize settings such as master pattern detection and detection flexibility, sensitivity to liquidity levels, and visualization preferences.
🔶 What is the Master Pattern ?
The Master Pattern is a framework built around understanding market cycles, which include three main phases: Contraction, Expansion, and Trend.
Contraction Phase: During this phase, the market fluctuates less and consolidates within a narrow range. Institutional trading volumes tend to be low and it is recommended to avoid trading entries during this period.
Expansion Phase: volatility increases and prices fluctuate greatly. Institutional traders begin to establish positions at this stage and may manipulate prices to attract retail traders to create liquidity for their own buy or sell targets.
Trend Phase: The final phase that completes the market cycle. Institutional traders started taking profits, causing the trend to reverse. This triggered panic among retail traders, leading to liquidations and stop-losses. This creates liquidity from which institutional traders can profit, while retail traders' positions are overvalued.
🔶 Key Features:
Pattern Detection : The indicator detects and visualizes contraction patterns in price movements, helping traders identify potential areas of price consolidation.
Also traders can choose between different modes (Strict, Normal, Relax) for obtaining master patterns, providing flexibility in pattern identification based on individual trading strategies and preferences.
The Value/Expansion Line : This value line is considered by institutional traders as a potential “Point of Origin” for future price movements.
An Application Example of the Master Pattern :
Select the Appropriate Timeframes: A significant separation between the higher timeframe (HTF) and the lower timeframe (LTF) is essential. For instance, combinations like 4H and 15M, 4H and 5M, or 1H and 1M. You can change this according to your own strategy.
Trade Based on Contraction Box, Value Line and Liquidity: When the HTF is above value, look for buying opportunities on your LTF below value. Conversely, when the HTF is below value, seek selling opportunities on your LTF above value. Sweeping liquidity in LTF is also an important parameter.
Also Value/Expansion Line can also be used as Support/Resistance zone,
Liquidity Levels : The indicator includes functionality to detect and display liquidity levels on the chart.
Dashboard Display : A customizable dashboard provides users with key information, including liquidity levels, master pattern values, and whether the current price is above or below Master Pattern's value lines.
Additionally, when liquidity is swept or the price rises above or falls below the value line. this information can be displayed on the dashboard.
Customizable Settings: Users can adjust parameters such as the pattern detection mode, sensitivity to liquidity levels, liquidity type (cumulative or individual for each swing), visualization preferences for master patterns, the position and font size of the dashboard.
🔶 Disclaimer:
Use with Caution: This indicator is provided for educational and informational purposes only and should not be considered as financial advice. Users should exercise caution and perform their own analysis before making trading decisions based on the indicator's signals.
Not Financial Advice: The information provided by this indicator does not constitute financial advice, and the creator (UAlgo) shall not be held responsible for any trading losses incurred as a result of using this indicator.
Backtesting Recommended: Traders are encouraged to backtest the indicator thoroughly on historical data before using it in live trading to assess its performance and suitability for their trading strategies.
Risk Management: Trading involves inherent risks, and users should implement proper risk management strategies, including but not limited to stop-loss orders and position sizing, to mitigate potential losses.
No Guarantees: The accuracy and reliability of the indicator's signals cannot be guaranteed, as they are based on historical price data and past performance may not be indicative of future results.

Trend Bars Pro (HTF PO3)Hello Traders!
The innovative TRN Trend Bars Pro are designed to help traders to analyze markets in an intuitive way and provide high probability entry and exit signals. It combines three core concepts:
TRN Trend Bars to see the current trend and reversals (replaces the default chart bars)
Bar Ranges to highlight consolidations
Dynamic Trend to see the overall trend.
First, let's have a look at each of these concepts individually. Afterwards, we describe how a combination of all three gives you a crystal-clear picture of the market.
TRN Trend Bars Pro
They show bullish and bearish trends and reversals based on color coding the bars and give high probability trade opportunities with special colors. The trend analysis is based on a new algorithm that includes several different inputs:
classical and advanced bar patterns and their statistical frequency
probability distributions of price expansions after certain bar patterns
bar information such as wick length in %, overlapping of the previous bar in % and many more
historical trend and consolidation analysis
The algorithm weighs these concepts and outputs a color scheme for the chart bars or candlesticks.
Bar Types
Trend bars in green and red
Reversal Bars in blue and fuchsia
Continuation Bars in turquoise and orange
Breakout Bars in dark green and pink
Green Bars signify a sustained uptrend, indicating bullish market sentiment. On the other hand, Red Bars indicate a persistent downtrend, representing bearish market sentiment. The transition from red to green denotes a bullish trend reversal, suggesting a shift from bearish to bullish sentiment. Conversely, the shift from green to red signals a bearish trend reversal, indicating a transition from bullish to bearish sentiment. By monitoring these color changes, traders can identify potential trend reversals and make informed trading decisions.
The presence of gray and black bars indicates a neutral market state, often observed before an impending color change from red to green or green to red. These neutral bars serve as a transition phase between the previous trend and the potential reversal.
The TRN Trend Bars Pro incorporate signal bars, distinguished by their distinct colors, to offer potential buy and sell signals and deeper insights into market dynamics.
Reversal Bars
The presence of blue Reversal Bars indicates a trend reversal to the upside, while pink Reversal Bars indicate a reversal to the downside. These bars not only serve as signals for potential trend shifts but also present favorable opportunities to enter the market or increase one's position size.
Continuation Bars
In addition to the reversal bars, the indicator also includes bullish continuation bars (colored turquoise) and bearish continuation bars (colored orange). These bars act as signals for the continuation of an existing trend. Like the reversal bars, they can be utilized as entry points or opportunities to augment one's position size.
Breakout Bars
The dark green breakout bars within TRN Trend Bars Pro show a powerful breakout from a price range detected by our integrated bar range feature. They signify the continuation or potential change in a trend following a consolidation phase. As such, these bars hold dual functionality, serving as reversal signals and validating the persistence of an ongoing trend.
Bar Ranges
The bar range feature automatically finds consolidations where the price range of several consecutives bars is rather small. The detection of the bar ranges includes among other things the overlapping percentage of these bars.
How to Use Price Ranges
Here are a few ways you can use the bar ranges in your trading:
Identify Support and Resistance Levels
The price ranges can help you identify key support and resistance levels on a chart. By observing price ranges and identifying these levels, you can make more informed decisions about entering or exiting trades.
Breakout Trading
Price ranges can also provide insights into potential breakout opportunities. Breakouts occur when the price breaks out of a defined range, signaling a potential shift in market sentiment and the start of a new trend. The Color highlighted Breakout Bars from the TRN Trend Bars Pro are signaling a powerful breakout of a price range. Traders can enter positions in the direction of the breakout and set appropriate stop-loss orders to manage risk. Note that not every price range is left by a powerful breakout.
Dynamic Trend
The Dynamic Trend combines elements from standard trend strength indicators (e.g. DI-, DI+, Parabolic SAR) and volatility indicators (e.g. ATR, Standard Deviation). It produces a moving average line that adapts to changing market volatility. It is inspired by the ideas of the programmer and trader Fat Tails. The adaptive behavior provides more relevant information for traders when compared to traditional moving averages which do not consider volatility and trend strength together. This makes the Dynamic Trend completely unique, and no other moving average indicator can give you this precision.
How to use Dynamic Trend
Generally, a rising Dynamic Trend line, displayed in green, indicates that an uptrend is strong, while a falling Dynamic Trend, displayed in red, suggests that the downtrend is sharp. The Dynamic Trend turns gray when there is insufficient clarity to establish a distinct trend and especially when there is not volatility in the market.
Identify potential trade entries and exits: When used in conjunction with price action, the Dynamic Trend can provide potential trade signals. For example, if the price crosses above the Dynamic Trend, it may be a bullish sign, suggesting a potential buy entry. Conversely, if the price crosses below the Dynamic Trend, it may indicate bearish conditions and a potential sell signal.
Trend Identification and Pullback trading
Observe the Dynamic Trend's color. When it's on the rise and appears green, it indicates a bullish trend. Conversely, if it's in decline and displayed in red, it signals a bearish trend.
If Dynamic Trend is green and price pulls from above back to the Dynamic Trend, then this can be considered as a bullish signal.
If Dynamic Trend is red and price pulls from below back to the Dynamic Trend, then this can be considered as a bearish signal.
In the event of a bearish signal, such as a bearish TRN Signal Bar, and the Dynamic Trend is red, it provides additional confirmation to the bearish signal. Likewise, bullish signals gain added conviction when the Dynamic Trend is green.
Crossovers
As with other moving averages, crossovers between the Dynamic Trend and the price can be significant.
If price is crossing above the Dynamic Trend, then this can be considered as a bullish signal.
If price is crossing below the Dynamic Trend, then this can be considered as a bearish signal.
If you currently hold a position, both bullish and bearish crossovers can serve as potential exit signals. For instance, in the case of a long position, a bearish crossover can indicate a potential shift in sentiment, signaling a bearish reversal and a potential opportunity to close your long position.
Filtering Noise
Due to its adaptive nature, the Dynamic Trend can be a useful tool to filter out market noise. When the market is choppy or consolidating, the Dynamic Trend tends to remain flat and colored gray, signaling traders to potentially stay out of the market.
Stop Losses
The Dynamic Trend can also be used as a dynamic stop loss. For instance, in a long trade, traders can use the Dynamic Trend as a trailing stop, selling their position if the price crosses below the Dynamic Trend.
Combining TRN Trend Bars Pro, Bar Ranges and Dynamic Trend together
Combining all three concepts gives you a crystal-clear picture of the market. The Dynamic Trend shows you the overall trend. If price pulls back to the dynamic trend line and then price picks up the trend direction again, then the TRN Trend Bars Pro immediately switches the color to the trend direction. Therefore, you can easily identify high probability entry signals based on the bar color.
As a simple trading model, you can set the stop loss below the last swing or below a TRN signal bar (vice versa for short entries) and use 2.5 R or 3 R as target.
You can increase the success rate of the high probability TRN signal bars entries even more if they are in line with the Dynamic Trend line.
On the other hand, the TRN Bar Ranges help you to stay out of the market in case the price does not really change. As a confluence signal to stay flat in this period the dynamic trend line tends to be grey as well. If the price breaks out of the range, then the indicator prints a breakout bar which serves as a high probability entry signal.
Although it is possible to switch off any of these concepts, it is highly recommended to use all three in combination to get a crystal-clear picture of the market.
Alerts
Experience the power of our TRN Trend Bars Pro alerts, delivering real-time notifications for trend changes, price range breakouts, and signal bar formations or confirmations. Stay on top of the market with these versatile alerts, customizable to your preferred assets and timeframes.
Conclusion
While signals from TRN Trend Bars Pro can be informative, it is important to recognize that their reliability may vary. Various external factors can impact market prices, and it is essential to consider your risk tolerance and investment goals when executing trades.
Risk Disclaimer
The content, tools, scripts, articles, and educational resources offered by TRN Trading are intended solely for informational and educational purposes. Remember, past performance does not ensure future outcomes.

[Support and Resistance with Trend Lines] with Backtest (TSO) with Backtest (TSO)
===========================================================================
===========================================================================
This indicator serves as a comprehensive full-cycle trading system, providing alerts at each stage of the trade, from opening to closure. The algorithm uses most recent and historical S&R (Support and Resistance) levels with most recent and historical Trend Lines, generating signals for trades when Breaks/Bounces occur (Trade Open Signal triggers can be configured via very customizable indicator Input "Signal Trigger Matrix" settings). With signal for trade open, TP (Take Profit and SL (Stop Loss) levels are calculated as well and marked on the chart including alerts for each action of the trade. The indicator offers a variety of automated approaches for TP (Take-Profit) and SL (Stop-Loss) settings. These include static current/historical S&R (Support and Resistance) levels or S&R/Trend Lines dynamic breaks for TP (Take-Profit) and various SL (Stop-Loss) approaches, including ATR Trailing SL, opposite S&R (Support and Resistance) levels SL, opposite Trend Lines SL and more. This diverse set of tools ensure flexibility in tailoring TP (Take-Profit) and SL (Stop-Loss) parameters to different market conditions, contributing to a more adaptive and robust trading system. Additionally, a series of signal analysis tools, including market sentiment, candle bar analysis, divergence, and volume, enhance the precision of trading signals.
* Works with popular timeframes: 1M, 3M, 5M, 15M, 30M, 45M, 1H.
* Works well with Futures and Indices, can be used to trade Stocks, Crypto and FOREX.
* Includes LIVE alert/labels Breakouts and Bounces signal trigger feature, which can be used for scalping (NOTE: This approach cannot be backtested).
* Every action of the trade is calculated on a confirmed closed candle bar state (barstate.isconfirmed), so the indicator will never repaint.
==============================================================
Indicator examples:
---------------------------------------------------------------------------
Strategy Config: SRTL_MES_15M3Y_EODoff_ALL
Here is a nice example of MES (Micro E-Mini S&P 500 Index Futures) configuration, which uses S&R (Support and Resistance) breakouts as signal trigger with Elliot Wave confirmation and previous S&R historical levels for TP (Take-Profit).
---------------------------------------------------------------------------
An example of an intraday Tesla trade. Also the green arrows will be displayed IMMEDIATELY when Breakout/Reverse Bounce occurs (same an Alert will be triggered immediately).
===========================================================================
Trading open/close/TP/SL labels, plots and colors explanations:
---------------------------------------------------------------------------
>>> S&R (Support and Resistance) levels/lines: orange - support, blue - resistance (can be hidden).
>>> Trend Lines: yellow - support, green - resistance (can be hidden).
>>> Blue labels show resistance breakouts and bounces, light-blue - bullish, dark-blue - bearish
>>> Yellow labels show resistance breakouts and bounces, light-yellow - bullish, dark-yellow - bearish
>>> Green/Red arrows on top/bottom of candle bar will show LIVE breakouts (if turned on)
>>>>> LONG open: green "house" looking arrow below candle bar.
>>>>> SHORT open: red "house" looking arrow above candle bar.
>>>>> LONG/SHORT take-profit target: green/red circles (multi-profit > TP2/3/4/5 smaller circles).
>>>>> LONG/SHORT stop-loss target: green/red + crosses.
>>>>> LONG/SHORT take-profit hits: green/red diamonds.
>>>>> LONG/SHORT stop-loss hits: green/red X-crosses.
>>>>> LONG/SHORT EOD (End of Day | Intraday style) close (profitable trade): green/red squares.
>>>>> LONG/SHORT EOD (End of Day | Intraday style) close (loss trade): green/red PLUS(+)-crosses.
===========================================================================
STATS TABLE ///////////////////////////////////////////////////////////////
---------------------------------------------------------------------------
>>> Trading STATS table on the chart showing current trade direction, Last TP (Take-Profit) Taken, Current Trade PL (profit/loss in price difference from trade open to the very current state).
---------------------------------------------------------------------------
CUSTOM TRADING DATE RANGE /////////////////////////////////////////////////
---------------------------------------------------------------------------
>>>>> This feature can be used to manually set indicator trading range from and to a specific date and time. NOTE: This is not intended for a very long date range backtesting, utilize TradingView Strategy Tester for that.
* Use TradingView “Strategy Tester” to see Backtesting results
NOTE: If Strategy Tester does not show any results with Date Ranged fully unchecked, there may be an issue where a script opens a trade, but there is not enough TradingView power to set the Take-Profit and Stop-Loss and somehow an open trade gets stuck and never closes, so there are “no trades present”. In such case - manually check “Start”/“End” dates or use “Deep Backtesting” feature!
---------------------------------------------------------------------------
INTRADAY ACTIVE TRADING SESSION CONFIGURATION /////////////////////////////
---------------------------------------------------------------------------
>>> Regional Active Trading Session Hours Schedule: If selected - trades will only open during regional active trading session, if 'OFF', there will be no trading schedule and trades will open 24/7.
>>> EOD(End of Day) Close - On/Off: Close the trade if it's still open at the end of active trading session (on the very last candle bar). NOTE: If no region is selected at 'Regional Active Trading Session Schedule' - there will be no EOD(End of Day) Close and trades will run overnight until either SL(Stop-Loss) or TP(Take-Profit) is hit!
>>>>> EOD(End of Day) Close - 1 candle bar before last: This is specifically for stocks as while usually indices can be closed 15minutes after the market closes, for stocks - the last candle bar closes at the same time with the market active trading session, which if closed - trades can't be closed until next day/session! Enable this setting for the trade to close/alert 1 candle bar before the last one, so there is still time to close the trade at the Broker (NOTE: depending on the timeframe, 1 candle bar can be: 15sec, 30sec, 1min, 3min, 5min, 15min, 30min, 45min, 1h).
---------------------------------------------------------------------------
SIGNAL TRIGGER MATRIX ////////////////////////////////////////////////
---------------------------------------------------------------------------
>>> Trading Engine: This setting turns on TradingView Strategy trading engine for backtesting.
>>> Market Session Only: With this setting turned on, all signal trigger Breaks/Bounces will be hidden during Pre/Post market time.
>>> Plot S&R Levels/Lines: Plot S&R (Support and Resistance) on chart. Note: historical levels/lines will only be plotted if hit (Break/Bounce).
>>> Plot Trend Lines Levels/Lines: Plot Trend Lines levels/lines on chart. Note: historical levels/lines will only be plotted if hit (Break/Bounce).
>>> Use S&R Current Levels | Use S&R Historical Levels | Use Trend Lines Current Levels | Use Trend Lines Historical Levels |: Choose which levels should be used for Breaks/Bounces to be captured on. If all triggers are turned on/checked - whatever happens 1st wins the trigger.
>>> Breaks | Bounces: 'Breaks': Turn on Breaks through levels/lines signal trigger. | 'Bounces': Turn on Bounces off levels/lines signal trigger.
>>> Signal: Regular | Signal: S&R Combo | Signal: TL Combo | Signal: S&R + TL Combo | Signal: Repeat Action |: Trade open signal trigger execution approach MATRIX (If 1 or more turned on at the same time - whatever comes first will be the trade signal trigger). 'Regular': A single Break/Bounce must occur on a closed bar for signal trigger. 'S&R Combo': A combination of 2 Current + Historical S&R (Support and Resistance) Break/Bounce must happen in the same direction on same bar for signal trigger. 'TL Combo': A combination of 2 Current + Historical Trend Lines Break/Bounce must happen in the same direction on same bar for signal trigger. 'S&R + TL Combo': a combination of ANY S&R and Trend Line Break/Bounce must happen in the same direction on same bar for signal trigger. 'Repeat Action': Initial and then confirmation (2nd/3rd/etc. consecutive occurence) Break/Bounce must occur on same level/line for signal trigger.
>>> Historical - Look Back (# of days): How far back (in # of days) will historical S&R/Trend Lines will be used for Trade Open signals/TP/SL/etc.
>>> Historical - Look Back Invalidation (# of days): IF THERE IS TOO MUCH HISTORICAL LEVELS/LINES ON CHART - LOWER THIS SETTING + MAKE SURE IT'S SMALLER THAN 'Historical - Look Back (# of days)'. With big Look back period (5+ days) - it can become very messy with too many historical levels/lines. To clear oldest historical levels/lines - set Look Back Invalidation # of days to less than Historical Look Back # of days. (After X # of Look Back Invalidation days - older levels/lines will become invalidated and no longer used for opening trades/TP (Take-Profit)/SL (Stop-Loss), while newer levels/lines will still be discovered.
>>> S&R/Trend Lines - Support/Resistance combined into 1 entity: Every level or a line becomes simply a level or a line, regardless if it originally was a support or resistance. By default, depending on the level/line originally being support or resistance - the signal direction will be such as: Resistance is broken > LONG / bounced > SHORT; Support is broken > SHORT / bounced > LONG; with this setting on, either level or line can be both broken or bounced off in ANY direction, trade open direction will depend on current market sentiment only.
---------------------------------------------------------------------------
S&R CONFIGURATION ////////////////////////////////////////////////
---------------------------------------------------------------------------
>>> S&R Search - Left Bars (current): This setting is for calculating optimal S&R (Support and Resistance) levels (in combination with below - Right Bars).
>>> S&R Search - Right Bars (current): This setting is for calculating optimal S&R (Support and Resistance) levels (in combination with above - Left Bars).
>>> S&R Search - Custom Resolution (current): This is a custom timeframe setting specifically for S&R Search, it disregards current chart timeframe. This is great to use for scalping, for example: with main chart set to 1min and the custom timeframe set to 3min or 5min - there will be stronger support/resistance levels with more detailed price action.
>>> S&R Search - Left Bars (historical): This setting is for calculating optimal S&R (Support and Resistance) levels (in combination with below - Right Bars).
>>> S&R Search - Right Bars (historical): This setting is for calculating optimal S&R (Support and Resistance) levels (in combination with above - Left Bars).
>>> S&R Search - Custom Resolution (historical): This is a custom timeframe setting specifically for S&R Search, it disregards current chart timeframe. This is great to use for scalping, for example: with main chart set to 1min and the custom timeframe set to 3min or 5min - there will be stronger support/resistance levels with more detailed price action.
>>> S&R - Historical S&R Levels - Extend to the right: Extend all S&R lines to the right.
>>> S&R (Current/Historical) - Live Breakout/Bounce - ALERT/SHOW: NOTE: Alert wlil trigger immediately at price Breaking thru or Bouncing off level/line and an arrow above /below the bar will show the direction of breakout/bounce. If on that same live bar - price comes back causing the Breakout/Bounce become no longer valid - the arrow will disappear as the condition of the Break/Bounce will no longer be valid.
---------------------------------------------------------------------------
TREND LINES CONFIGURATION ////////////////////////////////////////////////
---------------------------------------------------------------------------
>>> Show: Trend Line development (where it 'did not exist' yet): It takes 2 pivots to develop a trend line, pivot is established at least 3 candle bars later from where the pivot is. With this setting turned on - it will plot dashed lines where trend lines originated connecting the 1st and 2nd pivot point up to where the trend line became established (where in reality you would now be able to draw a certain trend line). Established already generated trend line are plotted with a solid line.
>>> Trend Lines - Line Slope Confirmation: LONG breakout will only be shown if trend line is goind downslope \. SHORT breakout will only be shown if trend line is goind upslope /.
>>> Trend Lines - Search - Left Bars (current): This setting is for calculating optimal Trend Lines.
>>> Trend Lines - Search - Right Bars (current): This setting is for calculating optimal Trend Lines.
>>> Trend Lines - Custom Resolution (current): This is a custom timeframe setting specifically for S&R Search, it disregards current chart timeframe. This is great to use for scalping, for example: with main chart set to 1min and the custom timeframe set to 3min or 5min - there will be stronger support/resistance levels with more detailed price action.
>>> Trend Lines - Search - Left Bars (historical): This setting is for calculating optimal Trend Lines.
>>> Trend Lines - Search - Right Bars (historical): This setting is for calculating optimal Trend Lines.
>>> Trend Lines - Custom Resolution (historical): This is a custom timeframe setting specifically for S&R Search, it disregards current chart timeframe. This is great to use for scalping, for example: with main chart set to 1min and the custom timeframe set to 3min or 5min - there will be stronger support/resistance levels with more detailed price action.
>>> Trend Lines - Historical Trend Lines - Extend to the right: Extend all Trend Lines to the right.
>>> Trend Lines (Current/Historical) - Live Breakout/Bounce - ALERT/SHOW: NOTE: Alert will trigger immediately at price Breaking thru or Bouncing off level/line and an arrow above /below the bar will show the direction of breakout/bounce. If on that same live bar - price comes back causing the Breakout/Bounce become no longer valid - the arrow will disappear as the condition of the Break/Bounce will no longer be valid.
---------------------------------------------------------------------------
TAKE-PROFIT/STOP-LOSS CONFIGURATION ///////////////////////////////////////
---------------------------------------------------------------------------
>>> TP (Take-Profit) System: 'S&R Static Current/Historical': TP (Take-Profit) is calculated using current/historical S&R (Support & Resistance) levels at trade open and remains static. 'S&R/Trend Lines Dynamic Breaks': TP (Take-Profit) is fully dynamic and will be trigger at price above trade open price and with Breakout occurence (S&R or Trend Line current/historical breakout).
>>> TP (Take-Profit) # of targets: It is wise to divide the trade into several profit targets. With this setting - up to 5 TP (Take-Profit) targets can be approached. The trade will be equally divided up by the selected # of TP (Take-Profit) targets.
>>> SL (Stop-Loss) System: 'ATR-Trailing-SL': SL (Stop-Loss) is trail-following the ATR (Average True Range) line, NOTE: If at signal trigger, ATR will be against the trade direction - trade open signal will be skipped; 'S&R-Static-SL': SL (Stop-Loss) is set at trade open per optimal most recent S&R level and remains there until trade closes; 'TrendLines-Static-SL': SL (Stop-Loss) is set at trade open per optimal most recent trend line and remains there until trade closes; 'TrendLines-Dynamic-SL': SL (Stop-Loss) will be set per current opposite trend line and follow it until trade is open.; 'Oppos-Sig-Trd-in-Loss': SL (Stop-Loss) will trigger at opposite signal with trade currently at loss.
>>> SL (Stop-Loss) - On/Off: Without SL (Stop-Loss), unless EOD (End of Day) Close is turned on - there will be no SL (Stop-Loss) at all!
---------------------------------------------------------------------------
MARKET SENTIMENT CONFIRMATION ///////////////////////////////////////
---------------------------------------------------------------------------
>>> Market Sentiment: Signal is confirmed per Market Sentiment direction. If Market Sentiment is turned off - whatever signal comes 1st will be the trade open trigger.
---------------------------------------------------------------------------
SIGNAL ANALYSIS AND CLEANUP ///////////////////////////////////////////////
---------------------------------------------------------------------------
>>> Signal Cleanup - Bar Color: Include Bar Color (bullish/bearish) confirmation, LONG signal will only be opened if signal bar is green/bullish, SHORT if red/bearish.
>>> Signal Cleanup - Bar Directional Structure: Skip opposite bar structure types signals (For example: bearish green hammer).
>>> Signal Cleanup - Bar Doji Skip: Skip doji (indecisive) candles signals.
>>> Signal Cleanup - EWO (Elliott Wave Oscillator): Include EWO (Elliott Wave Oscillator), LONG will only be opened if EWO is bullish / SHORT if EWO is bearish.
>>> Signal Cleanup - VWAP (Volume-Weighted Average Price): Include VWAP (Volume-Weighted Average Price), LONG will only be opened if price is above VWAP / SHORT if price is below VWAP.
>>> Signal Cleanup - MA (Moving Average) Confirmation: Include MA (Moving Average), LONG will only be opened if MA is bullish / SHORT if MA is bearish.
>>> Signal Cleanup - ATR (Average True Range): Include ATR (Average True Range) confirmation, LONG will only be opened if ATR is bullish / SHORT if ATR is bearish.
>>> Signal Cleanup - Divergence(RSI + MACD): Include Divergence (RSI + MACD ) confirmation, LONG will only be opened if Divergence is bullish / SHORT if Divergence is bearish.
>>> Signal Cleanup - Volume % Strength: Include Volume strength/percentage confirmation, LONG/SHORT will only be opened with strong Volume matching the signal direction | By default, strong Volume percentage is set to 150% and weak to 50%.
>>> Signal Cleanup - Volume Above Average: Include Volume Above Moving Average (Volume closing bar closes above volume moving average) confirmation, LONG/SHORT will only be opened with Volume above average - Volume closed bar color must match the closed price color (bullish/bearish direction) + Volume bar must be closed above volume MA line).
---------------------------------------------------------------------------
===========================================================================
||||||||||||||||||||||||||||||||||| *** ||||||||||||||||||||||||||||||||||| *** |||||||||||||||||||||||||||||||||||
||||||||||||||||||||||||||||||||||| *** ||||||||||||||||||||||||||||||||||| *** |||||||||||||||||||||||||||||||||||
TP System - VERY IMPORTANT INFO!
-------------------------------------------------------------------------------------------------------------------
"TP PERCENTAGE" - amount by which current trade/position needs to be reduced/partially closed/sold.
-------------------------------------------------------------------------------------------------------------------
TP System: Dynamic
"TP PERCENTAGE" - will always be the same amount (trade/position size divided by the # of take-profit(TP) targets) and percentage to be closed will always be of the ORIGINAL trade/position.
-------------------------------------------------------------------------------------------------------------------
TP System: Static
"TP PERCENTAGE" - will always be the same amount IF take-profit(TP) targets are hit 1-by-1 (TP1 > TP2 > TP3 > TP4 > TP5), otherwise it will vary and unless it is a 1st take-profit(TP1), the REMAINING trade/position size will always be smaller than original and therefore the percentage to be closed will always be of the REMAINING trade/position and NOT the original one!
-------------------------------------------------------------------------------------------------------------------
"TP PERCENTAGE" CheatSheet (these are the only percentages you may see)
-----------------------------------------------------------------------
TP PERCENTAGE---Close/Sell Amount-------------Example (trade size: 50 stocks)
20%-------------trade size * 0.2--------------50 * 0.2 = 10 stocks
25%-------------trade size * 0.25-------------50 * 0.25 = 12.5(~13) stocks
34%-------------trade size * 0.34-------------50 * 0.34 = 17 stocks
40%-------------trade size * 0.4--------------50 * 0.4 = 20 stocks
50%-------------trade size * 0.5--------------50 * 0.5 = 25 stocks
60%-------------trade size * 0.6--------------50 * 0.6 = 30 stocks
66%-------------trade size * 0.66-------------50 * 0.66 = 33 stocks
75%-------------trade size * 0.75-------------50 * 0.75 = 37.5(~38) stocks
80%-------------trade size * 0.8--------------50 * 0.8 = 40 stocks
100%------------trade size--------------------50 = 50 stocks
-----------------------------------------------------------------------
If for any reason a portion of the current/remaining trade closed at such occurrence was slightly wrong, it is not an issue. Such occurrences are rare and with slight difference in partial TP closed is not significant to overall performance of our algorithms.
||||||||||||||||||||||||||||||||||| *** ||||||||||||||||||||||||||||||||||| *** |||||||||||||||||||||||||||||||||||
||||||||||||||||||||||||||||||||||| *** ||||||||||||||||||||||||||||||||||| *** |||||||||||||||||||||||||||||||||||
===========================================================================
Alert Settings (you don’t have to touch this section unless you will be using TradingView alerts through a Webhook to use with trading bot)
---------------------------------------------------------------------------
Here is how a LONG OPEN alert looks like.
NOTE: Each label , , etc. is customizable, you can change the text of it within indicator Input settings.
ALERT >>>>>>>>>>>>>>>>>>>>>>>>>>>>>>>>>>>>>>>>>>>>>>>
COIN: BTCUSD
TIMEFRAME: 15M
LONG: OPEN
ENTRY: 20000
TP1: 20500
TP2: 21000
TP3: 21500
TP4: 22500
TP5: 23500
SL: 19000
Leverage: 0
---------------------------------------------------------------------------
Here is how a TP1 alert will look with 5 TPs breakdown of the trade.
NOTE1: Next to TP1 taken it will show at which price it was triggered.
NOTE2: Next to "TP Percentage" it shows how much of the CURRENT/ACTIVE/REMAINING trade needs to be closed.
NOTE2: If TP2/3/4/5 comes before TP1 - the alert will tell you exactly how many percent of the trade needs to be closed!
ALERT >>>>>>>>>>>>>>>>>>>>>>>>>>>>>>>>>>>>>>>>>>>>>>>
COIN: BTCUSD
TIMEFRAME: 15M
LONG: TP1
TP1: 20500
TP Percentage: 20%
---------------------------------------------------------------------------
Here is how an alert will look for LONG - STOP-LOSS.
ALERT >>>>>>>>>>>>>>>>>>>>>>>>>>>>>>>>>>>>>>>>>>>>>>>
COIN: BTCUSD
TIMEFRAME: 15M
ENTRY: 20000
LONG: SL
SL: 19000
---------------------------------------------------------------------------
Here is how an alert will look for LONG - EOD (End of Day) In Profit close.
ALERT >>>>>>>>>>>>>>>>>>>>>>>>>>>>>>>>>>>>>>>>>>>>>>>
COIN: BTCUSD
TIMEFRAME: 15M
LONG: EOD-Close (profit)
ENTRY: 20000
EOD-Close: 21900
===========================================================================
Adding Alerts in TradngView
---------------------------------------------------------------------------
-Add indicator to chart and make sure the correct strategy is configured (check Backtesting results)
-Right-click anywhere on the TradingView chart
-Click on Add alert
-Condition: Select this indicator by it’s name
-Immediately below, change it to "alert() function calls only", as other wise there will be 2 alerts for every alert!
-Expiration: Open-ended (that may require higher tier TradingView account, otherwise the alert will need to be occasionally re-triggered)
-Alert name: Whatever you desire
-Hit “Create”
-Note: If you change ANY Settings within the indicator – you must DELETE the current alert and create a new one per steps above, otherwise it will continue triggering alerts per old Settings!
===========================================================================
Good Luck! (NOTE: Trading is very risky, past performance is not necessarily indicative of future results, so please trade responsibly!)
---------------------------------------------------------------------------
NOTE: There seems to be a strange glitch when strategy is running live, it will show "double-take" take-profits labels on the chart. This is not affecting the script logic and backtesting results, if you simply change the timeframe real quick to something else then back - it will no longer show the duplicate orders... this must be some sort of a glitch as every alert was thoroughly tested to make sure everything is working!

TRN BarsThe innovative TRN Bars are designed to help traders to analyze markets in an intuitive way. It combines three core concepts:
TRN Bars to see the current trend and reversals (replaces the default chart bars)
Bar Ranges to highlight consolidations
Dynamic Trend to see the overall trend.
First, let's have a look at each of these concepts individually. Afterwards, we describe how a combination of all three gives you a crystal-clear picture of the market.
TRN Bars
They show bullish and bearish trends and reversals based on color coding the bars and give high probability trade opportunities with special colors. The trend analysis is based on a new algorithm that includes several different inputs:
classical and advanced bar patterns and their statistical frequency
probability distributions of price expansions after certain bar patterns
bar information such as wick length in %, overlapping of the previous bar in % and many more
historical trend and consolidation analysis
The algorithm weighs these concepts and outputs a color scheme for the chart bars or candlesticks.
Bar Types
Trend bars in green and red
Reversal Bars in blue and fuchsia
Continuation Bars in turquoise and orange
Breakout Bars in dark green and pink
Green Bars signify a sustained uptrend, indicating bullish market sentiment. On the other hand, Red Bars indicate a persistent downtrend, representing bearish market sentiment. The transition from red to green denotes a bullish trend reversal, suggesting a shift from bearish to bullish sentiment. Conversely, the shift from green to red signals a bearish trend reversal, indicating a transition from bullish to bearish sentiment. By monitoring these color changes, traders can identify potential trend reversals and make informed trading decisions.
The presence of gray and black bars indicates a neutral market state, often observed before an impending color change from red to green or green to red. These neutral bars serve as a transition phase between the previous trend and the potential reversal.
The TRN Bars incorporate Signal Bars, distinguished by their distinct colors, to offer potential buy and sell signals and deeper insights into market dynamics.
Reversal Bars
The presence of blue Reversal Bars indicates a trend reversal to the upside, while pink Reversal Bars indicate a reversal to the downside. These bars not only serve as signals for potential trend shifts but also present favorable opportunities to enter the market or increase one's position size.
Continuation Bars
In addition to the reversal bars, TRN Bars also include bullish continuation bars (colored turquoise) and bearish continuation bars (colored orange). These bars act as signals for the continuation of an existing trend. Like the reversal bars, they can be utilized as entry points or opportunities to augment one's position size.
Breakout Bars
The dark green breakout bars within TRN Bars show a powerful breakout from a price range detected by our integrated bar range feature. They signify the continuation or potential change in a trend following a consolidation phase. As such, these bars hold dual functionality, serving as reversal signals and validating the persistence of an ongoing trend.
Bar Ranges
The bar range feature automatically finds consolidations where the price range of several consecutives bars is rather small. The detection of the bar ranges includes among other things the overlapping percentage of these bars.
How to Use Price Ranges
Here are a few ways you can use the bar ranges in your trading:
Identify Support and Resistance Levels
The price ranges can help you identify key support and resistance levels on a chart. By observing price ranges and identifying these levels, you can make more informed decisions about entering or exiting trades.
Breakout Trading
Price ranges can also provide insights into potential breakout opportunities. Breakouts occur when the price breaks out of a defined range, signaling a potential shift in market sentiment and the start of a new trend. The Color highlighted Breakout Bars from the TRN Bars are signaling a powerful breakout of a price range. Traders can enter positions in the direction of the breakout and set appropriate stop-loss orders to manage risk. Note that not every price range is left by a powerful breakout.
Dynamic Trend
The Dynamic Trend combines elements from standard trend strength indicators (e.g. DI-, DI+, Parabolic SAR) and volatility indicators (e.g. ATR, Standard Deviation). It produces a moving average line that adapts to changing market volatility. It is inspired by the ideas of the programmer and trader Fat Tails. The adaptive behavior provides more relevant information for traders when compared to traditional moving averages which do not consider volatility and trend strength together. This makes the Dynamic Trend completely unique, and no other moving average indicator can give you this precision.
How to use Dynamic Trend
Generally, a rising Dynamic Trend line, displayed in green, indicates that an uptrend is strong, while a falling Dynamic Trend, displayed in red, suggests that the downtrend is sharp. The Dynamic Trend turns gray when there is insufficient clarity to establish a distinct trend and especially when there is not volatility in the market.
Identify potential trade entries and exits: When used in conjunction with price action, the Dynamic Trend can provide potential trade signals. For example, if the price crosses above the Dynamic Trend, it may be a bullish sign, suggesting a potential buy entry. Conversely, if the price crosses below the Dynamic Trend, it may indicate bearish conditions and a potential sell signal.
Trend Identification and Pullback trading
Observe the Dynamic Trend's color. When it's on the rise and appears green, it indicates a bullish trend. Conversely, if it's in decline and displayed in red, it signals a bearish trend.
If Dynamic Trend is green and price pulls from above back to the Dynamic Trend, then this can be considered as a bullish signal.
If Dynamic Trend is red and price pulls from below back to the Dynamic Trend, then this can be considered as a bearish signal.
In the event of a bearish signal, such as a bearish TRN Signal Bar, and the Dynamic Trend is red, it provides additional confirmation to the bearish signal. Likewise, bullish signals gain added conviction when the Dynamic Trend is green.
Crossovers
As with other moving averages, crossovers between the Dynamic Trend and the price can be significant.
If price is crossing above the Dynamic Trend, then this can be considered as a bullish signal.
If price is crossing below the Dynamic Trend, then this can be considered as a bearish signal.
If you currently hold a position, both bullish and bearish crossovers can serve as potential exit signals. For instance, in the case of a long position, a bearish crossover can indicate a potential shift in sentiment, signaling a bearish reversal and a potential opportunity to close your long position.
Filtering Noise
Due to its adaptive nature, the Dynamic Trend can be a useful tool to filter out market noise. When the market is choppy or consolidating, the Dynamic Trend tends to remain flat and colored gray, signaling traders to potentially stay out of the market.
Stop Losses
The Dynamic Trend can also be used as a dynamic stop loss. For instance, in a long trade, traders can use the Dynamic Trend as a trailing stop, selling their position if the price crosses below the Dynamic Trend.
Combining TRN Bars, Bar Ranges and Dynamic Trend together
Combining all three concepts gives you a crystal-clear picture of the market. The Dynamic Trend shows you the overall trend. If price pulls back to the dynamic trend line and then price picks up the trend direction again, then the TRN Bars immediately switch the color to the trend direction. Therefore, you can easily identify high probability entry signals based on the bar color.
As a simple trading model, you can set the stop loss below the last swing or below a TRN signal bar (vice versa for short entries) and use 2.5 R or 3 R as target.
You can increase the success rate of the high probability TRN signal bars entries even more if they are in line with the Dynamic Trend line.
On the other hand, the TRN Bar Ranges help you to stay out of the market in case the price does not really change. As a confluence signal to stay flat in this period the dynamic trend line tends to be grey as well. If the price breaks out of the range, then the TRN Bars print a breakout bar which serves as a high probability entry signal.
Although it is possible to switch off any of these concepts, it is highly recommended to use all three in combination to get a crystal-clear picture of the market.
Alerts
Experience the power of our TRN Bars Alerts, delivering real-time notifications for trend changes, price range breakouts, and signal bar formations or confirmations. Stay on top of the market with these versatile alerts, customizable to your preferred assets and timeframes.
Conclusion
While signals from TRN Bars can be informative, it is important to recognize that their reliability may vary. Various external factors can impact market prices, and it is essential to consider your risk tolerance and investment goals when executing trades.
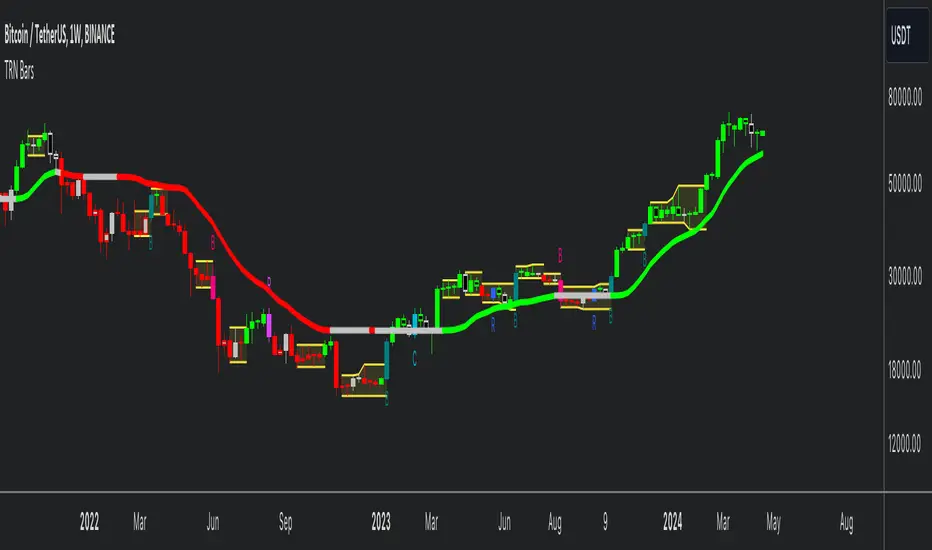
GKD-C XMA Histogram [Loxx]The Giga Kaleidoscope GKD-C XMA Histogram is a Confirmation module included in Loxx's "Giga Kaleidoscope Modularized Trading System."
█ GKD-C XMA Histogram
The "XMA Histogram" utilizes a dynamic approach to analyze market trends through various types of moving averages, including Exponential Moving Average (EMA), Fast Exponential Moving Average (FEMA), Linear Weighted Moving Average (LWMA), Simple Moving Average (SMA), and Smoothed Moving Average (SMMA). This flexibility allows traders to select the moving average that best fits their trading style and market conditions. The indicator calculates the selected moving average over a specified period for a given price source, then examines the difference between the current and previous values of this moving average.
A threshold, adjusted for market precision, determines significant changes. If the change in the moving average exceeds this threshold, it signals potential market momentum. The histogram visualizes this momentum, marking upward momentum with green and downward momentum with red. The XMA Histogram is designed to signal potential entry and exit points, identifying when the price crosses the moving average in a way that suggests a strong trend. This tool is particularly useful for traders looking to capitalize on trends by providing a clear, visual representation of market momentum and direction shifts.
█ Giga Kaleidoscope Modularized Trading System
Core components of an NNFX algorithmic trading strategy
The NNFX algorithm is built on the principles of trend, momentum, and volatility. There are six core components in the NNFX trading algorithm:
1. Volatility - price volatility; e.g., Average True Range, True Range Double, Close-to-Close, etc.
2. Baseline - a moving average to identify price trend
3. Confirmation 1 - a technical indicator used to identify trends
4. Confirmation 2 - a technical indicator used to identify trends
5. Continuation - a technical indicator used to identify trends
6. Volatility/Volume - a technical indicator used to identify volatility/volume breakouts/breakdown
7. Exit - a technical indicator used to determine when a trend is exhausted
8. Metamorphosis - a technical indicator that produces a compound signal from the combination of other GKD indicators*
*(not part of the NNFX algorithm)
What is Volatility in the NNFX trading system?
In the NNFX (No Nonsense Forex) trading system, ATR (Average True Range) is typically used to measure the volatility of an asset. It is used as a part of the system to help determine the appropriate stop loss and take profit levels for a trade. ATR is calculated by taking the average of the true range values over a specified period.
True range is calculated as the maximum of the following values:
-Current high minus the current low
-Absolute value of the current high minus the previous close
-Absolute value of the current low minus the previous close
ATR is a dynamic indicator that changes with changes in volatility. As volatility increases, the value of ATR increases, and as volatility decreases, the value of ATR decreases. By using ATR in NNFX system, traders can adjust their stop loss and take profit levels according to the volatility of the asset being traded. This helps to ensure that the trade is given enough room to move, while also minimizing potential losses.
Other types of volatility include True Range Double (TRD), Close-to-Close, and Garman-Klass
What is a Baseline indicator?
The baseline is essentially a moving average, and is used to determine the overall direction of the market.
The baseline in the NNFX system is used to filter out trades that are not in line with the long-term trend of the market. The baseline is plotted on the chart along with other indicators, such as the Moving Average (MA), the Relative Strength Index (RSI), and the Average True Range (ATR).
Trades are only taken when the price is in the same direction as the baseline. For example, if the baseline is sloping upwards, only long trades are taken, and if the baseline is sloping downwards, only short trades are taken. This approach helps to ensure that trades are in line with the overall trend of the market, and reduces the risk of entering trades that are likely to fail.
By using a baseline in the NNFX system, traders can have a clear reference point for determining the overall trend of the market, and can make more informed trading decisions. The baseline helps to filter out noise and false signals, and ensures that trades are taken in the direction of the long-term trend.
What is a Confirmation indicator?
Confirmation indicators are technical indicators that are used to confirm the signals generated by primary indicators. Primary indicators are the core indicators used in the NNFX system, such as the Average True Range (ATR), the Moving Average (MA), and the Relative Strength Index (RSI).
The purpose of the confirmation indicators is to reduce false signals and improve the accuracy of the trading system. They are designed to confirm the signals generated by the primary indicators by providing additional information about the strength and direction of the trend.
Some examples of confirmation indicators that may be used in the NNFX system include the Bollinger Bands, the MACD (Moving Average Convergence Divergence), and the MACD Oscillator. These indicators can provide information about the volatility, momentum, and trend strength of the market, and can be used to confirm the signals generated by the primary indicators.
In the NNFX system, confirmation indicators are used in combination with primary indicators and other filters to create a trading system that is robust and reliable. By using multiple indicators to confirm trading signals, the system aims to reduce the risk of false signals and improve the overall profitability of the trades.
What is a Continuation indicator?
In the NNFX (No Nonsense Forex) trading system, a continuation indicator is a technical indicator that is used to confirm a current trend and predict that the trend is likely to continue in the same direction. A continuation indicator is typically used in conjunction with other indicators in the system, such as a baseline indicator, to provide a comprehensive trading strategy.
What is a Volatility/Volume indicator?
Volume indicators, such as the On Balance Volume (OBV), the Chaikin Money Flow (CMF), or the Volume Price Trend (VPT), are used to measure the amount of buying and selling activity in a market. They are based on the trading volume of the market, and can provide information about the strength of the trend. In the NNFX system, volume indicators are used to confirm trading signals generated by the Moving Average and the Relative Strength Index. Volatility indicators include Average Direction Index, Waddah Attar, and Volatility Ratio. In the NNFX trading system, volatility is a proxy for volume and vice versa.
By using volume indicators as confirmation tools, the NNFX trading system aims to reduce the risk of false signals and improve the overall profitability of trades. These indicators can provide additional information about the market that is not captured by the primary indicators, and can help traders to make more informed trading decisions. In addition, volume indicators can be used to identify potential changes in market trends and to confirm the strength of price movements.
What is an Exit indicator?
The exit indicator is used in conjunction with other indicators in the system, such as the Moving Average (MA), the Relative Strength Index (RSI), and the Average True Range (ATR), to provide a comprehensive trading strategy.
The exit indicator in the NNFX system can be any technical indicator that is deemed effective at identifying optimal exit points. Examples of exit indicators that are commonly used include the Parabolic SAR, and the Average Directional Index (ADX).
The purpose of the exit indicator is to identify when a trend is likely to reverse or when the market conditions have changed, signaling the need to exit a trade. By using an exit indicator, traders can manage their risk and prevent significant losses.
In the NNFX system, the exit indicator is used in conjunction with a stop loss and a take profit order to maximize profits and minimize losses. The stop loss order is used to limit the amount of loss that can be incurred if the trade goes against the trader, while the take profit order is used to lock in profits when the trade is moving in the trader's favor.
Overall, the use of an exit indicator in the NNFX trading system is an important component of a comprehensive trading strategy. It allows traders to manage their risk effectively and improve the profitability of their trades by exiting at the right time.
What is an Metamorphosis indicator?
The concept of a metamorphosis indicator involves the integration of two or more GKD indicators to generate a compound signal. This is achieved by evaluating the accuracy of each indicator and selecting the signal from the indicator with the highest accuracy. As an illustration, let's consider a scenario where we calculate the accuracy of 10 indicators and choose the signal from the indicator that demonstrates the highest accuracy.
The resulting output from the metamorphosis indicator can then be utilized in a GKD-BT backtest by occupying a slot that aligns with the purpose of the metamorphosis indicator. The slot can be a GKD-B, GKD-C, or GKD-E slot, depending on the specific requirements and objectives of the indicator. This allows for seamless integration and utilization of the compound signal within the GKD-BT framework.
How does Loxx's GKD (Giga Kaleidoscope Modularized Trading System) implement the NNFX algorithm outlined above?
Loxx's GKD v2.0 system has five types of modules (indicators/strategies). These modules are:
1. GKD-BT - Backtesting module (Volatility, Number 1 in the NNFX algorithm)
2. GKD-B - Baseline module (Baseline and Volatility/Volume, Numbers 1 and 2 in the NNFX algorithm)
3. GKD-C - Confirmation 1/2 and Continuation module (Confirmation 1/2 and Continuation, Numbers 3, 4, and 5 in the NNFX algorithm)
4. GKD-V - Volatility/Volume module (Confirmation 1/2, Number 6 in the NNFX algorithm)
5. GKD-E - Exit module (Exit, Number 7 in the NNFX algorithm)
6. GKD-M - Metamorphosis module (Metamorphosis, Number 8 in the NNFX algorithm, but not part of the NNFX algorithm)
(additional module types will added in future releases)
Each module interacts with every module by passing data to A backtest module wherein the various components of the GKD system are combined to create a trading signal.
That is, the Baseline indicator passes its data to Volatility/Volume. The Volatility/Volume indicator passes its values to the Confirmation 1 indicator. The Confirmation 1 indicator passes its values to the Confirmation 2 indicator. The Confirmation 2 indicator passes its values to the Continuation indicator. The Continuation indicator passes its values to the Exit indicator, and finally, the Exit indicator passes its values to the Backtest strategy.
This chaining of indicators requires that each module conform to Loxx's GKD protocol, therefore allowing for the testing of every possible combination of technical indicators that make up the six components of the NNFX algorithm.
What does the application of the GKD trading system look like?
Example trading system:
Backtest: Multi-Ticker CC Backtest
Baseline: Hull Moving Average
Volatility/Volume: Hurst Exponent
Confirmation 1: Advance Trend Pressure as shown on the chart above
Confirmation 2: uf2018
Continuation: Coppock Curve
Exit: Rex Oscillator
Metamorphosis: Baseline Optimizer
Each GKD indicator is denoted with a module identifier of either: GKD-BT, GKD-B, GKD-C, GKD-V, GKD-M, or GKD-E. This allows traders to understand to which module each indicator belongs and where each indicator fits into the GKD system.
█ Giga Kaleidoscope Modularized Trading System Signals
Standard Entry
1. GKD-C Confirmation gives signal
2. Baseline agrees
3. Price inside Goldie Locks Zone Minimum
4. Price inside Goldie Locks Zone Maximum
5. Confirmation 2 agrees
6. Volatility/Volume agrees
1-Candle Standard Entry
1a. GKD-C Confirmation gives signal
2a. Baseline agrees
3a. Price inside Goldie Locks Zone Minimum
4a. Price inside Goldie Locks Zone Maximum
Next Candle
1b. Price retraced
2b. Baseline agrees
3b. Confirmation 1 agrees
4b. Confirmation 2 agrees
5b. Volatility/Volume agrees
Baseline Entry
1. GKD-B Baseline gives signal
2. Confirmation 1 agrees
3. Price inside Goldie Locks Zone Minimum
4. Price inside Goldie Locks Zone Maximum
5. Confirmation 2 agrees
6. Volatility/Volume agrees
7. Confirmation 1 signal was less than 'Maximum Allowable PSBC Bars Back' prior
1-Candle Baseline Entry
1a. GKD-B Baseline gives signal
2a. Confirmation 1 agrees
3a. Price inside Goldie Locks Zone Minimum
4a. Price inside Goldie Locks Zone Maximum
5a. Confirmation 1 signal was less than 'Maximum Allowable PSBC Bars Back' prior
Next Candle
1b. Price retraced
2b. Baseline agrees
3b. Confirmation 1 agrees
4b. Confirmation 2 agrees
5b. Volatility/Volume agrees
Volatility/Volume Entry
1. GKD-V Volatility/Volume gives signal
2. Confirmation 1 agrees
3. Price inside Goldie Locks Zone Minimum
4. Price inside Goldie Locks Zone Maximum
5. Confirmation 2 agrees
6. Baseline agrees
7. Confirmation 1 signal was less than 7 candles prior
1-Candle Volatility/Volume Entry
1a. GKD-V Volatility/Volume gives signal
2a. Confirmation 1 agrees
3a. Price inside Goldie Locks Zone Minimum
4a. Price inside Goldie Locks Zone Maximum
5a. Confirmation 1 signal was less than 'Maximum Allowable PSVVC Bars Back' prior
Next Candle
1b. Price retraced
2b. Volatility/Volume agrees
3b. Confirmation 1 agrees
4b. Confirmation 2 agrees
5b. Baseline agrees
Confirmation 2 Entry
1. GKD-C Confirmation 2 gives signal
2. Confirmation 1 agrees
3. Price inside Goldie Locks Zone Minimum
4. Price inside Goldie Locks Zone Maximum
5. Volatility/Volume agrees
6. Baseline agrees
7. Confirmation 1 signal was less than 7 candles prior
1-Candle Confirmation 2 Entry
1a. GKD-C Confirmation 2 gives signal
2a. Confirmation 1 agrees
3a. Price inside Goldie Locks Zone Minimum
4a. Price inside Goldie Locks Zone Maximum
5a. Confirmation 1 signal was less than 'Maximum Allowable PSC2C Bars Back' prior
Next Candle
1b. Price retraced
2b. Confirmation 2 agrees
3b. Confirmation 1 agrees
4b. Volatility/Volume agrees
5b. Baseline agrees
PullBack Entry
1a. GKD-B Baseline gives signal
2a. Confirmation 1 agrees
3a. Price is beyond 1.0x Volatility of Baseline
Next Candle
1b. Price inside Goldie Locks Zone Minimum
2b. Price inside Goldie Locks Zone Maximum
3b. Confirmation 1 agrees
4b. Confirmation 2 agrees
5b. Volatility/Volume agrees
Continuation Entry
1. Standard Entry, 1-Candle Standard Entry, Baseline Entry, 1-Candle Baseline Entry, Volatility/Volume Entry, 1-Candle Volatility/Volume Entry, Confirmation 2 Entry, 1-Candle Confirmation 2 Entry, or Pullback entry triggered previously
2. Baseline hasn't crossed since entry signal trigger
4. Confirmation 1 agrees
5. Baseline agrees
6. Confirmation 2 agrees

GKD-C Momentum Candles [Loxx]The Giga Kaleidoscope GKD-C Momentum Candles is a Confirmation module included in Loxx's "Giga Kaleidoscope Modularized Trading System."
█ GKD-C Momentum Candles
The Momentum Candles indicator uses the difference between the closing and opening prices divided by the Average True Range (ATR) over 50 periods to calculate momentum. It sets upper and lower thresholds based on an ATR multiplier: the upper threshold (Tresh1) is 1 divided by the ATR multiplier, and the lower threshold (Tresh2) is the negative inverse of this value. These thresholds help identify significant momentum shifts, generating long/short signals.
█ Giga Kaleidoscope Modularized Trading System
Core components of an NNFX algorithmic trading strategy
The NNFX algorithm is built on the principles of trend, momentum, and volatility. There are six core components in the NNFX trading algorithm:
1. Volatility - price volatility; e.g., Average True Range, True Range Double, Close-to-Close, etc.
2. Baseline - a moving average to identify price trend
3. Confirmation 1 - a technical indicator used to identify trends
4. Confirmation 2 - a technical indicator used to identify trends
5. Continuation - a technical indicator used to identify trends
6. Volatility/Volume - a technical indicator used to identify volatility/volume breakouts/breakdown
7. Exit - a technical indicator used to determine when a trend is exhausted
8. Metamorphosis - a technical indicator that produces a compound signal from the combination of other GKD indicators*
*(not part of the NNFX algorithm)
What is Volatility in the NNFX trading system?
In the NNFX (No Nonsense Forex) trading system, ATR (Average True Range) is typically used to measure the volatility of an asset. It is used as a part of the system to help determine the appropriate stop loss and take profit levels for a trade. ATR is calculated by taking the average of the true range values over a specified period.
True range is calculated as the maximum of the following values:
-Current high minus the current low
-Absolute value of the current high minus the previous close
-Absolute value of the current low minus the previous close
ATR is a dynamic indicator that changes with changes in volatility. As volatility increases, the value of ATR increases, and as volatility decreases, the value of ATR decreases. By using ATR in NNFX system, traders can adjust their stop loss and take profit levels according to the volatility of the asset being traded. This helps to ensure that the trade is given enough room to move, while also minimizing potential losses.
Other types of volatility include True Range Double (TRD), Close-to-Close, and Garman-Klass
What is a Baseline indicator?
The baseline is essentially a moving average, and is used to determine the overall direction of the market.
The baseline in the NNFX system is used to filter out trades that are not in line with the long-term trend of the market. The baseline is plotted on the chart along with other indicators, such as the Moving Average (MA), the Relative Strength Index (RSI), and the Average True Range (ATR).
Trades are only taken when the price is in the same direction as the baseline. For example, if the baseline is sloping upwards, only long trades are taken, and if the baseline is sloping downwards, only short trades are taken. This approach helps to ensure that trades are in line with the overall trend of the market, and reduces the risk of entering trades that are likely to fail.
By using a baseline in the NNFX system, traders can have a clear reference point for determining the overall trend of the market, and can make more informed trading decisions. The baseline helps to filter out noise and false signals, and ensures that trades are taken in the direction of the long-term trend.
What is a Confirmation indicator?
Confirmation indicators are technical indicators that are used to confirm the signals generated by primary indicators. Primary indicators are the core indicators used in the NNFX system, such as the Average True Range (ATR), the Moving Average (MA), and the Relative Strength Index (RSI).
The purpose of the confirmation indicators is to reduce false signals and improve the accuracy of the trading system. They are designed to confirm the signals generated by the primary indicators by providing additional information about the strength and direction of the trend.
Some examples of confirmation indicators that may be used in the NNFX system include the Bollinger Bands, the MACD (Moving Average Convergence Divergence), and the MACD Oscillator. These indicators can provide information about the volatility, momentum, and trend strength of the market, and can be used to confirm the signals generated by the primary indicators.
In the NNFX system, confirmation indicators are used in combination with primary indicators and other filters to create a trading system that is robust and reliable. By using multiple indicators to confirm trading signals, the system aims to reduce the risk of false signals and improve the overall profitability of the trades.
What is a Continuation indicator?
In the NNFX (No Nonsense Forex) trading system, a continuation indicator is a technical indicator that is used to confirm a current trend and predict that the trend is likely to continue in the same direction. A continuation indicator is typically used in conjunction with other indicators in the system, such as a baseline indicator, to provide a comprehensive trading strategy.
What is a Volatility/Volume indicator?
Volume indicators, such as the On Balance Volume (OBV), the Chaikin Money Flow (CMF), or the Volume Price Trend (VPT), are used to measure the amount of buying and selling activity in a market. They are based on the trading volume of the market, and can provide information about the strength of the trend. In the NNFX system, volume indicators are used to confirm trading signals generated by the Moving Average and the Relative Strength Index. Volatility indicators include Average Direction Index, Waddah Attar, and Volatility Ratio. In the NNFX trading system, volatility is a proxy for volume and vice versa.
By using volume indicators as confirmation tools, the NNFX trading system aims to reduce the risk of false signals and improve the overall profitability of trades. These indicators can provide additional information about the market that is not captured by the primary indicators, and can help traders to make more informed trading decisions. In addition, volume indicators can be used to identify potential changes in market trends and to confirm the strength of price movements.
What is an Exit indicator?
The exit indicator is used in conjunction with other indicators in the system, such as the Moving Average (MA), the Relative Strength Index (RSI), and the Average True Range (ATR), to provide a comprehensive trading strategy.
The exit indicator in the NNFX system can be any technical indicator that is deemed effective at identifying optimal exit points. Examples of exit indicators that are commonly used include the Parabolic SAR, and the Average Directional Index (ADX).
The purpose of the exit indicator is to identify when a trend is likely to reverse or when the market conditions have changed, signaling the need to exit a trade. By using an exit indicator, traders can manage their risk and prevent significant losses.
In the NNFX system, the exit indicator is used in conjunction with a stop loss and a take profit order to maximize profits and minimize losses. The stop loss order is used to limit the amount of loss that can be incurred if the trade goes against the trader, while the take profit order is used to lock in profits when the trade is moving in the trader's favor.
Overall, the use of an exit indicator in the NNFX trading system is an important component of a comprehensive trading strategy. It allows traders to manage their risk effectively and improve the profitability of their trades by exiting at the right time.
What is an Metamorphosis indicator?
The concept of a metamorphosis indicator involves the integration of two or more GKD indicators to generate a compound signal. This is achieved by evaluating the accuracy of each indicator and selecting the signal from the indicator with the highest accuracy. As an illustration, let's consider a scenario where we calculate the accuracy of 10 indicators and choose the signal from the indicator that demonstrates the highest accuracy.
The resulting output from the metamorphosis indicator can then be utilized in a GKD-BT backtest by occupying a slot that aligns with the purpose of the metamorphosis indicator. The slot can be a GKD-B, GKD-C, or GKD-E slot, depending on the specific requirements and objectives of the indicator. This allows for seamless integration and utilization of the compound signal within the GKD-BT framework.
How does Loxx's GKD (Giga Kaleidoscope Modularized Trading System) implement the NNFX algorithm outlined above?
Loxx's GKD v2.0 system has five types of modules (indicators/strategies). These modules are:
1. GKD-BT - Backtesting module (Volatility, Number 1 in the NNFX algorithm)
2. GKD-B - Baseline module (Baseline and Volatility/Volume, Numbers 1 and 2 in the NNFX algorithm)
3. GKD-C - Confirmation 1/2 and Continuation module (Confirmation 1/2 and Continuation, Numbers 3, 4, and 5 in the NNFX algorithm)
4. GKD-V - Volatility/Volume module (Confirmation 1/2, Number 6 in the NNFX algorithm)
5. GKD-E - Exit module (Exit, Number 7 in the NNFX algorithm)
6. GKD-M - Metamorphosis module (Metamorphosis, Number 8 in the NNFX algorithm, but not part of the NNFX algorithm)
(additional module types will added in future releases)
Each module interacts with every module by passing data to A backtest module wherein the various components of the GKD system are combined to create a trading signal.
That is, the Baseline indicator passes its data to Volatility/Volume. The Volatility/Volume indicator passes its values to the Confirmation 1 indicator. The Confirmation 1 indicator passes its values to the Confirmation 2 indicator. The Confirmation 2 indicator passes its values to the Continuation indicator. The Continuation indicator passes its values to the Exit indicator, and finally, the Exit indicator passes its values to the Backtest strategy.
This chaining of indicators requires that each module conform to Loxx's GKD protocol, therefore allowing for the testing of every possible combination of technical indicators that make up the six components of the NNFX algorithm.
What does the application of the GKD trading system look like?
Example trading system:
Backtest: Multi-Ticker CC Backtest
Baseline: Hull Moving Average
Volatility/Volume: Hurst Exponent
Confirmation 1: Advance Trend Pressure as shown on the chart above
Confirmation 2: uf2018
Continuation: Coppock Curve
Exit: Rex Oscillator
Metamorphosis: Baseline Optimizer
Each GKD indicator is denoted with a module identifier of either: GKD-BT, GKD-B, GKD-C, GKD-V, GKD-M, or GKD-E. This allows traders to understand to which module each indicator belongs and where each indicator fits into the GKD system.
█ Giga Kaleidoscope Modularized Trading System Signals
Standard Entry
1. GKD-C Confirmation gives signal
2. Baseline agrees
3. Price inside Goldie Locks Zone Minimum
4. Price inside Goldie Locks Zone Maximum
5. Confirmation 2 agrees
6. Volatility/Volume agrees
1-Candle Standard Entry
1a. GKD-C Confirmation gives signal
2a. Baseline agrees
3a. Price inside Goldie Locks Zone Minimum
4a. Price inside Goldie Locks Zone Maximum
Next Candle
1b. Price retraced
2b. Baseline agrees
3b. Confirmation 1 agrees
4b. Confirmation 2 agrees
5b. Volatility/Volume agrees
Baseline Entry
1. GKD-B Baseline gives signal
2. Confirmation 1 agrees
3. Price inside Goldie Locks Zone Minimum
4. Price inside Goldie Locks Zone Maximum
5. Confirmation 2 agrees
6. Volatility/Volume agrees
7. Confirmation 1 signal was less than 'Maximum Allowable PSBC Bars Back' prior
1-Candle Baseline Entry
1a. GKD-B Baseline gives signal
2a. Confirmation 1 agrees
3a. Price inside Goldie Locks Zone Minimum
4a. Price inside Goldie Locks Zone Maximum
5a. Confirmation 1 signal was less than 'Maximum Allowable PSBC Bars Back' prior
Next Candle
1b. Price retraced
2b. Baseline agrees
3b. Confirmation 1 agrees
4b. Confirmation 2 agrees
5b. Volatility/Volume agrees
Volatility/Volume Entry
1. GKD-V Volatility/Volume gives signal
2. Confirmation 1 agrees
3. Price inside Goldie Locks Zone Minimum
4. Price inside Goldie Locks Zone Maximum
5. Confirmation 2 agrees
6. Baseline agrees
7. Confirmation 1 signal was less than 7 candles prior
1-Candle Volatility/Volume Entry
1a. GKD-V Volatility/Volume gives signal
2a. Confirmation 1 agrees
3a. Price inside Goldie Locks Zone Minimum
4a. Price inside Goldie Locks Zone Maximum
5a. Confirmation 1 signal was less than 'Maximum Allowable PSVVC Bars Back' prior
Next Candle
1b. Price retraced
2b. Volatility/Volume agrees
3b. Confirmation 1 agrees
4b. Confirmation 2 agrees
5b. Baseline agrees
Confirmation 2 Entry
1. GKD-C Confirmation 2 gives signal
2. Confirmation 1 agrees
3. Price inside Goldie Locks Zone Minimum
4. Price inside Goldie Locks Zone Maximum
5. Volatility/Volume agrees
6. Baseline agrees
7. Confirmation 1 signal was less than 7 candles prior
1-Candle Confirmation 2 Entry
1a. GKD-C Confirmation 2 gives signal
2a. Confirmation 1 agrees
3a. Price inside Goldie Locks Zone Minimum
4a. Price inside Goldie Locks Zone Maximum
5a. Confirmation 1 signal was less than 'Maximum Allowable PSC2C Bars Back' prior
Next Candle
1b. Price retraced
2b. Confirmation 2 agrees
3b. Confirmation 1 agrees
4b. Volatility/Volume agrees
5b. Baseline agrees
PullBack Entry
1a. GKD-B Baseline gives signal
2a. Confirmation 1 agrees
3a. Price is beyond 1.0x Volatility of Baseline
Next Candle
1b. Price inside Goldie Locks Zone Minimum
2b. Price inside Goldie Locks Zone Maximum
3b. Confirmation 1 agrees
4b. Confirmation 2 agrees
5b. Volatility/Volume agrees
Continuation Entry
1. Standard Entry, 1-Candle Standard Entry, Baseline Entry, 1-Candle Baseline Entry, Volatility/Volume Entry, 1-Candle Volatility/Volume Entry, Confirmation 2 Entry, 1-Candle Confirmation 2 Entry, or Pullback entry triggered previously
2. Baseline hasn't crossed since entry signal trigger
4. Confirmation 1 agrees
5. Baseline agrees
6. Confirmation 2 agrees

GKD-C Schaff Trend, Volty-adaptive RSX [Loxx]The Giga Kaleidoscope GKD-C Schaff Trend, Volty-adaptive RSX is a Confirmation module included in Loxx's "Giga Kaleidoscope Modularized Trading System."
█ GKD-C Schaff Trend, Volty-adaptive RSX
The "Schaff Trend Cycle Jurik Volty Adaptive RSX" merges sophisticated analytical techniques to offer nuanced insights into market trends and cycles, emphasizing adaptability and precision. It marries the concept of RSX (Relative Strength Index modified by Jurik's smoothing) with a dynamically adjusted volatility coefficient, aiming to enhance the indicator's responsiveness and accuracy under varying market conditions.
The process begins by focusing on the market's momentum, a critical component that reflects the pace and direction of price movements. To capture and refine this momentum, the indicator employs a series of calculations that progressively smooth and iterate the data. This iterative smoothing is not arbitrary; it is meticulously calibrated to balance sensitivity to recent price movements against the historical price context, ensuring that the signal remains both timely and stable.
Simultaneously, the volatility of the market is meticulously analyzed through a separate but complementary mechanism. This part of the indicator calculates a volatility coefficient, a value that adjusts based on the observed market volatility. This coefficient is not static; it dynamically adapts, scaling the analysis based on the complexity and volatility of price movements. By evaluating how wildly or tamely prices are fluctuating, the volatility coefficient fine-tunes the indicator's overall sensitivity, making it more attuned to real-time market conditions.
Incorporating the RSX into this mix brings a layer of sophistication. The RSX, known for its smoothness and reduced lag compared to traditional RSI, is further refined by applying the volatility coefficient. This application ensures that the RSX's sensitivity is modulated according to the volatility of the market, allowing for a more nuanced and adaptive measure of price momentum.
The final output is a harmonious blend of smoothed momentum and volatility-adjusted sensitivity. This fusion creates a highly adaptive and responsive indicator, capable of identifying trend changes and market cycles with a high degree of precision. By adjusting its parameters in real-time, the Schaff Trend Cycle Jurik Volty Adaptive RSX stands out as a versatile tool, offering traders insights that are both deep and immediately relevant, tailored to the ever-changing tapestry of market dynamics.
█ Giga Kaleidoscope Modularized Trading System
Core components of an NNFX algorithmic trading strategy
The NNFX algorithm is built on the principles of trend, momentum, and volatility. There are six core components in the NNFX trading algorithm:
1. Volatility - price volatility; e.g., Average True Range, True Range Double, Close-to-Close, etc.
2. Baseline - a moving average to identify price trend
3. Confirmation 1 - a technical indicator used to identify trends
4. Confirmation 2 - a technical indicator used to identify trends
5. Continuation - a technical indicator used to identify trends
6. Volatility/Volume - a technical indicator used to identify volatility/volume breakouts/breakdown
7. Exit - a technical indicator used to determine when a trend is exhausted
8. Metamorphosis - a technical indicator that produces a compound signal from the combination of other GKD indicators*
*(not part of the NNFX algorithm)
What is Volatility in the NNFX trading system?
In the NNFX (No Nonsense Forex) trading system, ATR (Average True Range) is typically used to measure the volatility of an asset. It is used as a part of the system to help determine the appropriate stop loss and take profit levels for a trade. ATR is calculated by taking the average of the true range values over a specified period.
True range is calculated as the maximum of the following values:
-Current high minus the current low
-Absolute value of the current high minus the previous close
-Absolute value of the current low minus the previous close
ATR is a dynamic indicator that changes with changes in volatility. As volatility increases, the value of ATR increases, and as volatility decreases, the value of ATR decreases. By using ATR in NNFX system, traders can adjust their stop loss and take profit levels according to the volatility of the asset being traded. This helps to ensure that the trade is given enough room to move, while also minimizing potential losses.
Other types of volatility include True Range Double (TRD), Close-to-Close, and Garman-Klass
What is a Baseline indicator?
The baseline is essentially a moving average, and is used to determine the overall direction of the market.
The baseline in the NNFX system is used to filter out trades that are not in line with the long-term trend of the market. The baseline is plotted on the chart along with other indicators, such as the Moving Average (MA), the Relative Strength Index (RSI), and the Average True Range (ATR).
Trades are only taken when the price is in the same direction as the baseline. For example, if the baseline is sloping upwards, only long trades are taken, and if the baseline is sloping downwards, only short trades are taken. This approach helps to ensure that trades are in line with the overall trend of the market, and reduces the risk of entering trades that are likely to fail.
By using a baseline in the NNFX system, traders can have a clear reference point for determining the overall trend of the market, and can make more informed trading decisions. The baseline helps to filter out noise and false signals, and ensures that trades are taken in the direction of the long-term trend.
What is a Confirmation indicator?
Confirmation indicators are technical indicators that are used to confirm the signals generated by primary indicators. Primary indicators are the core indicators used in the NNFX system, such as the Average True Range (ATR), the Moving Average (MA), and the Relative Strength Index (RSI).
The purpose of the confirmation indicators is to reduce false signals and improve the accuracy of the trading system. They are designed to confirm the signals generated by the primary indicators by providing additional information about the strength and direction of the trend.
Some examples of confirmation indicators that may be used in the NNFX system include the Bollinger Bands, the MACD (Moving Average Convergence Divergence), and the MACD Oscillator. These indicators can provide information about the volatility, momentum, and trend strength of the market, and can be used to confirm the signals generated by the primary indicators.
In the NNFX system, confirmation indicators are used in combination with primary indicators and other filters to create a trading system that is robust and reliable. By using multiple indicators to confirm trading signals, the system aims to reduce the risk of false signals and improve the overall profitability of the trades.
What is a Continuation indicator?
In the NNFX (No Nonsense Forex) trading system, a continuation indicator is a technical indicator that is used to confirm a current trend and predict that the trend is likely to continue in the same direction. A continuation indicator is typically used in conjunction with other indicators in the system, such as a baseline indicator, to provide a comprehensive trading strategy.
What is a Volatility/Volume indicator?
Volume indicators, such as the On Balance Volume (OBV), the Chaikin Money Flow (CMF), or the Volume Price Trend (VPT), are used to measure the amount of buying and selling activity in a market. They are based on the trading volume of the market, and can provide information about the strength of the trend. In the NNFX system, volume indicators are used to confirm trading signals generated by the Moving Average and the Relative Strength Index. Volatility indicators include Average Direction Index, Waddah Attar, and Volatility Ratio. In the NNFX trading system, volatility is a proxy for volume and vice versa.
By using volume indicators as confirmation tools, the NNFX trading system aims to reduce the risk of false signals and improve the overall profitability of trades. These indicators can provide additional information about the market that is not captured by the primary indicators, and can help traders to make more informed trading decisions. In addition, volume indicators can be used to identify potential changes in market trends and to confirm the strength of price movements.
What is an Exit indicator?
The exit indicator is used in conjunction with other indicators in the system, such as the Moving Average (MA), the Relative Strength Index (RSI), and the Average True Range (ATR), to provide a comprehensive trading strategy.
The exit indicator in the NNFX system can be any technical indicator that is deemed effective at identifying optimal exit points. Examples of exit indicators that are commonly used include the Parabolic SAR, and the Average Directional Index (ADX).
The purpose of the exit indicator is to identify when a trend is likely to reverse or when the market conditions have changed, signaling the need to exit a trade. By using an exit indicator, traders can manage their risk and prevent significant losses.
In the NNFX system, the exit indicator is used in conjunction with a stop loss and a take profit order to maximize profits and minimize losses. The stop loss order is used to limit the amount of loss that can be incurred if the trade goes against the trader, while the take profit order is used to lock in profits when the trade is moving in the trader's favor.
Overall, the use of an exit indicator in the NNFX trading system is an important component of a comprehensive trading strategy. It allows traders to manage their risk effectively and improve the profitability of their trades by exiting at the right time.
What is an Metamorphosis indicator?
The concept of a metamorphosis indicator involves the integration of two or more GKD indicators to generate a compound signal. This is achieved by evaluating the accuracy of each indicator and selecting the signal from the indicator with the highest accuracy. As an illustration, let's consider a scenario where we calculate the accuracy of 10 indicators and choose the signal from the indicator that demonstrates the highest accuracy.
The resulting output from the metamorphosis indicator can then be utilized in a GKD-BT backtest by occupying a slot that aligns with the purpose of the metamorphosis indicator. The slot can be a GKD-B, GKD-C, or GKD-E slot, depending on the specific requirements and objectives of the indicator. This allows for seamless integration and utilization of the compound signal within the GKD-BT framework.
How does Loxx's GKD (Giga Kaleidoscope Modularized Trading System) implement the NNFX algorithm outlined above?
Loxx's GKD v2.0 system has five types of modules (indicators/strategies). These modules are:
1. GKD-BT - Backtesting module (Volatility, Number 1 in the NNFX algorithm)
2. GKD-B - Baseline module (Baseline and Volatility/Volume, Numbers 1 and 2 in the NNFX algorithm)
3. GKD-C - Confirmation 1/2 and Continuation module (Confirmation 1/2 and Continuation, Numbers 3, 4, and 5 in the NNFX algorithm)
4. GKD-V - Volatility/Volume module (Confirmation 1/2, Number 6 in the NNFX algorithm)
5. GKD-E - Exit module (Exit, Number 7 in the NNFX algorithm)
6. GKD-M - Metamorphosis module (Metamorphosis, Number 8 in the NNFX algorithm, but not part of the NNFX algorithm)
(additional module types will added in future releases)
Each module interacts with every module by passing data to A backtest module wherein the various components of the GKD system are combined to create a trading signal.
That is, the Baseline indicator passes its data to Volatility/Volume. The Volatility/Volume indicator passes its values to the Confirmation 1 indicator. The Confirmation 1 indicator passes its values to the Confirmation 2 indicator. The Confirmation 2 indicator passes its values to the Continuation indicator. The Continuation indicator passes its values to the Exit indicator, and finally, the Exit indicator passes its values to the Backtest strategy.
This chaining of indicators requires that each module conform to Loxx's GKD protocol, therefore allowing for the testing of every possible combination of technical indicators that make up the six components of the NNFX algorithm.
What does the application of the GKD trading system look like?
Example trading system:
Backtest: Multi-Ticker CC Backtest
Baseline: Hull Moving Average
Volatility/Volume: Hurst Exponent
Confirmation 1: Advance Trend Pressure as shown on the chart above
Confirmation 2: uf2018
Continuation: Coppock Curve
Exit: Rex Oscillator
Metamorphosis: Baseline Optimizer
Each GKD indicator is denoted with a module identifier of either: GKD-BT, GKD-B, GKD-C, GKD-V, GKD-M, or GKD-E. This allows traders to understand to which module each indicator belongs and where each indicator fits into the GKD system.
█ Giga Kaleidoscope Modularized Trading System Signals
Standard Entry
1. GKD-C Confirmation gives signal
2. Baseline agrees
3. Price inside Goldie Locks Zone Minimum
4. Price inside Goldie Locks Zone Maximum
5. Confirmation 2 agrees
6. Volatility/Volume agrees
1-Candle Standard Entry
1a. GKD-C Confirmation gives signal
2a. Baseline agrees
3a. Price inside Goldie Locks Zone Minimum
4a. Price inside Goldie Locks Zone Maximum
Next Candle
1b. Price retraced
2b. Baseline agrees
3b. Confirmation 1 agrees
4b. Confirmation 2 agrees
5b. Volatility/Volume agrees
Baseline Entry
1. GKD-B Baseline gives signal
2. Confirmation 1 agrees
3. Price inside Goldie Locks Zone Minimum
4. Price inside Goldie Locks Zone Maximum
5. Confirmation 2 agrees
6. Volatility/Volume agrees
7. Confirmation 1 signal was less than 'Maximum Allowable PSBC Bars Back' prior
1-Candle Baseline Entry
1a. GKD-B Baseline gives signal
2a. Confirmation 1 agrees
3a. Price inside Goldie Locks Zone Minimum
4a. Price inside Goldie Locks Zone Maximum
5a. Confirmation 1 signal was less than 'Maximum Allowable PSBC Bars Back' prior
Next Candle
1b. Price retraced
2b. Baseline agrees
3b. Confirmation 1 agrees
4b. Confirmation 2 agrees
5b. Volatility/Volume agrees
Volatility/Volume Entry
1. GKD-V Volatility/Volume gives signal
2. Confirmation 1 agrees
3. Price inside Goldie Locks Zone Minimum
4. Price inside Goldie Locks Zone Maximum
5. Confirmation 2 agrees
6. Baseline agrees
7. Confirmation 1 signal was less than 7 candles prior
1-Candle Volatility/Volume Entry
1a. GKD-V Volatility/Volume gives signal
2a. Confirmation 1 agrees
3a. Price inside Goldie Locks Zone Minimum
4a. Price inside Goldie Locks Zone Maximum
5a. Confirmation 1 signal was less than 'Maximum Allowable PSVVC Bars Back' prior
Next Candle
1b. Price retraced
2b. Volatility/Volume agrees
3b. Confirmation 1 agrees
4b. Confirmation 2 agrees
5b. Baseline agrees
Confirmation 2 Entry
1. GKD-C Confirmation 2 gives signal
2. Confirmation 1 agrees
3. Price inside Goldie Locks Zone Minimum
4. Price inside Goldie Locks Zone Maximum
5. Volatility/Volume agrees
6. Baseline agrees
7. Confirmation 1 signal was less than 7 candles prior
1-Candle Confirmation 2 Entry
1a. GKD-C Confirmation 2 gives signal
2a. Confirmation 1 agrees
3a. Price inside Goldie Locks Zone Minimum
4a. Price inside Goldie Locks Zone Maximum
5a. Confirmation 1 signal was less than 'Maximum Allowable PSC2C Bars Back' prior
Next Candle
1b. Price retraced
2b. Confirmation 2 agrees
3b. Confirmation 1 agrees
4b. Volatility/Volume agrees
5b. Baseline agrees
PullBack Entry
1a. GKD-B Baseline gives signal
2a. Confirmation 1 agrees
3a. Price is beyond 1.0x Volatility of Baseline
Next Candle
1b. Price inside Goldie Locks Zone Minimum
2b. Price inside Goldie Locks Zone Maximum
3b. Confirmation 1 agrees
4b. Confirmation 2 agrees
5b. Volatility/Volume agrees
Continuation Entry
1. Standard Entry, 1-Candle Standard Entry, Baseline Entry, 1-Candle Baseline Entry, Volatility/Volume Entry, 1-Candle Volatility/Volume Entry, Confirmation 2 Entry, 1-Candle Confirmation 2 Entry, or Pullback entry triggered previously
2. Baseline hasn't crossed since entry signal trigger
4. Confirmation 1 agrees
5. Baseline agrees
6. Confirmation 2 agrees
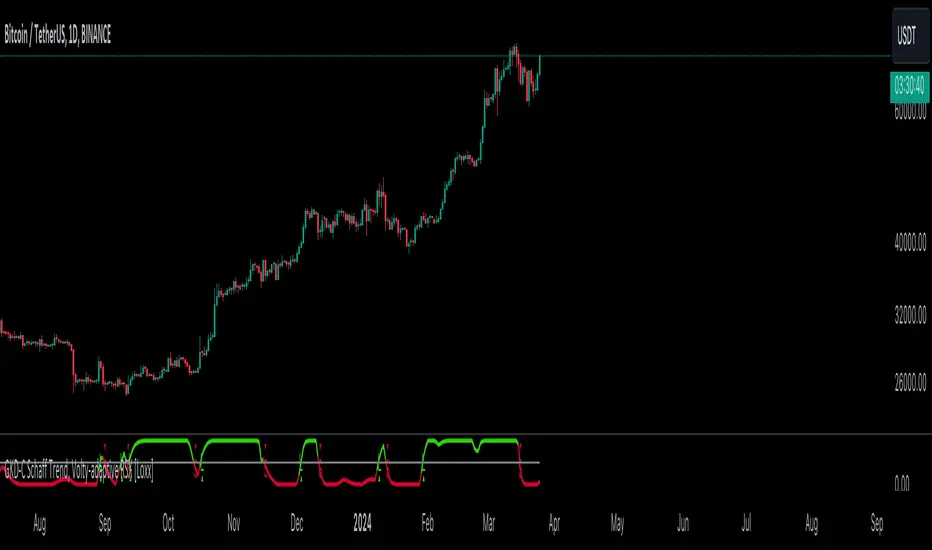
GKD-C Hodrick-Prescott Filter [Loxx]The Giga Kaleidoscope GKD-C Hodrick-Prescott Filter is a Confirmation module included in Loxx's "Giga Kaleidoscope Modularized Trading System."
█ GKD-C Hodrick-Prescott Filter
The Hodrick-Prescott (HP) filter is a mathematical tool used in macroeconomics to separate a time series into its trend component and its cyclical component. It was developed by economists Robert Hodrick and Edward Prescott in 1980.
The HP filter works by decomposing a time series into two components: a trend component and a cyclical component. The trend component represents the long-term behavior of the time series, while the cyclical component represents the short-term fluctuations around the trend.
The HP filter is based on the assumption that the trend component of a time series varies smoothly over time, while the cyclical component varies more rapidly. The filter uses a mathematical algorithm to estimate the trend component of the time series, and then subtracts the trend from the original time series to obtain the cyclical component.
The HP filter is widely used in macroeconomics to analyze business cycles, as it allows researchers to separate the underlying trend in economic data from the short-term fluctuations. It is also used in finance to analyze asset prices, and in other fields where time series analysis is important.
█ Giga Kaleidoscope Modularized Trading System
Core components of an NNFX algorithmic trading strategy
The NNFX algorithm is built on the principles of trend, momentum, and volatility. There are six core components in the NNFX trading algorithm:
1. Volatility - price volatility; e.g., Average True Range, True Range Double, Close-to-Close, etc.
2. Baseline - a moving average to identify price trend
3. Confirmation 1 - a technical indicator used to identify trends
4. Confirmation 2 - a technical indicator used to identify trends
5. Continuation - a technical indicator used to identify trends
6. Volatility/Volume - a technical indicator used to identify volatility/volume breakouts/breakdown
7. Exit - a technical indicator used to determine when a trend is exhausted
8. Metamorphosis - a technical indicator that produces a compound signal from the combination of other GKD indicators*
*(not part of the NNFX algorithm)
What is Volatility in the NNFX trading system?
In the NNFX (No Nonsense Forex) trading system, ATR (Average True Range) is typically used to measure the volatility of an asset. It is used as a part of the system to help determine the appropriate stop loss and take profit levels for a trade. ATR is calculated by taking the average of the true range values over a specified period.
True range is calculated as the maximum of the following values:
-Current high minus the current low
-Absolute value of the current high minus the previous close
-Absolute value of the current low minus the previous close
ATR is a dynamic indicator that changes with changes in volatility. As volatility increases, the value of ATR increases, and as volatility decreases, the value of ATR decreases. By using ATR in NNFX system, traders can adjust their stop loss and take profit levels according to the volatility of the asset being traded. This helps to ensure that the trade is given enough room to move, while also minimizing potential losses.
Other types of volatility include True Range Double (TRD), Close-to-Close, and Garman-Klass
What is a Baseline indicator?
The baseline is essentially a moving average, and is used to determine the overall direction of the market.
The baseline in the NNFX system is used to filter out trades that are not in line with the long-term trend of the market. The baseline is plotted on the chart along with other indicators, such as the Moving Average (MA), the Relative Strength Index (RSI), and the Average True Range (ATR).
Trades are only taken when the price is in the same direction as the baseline. For example, if the baseline is sloping upwards, only long trades are taken, and if the baseline is sloping downwards, only short trades are taken. This approach helps to ensure that trades are in line with the overall trend of the market, and reduces the risk of entering trades that are likely to fail.
By using a baseline in the NNFX system, traders can have a clear reference point for determining the overall trend of the market, and can make more informed trading decisions. The baseline helps to filter out noise and false signals, and ensures that trades are taken in the direction of the long-term trend.
What is a Confirmation indicator?
Confirmation indicators are technical indicators that are used to confirm the signals generated by primary indicators. Primary indicators are the core indicators used in the NNFX system, such as the Average True Range (ATR), the Moving Average (MA), and the Relative Strength Index (RSI).
The purpose of the confirmation indicators is to reduce false signals and improve the accuracy of the trading system. They are designed to confirm the signals generated by the primary indicators by providing additional information about the strength and direction of the trend.
Some examples of confirmation indicators that may be used in the NNFX system include the Bollinger Bands, the MACD (Moving Average Convergence Divergence), and the MACD Oscillator. These indicators can provide information about the volatility, momentum, and trend strength of the market, and can be used to confirm the signals generated by the primary indicators.
In the NNFX system, confirmation indicators are used in combination with primary indicators and other filters to create a trading system that is robust and reliable. By using multiple indicators to confirm trading signals, the system aims to reduce the risk of false signals and improve the overall profitability of the trades.
What is a Continuation indicator?
In the NNFX (No Nonsense Forex) trading system, a continuation indicator is a technical indicator that is used to confirm a current trend and predict that the trend is likely to continue in the same direction. A continuation indicator is typically used in conjunction with other indicators in the system, such as a baseline indicator, to provide a comprehensive trading strategy.
What is a Volatility/Volume indicator?
Volume indicators, such as the On Balance Volume (OBV), the Chaikin Money Flow (CMF), or the Volume Price Trend (VPT), are used to measure the amount of buying and selling activity in a market. They are based on the trading volume of the market, and can provide information about the strength of the trend. In the NNFX system, volume indicators are used to confirm trading signals generated by the Moving Average and the Relative Strength Index. Volatility indicators include Average Direction Index, Waddah Attar, and Volatility Ratio. In the NNFX trading system, volatility is a proxy for volume and vice versa.
By using volume indicators as confirmation tools, the NNFX trading system aims to reduce the risk of false signals and improve the overall profitability of trades. These indicators can provide additional information about the market that is not captured by the primary indicators, and can help traders to make more informed trading decisions. In addition, volume indicators can be used to identify potential changes in market trends and to confirm the strength of price movements.
What is an Exit indicator?
The exit indicator is used in conjunction with other indicators in the system, such as the Moving Average (MA), the Relative Strength Index (RSI), and the Average True Range (ATR), to provide a comprehensive trading strategy.
The exit indicator in the NNFX system can be any technical indicator that is deemed effective at identifying optimal exit points. Examples of exit indicators that are commonly used include the Parabolic SAR, and the Average Directional Index (ADX).
The purpose of the exit indicator is to identify when a trend is likely to reverse or when the market conditions have changed, signaling the need to exit a trade. By using an exit indicator, traders can manage their risk and prevent significant losses.
In the NNFX system, the exit indicator is used in conjunction with a stop loss and a take profit order to maximize profits and minimize losses. The stop loss order is used to limit the amount of loss that can be incurred if the trade goes against the trader, while the take profit order is used to lock in profits when the trade is moving in the trader's favor.
Overall, the use of an exit indicator in the NNFX trading system is an important component of a comprehensive trading strategy. It allows traders to manage their risk effectively and improve the profitability of their trades by exiting at the right time.
What is an Metamorphosis indicator?
The concept of a metamorphosis indicator involves the integration of two or more GKD indicators to generate a compound signal. This is achieved by evaluating the accuracy of each indicator and selecting the signal from the indicator with the highest accuracy. As an illustration, let's consider a scenario where we calculate the accuracy of 10 indicators and choose the signal from the indicator that demonstrates the highest accuracy.
The resulting output from the metamorphosis indicator can then be utilized in a GKD-BT backtest by occupying a slot that aligns with the purpose of the metamorphosis indicator. The slot can be a GKD-B, GKD-C, or GKD-E slot, depending on the specific requirements and objectives of the indicator. This allows for seamless integration and utilization of the compound signal within the GKD-BT framework.
How does Loxx's GKD (Giga Kaleidoscope Modularized Trading System) implement the NNFX algorithm outlined above?
Loxx's GKD v2.0 system has five types of modules (indicators/strategies). These modules are:
1. GKD-BT - Backtesting module (Volatility, Number 1 in the NNFX algorithm)
2. GKD-B - Baseline module (Baseline and Volatility/Volume, Numbers 1 and 2 in the NNFX algorithm)
3. GKD-C - Confirmation 1/2 and Continuation module (Confirmation 1/2 and Continuation, Numbers 3, 4, and 5 in the NNFX algorithm)
4. GKD-V - Volatility/Volume module (Confirmation 1/2, Number 6 in the NNFX algorithm)
5. GKD-E - Exit module (Exit, Number 7 in the NNFX algorithm)
6. GKD-M - Metamorphosis module (Metamorphosis, Number 8 in the NNFX algorithm, but not part of the NNFX algorithm)
(additional module types will added in future releases)
Each module interacts with every module by passing data to A backtest module wherein the various components of the GKD system are combined to create a trading signal.
That is, the Baseline indicator passes its data to Volatility/Volume. The Volatility/Volume indicator passes its values to the Confirmation 1 indicator. The Confirmation 1 indicator passes its values to the Confirmation 2 indicator. The Confirmation 2 indicator passes its values to the Continuation indicator. The Continuation indicator passes its values to the Exit indicator, and finally, the Exit indicator passes its values to the Backtest strategy.
This chaining of indicators requires that each module conform to Loxx's GKD protocol, therefore allowing for the testing of every possible combination of technical indicators that make up the six components of the NNFX algorithm.
What does the application of the GKD trading system look like?
Example trading system:
Backtest: Multi-Ticker CC Backtest
Baseline: Hull Moving Average
Volatility/Volume: Hurst Exponent
Confirmation 1: Advance Trend Pressure as shown on the chart above
Confirmation 2: uf2018
Continuation: Coppock Curve
Exit: Rex Oscillator
Metamorphosis: Baseline Optimizer
Each GKD indicator is denoted with a module identifier of either: GKD-BT, GKD-B, GKD-C, GKD-V, GKD-M, or GKD-E. This allows traders to understand to which module each indicator belongs and where each indicator fits into the GKD system.
█ Giga Kaleidoscope Modularized Trading System Signals
Standard Entry
1. GKD-C Confirmation gives signal
2. Baseline agrees
3. Price inside Goldie Locks Zone Minimum
4. Price inside Goldie Locks Zone Maximum
5. Confirmation 2 agrees
6. Volatility/Volume agrees
1-Candle Standard Entry
1a. GKD-C Confirmation gives signal
2a. Baseline agrees
3a. Price inside Goldie Locks Zone Minimum
4a. Price inside Goldie Locks Zone Maximum
Next Candle
1b. Price retraced
2b. Baseline agrees
3b. Confirmation 1 agrees
4b. Confirmation 2 agrees
5b. Volatility/Volume agrees
Baseline Entry
1. GKD-B Baseline gives signal
2. Confirmation 1 agrees
3. Price inside Goldie Locks Zone Minimum
4. Price inside Goldie Locks Zone Maximum
5. Confirmation 2 agrees
6. Volatility/Volume agrees
7. Confirmation 1 signal was less than 'Maximum Allowable PSBC Bars Back' prior
1-Candle Baseline Entry
1a. GKD-B Baseline gives signal
2a. Confirmation 1 agrees
3a. Price inside Goldie Locks Zone Minimum
4a. Price inside Goldie Locks Zone Maximum
5a. Confirmation 1 signal was less than 'Maximum Allowable PSBC Bars Back' prior
Next Candle
1b. Price retraced
2b. Baseline agrees
3b. Confirmation 1 agrees
4b. Confirmation 2 agrees
5b. Volatility/Volume agrees
Volatility/Volume Entry
1. GKD-V Volatility/Volume gives signal
2. Confirmation 1 agrees
3. Price inside Goldie Locks Zone Minimum
4. Price inside Goldie Locks Zone Maximum
5. Confirmation 2 agrees
6. Baseline agrees
7. Confirmation 1 signal was less than 7 candles prior
1-Candle Volatility/Volume Entry
1a. GKD-V Volatility/Volume gives signal
2a. Confirmation 1 agrees
3a. Price inside Goldie Locks Zone Minimum
4a. Price inside Goldie Locks Zone Maximum
5a. Confirmation 1 signal was less than 'Maximum Allowable PSVVC Bars Back' prior
Next Candle
1b. Price retraced
2b. Volatility/Volume agrees
3b. Confirmation 1 agrees
4b. Confirmation 2 agrees
5b. Baseline agrees
Confirmation 2 Entry
1. GKD-C Confirmation 2 gives signal
2. Confirmation 1 agrees
3. Price inside Goldie Locks Zone Minimum
4. Price inside Goldie Locks Zone Maximum
5. Volatility/Volume agrees
6. Baseline agrees
7. Confirmation 1 signal was less than 7 candles prior
1-Candle Confirmation 2 Entry
1a. GKD-C Confirmation 2 gives signal
2a. Confirmation 1 agrees
3a. Price inside Goldie Locks Zone Minimum
4a. Price inside Goldie Locks Zone Maximum
5a. Confirmation 1 signal was less than 'Maximum Allowable PSC2C Bars Back' prior
Next Candle
1b. Price retraced
2b. Confirmation 2 agrees
3b. Confirmation 1 agrees
4b. Volatility/Volume agrees
5b. Baseline agrees
PullBack Entry
1a. GKD-B Baseline gives signal
2a. Confirmation 1 agrees
3a. Price is beyond 1.0x Volatility of Baseline
Next Candle
1b. Price inside Goldie Locks Zone Minimum
2b. Price inside Goldie Locks Zone Maximum
3b. Confirmation 1 agrees
4b. Confirmation 2 agrees
5b. Volatility/Volume agrees
Continuation Entry
1. Standard Entry, 1-Candle Standard Entry, Baseline Entry, 1-Candle Baseline Entry, Volatility/Volume Entry, 1-Candle Volatility/Volume Entry, Confirmation 2 Entry, 1-Candle Confirmation 2 Entry, or Pullback entry triggered previously
2. Baseline hasn't crossed since entry signal trigger
4. Confirmation 1 agrees
5. Baseline agrees
6. Confirmation 2 agrees

GKD-C Composite Index [Loxx]The Giga Kaleidoscope GKD-C Composite Index is a Confirmation module included in Loxx's "Giga Kaleidoscope Modularized Trading System."
█ GKD-C Composite Index
The Composite Index is a sophisticated technical analysis tool that enhances the traditional Relative Strength Index (RSI) by incorporating momentum and multiple time frame analysis. It calculates two versions of the RSI, one at a slower period and another at a faster period, to capture both long-term trends and short-term market fluctuations. The innovation comes from introducing a momentum factor, RSIDelta, which is the difference between the slow RSI and its value a specified number of periods ago, highlighting the rate of change in market sentiment. Simultaneously, the fast RSI is smoothed with a simple moving average (SMA) over a designated period (RSIsma), blending immediate price movements with ongoing trends. The Composite Index then combines these elements (RSIDelta and RSIsma), creating a singular metric that embodies both momentum and the smoothed trend. This index is further refined by averaging it over two additional periods, offering a multifaceted view that assists in identifying overbought or oversold conditions with enhanced sensitivity to market dynamics. This method aims to provide traders with a deeper understanding of market forces, potentially leading to more informed trading decisions by capturing nuances missed by the standard RSI.
█ Giga Kaleidoscope Modularized Trading System
Core components of an NNFX algorithmic trading strategy
The NNFX algorithm is built on the principles of trend, momentum, and volatility. There are six core components in the NNFX trading algorithm:
1. Volatility - price volatility; e.g., Average True Range, True Range Double, Close-to-Close, etc.
2. Baseline - a moving average to identify price trend
3. Confirmation 1 - a technical indicator used to identify trends
4. Confirmation 2 - a technical indicator used to identify trends
5. Continuation - a technical indicator used to identify trends
6. Volatility/Volume - a technical indicator used to identify volatility/volume breakouts/breakdown
7. Exit - a technical indicator used to determine when a trend is exhausted
8. Metamorphosis - a technical indicator that produces a compound signal from the combination of other GKD indicators*
*(not part of the NNFX algorithm)
What is Volatility in the NNFX trading system?
In the NNFX (No Nonsense Forex) trading system, ATR (Average True Range) is typically used to measure the volatility of an asset. It is used as a part of the system to help determine the appropriate stop loss and take profit levels for a trade. ATR is calculated by taking the average of the true range values over a specified period.
True range is calculated as the maximum of the following values:
-Current high minus the current low
-Absolute value of the current high minus the previous close
-Absolute value of the current low minus the previous close
ATR is a dynamic indicator that changes with changes in volatility. As volatility increases, the value of ATR increases, and as volatility decreases, the value of ATR decreases. By using ATR in NNFX system, traders can adjust their stop loss and take profit levels according to the volatility of the asset being traded. This helps to ensure that the trade is given enough room to move, while also minimizing potential losses.
Other types of volatility include True Range Double (TRD), Close-to-Close, and Garman-Klass
What is a Baseline indicator?
The baseline is essentially a moving average, and is used to determine the overall direction of the market.
The baseline in the NNFX system is used to filter out trades that are not in line with the long-term trend of the market. The baseline is plotted on the chart along with other indicators, such as the Moving Average (MA), the Relative Strength Index (RSI), and the Average True Range (ATR).
Trades are only taken when the price is in the same direction as the baseline. For example, if the baseline is sloping upwards, only long trades are taken, and if the baseline is sloping downwards, only short trades are taken. This approach helps to ensure that trades are in line with the overall trend of the market, and reduces the risk of entering trades that are likely to fail.
By using a baseline in the NNFX system, traders can have a clear reference point for determining the overall trend of the market, and can make more informed trading decisions. The baseline helps to filter out noise and false signals, and ensures that trades are taken in the direction of the long-term trend.
What is a Confirmation indicator?
Confirmation indicators are technical indicators that are used to confirm the signals generated by primary indicators. Primary indicators are the core indicators used in the NNFX system, such as the Average True Range (ATR), the Moving Average (MA), and the Relative Strength Index (RSI).
The purpose of the confirmation indicators is to reduce false signals and improve the accuracy of the trading system. They are designed to confirm the signals generated by the primary indicators by providing additional information about the strength and direction of the trend.
Some examples of confirmation indicators that may be used in the NNFX system include the Bollinger Bands, the MACD (Moving Average Convergence Divergence), and the MACD Oscillator. These indicators can provide information about the volatility, momentum, and trend strength of the market, and can be used to confirm the signals generated by the primary indicators.
In the NNFX system, confirmation indicators are used in combination with primary indicators and other filters to create a trading system that is robust and reliable. By using multiple indicators to confirm trading signals, the system aims to reduce the risk of false signals and improve the overall profitability of the trades.
What is a Continuation indicator?
In the NNFX (No Nonsense Forex) trading system, a continuation indicator is a technical indicator that is used to confirm a current trend and predict that the trend is likely to continue in the same direction. A continuation indicator is typically used in conjunction with other indicators in the system, such as a baseline indicator, to provide a comprehensive trading strategy.
What is a Volatility/Volume indicator?
Volume indicators, such as the On Balance Volume (OBV), the Chaikin Money Flow (CMF), or the Volume Price Trend (VPT), are used to measure the amount of buying and selling activity in a market. They are based on the trading volume of the market, and can provide information about the strength of the trend. In the NNFX system, volume indicators are used to confirm trading signals generated by the Moving Average and the Relative Strength Index. Volatility indicators include Average Direction Index, Waddah Attar, and Volatility Ratio. In the NNFX trading system, volatility is a proxy for volume and vice versa.
By using volume indicators as confirmation tools, the NNFX trading system aims to reduce the risk of false signals and improve the overall profitability of trades. These indicators can provide additional information about the market that is not captured by the primary indicators, and can help traders to make more informed trading decisions. In addition, volume indicators can be used to identify potential changes in market trends and to confirm the strength of price movements.
What is an Exit indicator?
The exit indicator is used in conjunction with other indicators in the system, such as the Moving Average (MA), the Relative Strength Index (RSI), and the Average True Range (ATR), to provide a comprehensive trading strategy.
The exit indicator in the NNFX system can be any technical indicator that is deemed effective at identifying optimal exit points. Examples of exit indicators that are commonly used include the Parabolic SAR, and the Average Directional Index (ADX).
The purpose of the exit indicator is to identify when a trend is likely to reverse or when the market conditions have changed, signaling the need to exit a trade. By using an exit indicator, traders can manage their risk and prevent significant losses.
In the NNFX system, the exit indicator is used in conjunction with a stop loss and a take profit order to maximize profits and minimize losses. The stop loss order is used to limit the amount of loss that can be incurred if the trade goes against the trader, while the take profit order is used to lock in profits when the trade is moving in the trader's favor.
Overall, the use of an exit indicator in the NNFX trading system is an important component of a comprehensive trading strategy. It allows traders to manage their risk effectively and improve the profitability of their trades by exiting at the right time.
What is an Metamorphosis indicator?
The concept of a metamorphosis indicator involves the integration of two or more GKD indicators to generate a compound signal. This is achieved by evaluating the accuracy of each indicator and selecting the signal from the indicator with the highest accuracy. As an illustration, let's consider a scenario where we calculate the accuracy of 10 indicators and choose the signal from the indicator that demonstrates the highest accuracy.
The resulting output from the metamorphosis indicator can then be utilized in a GKD-BT backtest by occupying a slot that aligns with the purpose of the metamorphosis indicator. The slot can be a GKD-B, GKD-C, or GKD-E slot, depending on the specific requirements and objectives of the indicator. This allows for seamless integration and utilization of the compound signal within the GKD-BT framework.
How does Loxx's GKD (Giga Kaleidoscope Modularized Trading System) implement the NNFX algorithm outlined above?
Loxx's GKD v2.0 system has five types of modules (indicators/strategies). These modules are:
1. GKD-BT - Backtesting module (Volatility, Number 1 in the NNFX algorithm)
2. GKD-B - Baseline module (Baseline and Volatility/Volume, Numbers 1 and 2 in the NNFX algorithm)
3. GKD-C - Confirmation 1/2 and Continuation module (Confirmation 1/2 and Continuation, Numbers 3, 4, and 5 in the NNFX algorithm)
4. GKD-V - Volatility/Volume module (Confirmation 1/2, Number 6 in the NNFX algorithm)
5. GKD-E - Exit module (Exit, Number 7 in the NNFX algorithm)
6. GKD-M - Metamorphosis module (Metamorphosis, Number 8 in the NNFX algorithm, but not part of the NNFX algorithm)
(additional module types will added in future releases)
Each module interacts with every module by passing data to A backtest module wherein the various components of the GKD system are combined to create a trading signal.
That is, the Baseline indicator passes its data to Volatility/Volume. The Volatility/Volume indicator passes its values to the Confirmation 1 indicator. The Confirmation 1 indicator passes its values to the Confirmation 2 indicator. The Confirmation 2 indicator passes its values to the Continuation indicator. The Continuation indicator passes its values to the Exit indicator, and finally, the Exit indicator passes its values to the Backtest strategy.
This chaining of indicators requires that each module conform to Loxx's GKD protocol, therefore allowing for the testing of every possible combination of technical indicators that make up the six components of the NNFX algorithm.
What does the application of the GKD trading system look like?
Example trading system:
Backtest: Multi-Ticker CC Backtest
Baseline: Hull Moving Average
Volatility/Volume: Hurst Exponent
Confirmation 1: Advance Trend Pressure as shown on the chart above
Confirmation 2: uf2018
Continuation: Coppock Curve
Exit: Rex Oscillator
Metamorphosis: Baseline Optimizer
Each GKD indicator is denoted with a module identifier of either: GKD-BT, GKD-B, GKD-C, GKD-V, GKD-M, or GKD-E. This allows traders to understand to which module each indicator belongs and where each indicator fits into the GKD system.
█ Giga Kaleidoscope Modularized Trading System Signals
Standard Entry
1. GKD-C Confirmation gives signal
2. Baseline agrees
3. Price inside Goldie Locks Zone Minimum
4. Price inside Goldie Locks Zone Maximum
5. Confirmation 2 agrees
6. Volatility/Volume agrees
1-Candle Standard Entry
1a. GKD-C Confirmation gives signal
2a. Baseline agrees
3a. Price inside Goldie Locks Zone Minimum
4a. Price inside Goldie Locks Zone Maximum
Next Candle
1b. Price retraced
2b. Baseline agrees
3b. Confirmation 1 agrees
4b. Confirmation 2 agrees
5b. Volatility/Volume agrees
Baseline Entry
1. GKD-B Baseline gives signal
2. Confirmation 1 agrees
3. Price inside Goldie Locks Zone Minimum
4. Price inside Goldie Locks Zone Maximum
5. Confirmation 2 agrees
6. Volatility/Volume agrees
7. Confirmation 1 signal was less than 'Maximum Allowable PSBC Bars Back' prior
1-Candle Baseline Entry
1a. GKD-B Baseline gives signal
2a. Confirmation 1 agrees
3a. Price inside Goldie Locks Zone Minimum
4a. Price inside Goldie Locks Zone Maximum
5a. Confirmation 1 signal was less than 'Maximum Allowable PSBC Bars Back' prior
Next Candle
1b. Price retraced
2b. Baseline agrees
3b. Confirmation 1 agrees
4b. Confirmation 2 agrees
5b. Volatility/Volume agrees
Volatility/Volume Entry
1. GKD-V Volatility/Volume gives signal
2. Confirmation 1 agrees
3. Price inside Goldie Locks Zone Minimum
4. Price inside Goldie Locks Zone Maximum
5. Confirmation 2 agrees
6. Baseline agrees
7. Confirmation 1 signal was less than 7 candles prior
1-Candle Volatility/Volume Entry
1a. GKD-V Volatility/Volume gives signal
2a. Confirmation 1 agrees
3a. Price inside Goldie Locks Zone Minimum
4a. Price inside Goldie Locks Zone Maximum
5a. Confirmation 1 signal was less than 'Maximum Allowable PSVVC Bars Back' prior
Next Candle
1b. Price retraced
2b. Volatility/Volume agrees
3b. Confirmation 1 agrees
4b. Confirmation 2 agrees
5b. Baseline agrees
Confirmation 2 Entry
1. GKD-C Confirmation 2 gives signal
2. Confirmation 1 agrees
3. Price inside Goldie Locks Zone Minimum
4. Price inside Goldie Locks Zone Maximum
5. Volatility/Volume agrees
6. Baseline agrees
7. Confirmation 1 signal was less than 7 candles prior
1-Candle Confirmation 2 Entry
1a. GKD-C Confirmation 2 gives signal
2a. Confirmation 1 agrees
3a. Price inside Goldie Locks Zone Minimum
4a. Price inside Goldie Locks Zone Maximum
5a. Confirmation 1 signal was less than 'Maximum Allowable PSC2C Bars Back' prior
Next Candle
1b. Price retraced
2b. Confirmation 2 agrees
3b. Confirmation 1 agrees
4b. Volatility/Volume agrees
5b. Baseline agrees
PullBack Entry
1a. GKD-B Baseline gives signal
2a. Confirmation 1 agrees
3a. Price is beyond 1.0x Volatility of Baseline
Next Candle
1b. Price inside Goldie Locks Zone Minimum
2b. Price inside Goldie Locks Zone Maximum
3b. Confirmation 1 agrees
4b. Confirmation 2 agrees
5b. Volatility/Volume agrees
Continuation Entry
1. Standard Entry, 1-Candle Standard Entry, Baseline Entry, 1-Candle Baseline Entry, Volatility/Volume Entry, 1-Candle Volatility/Volume Entry, Confirmation 2 Entry, 1-Candle Confirmation 2 Entry, or Pullback entry triggered previously
2. Baseline hasn't crossed since entry signal trigger
4. Confirmation 1 agrees
5. Baseline agrees
6. Confirmation 2 agrees
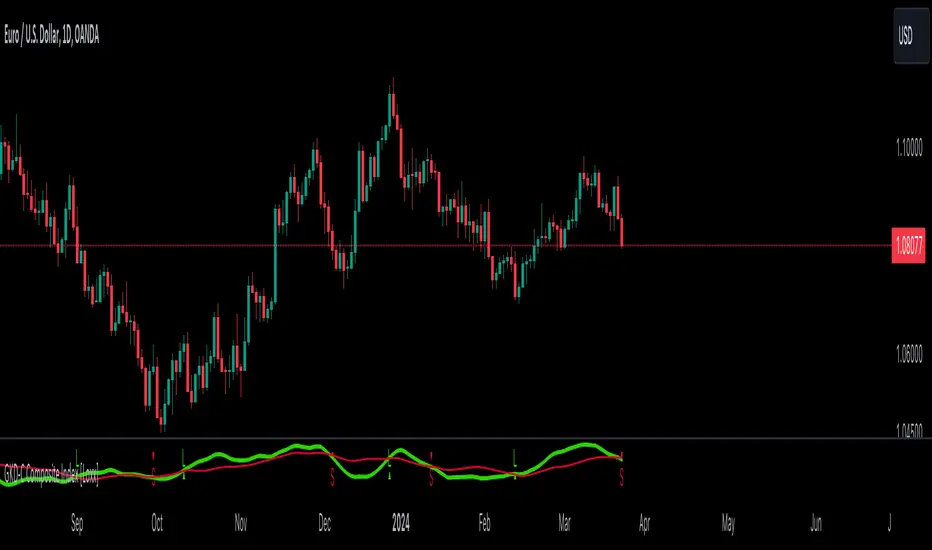
GKD-V Williams VixFix w/ Softmax [Loxx]The Giga Kaleidoscope GKD-V Williams VixFix w/ Softmax is a Volume/Volatility module included in Loxx's "Giga Kaleidoscope Modularized Trading System."
█ GKD-V Williams VixFix w/ Softmax
The Williams' Vix Fix indicator, a creation aimed at replicating the VIX (Volatility Index) for any asset, marks a significant advancement in volatility measurement, particularly for markets or instruments lacking options data. This indicator is designed to identify periods of extreme market stress or potential reversal points by measuring the distance between the highest past prices and current lows, reflecting panic or fear levels akin to those captured by the traditional VIX for the S&P 500. Enhanced with options for softmax normalization and a threshold-based signaling mechanism, the Vix Fix becomes a highly adaptable tool. Softmax normalization introduces a sophisticated method to normalize volatility signals, improving their interpretability and responsiveness to market changes. The threshold level option, on the other hand, provides a simpler, yet effective way to generate signals based on predefined volatility levels. This innovative approach to volatility analysis enables traders and analysts to leverage a more nuanced understanding of market dynamics, tailoring the indicator to their specific needs and strategies for navigating complex financial landscapes.
█ Giga Kaleidoscope Modularized Trading System
Core components of an NNFX algorithmic trading strategy
The NNFX algorithm is built on the principles of trend, momentum, and volatility. There are six core components in the NNFX trading algorithm:
1. Volatility - price volatility; e.g., Average True Range, True Range Double, Close-to-Close, etc.
2. Baseline - a moving average to identify price trend
3. Confirmation 1 - a technical indicator used to identify trends
4. Confirmation 2 - a technical indicator used to identify trends
5. Continuation - a technical indicator used to identify trends
6. Volatility/Volume - a technical indicator used to identify volatility/volume breakouts/breakdown
7. Exit - a technical indicator used to determine when a trend is exhausted
8. Metamorphosis - a technical indicator that produces a compound signal from the combination of other GKD indicators*
*(not part of the NNFX algorithm)
What is Volatility in the NNFX trading system?
In the NNFX (No Nonsense Forex) trading system, ATR (Average True Range) is typically used to measure the volatility of an asset. It is used as a part of the system to help determine the appropriate stop loss and take profit levels for a trade. ATR is calculated by taking the average of the true range values over a specified period.
True range is calculated as the maximum of the following values:
-Current high minus the current low
-Absolute value of the current high minus the previous close
-Absolute value of the current low minus the previous close
ATR is a dynamic indicator that changes with changes in volatility. As volatility increases, the value of ATR increases, and as volatility decreases, the value of ATR decreases. By using ATR in NNFX system, traders can adjust their stop loss and take profit levels according to the volatility of the asset being traded. This helps to ensure that the trade is given enough room to move, while also minimizing potential losses.
Other types of volatility include True Range Double (TRD), Close-to-Close, and Garman-Klass
What is a Baseline indicator?
The baseline is essentially a moving average, and is used to determine the overall direction of the market.
The baseline in the NNFX system is used to filter out trades that are not in line with the long-term trend of the market. The baseline is plotted on the chart along with other indicators, such as the Moving Average (MA), the Relative Strength Index (RSI), and the Average True Range (ATR).
Trades are only taken when the price is in the same direction as the baseline. For example, if the baseline is sloping upwards, only long trades are taken, and if the baseline is sloping downwards, only short trades are taken. This approach helps to ensure that trades are in line with the overall trend of the market, and reduces the risk of entering trades that are likely to fail.
By using a baseline in the NNFX system, traders can have a clear reference point for determining the overall trend of the market, and can make more informed trading decisions. The baseline helps to filter out noise and false signals, and ensures that trades are taken in the direction of the long-term trend.
What is a Confirmation indicator?
Confirmation indicators are technical indicators that are used to confirm the signals generated by primary indicators. Primary indicators are the core indicators used in the NNFX system, such as the Average True Range (ATR), the Moving Average (MA), and the Relative Strength Index (RSI).
The purpose of the confirmation indicators is to reduce false signals and improve the accuracy of the trading system. They are designed to confirm the signals generated by the primary indicators by providing additional information about the strength and direction of the trend.
Some examples of confirmation indicators that may be used in the NNFX system include the Bollinger Bands, the MACD (Moving Average Convergence Divergence), and the MACD Oscillator. These indicators can provide information about the volatility, momentum, and trend strength of the market, and can be used to confirm the signals generated by the primary indicators.
In the NNFX system, confirmation indicators are used in combination with primary indicators and other filters to create a trading system that is robust and reliable. By using multiple indicators to confirm trading signals, the system aims to reduce the risk of false signals and improve the overall profitability of the trades.
What is a Continuation indicator?
In the NNFX (No Nonsense Forex) trading system, a continuation indicator is a technical indicator that is used to confirm a current trend and predict that the trend is likely to continue in the same direction. A continuation indicator is typically used in conjunction with other indicators in the system, such as a baseline indicator, to provide a comprehensive trading strategy.
What is a Volatility/Volume indicator?
Volume indicators, such as the On Balance Volume (OBV), the Chaikin Money Flow (CMF), or the Volume Price Trend (VPT), are used to measure the amount of buying and selling activity in a market. They are based on the trading volume of the market, and can provide information about the strength of the trend. In the NNFX system, volume indicators are used to confirm trading signals generated by the Moving Average and the Relative Strength Index. Volatility indicators include Average Direction Index, Waddah Attar, and Volatility Ratio. In the NNFX trading system, volatility is a proxy for volume and vice versa.
By using volume indicators as confirmation tools, the NNFX trading system aims to reduce the risk of false signals and improve the overall profitability of trades. These indicators can provide additional information about the market that is not captured by the primary indicators, and can help traders to make more informed trading decisions. In addition, volume indicators can be used to identify potential changes in market trends and to confirm the strength of price movements.
What is an Exit indicator?
The exit indicator is used in conjunction with other indicators in the system, such as the Moving Average (MA), the Relative Strength Index (RSI), and the Average True Range (ATR), to provide a comprehensive trading strategy.
The exit indicator in the NNFX system can be any technical indicator that is deemed effective at identifying optimal exit points. Examples of exit indicators that are commonly used include the Parabolic SAR, and the Average Directional Index (ADX).
The purpose of the exit indicator is to identify when a trend is likely to reverse or when the market conditions have changed, signaling the need to exit a trade. By using an exit indicator, traders can manage their risk and prevent significant losses.
In the NNFX system, the exit indicator is used in conjunction with a stop loss and a take profit order to maximize profits and minimize losses. The stop loss order is used to limit the amount of loss that can be incurred if the trade goes against the trader, while the take profit order is used to lock in profits when the trade is moving in the trader's favor.
Overall, the use of an exit indicator in the NNFX trading system is an important component of a comprehensive trading strategy. It allows traders to manage their risk effectively and improve the profitability of their trades by exiting at the right time.
What is an Metamorphosis indicator?
The concept of a metamorphosis indicator involves the integration of two or more GKD indicators to generate a compound signal. This is achieved by evaluating the accuracy of each indicator and selecting the signal from the indicator with the highest accuracy. As an illustration, let's consider a scenario where we calculate the accuracy of 10 indicators and choose the signal from the indicator that demonstrates the highest accuracy.
The resulting output from the metamorphosis indicator can then be utilized in a GKD-BT backtest by occupying a slot that aligns with the purpose of the metamorphosis indicator. The slot can be a GKD-B, GKD-C, or GKD-E slot, depending on the specific requirements and objectives of the indicator. This allows for seamless integration and utilization of the compound signal within the GKD-BT framework.
How does Loxx's GKD (Giga Kaleidoscope Modularized Trading System) implement the NNFX algorithm outlined above?
Loxx's GKD v2.0 system has five types of modules (indicators/strategies). These modules are:
1. GKD-BT - Backtesting module (Volatility, Number 1 in the NNFX algorithm)
2. GKD-B - Baseline module (Baseline and Volatility/Volume, Numbers 1 and 2 in the NNFX algorithm)
3. GKD-C - Confirmation 1/2 and Continuation module (Confirmation 1/2 and Continuation, Numbers 3, 4, and 5 in the NNFX algorithm)
4. GKD-V - Volatility/Volume module (Confirmation 1/2, Number 6 in the NNFX algorithm)
5. GKD-E - Exit module (Exit, Number 7 in the NNFX algorithm)
6. GKD-M - Metamorphosis module (Metamorphosis, Number 8 in the NNFX algorithm, but not part of the NNFX algorithm)
(additional module types will added in future releases)
Each module interacts with every module by passing data to A backtest module wherein the various components of the GKD system are combined to create a trading signal.
That is, the Baseline indicator passes its data to Volatility/Volume. The Volatility/Volume indicator passes its values to the Confirmation 1 indicator. The Confirmation 1 indicator passes its values to the Confirmation 2 indicator. The Confirmation 2 indicator passes its values to the Continuation indicator. The Continuation indicator passes its values to the Exit indicator, and finally, the Exit indicator passes its values to the Backtest strategy.
This chaining of indicators requires that each module conform to Loxx's GKD protocol, therefore allowing for the testing of every possible combination of technical indicators that make up the six components of the NNFX algorithm.
What does the application of the GKD trading system look like?
Example trading system:
Backtest: Multi-Ticker CC Backtest
Baseline: Hull Moving Average
Volatility/Volume: Hurst Exponent
Confirmation 1: Advance Trend Pressure as shown on the chart above
Confirmation 2: uf2018
Continuation: Coppock Curve
Exit: Rex Oscillator
Metamorphosis: Baseline Optimizer
Each GKD indicator is denoted with a module identifier of either: GKD-BT, GKD-B, GKD-C, GKD-V, GKD-M, or GKD-E. This allows traders to understand to which module each indicator belongs and where each indicator fits into the GKD system.
█ Giga Kaleidoscope Modularized Trading System Signals
Standard Entry
1. GKD-C Confirmation gives signal
2. Baseline agrees
3. Price inside Goldie Locks Zone Minimum
4. Price inside Goldie Locks Zone Maximum
5. Confirmation 2 agrees
6. Volatility/Volume agrees
1-Candle Standard Entry
1a. GKD-C Confirmation gives signal
2a. Baseline agrees
3a. Price inside Goldie Locks Zone Minimum
4a. Price inside Goldie Locks Zone Maximum
Next Candle
1b. Price retraced
2b. Baseline agrees
3b. Confirmation 1 agrees
4b. Confirmation 2 agrees
5b. Volatility/Volume agrees
Baseline Entry
1. GKD-B Baseline gives signal
2. Confirmation 1 agrees
3. Price inside Goldie Locks Zone Minimum
4. Price inside Goldie Locks Zone Maximum
5. Confirmation 2 agrees
6. Volatility/Volume agrees
7. Confirmation 1 signal was less than 'Maximum Allowable PSBC Bars Back' prior
1-Candle Baseline Entry
1a. GKD-B Baseline gives signal
2a. Confirmation 1 agrees
3a. Price inside Goldie Locks Zone Minimum
4a. Price inside Goldie Locks Zone Maximum
5a. Confirmation 1 signal was less than 'Maximum Allowable PSBC Bars Back' prior
Next Candle
1b. Price retraced
2b. Baseline agrees
3b. Confirmation 1 agrees
4b. Confirmation 2 agrees
5b. Volatility/Volume agrees
Volatility/Volume Entry
1. GKD-V Volatility/Volume gives signal
2. Confirmation 1 agrees
3. Price inside Goldie Locks Zone Minimum
4. Price inside Goldie Locks Zone Maximum
5. Confirmation 2 agrees
6. Baseline agrees
7. Confirmation 1 signal was less than 7 candles prior
1-Candle Volatility/Volume Entry
1a. GKD-V Volatility/Volume gives signal
2a. Confirmation 1 agrees
3a. Price inside Goldie Locks Zone Minimum
4a. Price inside Goldie Locks Zone Maximum
5a. Confirmation 1 signal was less than 'Maximum Allowable PSVVC Bars Back' prior
Next Candle
1b. Price retraced
2b. Volatility/Volume agrees
3b. Confirmation 1 agrees
4b. Confirmation 2 agrees
5b. Baseline agrees
Confirmation 2 Entry
1. GKD-C Confirmation 2 gives signal
2. Confirmation 1 agrees
3. Price inside Goldie Locks Zone Minimum
4. Price inside Goldie Locks Zone Maximum
5. Volatility/Volume agrees
6. Baseline agrees
7. Confirmation 1 signal was less than 7 candles prior
1-Candle Confirmation 2 Entry
1a. GKD-C Confirmation 2 gives signal
2a. Confirmation 1 agrees
3a. Price inside Goldie Locks Zone Minimum
4a. Price inside Goldie Locks Zone Maximum
5a. Confirmation 1 signal was less than 'Maximum Allowable PSC2C Bars Back' prior
Next Candle
1b. Price retraced
2b. Confirmation 2 agrees
3b. Confirmation 1 agrees
4b. Volatility/Volume agrees
5b. Baseline agrees
PullBack Entry
1a. GKD-B Baseline gives signal
2a. Confirmation 1 agrees
3a. Price is beyond 1.0x Volatility of Baseline
Next Candle
1b. Price inside Goldie Locks Zone Minimum
2b. Price inside Goldie Locks Zone Maximum
3b. Confirmation 1 agrees
4b. Confirmation 2 agrees
5b. Volatility/Volume agrees
Continuation Entry
1. Standard Entry, 1-Candle Standard Entry, Baseline Entry, 1-Candle Baseline Entry, Volatility/Volume Entry, 1-Candle Volatility/Volume Entry, Confirmation 2 Entry, 1-Candle Confirmation 2 Entry, or Pullback entry triggered previously
2. Baseline hasn't crossed since entry signal trigger
4. Confirmation 1 agrees
5. Baseline agrees
6. Confirmation 2 agrees
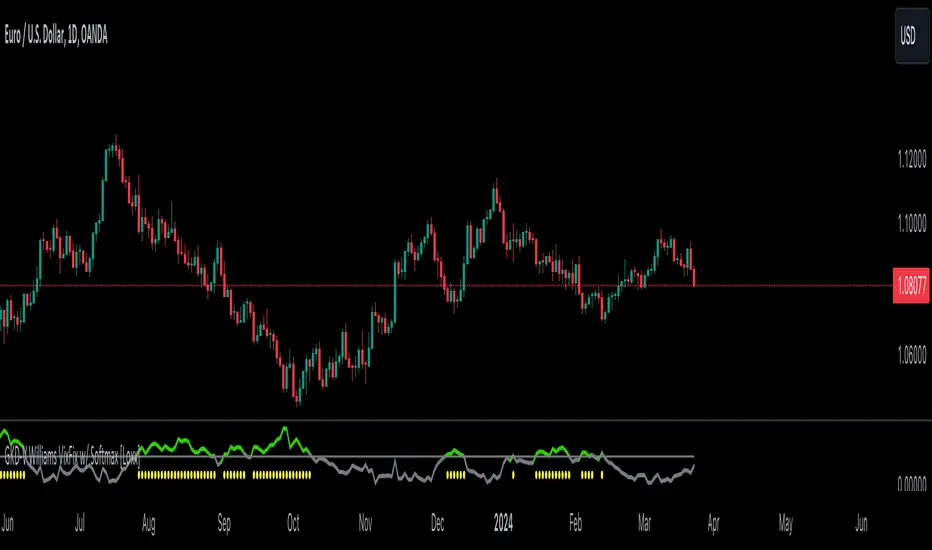
GKD-V Stiffness [Loxx]The Giga Kaleidoscope GKD-V Stiffness is a Volume/Volatility module included in Loxx's "Giga Kaleidoscope Modularized Trading System."
█ GKD-V Stiffness
The stiffness indicator quantifies the market's momentum by analyzing the relationship between price movements and volatility over a specific time frame. It employs a moving average to smooth out price data, providing a baseline for trend assessment. The key element in this calculation is the incorporation of a volatility factor, typically standard deviation, which adjusts the moving average to account for market volatility. This adjusted moving average creates a benchmark that the current price must surpass to signal significant momentum.
By comparing the current price to this volatility-adjusted moving average, the stiffness indicator determines the strength of the market's trend. A higher stiffness value, surpassing a predefined threshold, indicates a strong and potentially profitable trend, either upward or downward, suggesting opportunities for strategic trading positions. Conversely, a stiffness value below the threshold signifies insufficient momentum, advising traders to refrain from entering the market due to the high risk of unpredictability. This method provides a systematic approach to evaluate market trends, enabling traders to make decisions based on the robustness of price movements relative to historical volatility.
█ Giga Kaleidoscope Modularized Trading System
Core components of an NNFX algorithmic trading strategy
The NNFX algorithm is built on the principles of trend, momentum, and volatility. There are six core components in the NNFX trading algorithm:
1. Volatility - price volatility; e.g., Average True Range, True Range Double, Close-to-Close, etc.
2. Baseline - a moving average to identify price trend
3. Confirmation 1 - a technical indicator used to identify trends
4. Confirmation 2 - a technical indicator used to identify trends
5. Continuation - a technical indicator used to identify trends
6. Volatility/Volume - a technical indicator used to identify volatility/volume breakouts/breakdown
7. Exit - a technical indicator used to determine when a trend is exhausted
8. Metamorphosis - a technical indicator that produces a compound signal from the combination of other GKD indicators*
*(not part of the NNFX algorithm)
What is Volatility in the NNFX trading system?
In the NNFX (No Nonsense Forex) trading system, ATR (Average True Range) is typically used to measure the volatility of an asset. It is used as a part of the system to help determine the appropriate stop loss and take profit levels for a trade. ATR is calculated by taking the average of the true range values over a specified period.
True range is calculated as the maximum of the following values:
-Current high minus the current low
-Absolute value of the current high minus the previous close
-Absolute value of the current low minus the previous close
ATR is a dynamic indicator that changes with changes in volatility. As volatility increases, the value of ATR increases, and as volatility decreases, the value of ATR decreases. By using ATR in NNFX system, traders can adjust their stop loss and take profit levels according to the volatility of the asset being traded. This helps to ensure that the trade is given enough room to move, while also minimizing potential losses.
Other types of volatility include True Range Double (TRD), Close-to-Close, and Garman-Klass
What is a Baseline indicator?
The baseline is essentially a moving average, and is used to determine the overall direction of the market.
The baseline in the NNFX system is used to filter out trades that are not in line with the long-term trend of the market. The baseline is plotted on the chart along with other indicators, such as the Moving Average (MA), the Relative Strength Index (RSI), and the Average True Range (ATR).
Trades are only taken when the price is in the same direction as the baseline. For example, if the baseline is sloping upwards, only long trades are taken, and if the baseline is sloping downwards, only short trades are taken. This approach helps to ensure that trades are in line with the overall trend of the market, and reduces the risk of entering trades that are likely to fail.
By using a baseline in the NNFX system, traders can have a clear reference point for determining the overall trend of the market, and can make more informed trading decisions. The baseline helps to filter out noise and false signals, and ensures that trades are taken in the direction of the long-term trend.
What is a Confirmation indicator?
Confirmation indicators are technical indicators that are used to confirm the signals generated by primary indicators. Primary indicators are the core indicators used in the NNFX system, such as the Average True Range (ATR), the Moving Average (MA), and the Relative Strength Index (RSI).
The purpose of the confirmation indicators is to reduce false signals and improve the accuracy of the trading system. They are designed to confirm the signals generated by the primary indicators by providing additional information about the strength and direction of the trend.
Some examples of confirmation indicators that may be used in the NNFX system include the Bollinger Bands, the MACD (Moving Average Convergence Divergence), and the MACD Oscillator. These indicators can provide information about the volatility, momentum, and trend strength of the market, and can be used to confirm the signals generated by the primary indicators.
In the NNFX system, confirmation indicators are used in combination with primary indicators and other filters to create a trading system that is robust and reliable. By using multiple indicators to confirm trading signals, the system aims to reduce the risk of false signals and improve the overall profitability of the trades.
What is a Continuation indicator?
In the NNFX (No Nonsense Forex) trading system, a continuation indicator is a technical indicator that is used to confirm a current trend and predict that the trend is likely to continue in the same direction. A continuation indicator is typically used in conjunction with other indicators in the system, such as a baseline indicator, to provide a comprehensive trading strategy.
What is a Volatility/Volume indicator?
Volume indicators, such as the On Balance Volume (OBV), the Chaikin Money Flow (CMF), or the Volume Price Trend (VPT), are used to measure the amount of buying and selling activity in a market. They are based on the trading volume of the market, and can provide information about the strength of the trend. In the NNFX system, volume indicators are used to confirm trading signals generated by the Moving Average and the Relative Strength Index. Volatility indicators include Average Direction Index, Waddah Attar, and Volatility Ratio. In the NNFX trading system, volatility is a proxy for volume and vice versa.
By using volume indicators as confirmation tools, the NNFX trading system aims to reduce the risk of false signals and improve the overall profitability of trades. These indicators can provide additional information about the market that is not captured by the primary indicators, and can help traders to make more informed trading decisions. In addition, volume indicators can be used to identify potential changes in market trends and to confirm the strength of price movements.
What is an Exit indicator?
The exit indicator is used in conjunction with other indicators in the system, such as the Moving Average (MA), the Relative Strength Index (RSI), and the Average True Range (ATR), to provide a comprehensive trading strategy.
The exit indicator in the NNFX system can be any technical indicator that is deemed effective at identifying optimal exit points. Examples of exit indicators that are commonly used include the Parabolic SAR, and the Average Directional Index (ADX).
The purpose of the exit indicator is to identify when a trend is likely to reverse or when the market conditions have changed, signaling the need to exit a trade. By using an exit indicator, traders can manage their risk and prevent significant losses.
In the NNFX system, the exit indicator is used in conjunction with a stop loss and a take profit order to maximize profits and minimize losses. The stop loss order is used to limit the amount of loss that can be incurred if the trade goes against the trader, while the take profit order is used to lock in profits when the trade is moving in the trader's favor.
Overall, the use of an exit indicator in the NNFX trading system is an important component of a comprehensive trading strategy. It allows traders to manage their risk effectively and improve the profitability of their trades by exiting at the right time.
What is an Metamorphosis indicator?
The concept of a metamorphosis indicator involves the integration of two or more GKD indicators to generate a compound signal. This is achieved by evaluating the accuracy of each indicator and selecting the signal from the indicator with the highest accuracy. As an illustration, let's consider a scenario where we calculate the accuracy of 10 indicators and choose the signal from the indicator that demonstrates the highest accuracy.
The resulting output from the metamorphosis indicator can then be utilized in a GKD-BT backtest by occupying a slot that aligns with the purpose of the metamorphosis indicator. The slot can be a GKD-B, GKD-C, or GKD-E slot, depending on the specific requirements and objectives of the indicator. This allows for seamless integration and utilization of the compound signal within the GKD-BT framework.
How does Loxx's GKD (Giga Kaleidoscope Modularized Trading System) implement the NNFX algorithm outlined above?
Loxx's GKD v2.0 system has five types of modules (indicators/strategies). These modules are:
1. GKD-BT - Backtesting module (Volatility, Number 1 in the NNFX algorithm)
2. GKD-B - Baseline module (Baseline and Volatility/Volume, Numbers 1 and 2 in the NNFX algorithm)
3. GKD-C - Confirmation 1/2 and Continuation module (Confirmation 1/2 and Continuation, Numbers 3, 4, and 5 in the NNFX algorithm)
4. GKD-V - Volatility/Volume module (Confirmation 1/2, Number 6 in the NNFX algorithm)
5. GKD-E - Exit module (Exit, Number 7 in the NNFX algorithm)
6. GKD-M - Metamorphosis module (Metamorphosis, Number 8 in the NNFX algorithm, but not part of the NNFX algorithm)
(additional module types will added in future releases)
Each module interacts with every module by passing data to A backtest module wherein the various components of the GKD system are combined to create a trading signal.
That is, the Baseline indicator passes its data to Volatility/Volume. The Volatility/Volume indicator passes its values to the Confirmation 1 indicator. The Confirmation 1 indicator passes its values to the Confirmation 2 indicator. The Confirmation 2 indicator passes its values to the Continuation indicator. The Continuation indicator passes its values to the Exit indicator, and finally, the Exit indicator passes its values to the Backtest strategy.
This chaining of indicators requires that each module conform to Loxx's GKD protocol, therefore allowing for the testing of every possible combination of technical indicators that make up the six components of the NNFX algorithm.
What does the application of the GKD trading system look like?
Example trading system:
Backtest: Multi-Ticker CC Backtest
Baseline: Hull Moving Average
Volatility/Volume: Hurst Exponent
Confirmation 1: Advance Trend Pressure as shown on the chart above
Confirmation 2: uf2018
Continuation: Coppock Curve
Exit: Rex Oscillator
Metamorphosis: Baseline Optimizer
Each GKD indicator is denoted with a module identifier of either: GKD-BT, GKD-B, GKD-C, GKD-V, GKD-M, or GKD-E. This allows traders to understand to which module each indicator belongs and where each indicator fits into the GKD system.
█ Giga Kaleidoscope Modularized Trading System Signals
Standard Entry
1. GKD-C Confirmation gives signal
2. Baseline agrees
3. Price inside Goldie Locks Zone Minimum
4. Price inside Goldie Locks Zone Maximum
5. Confirmation 2 agrees
6. Volatility/Volume agrees
1-Candle Standard Entry
1a. GKD-C Confirmation gives signal
2a. Baseline agrees
3a. Price inside Goldie Locks Zone Minimum
4a. Price inside Goldie Locks Zone Maximum
Next Candle
1b. Price retraced
2b. Baseline agrees
3b. Confirmation 1 agrees
4b. Confirmation 2 agrees
5b. Volatility/Volume agrees
Baseline Entry
1. GKD-B Baseline gives signal
2. Confirmation 1 agrees
3. Price inside Goldie Locks Zone Minimum
4. Price inside Goldie Locks Zone Maximum
5. Confirmation 2 agrees
6. Volatility/Volume agrees
7. Confirmation 1 signal was less than 'Maximum Allowable PSBC Bars Back' prior
1-Candle Baseline Entry
1a. GKD-B Baseline gives signal
2a. Confirmation 1 agrees
3a. Price inside Goldie Locks Zone Minimum
4a. Price inside Goldie Locks Zone Maximum
5a. Confirmation 1 signal was less than 'Maximum Allowable PSBC Bars Back' prior
Next Candle
1b. Price retraced
2b. Baseline agrees
3b. Confirmation 1 agrees
4b. Confirmation 2 agrees
5b. Volatility/Volume agrees
Volatility/Volume Entry
1. GKD-V Volatility/Volume gives signal
2. Confirmation 1 agrees
3. Price inside Goldie Locks Zone Minimum
4. Price inside Goldie Locks Zone Maximum
5. Confirmation 2 agrees
6. Baseline agrees
7. Confirmation 1 signal was less than 7 candles prior
1-Candle Volatility/Volume Entry
1a. GKD-V Volatility/Volume gives signal
2a. Confirmation 1 agrees
3a. Price inside Goldie Locks Zone Minimum
4a. Price inside Goldie Locks Zone Maximum
5a. Confirmation 1 signal was less than 'Maximum Allowable PSVVC Bars Back' prior
Next Candle
1b. Price retraced
2b. Volatility/Volume agrees
3b. Confirmation 1 agrees
4b. Confirmation 2 agrees
5b. Baseline agrees
Confirmation 2 Entry
1. GKD-C Confirmation 2 gives signal
2. Confirmation 1 agrees
3. Price inside Goldie Locks Zone Minimum
4. Price inside Goldie Locks Zone Maximum
5. Volatility/Volume agrees
6. Baseline agrees
7. Confirmation 1 signal was less than 7 candles prior
1-Candle Confirmation 2 Entry
1a. GKD-C Confirmation 2 gives signal
2a. Confirmation 1 agrees
3a. Price inside Goldie Locks Zone Minimum
4a. Price inside Goldie Locks Zone Maximum
5a. Confirmation 1 signal was less than 'Maximum Allowable PSC2C Bars Back' prior
Next Candle
1b. Price retraced
2b. Confirmation 2 agrees
3b. Confirmation 1 agrees
4b. Volatility/Volume agrees
5b. Baseline agrees
PullBack Entry
1a. GKD-B Baseline gives signal
2a. Confirmation 1 agrees
3a. Price is beyond 1.0x Volatility of Baseline
Next Candle
1b. Price inside Goldie Locks Zone Minimum
2b. Price inside Goldie Locks Zone Maximum
3b. Confirmation 1 agrees
4b. Confirmation 2 agrees
5b. Volatility/Volume agrees
Continuation Entry
1. Standard Entry, 1-Candle Standard Entry, Baseline Entry, 1-Candle Baseline Entry, Volatility/Volume Entry, 1-Candle Volatility/Volume Entry, Confirmation 2 Entry, 1-Candle Confirmation 2 Entry, or Pullback entry triggered previously
2. Baseline hasn't crossed since entry signal trigger
4. Confirmation 1 agrees
5. Baseline agrees
6. Confirmation 2 agrees
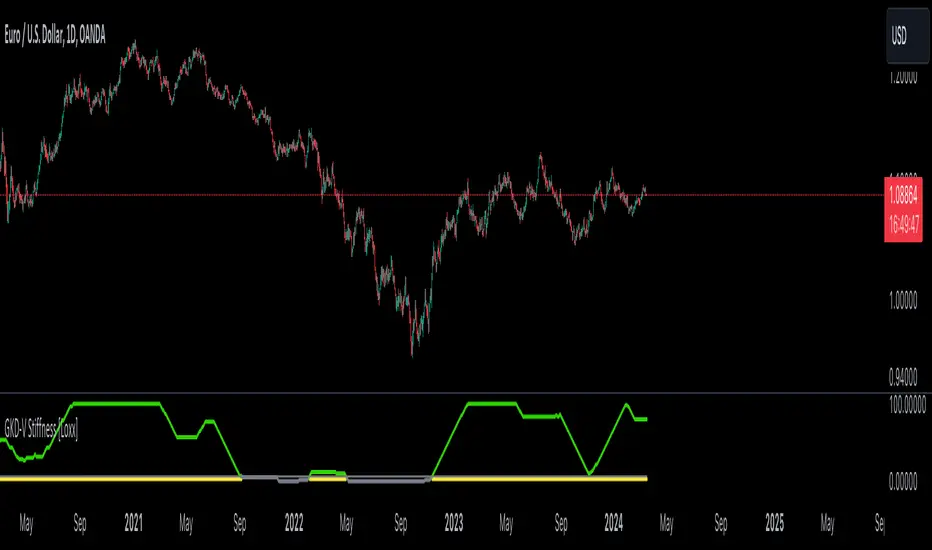
GKD-C Voss Predictive Filter [Loxx]The Giga Kaleidoscope GKD-C Voss Predictive Filter is a confirmation module included in Loxx's "Giga Kaleidoscope Modularized Trading System."
█ GKD-C Voss Predictive Filter
Featured in John Ehlers' article from August 2019 issue of Technical Analysis of Stocks & Commodities magazine, the Voss predictive filter could help signal cyclic turning points by minimizing group and phase delays, thus reducing lag.
The Voss Predictive Filter operates through a unique approach that enhances its ability to predict market movements by effectively reducing lag, which is common in many traditional trading indicators. At its core, the filter applies advanced mathematical techniques to smooth market data and identify significant price trends and cycles. This process involves adjusting to the market's cyclic components, enabling the filter to anticipate turning points with greater accuracy.
One of the key aspects of the Voss Predictive Filter is its ability to minimize both group and phase delays. Group delay refers to the lag between an input signal (such as market price data) entering the filter and the corresponding output being produced. Phase delay, on the other hand, relates to the shift in phase of the input signal's frequency components as they pass through the filter. By reducing these delays, the filter can provide more timely signals for entering or exiting trades.
The filter's predictive capacity comes from its sophisticated algorithm, which dynamically adjusts based on the analyzed market data, allowing it to remain sensitive to changes in market conditions. This dynamic adjustment is crucial for maintaining the filter's effectiveness in different market environments and for various financial instruments.
█ Giga Kaleidoscope Modularized Trading System
Core components of an NNFX algorithmic trading strategy
The NNFX algorithm is built on the principles of trend, momentum, and volatility. There are six core components in the NNFX trading algorithm:
1. Volatility - price volatility; e.g., Average True Range, True Range Double, Close-to-Close, etc.
2. Baseline - a moving average to identify price trend
3. Confirmation 1 - a technical indicator used to identify trends
4. Confirmation 2 - a technical indicator used to identify trends
5. Continuation - a technical indicator used to identify trends
6. Volatility/Volume - a technical indicator used to identify volatility/volume breakouts/breakdown
7. Exit - a technical indicator used to determine when a trend is exhausted
8. Metamorphosis - a technical indicator that produces a compound signal from the combination of other GKD indicators*
*(not part of the NNFX algorithm)
What is Volatility in the NNFX trading system?
In the NNFX (No Nonsense Forex) trading system, ATR (Average True Range) is typically used to measure the volatility of an asset. It is used as a part of the system to help determine the appropriate stop loss and take profit levels for a trade. ATR is calculated by taking the average of the true range values over a specified period.
True range is calculated as the maximum of the following values:
-Current high minus the current low
-Absolute value of the current high minus the previous close
-Absolute value of the current low minus the previous close
ATR is a dynamic indicator that changes with changes in volatility. As volatility increases, the value of ATR increases, and as volatility decreases, the value of ATR decreases. By using ATR in NNFX system, traders can adjust their stop loss and take profit levels according to the volatility of the asset being traded. This helps to ensure that the trade is given enough room to move, while also minimizing potential losses.
Other types of volatility include True Range Double (TRD), Close-to-Close, and Garman-Klass
What is a Baseline indicator?
The baseline is essentially a moving average, and is used to determine the overall direction of the market.
The baseline in the NNFX system is used to filter out trades that are not in line with the long-term trend of the market. The baseline is plotted on the chart along with other indicators, such as the Moving Average (MA), the Relative Strength Index (RSI), and the Average True Range (ATR).
Trades are only taken when the price is in the same direction as the baseline. For example, if the baseline is sloping upwards, only long trades are taken, and if the baseline is sloping downwards, only short trades are taken. This approach helps to ensure that trades are in line with the overall trend of the market, and reduces the risk of entering trades that are likely to fail.
By using a baseline in the NNFX system, traders can have a clear reference point for determining the overall trend of the market, and can make more informed trading decisions. The baseline helps to filter out noise and false signals, and ensures that trades are taken in the direction of the long-term trend.
What is a Confirmation indicator?
Confirmation indicators are technical indicators that are used to confirm the signals generated by primary indicators. Primary indicators are the core indicators used in the NNFX system, such as the Average True Range (ATR), the Moving Average (MA), and the Relative Strength Index (RSI).
The purpose of the confirmation indicators is to reduce false signals and improve the accuracy of the trading system. They are designed to confirm the signals generated by the primary indicators by providing additional information about the strength and direction of the trend.
Some examples of confirmation indicators that may be used in the NNFX system include the Bollinger Bands, the MACD (Moving Average Convergence Divergence), and the MACD Oscillator. These indicators can provide information about the volatility, momentum, and trend strength of the market, and can be used to confirm the signals generated by the primary indicators.
In the NNFX system, confirmation indicators are used in combination with primary indicators and other filters to create a trading system that is robust and reliable. By using multiple indicators to confirm trading signals, the system aims to reduce the risk of false signals and improve the overall profitability of the trades.
What is a Continuation indicator?
In the NNFX (No Nonsense Forex) trading system, a continuation indicator is a technical indicator that is used to confirm a current trend and predict that the trend is likely to continue in the same direction. A continuation indicator is typically used in conjunction with other indicators in the system, such as a baseline indicator, to provide a comprehensive trading strategy.
What is a Volatility/Volume indicator?
Volume indicators, such as the On Balance Volume (OBV), the Chaikin Money Flow (CMF), or the Volume Price Trend (VPT), are used to measure the amount of buying and selling activity in a market. They are based on the trading volume of the market, and can provide information about the strength of the trend. In the NNFX system, volume indicators are used to confirm trading signals generated by the Moving Average and the Relative Strength Index. Volatility indicators include Average Direction Index, Waddah Attar, and Volatility Ratio. In the NNFX trading system, volatility is a proxy for volume and vice versa.
By using volume indicators as confirmation tools, the NNFX trading system aims to reduce the risk of false signals and improve the overall profitability of trades. These indicators can provide additional information about the market that is not captured by the primary indicators, and can help traders to make more informed trading decisions. In addition, volume indicators can be used to identify potential changes in market trends and to confirm the strength of price movements.
What is an Exit indicator?
The exit indicator is used in conjunction with other indicators in the system, such as the Moving Average (MA), the Relative Strength Index (RSI), and the Average True Range (ATR), to provide a comprehensive trading strategy.
The exit indicator in the NNFX system can be any technical indicator that is deemed effective at identifying optimal exit points. Examples of exit indicators that are commonly used include the Parabolic SAR, and the Average Directional Index (ADX).
The purpose of the exit indicator is to identify when a trend is likely to reverse or when the market conditions have changed, signaling the need to exit a trade. By using an exit indicator, traders can manage their risk and prevent significant losses.
In the NNFX system, the exit indicator is used in conjunction with a stop loss and a take profit order to maximize profits and minimize losses. The stop loss order is used to limit the amount of loss that can be incurred if the trade goes against the trader, while the take profit order is used to lock in profits when the trade is moving in the trader's favor.
Overall, the use of an exit indicator in the NNFX trading system is an important component of a comprehensive trading strategy. It allows traders to manage their risk effectively and improve the profitability of their trades by exiting at the right time.
What is an Metamorphosis indicator?
The concept of a metamorphosis indicator involves the integration of two or more GKD indicators to generate a compound signal. This is achieved by evaluating the accuracy of each indicator and selecting the signal from the indicator with the highest accuracy. As an illustration, let's consider a scenario where we calculate the accuracy of 10 indicators and choose the signal from the indicator that demonstrates the highest accuracy.
The resulting output from the metamorphosis indicator can then be utilized in a GKD-BT backtest by occupying a slot that aligns with the purpose of the metamorphosis indicator. The slot can be a GKD-B, GKD-C, or GKD-E slot, depending on the specific requirements and objectives of the indicator. This allows for seamless integration and utilization of the compound signal within the GKD-BT framework.
How does Loxx's GKD (Giga Kaleidoscope Modularized Trading System) implement the NNFX algorithm outlined above?
Loxx's GKD v2.0 system has five types of modules (indicators/strategies). These modules are:
1. GKD-BT - Backtesting module (Volatility, Number 1 in the NNFX algorithm)
2. GKD-B - Baseline module (Baseline and Volatility/Volume, Numbers 1 and 2 in the NNFX algorithm)
3. GKD-C - Confirmation 1/2 and Continuation module (Confirmation 1/2 and Continuation, Numbers 3, 4, and 5 in the NNFX algorithm)
4. GKD-V - Volatility/Volume module (Confirmation 1/2, Number 6 in the NNFX algorithm)
5. GKD-E - Exit module (Exit, Number 7 in the NNFX algorithm)
6. GKD-M - Metamorphosis module (Metamorphosis, Number 8 in the NNFX algorithm, but not part of the NNFX algorithm)
(additional module types will added in future releases)
Each module interacts with every module by passing data to A backtest module wherein the various components of the GKD system are combined to create a trading signal.
That is, the Baseline indicator passes its data to Volatility/Volume. The Volatility/Volume indicator passes its values to the Confirmation 1 indicator. The Confirmation 1 indicator passes its values to the Confirmation 2 indicator. The Confirmation 2 indicator passes its values to the Continuation indicator. The Continuation indicator passes its values to the Exit indicator, and finally, the Exit indicator passes its values to the Backtest strategy.
This chaining of indicators requires that each module conform to Loxx's GKD protocol, therefore allowing for the testing of every possible combination of technical indicators that make up the six components of the NNFX algorithm.
What does the application of the GKD trading system look like?
Example trading system:
Backtest: Multi-Ticker CC Backtest
Baseline: Hull Moving Average
Volatility/Volume: Hurst Exponent
Confirmation 1: Advance Trend Pressure as shown on the chart above
Confirmation 2: uf2018
Continuation: Coppock Curve
Exit: Rex Oscillator
Metamorphosis: Baseline Optimizer
Each GKD indicator is denoted with a module identifier of either: GKD-BT, GKD-B, GKD-C, GKD-V, GKD-M, or GKD-E. This allows traders to understand to which module each indicator belongs and where each indicator fits into the GKD system.
█ Giga Kaleidoscope Modularized Trading System Signals
Standard Entry
1. GKD-C Confirmation gives signal
2. Baseline agrees
3. Price inside Goldie Locks Zone Minimum
4. Price inside Goldie Locks Zone Maximum
5. Confirmation 2 agrees
6. Volatility/Volume agrees
1-Candle Standard Entry
1a. GKD-C Confirmation gives signal
2a. Baseline agrees
3a. Price inside Goldie Locks Zone Minimum
4a. Price inside Goldie Locks Zone Maximum
Next Candle
1b. Price retraced
2b. Baseline agrees
3b. Confirmation 1 agrees
4b. Confirmation 2 agrees
5b. Volatility/Volume agrees
Baseline Entry
1. GKD-B Baseline gives signal
2. Confirmation 1 agrees
3. Price inside Goldie Locks Zone Minimum
4. Price inside Goldie Locks Zone Maximum
5. Confirmation 2 agrees
6. Volatility/Volume agrees
7. Confirmation 1 signal was less than 'Maximum Allowable PSBC Bars Back' prior
1-Candle Baseline Entry
1a. GKD-B Baseline gives signal
2a. Confirmation 1 agrees
3a. Price inside Goldie Locks Zone Minimum
4a. Price inside Goldie Locks Zone Maximum
5a. Confirmation 1 signal was less than 'Maximum Allowable PSBC Bars Back' prior
Next Candle
1b. Price retraced
2b. Baseline agrees
3b. Confirmation 1 agrees
4b. Confirmation 2 agrees
5b. Volatility/Volume agrees
Volatility/Volume Entry
1. GKD-V Volatility/Volume gives signal
2. Confirmation 1 agrees
3. Price inside Goldie Locks Zone Minimum
4. Price inside Goldie Locks Zone Maximum
5. Confirmation 2 agrees
6. Baseline agrees
7. Confirmation 1 signal was less than 7 candles prior
1-Candle Volatility/Volume Entry
1a. GKD-V Volatility/Volume gives signal
2a. Confirmation 1 agrees
3a. Price inside Goldie Locks Zone Minimum
4a. Price inside Goldie Locks Zone Maximum
5a. Confirmation 1 signal was less than 'Maximum Allowable PSVVC Bars Back' prior
Next Candle
1b. Price retraced
2b. Volatility/Volume agrees
3b. Confirmation 1 agrees
4b. Confirmation 2 agrees
5b. Baseline agrees
Confirmation 2 Entry
1. GKD-C Confirmation 2 gives signal
2. Confirmation 1 agrees
3. Price inside Goldie Locks Zone Minimum
4. Price inside Goldie Locks Zone Maximum
5. Volatility/Volume agrees
6. Baseline agrees
7. Confirmation 1 signal was less than 7 candles prior
1-Candle Confirmation 2 Entry
1a. GKD-C Confirmation 2 gives signal
2a. Confirmation 1 agrees
3a. Price inside Goldie Locks Zone Minimum
4a. Price inside Goldie Locks Zone Maximum
5a. Confirmation 1 signal was less than 'Maximum Allowable PSC2C Bars Back' prior
Next Candle
1b. Price retraced
2b. Confirmation 2 agrees
3b. Confirmation 1 agrees
4b. Volatility/Volume agrees
5b. Baseline agrees
PullBack Entry
1a. GKD-B Baseline gives signal
2a. Confirmation 1 agrees
3a. Price is beyond 1.0x Volatility of Baseline
Next Candle
1b. Price inside Goldie Locks Zone Minimum
2b. Price inside Goldie Locks Zone Maximum
3b. Confirmation 1 agrees
4b. Confirmation 2 agrees
5b. Volatility/Volume agrees
Continuation Entry
1. Standard Entry, 1-Candle Standard Entry, Baseline Entry, 1-Candle Baseline Entry, Volatility/Volume Entry, 1-Candle Volatility/Volume Entry, Confirmation 2 Entry, 1-Candle Confirmation 2 Entry, or Pullback entry triggered previously
2. Baseline hasn't crossed since entry signal trigger
4. Confirmation 1 agrees
5. Baseline agrees
6. Confirmation 2 agrees