G&S SMT### Description of the Pine Script
This Pine Script is designed to identify **Smart Money Technique (SMT)** setups between **Gold (GC1!)** and **Silver (SI1!) Futures** on a **15-minute timeframe**. It specifically looks for divergences between the price movements of Gold and Silver over the last 4 candles and compares it with the next candle's price movement. The script provides **Bullish** and **Bearish** signals for SMT during a specified time range of **8:45 AM EST to 10:30 AM EST**.
### Key Features of the Script:
1. **Futures Symbols**:
- The script uses **Gold Futures (GC1!)** and **Silver Futures (SI1!)** on a 15-minute timeframe to monitor their price movements.
2. **Time Range Filtering**:
- The signals are only active between **8:45 AM EST and 10:30 AM EST**, ensuring that the script only signals within the most relevant trading hours for your strategy.
3. **SMT Calculation (Last 4 Candles vs Next Candle)**:
- **Gold and Silver Price Change Calculation**: The script compares the price changes of **Gold** and **Silver** over the **last 4 candles** and then compares them with the price movement of the **next candle**:
- **Bullish SMT**: Occurs when Gold shows an increase in the last 4 candles while Silver shows a decrease, and both Gold and Silver show an increase in the next candle.
- **Bearish SMT**: Occurs when Gold shows a decrease in the last 4 candles while Silver shows an increase, and both Gold and Silver show a decrease in the next candle.
4. **Bullish and Bearish Signals**:
- **Bullish SMT Signal**: The script will plot a **green** arrow below the bar when a Bullish SMT setup is identified.
- **Bearish SMT Signal**: A **red** arrow above the bar is plotted when a Bearish SMT setup is identified.
5. **Gold and Silver Difference Plot**:
- The difference between the prices of **Gold** and **Silver** is plotted as a **blue line**, giving a visual representation of the relationship between the two assets. When the difference line moves significantly, it can indicate a potential divergence or convergence in the prices of Gold and Silver.
### Script Logic Breakdown:
1. **Price Change for Last 4 Candles**:
- The script calculates the price change for Gold and Silver from the 4th-to-last candle to the last candle.
- `gold_change_last4` and `silver_change_last4` calculate these price differences.
2. **Price Change for Next Candle**:
- It then calculates the price change from the last candle to the next candle.
- `gold_change_next` and `silver_change_next` calculate these price differences.
3. **Bullish SMT Condition**:
- If Gold increased while Silver decreased in the last 4 candles, and both Gold and Silver show an increase in the next candle, it indicates a **Bullish SMT**.
4. **Bearish SMT Condition**:
- If Gold decreased while Silver increased in the last 4 candles, and both Gold and Silver show a decrease in the next candle, it indicates a **Bearish SMT**.
5. **Time Filter**:
- Signals are only plotted when the current time is between **8:45 AM EST and 10:30 AM EST** to match your preferred trading hours.
### Visualization:
- **Bullish Signals**: Plotted as **green arrows** below the bars when a Bullish SMT setup is identified.
- **Bearish Signals**: Plotted as **red arrows** above the bars when a Bearish SMT setup is identified.
- **Gold - Silver Difference**: A **blue line** is plotted to show the price difference between Gold and Silver, helping visualize any divergence.
### How It Helps:
- **Divergence Identification**: This script highlights potential divergences between Gold and Silver Futures, which can provide insights into market sentiment and smart money movements.
- **Focus on Relevant Time Frame**: By filtering signals between 8:45 AM EST and 10:30 AM EST, you are focusing on a timeframe that can be more beneficial for trading.
- **Visual Clarity**: The arrows and the price difference line provide clear signals and a visual representation of the relationship between Gold and Silver, helping you make informed trading decisions.
This script is an automated approach to detecting **SMT setups** and helping traders recognize when Gold and Silver might be signaling a bullish or bearish move based on their divergence patterns.
Wyszukaj w skryptach "smart"

London/NY Sessions [jpkxyz]London/NY Sessions Indicator Guide
This indicator tracks the forex market's most active trading periods: London session, New York session, and their overlap.
This characteristics of the London and New York trading sessions are well documented and many traders use them as a key element in their trading strategies. It is most relevant in forex trading, however it is to an extend also applicable in cryptocurrencies.
London Session (08:00-16:00 UTC)
Most active trading session (35% of daily forex volume)
Highest trading volume and liquidity
Major price movements and trend development
Significant institutional participation
New York Session (13:00-20:00 UTC)
Second most active trading period
High institutional order flow
Major US economic releases
Significant impact on USD pairs
London/New York Overlap (13:00-16:00 UTC)
The most active period in forex markets:
Maximum market liquidity
Highest daily trading volume
Strong price movements
Tightest spreads
Peak institutional activity
This indicator helps traders:
Visualize key trading sessions
Track session highs and lows
Monitor overlap dynamics
Identify potential support/resistance levels (session highs/lows)

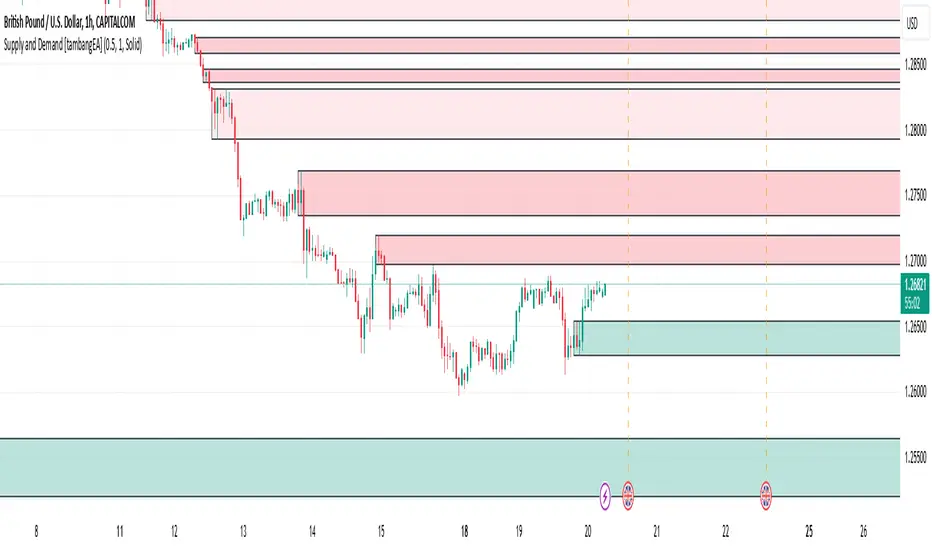
Supply and Demand [tambangEA]Supply and Demand Indicator Overview
The Supply and Demand indicator on TradingView is a technical tool designed to help traders identify areas of significant buying and selling pressure in the market. By identifying zones where price is likely to react, it helps traders pinpoint key support and resistance levels based on the concepts of supply and demand. This indicator plots zones using four distinct types of market structures:
1. Rally-Base-Rally (RBR) : This structure represents a bullish continuation zone. It occurs when the price rallies (increases), forms a base (consolidates), and then rallies again. The base represents a period where buying interest builds up before the continuation of the upward movement. This zone can act as support, where buyers may step back in if the price revisits the area.
2. Drop-Base-Rally (DBR) : This structure marks a bullish reversal zone. It forms when the price drops, creates a base, and then rallies. The base indicates a potential exhaustion of selling pressure and a build-up of buying interest. When price revisits this zone, it may act as support, signaling a buying opportunity.
3. Rally-Base-Drop (RBD) : This structure signifies a bearish reversal zone. Here, the price rallies, consolidates into a base, and then drops. The base indicates a temporary balance before sellers overpower buyers. If price returns to this zone, it may act as resistance, with selling interest potentially re-emerging.
4. Drop-Base-Drop (DBD) : This structure is a bearish continuation zone. It occurs when the price drops, forms a base, and then continues dropping. This base reflects a pause before further downward movement. The zone may act as resistance, with sellers possibly stepping back in if the price revisits the area.
Features of Supply and Demand Indicator
Automatic Zone Detection : The indicator automatically identifies and plots RBR, DBR, RBD, and DBD zones on the chart, making it easier to see potential supply and demand areas.
Customizable Settings : Users can typically adjust the color and transparency of the zones, time frames for analysis, and zone persistence to suit different trading styles.
Visual Alerts : Many versions include alert functionalities, notifying users when price approaches a plotted supply or demand zone.
How to Use Supply and Demand in Trading
Identify High-Probability Reversal Zones : Look for DBR and RBD zones to identify potential areas where price may reverse direction.
Trade Continuations with RBR and DBD Zones : These zones can indicate strong trends, suggesting that price may continue in the same direction.
Combine with Other Indicators: Use it alongside trend indicators, volume analysis, or price action strategies to confirm potential trade entries and exits.
This indicator is particularly useful for swing and day traders who rely on price reaction zones for entering and exiting trades.
Power Of 3 ICT 01 [TradingFinder] AMD ICT & SMC Accumulations🔵 Introduction
The ICT Power of 3 (PO3) strategy, developed by Michael J. Huddleston, known as the Inner Circle Trader, is a structured approach to analyzing daily market activity. This strategy divides the trading day into three distinct phases: Accumulation, Manipulation, and Distribution.
Each phase represents a unique market behavior influenced by institutional traders, offering a clear framework for retail traders to align their strategies with market movements.
Accumulation (19:00 - 01:00 EST) takes place during low-volatility hours, as institutional traders accumulate orders. Manipulation (01:00 - 07:00 EST) involves false breakouts and liquidity traps designed to mislead retail traders. Finally, Distribution (07:00 - 13:00 EST) represents the active phase where significant market movements occur as institutions distribute their positions in line with the broader trend.
This indicator is built upon the Power of 3 principles to provide traders with a practical and visual tool for identifying these key phases. By using clear color coding and precise time zones, the indicator highlights critical price levels, such as highs and lows, helping traders to better understand market dynamics and make more informed trading decisions.
Incorporating the ICT AMD setup into daily analysis enables traders to anticipate market behavior, spot high-probability trade setups, and gain deeper insights into institutional trading strategies. With its focus on time-based price action, this indicator simplifies complex market structures, offering an effective tool for traders of all levels.
🔵 How to Use
The ICT Power of 3 (PO3) indicator is designed to help traders analyze daily market movements by visually identifying the three key phases: Accumulation, Manipulation, and Distribution.
Here's how traders can effectively use the indicator :
🟣 Accumulation Phase (19:00 - 01:00 EST)
Purpose : Identify the range-bound activity where institutional players accumulate orders.
Trading Insight : Avoid placing trades during this phase, as price movements are typically limited. Instead, use this time to prepare for the potential direction of the market in the next phases.
🟣 Manipulation Phase (01:00 - 07:00 EST)
Purpose : Spot false breakouts and liquidity traps that mislead retail traders.
Trading Insight : Observe the market for price spikes beyond key support or resistance levels. These moves often reverse quickly, offering high-probability entry points in the opposite direction of the initial breakout.
🟣 Distribution Phase (07:00 - 13:00 EST)
Purpose : Detect the main price movement of the day, driven by institutional distribution.
Trading Insight : Enter trades in the direction of the trend established during this phase. Look for confirmations such as breakouts or strong directional moves that align with broader market sentiment
🔵 Settings
Show or Hide Phases :mDecide whether to display Accumulation, Manipulation, or Distribution.
Adjust the session times for each phase :
Accumulation: 1900-0100 EST
Manipulation: 0100-0700 EST
Distribution: 0700-1300 EST
Modify Visualization : Customize how the indicator looks by changing settings like colors and transparency.
🔵 Conclusion
The ICT Power of 3 (PO3) indicator is a powerful tool for traders seeking to understand and leverage market structure based on time and price dynamics. By visually highlighting the three key phases—Accumulation, Manipulation, and Distribution—this indicator simplifies the complex movements of institutional trading strategies.
With its customizable settings and clear representation of market behavior, the indicator is suitable for traders at all levels, helping them anticipate market trends and make more informed decisions.
Whether you're identifying entry points in the Accumulation phase, navigating false moves during Manipulation, or capitalizing on trends in the Distribution phase, this tool provides valuable insights to enhance your trading performance.
By integrating this indicator into your analysis, you can better align your strategies with institutional movements and improve your overall trading outcomes.

Enhanced London Session SMC SetupEnhanced London Session SMC Setup Indicator
This Pine Script-based indicator is designed for traders focusing on the London trading session, leveraging smart money concepts (SMC) to identify potential trading opportunities in the GBP/USD currency pair. The script uses multiple techniques such as Order Block Detection, Imbalance (Fair Value Gap) Analysis, Change of Character (CHoCH) detection, and Fibonacci retracement levels to aid in market structure analysis, providing a well-rounded approach to trade setups.
Features:
London Session Highlight:
The indicator visually marks the London trading session (from 08:00 AM to 04:00 PM UTC) on the chart using a blue background, signaling when the high-volume, high-impulse moves tend to occur, helping traders focus their analysis on this key session.
Order Block Detection:
Identifies significant impulse moves that may form order blocks (supply and demand zones). Order blocks are areas where institutions have executed large orders, often leading to price reversals or continuation. The indicator plots the high and low of these order blocks, providing key levels to monitor for potential entries.
Imbalance (Fair Value Gap) Detection:
Detects and highlights price imbalances or fair value gaps (FVG) where the market has moved too quickly, creating a gap in price action. These areas are often revisited by price, offering potential trade opportunities. The upper and lower bounds of the imbalance are visually marked for easy reference.
Change of Character (CHoCH) Detection:
This feature identifies potential trend reversals by detecting significant changes in market character. When the price action shifts from bullish to bearish or vice versa, a CHoCH signal is triggered, and the corresponding level is marked on the chart. This can help traders catch trend reversals at key levels.
Fibonacci Retracement Levels:
The script calculates and plots the key Fibonacci retracement levels (0.618 and 0.786 by default) based on the highest and lowest points over a user-defined swing lookback period. These levels are commonly used by traders to identify potential pullback zones where price may reverse or find support/resistance.
Directional Bias Based on Market Structure:
The indicator provides a market structure analysis by comparing the current highs and lows to the previous periods' highs and lows. This helps in identifying whether the market is in a bullish or bearish state, providing a clear directional bias for trade setups.
Alerts:
The indicator comes with built-in alert conditions to notify the trader when an order block, imbalance, CHoCH, or other significant price action event is detected, ensuring timely action can be taken.
Ideal Usage:
Timeframe: Suitable for intraday trading, particularly focusing on the London session (08:00 AM to 04:00 PM UTC).
Currency Pair: Specifically designed for GBP/USD but can be adapted to other pairs with similar market behavior.
Trading Strategy: Best used in conjunction with a price action strategy, focusing on the key levels identified (order blocks, FVG, CHoCH) and using Fibonacci retracement levels for precision entries.
Target Audience: Ideal for traders who follow smart money concepts (SMC) and are looking for a structured approach to identify high-probability setups during the London session.

Support & Resistance AI LevelScopeSupport & Resistance AI LevelScope
Support & Resistance AI LevelScope is an advanced, AI-driven tool that automatically detects and highlights key support and resistance levels on your chart. This indicator leverages smart algorithms to pinpoint the most impactful levels, providing traders with a precise, real-time view of critical price boundaries. Save time and enhance your trading edge with effortless, intelligent support and resistance identification.
Key Features:
AI-Powered Level Detection: The LevelScope algorithm continuously analyzes price action, dynamically plotting support and resistance levels based on recent highs and lows across your chosen timeframe.
Sensitivity Control: Customize the sensitivity to display either major levels for a macro view or more frequent levels for detailed intraday analysis. Easily adjust to suit any trading style or market condition.
Level Strength Differentiation: Instantly recognize the strength of each level with visual cues based on how often price has touched each one. Stronger levels are emphasized, highlighting areas with higher significance, while weaker levels are marked subtly.
Customizable Visuals: Tailor the look of your chart with customizable color schemes and line thickness options for strong and weak levels, ensuring clear visibility without clutter.
Proximity Alerts: Receive alerts when price approaches key support or resistance, giving you a heads-up for potential market reactions and trading opportunities.
Who It’s For:
Whether you're a day trader, swing trader, or just want a quick, AI-driven way to identify high-probability levels on your chart, Support & Resistance AI LevelScope is designed to keep you focused and informed. This indicator is the perfect addition to any trader’s toolkit, empowering you to make more confident, data-backed trading decisions with ease.
Upgrade your analysis with AI-powered support and resistance—no more manual lines, only smart levels!

Volumetric Rejection Blocks [UAlgo]The Volumetric Rejection Blocks is designed to help traders identify and visualize key price levels where volumetric rejections occur, which may indicate a shift in market sentiment. These rejections can signal potential trend reversals or areas where price action is likely to face support or resistance. By drawing rejection blocks based on volumetric strength, the indicator allows users to observe where significant buying or selling pressure has been exerted, which can be used as a reference point for future price action.
Also indicator dynamically calculates swing highs and lows, analyzes bullish and bearish strengths based on volume-weighted price movements, and displays rejection blocks on the chart. Each rejection block represents an area where the price attempted to move beyond a certain level but faced rejection, either on a close or wick basis. This can be particularly useful for traders who rely on market structure and order flow to make informed decisions about entering or exiting trades.
🔶 Key Features
Swing Length Customization: Allows users to define the swing length, helping tailor the sensitivity of the swing high and low detection to the specific market conditions.
Rejection Block Visualization: Displays up to the last 10 rejection blocks based on user settings, clearly marking areas of significant bullish or bearish rejections.
Volumetric Strength Analysis: The indicator calculates bullish and bearish strength for each rejection block, based on volume-weighted price movements over the last few bars, giving insight into the intensity of the rejection.
Violation Check Type: Offers two options for violation detection—"Close" and "Wick". This allows traders to specify whether a price level is considered broken only if it closes beyond the level or if any wick breaches it.
Bullish and Bearish Block Coloring: Rejection blocks are colored to represent bullish (green) and bearish (red) rejection areas. The color transparency can be adjusted for clear visibility overlaid on the price chart.
Market Structure Labels: Labels and lines marking "Market Structure Shift" (MSS) and "Break of Structure" (BOS) are displayed, giving traders context about significant market structure changes.
🔶 Interpreting the Indicator
Rejection Blocks: These colored blocks on the chart indicate areas where the price faced significant buying or selling pressure. A green block suggests a bullish rejection (support zone), where buyers absorbed the sell-off, potentially pushing the price upward. Conversely, a red block indicates a bearish rejection (resistance zone), where sellers overpowered buyers, potentially driving the price lower.
Strength Analysis: The width of the green and red sections within a rejection block represents the relative bullish and bearish strengths. A wider green section indicates stronger bullish support, while a wider red section suggests more robust bearish resistance. This helps traders gauge the likelihood of price holding or breaching these levels.
Market Structure Shift (MSS) and Break of Structure (BOS): The indicator automatically detects and labels significant changes in market structure. An "MSS" label indicates the first break, suggesting a potential shift in trend direction. A "BOS" label indicates a subsequent confirmation in trend direction, allowing traders to recognize potential trend continuations.
Violation Check: Traders can choose how to interpret breaks of these rejection blocks. Using the "Close" option provides a more conservative approach, requiring a close beyond the level for confirmation. The "Wick" option is more aggressive, treating any wick beyond the level as a break.
🔶 Disclaimer
Use with Caution: This indicator is provided for educational and informational purposes only and should not be considered as financial advice. Users should exercise caution and perform their own analysis before making trading decisions based on the indicator's signals.
Not Financial Advice: The information provided by this indicator does not constitute financial advice, and the creator (UAlgo) shall not be held responsible for any trading losses incurred as a result of using this indicator.
Backtesting Recommended: Traders are encouraged to backtest the indicator thoroughly on historical data before using it in live trading to assess its performance and suitability for their trading strategies.
Risk Management: Trading involves inherent risks, and users should implement proper risk management strategies, including but not limited to stop-loss orders and position sizing, to mitigate potential losses.
No Guarantees: The accuracy and reliability of the indicator's signals cannot be guaranteed, as they are based on historical price data and past performance may not be indicative of future results.

ICT Setup 02 [TradingFinder] Breaker Blocks + Reversal Candles🔵 Introduction
The "Breaker Block" concept, widely utilized in ICT (Inner Circle Trader) technical analysis, is a crucial tool for identifying reversal points and significant market shifts. Originating from the "Order Block" concept, Breaker Blocks help traders pinpoint support and resistance levels. These blocks are essential for understanding market trends and recognizing optimal entry and exit points.
A Breaker Block is essentially a failed Order Block that changes its role when price action breaks through it. When an Order Block fails to hold as a support or resistance level, it reverses its function, becoming a Breaker Block.
There are two primary types : Bullish Breaker Blocks and Bearish Breaker Blocks. These Breaker Blocks align with the prevailing market trend and indicate potential entry points after a liquidity sweep or a shift in market structure.
Understanding and applying the Breaker Block strategy enables traders to capitalize on the behavior of institutional investors, enhancing their trading outcomes.
Bullish Setup :
Bearish Setup :
🔵 How to Use
The ICT Setup 02 indicator designed to automate the identification of Bullish and Bearish Breaker Blocks. This tool enables traders to easily spot these blocks on a chart and utilize them for entering or exiting trades. Below is a breakdown of how to use this indicator in both bullish and bearish setups.
🟣 Bullish Breaker Block Setup
A Bullish Breaker Block setup is identified in an uptrend, where it serves as a potential entry point. This setup occurs when a Bearish Order Block fails and the price moves above the high of that Order Block. In this scenario, the previously bearish Order Block turns into a Bullish Breaker Block, which now acts as a support level for the price.
To trade a Bullish Breaker Block, wait for the price to retest this newly formed support level. Confirmation of the uptrend can be achieved by analyzing lower time frames for further market structure shifts or other bullish indicators.
A successful retest of the Bullish Breaker Block provides a high-probability entry point for a long trade, as it signals institutional support. Traders often place their stop-loss below the low of the Breaker Block zone to minimize risk.
🟣 Bearish Breaker Block Setup
A Bearish Breaker Block setup, conversely, is used in a downtrend to identify potential sell opportunities. This setup forms when a Bullish Order Block fails, and the price moves below the low of that Order Block.
Once this Order Block is broken, it reverses its role and becomes a Bearish Breaker Block, providing resistance to the price as it pushes downward. For a Bearish Breaker Block trade, wait for the price to retest this resistance level.
A confirmation of the downtrend, such as a market structure shift on a lower time frame or additional bearish signals, strengthens the setup. The Bearish Breaker Block retest provides an opportunity to enter a short position, with a stop-loss placed just above the high of the Breaker Block zone.
🔵 Settings
Pivot Period : This setting controls the look-back period used to identify pivot points that contribute to the detection of Order Blocks. A higher period captures longer-term pivots, while a lower period focuses on more recent price action. Adjusting this parameter allows traders to fine-tune the indicator to match their trading time frame.
Breaker Block Validity Period : This setting defines how long a Breaker Block remains valid based on the number of bars elapsed since its formation. Increasing the validity period keeps Breaker Blocks active for a longer duration, which can be useful for higher time frame analysis.
Mitigation Level BB : This option lets traders choose the level of the Order Block at which the price is expected to react. Options like "Proximal," "50% OB," and "Distal" adjust the zone where a reaction may occur, offering flexibility in setting up the entry and stop-loss levels.
Breaker Block Refinement : The refinement option refines the Breaker Block zone to display a more precise range for aggressive or defensive trading approaches. The "Aggressive" mode provides a tighter range for risk-tolerant traders, while the "Defensive" mode expands the zone for those with a more conservative approach.
🔵 Conclusion
The Breaker Block indicator provides traders with a sophisticated tool for identifying key reversal zones in the market. By leveraging Breaker Blocks, traders can gain insights into institutional order flow and predict critical support and resistance levels.
Using Breaker Blocks in conjunction with other ICT concepts, like Fair Value Gaps or liquidity sweeps, enhances the reliability of trading signals. This indicator empowers traders to make informed decisions, aligning their trades with institutional moves in the market.
As with any trading strategy, it is crucial to incorporate proper risk management, using stop-losses and position sizing to minimize potential losses. The Breaker Block strategy, when applied with discipline and thorough analysis, serves as a powerful addition to any trader’s toolkit.

Moving AveragesWhile this "Moving Averages" indicator may not revolutionize technical analysis, it certainly offers a valuable and efficient solution for traders seeking to streamline their chart analysis process. This all-in-one tool addresses a common frustration among traders: the need to constantly search for and compare different types and lengths of moving averages.
Key Features
The indicator allows for the configuration of up to 5 moving averages simultaneously, providing a comprehensive view of price trends. Users can choose from 7 types of moving averages for each line, including SMA, EMA, WMA, VWMA, HMA, SMMA, and TMA. This variety ensures that traders can apply their preferred moving average types without the need for multiple indicators.
Each moving average can be fully customized in terms of length, color, line style, and thickness, allowing for clear visual differentiation. However, what sets this indicator apart is its "Smart Opacity" feature. When activated, this option dynamically adjusts the transparency of the moving average lines based on their direction, with ascending lines appearing more opaque and descending lines more transparent. This subtle yet effective visual cue aids in quickly identifying trend changes and potential trading signals.
Advantages
The primary benefit of this indicator lies in its convenience. By consolidating multiple moving averages into a single, customizable tool, it saves traders valuable time and reduces chart clutter. The Smart Opacity feature, while not groundbreaking, does offer an intuitive way to visualize trend strength and direction at a glance.
Moreover, the indicator's flexibility makes it suitable for various trading styles and experience levels. Whether you're a novice trader learning to interpret basic trend signals or an experienced analyst fine-tuning a complex strategy, this tool can adapt to your needs.
In conclusion, while this "Moving Averages" indicator may not be a game-changer in the world of technical analysis, it represents a thoughtful refinement of a fundamental trading tool. By focusing on user convenience and visual clarity, it offers a practical solution for traders looking to optimize their chart analysis process and make more informed trading decisions.

Jackson Volume breaker Indication# Jackson Volume Breaker Beta
### Advanced Volume Analysis Indicator
## Description
The Jackson Volume Breaker Beta is a sophisticated volume analysis tool that helps traders identify buying and selling pressure by analyzing price action and volume distribution. This indicator separates and visualizes buying and selling volume based on where the price closes within each candle's range, providing clear insights into market participation and potential trend strength.
## Key Features
1. **Smart Volume Distribution**
- Automatically separates buying and selling volume
- Color-coded volume bars (Green for buying, Red for selling)
- Winning volume always displayed on top for quick visual reference
2. **Real-time Volume Analysis**
- Shows current candle's buy/sell ratio
- Displays total volume with smart number formatting (K, M, B)
- Percentage-based volume distribution
3. **Technical Overlays**
- 20-period Volume Moving Average
- Dynamic scaling relative to price action
- Clean, uncluttered visual design
## How to Use
### Installation
1. Add the indicator to your chart
2. Adjust the Volume Scale input based on your preference (default: 0.08)
3. Toggle the Moving Average display if desired
### Reading the Indicator
#### Volume Bars
- **Green Bars**: Represent buying volume
- **Red Bars**: Represent selling volume
- **Stacking**: The larger volume (winning side) is always displayed on top
- **Height**: Relative to the actual volume, scaled for chart visibility
#### Information Table
The top-right table shows three key pieces of information:
1. **Left Percentage**: Winning side's volume percentage
2. **Middle Percentage**: Losing side's volume percentage
3. **Right Number**: Total volume (abbreviated)
### Trading Applications
1. **Trend Confirmation**
- Strong buying volume in uptrends confirms bullish pressure
- High selling volume in downtrends confirms bearish pressure
- Volume divergence from price can signal potential reversals
2. **Support/Resistance Breaks**
- High volume on breakouts suggests stronger moves
- Low volume on breaks might indicate false breakouts
- Monitor volume distribution for break direction confirmation
3. **Reversal Identification**
- Volume shift from selling to buying can signal potential bottoms
- Shift from buying to selling can indicate potential tops
- Use with price action for better entry/exit points
## Input Parameters
1. **Volume Scale (0.01 to 1.0)**
- Controls the height of volume bars
- Default: 0.08
- Adjust based on your chart size and preference
2. **Show MA (True/False)**
- Toggles 20-period volume moving average
- Useful for identifying volume trends
- Default: True
3. **MA Length (1+)**
- Changes the moving average period
- Default: 20
- Higher values for longer-term volume trends
## Best Practices
1. **Multiple Timeframe Analysis**
- Compare volume patterns across different timeframes
- Look for volume convergence/divergence
- Use higher timeframes for major trend confirmation
2. **Combine with Other Indicators**
- Price action patterns
- Support/resistance levels
- Momentum indicators
- Trend indicators
3. **Volume Pattern Recognition**
- Monitor for unusual volume spikes
- Watch for volume climax patterns
- Identify volume dry-ups
## Tips for Optimization
1. Adjust the Volume Scale based on your chart size
2. Use smaller timeframes for detailed volume analysis
3. Compare current volume bars to historical patterns
4. Watch for volume/price divergences
5. Monitor volume distribution changes near key price levels
## Note
This indicator works best when combined with proper price action analysis and risk management strategies. It should not be used as a standalone trading system but rather as part of a comprehensive trading approach.
## Version History
- Beta Release: Initial public version
- Features buy/sell volume separation, moving average, and real-time analysis
- Optimized for both intraday and swing trading timeframes
## Credits
Developed by Jackson based on other script creators
Special thanks to the trading community for feedback and suggestions

SMA Fibonacci Rainbow Waves[FibonacciFlux]SMA Fibonacci Rainbow Waves
Overview
The SMA Fibonacci Rainbow Waves script is designed for traders who seek to blend simplicity with complexity in their trading strategies. By leveraging multiple Simple Moving Averages (SMAs) weighted by Fibonacci numbers, this indicator provides a nuanced view of price action, allowing traders to capture essential market dynamics while filtering out unnecessary noise.
Key Features
1. Multiple Simple Moving Averages (SMA)
- The indicator employs a series of SMAs to represent both short-term and long-term trends, providing a comprehensive view of market sentiment.
- Each SMA helps identify critical price levels that serve as support and resistance, particularly the purple Fibonacci SMA, which can be pivotal for limit entries. Traders positioned at this level can initiate stop-loss hunts at the institutional level, potentially achieving risk-reward ratios exceeding 30.
2. Fibonacci Weighting
- By applying Fibonacci principles to the SMAs, the indicator enhances adaptability to market conditions.
- This unique approach allows traders to pinpoint significant support and resistance levels within Fibonacci layers, enabling them to anticipate market movements effectively.
3. Dynamic Support and Resistance Levels
- The SMA Fibonacci Rainbow Waves indicator identifies key price levels that act as support and resistance based on Fibonacci layers.
- For instance, on the hourly chart, these levels function as reliable zones for traders to watch for potential reversals, while on the 15-minute chart, a consolidation within the rainbow pocket followed by expansion can signal lucrative trading opportunities.
4. Visual Clarity with Color Coding
- Each SMA is assigned a distinct color, making it easy to differentiate between the various levels on the chart.
- Fills between SMAs visually represent zones of confluence, enhancing the analysis of potential trading opportunities.
Signal Generation and Alerts
- The indicator generates buy and sell signals based on the interactions of the SMAs, providing clear entry and exit points.
- Customizable alerts notify traders of significant market changes, allowing for timely reactions to evolving conditions.
Benefits
1. Simplified Trading Approach
- Traders can focus on significant market trends without distraction, enhancing decision-making efficiency and reducing emotional trading.
2. Flexibility Across Timeframes
- The indicator operates effectively across multiple timeframes, allowing traders to apply its principles in various scenarios, from scalping to longer-term strategies.
3. Enhanced Market Insights
- The combination of multiple SMAs and Fibonacci weighting offers a comprehensive view of market trends, helping traders identify lucrative opportunities that may be overlooked.
4. Bridging Simplicity and Complexity
- This indicator elegantly addresses the contradictions in trading psychology, allowing traders to maintain clarity while navigating complex market dynamics.
Conclusion
The SMA Fibonacci Rainbow Waves script is an essential tool for traders seeking to streamline their analysis while effectively capturing market movements. By integrating Fibonacci principles with multiple SMAs, this indicator empowers traders to follow trends confidently. Its design makes it invaluable for both novice and experienced traders, revealing entry points often missed by traditional indicators.
Open Source Collaboration
This script is available as an open-source project on TradingView, inviting contributions from the global trading community to enhance its functionality. Collaboration ensures it remains a valuable resource for market participants.
Important Note
As with any trading tool, thorough analysis and risk management are crucial when using this indicator. Past performance does not guarantee future results, and traders should always prepare for potential market fluctuations.

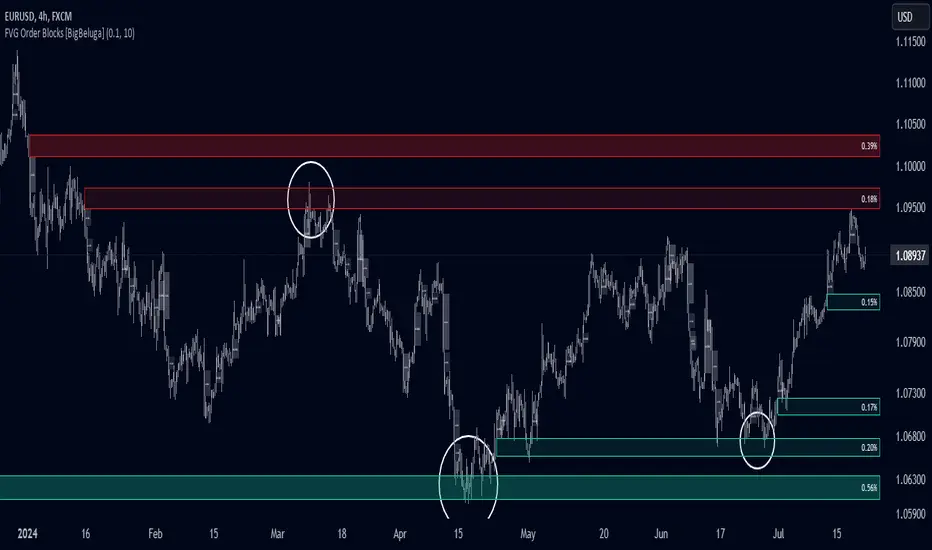
FVG Order Blocks [BigBeluga]This indicator is an advanced tool designed to detect and visualize market FVGs with order blocks, where the price action has created gaps due to strong buying or selling pressure. These FVG often act as critical support and resistance levels, giving traders strategic points for potential entries and exits. The indicator not only identifies these imbalances but also displays their relative strength by size %, helping traders prioritize order blocks that are more likely to hold or break.
The indicator works on various pairs and stocks, it also works on charts that do not provide volume data
Forex (JPY/USD):
Stocks (NVDA):
🔵 KEY FEATURES & USAGE
● FVGs Detection and Visualization:
The indicator detects bullish and bearish FVGs. Bullish FVG occur when there is significant buying, and order block is plotted below the FVG zone:
Conversely, bearish FVG are plotted with an order block above the zone, indicating potential resistance.
Traders can use these order blocks to anticipate price reactions when the market revisits these areas, making them ideal for setting up trades.
● FVG Filtering:
The indicator includes a FVG % filter that allows traders to only display strong order blocks. This ensures that only significant FVG order blocks are shown, reducing noise and focusing on the most impactful areas.
● Highlighting Broken Levels:
When an imbalance level is broken—either breached by price action or no longer relevant—the indicator can either delete the level or mark it with a gray color areas. This provides a clear visual cue that the level has been compromised, allowing traders to adjust their strategies accordingly.
● Order Blocks Signals:
When price retest the blocks, indicator display potential sell or buy signals. Which can be an opportunity for trades
🔵 CUSTOMIZATION
● FVG Filter:
Adjust the strength filter to control which FVGs are displayed based on their percentage size. This filter helps in focusing only on significant blocks that are likely to impact price action.
● Order Blocks Amount Displayed:
Set the maximum number of Order Blocks to be displayed on the chart. This customization helps keep the chart clean and ensures that only the most important blocks are in view.
● Broken Order Blocks Display:
Choose whether to display order blocks that have been broken by the price. This feature helps in maintaining a focus on blocks that are still valid while filtering out those that are no longer relevant.
● Color Customization:
You can customize the colors for bullish and bearish Order Blocks to match your chart's overall color scheme. Additionally, strength bars can be color-coded based on their percentage to quickly identify high-priority order blocks.
Traders who are confident in the settings of the indicator can confidently use it on various types of markets
Price Action Analyst [OmegaTools]Price Action Analyst (PAA) is an advanced trading tool designed to assist traders in identifying key price action structures such as order blocks, market structure shifts, liquidity grabs, and imbalances. With its fully customizable settings, the script offers both novice and experienced traders insights into potential market movements by visually highlighting premium/discount zones, breakout signals, and significant price levels.
This script utilizes complex logic to determine significant price action patterns and provides dynamic tools to spot strong market trends, liquidity pools, and imbalances across different timeframes. It also integrates an internal backtesting function to evaluate win rates based on price interactions with supply and demand zones.
The script combines multiple analysis techniques, including market structure shifts, order block detection, fair value gaps (FVG), and ICT bias detection, to provide a comprehensive and holistic market view.
Key Features:
Order Block Detection: Automatically detects order blocks based on price action and strength analysis, highlighting potential support/resistance zones.
Market Structure Analysis: Tracks internal and external market structure changes with gradient color-coded visuals.
Liquidity Grabs & Breakouts: Detects potential liquidity grab and breakout areas with volume confirmation.
Fair Value Gaps (FVG): Identifies bullish and bearish FVGs based on historical price action and threshold calculations.
ICT Bias: Integrates ICT bias analysis, dynamically adjusting based on higher-timeframe analysis.
Supply and Demand Zones: Highlights supply and demand zones using customizable colors and thresholds, adjusting dynamically based on market conditions.
Trend Lines: Automatically draws trend lines based on significant price pivots, extending them dynamically over time.
Backtesting: Internal backtesting engine to calculate the win rate of signals generated within supply and demand zones.
Percentile-Based Pricing: Plots key percentile price levels to visualize premium, fair, and discount pricing zones.
High Customizability: Offers extensive user input options for adjusting zone detection, color schemes, and structure analysis.
User Guide:
Order Blocks: Order blocks are significant support or resistance zones where strong buyers or sellers previously entered the market. These zones are detected based on pivot points and engulfing price action. The strength of each block is determined by momentum, volume, and liquidity confirmations.
Demand Zones: Displayed in shades of blue based on their strength. The darker the color, the stronger the zone.
Supply Zones: Displayed in shades of red based on their strength. These zones highlight potential resistance areas.
The zones will dynamically extend as long as they remain valid. Users can set a maximum number of order blocks to be displayed.
Market Structure: Market structure is classified into internal and external shifts. A bullish or bearish market structure break (MSB) occurs when the price moves past a previous high or low. This script tracks these breaks and plots them using a gradient color scheme:
Internal Structure: Short-term market structure, highlighting smaller movements.
External Structure: Long-term market shifts, typically more significant.
Users can choose how they want the structure to be visualized through the "Market Structure" setting, choosing from different visual methods.
Liquidity Grabs: The script identifies liquidity grabs (false breakouts designed to trap traders) by monitoring price action around highs and lows of previous bars. These are represented by diamond shapes:
Liquidity Buy: Displayed below bars when a liquidity grab occurs near a low.
Liquidity Sell: Displayed above bars when a liquidity grab occurs near a high.
Breakouts: Breakouts are detected based on strong price momentum beyond key levels:
Breakout Buy: Triggered when the price closes above the highest point of the past 20 bars with confirmation from volume and range expansion.
Breakout Sell: Triggered when the price closes below the lowest point of the past 20 bars, again with volume and range confirmation.
Fair Value Gaps (FVG): Fair value gaps (FVGs) are periods where the price moves too quickly, leaving an unbalanced market condition. The script identifies these gaps:
Bullish FVG: When there is a gap between the low of two previous bars and the high of a recent bar.
Bearish FVG: When a gap occurs between the high of two previous bars and the low of the recent bar.
FVGs are color-coded and can be filtered by their size to focus on more significant gaps.
ICT Bias: The script integrates the ICT methodology by offering an auto-calculated higher-timeframe bias:
Long Bias: Suggests the market is in an uptrend based on higher timeframe analysis.
Short Bias: Indicates a downtrend.
Neutral Bias: Suggests no clear directional bias.
Trend Lines: Automatic trend lines are drawn based on significant pivot highs and lows. These lines will dynamically adjust based on price movement. Users can control the number of trend lines displayed and extend them over time to track developing trends.
Percentile Pricing: The script also plots the 25th percentile (discount zone), 75th percentile (premium zone), and a fair value price. This helps identify whether the current price is overbought (premium) or oversold (discount).
Customization:
Zone Strength Filter: Users can set a minimum strength threshold for order blocks to be displayed.
Color Customization: Users can choose colors for demand and supply zones, market structure, breakouts, and FVGs.
Dynamic Zone Management: The script allows zones to be deleted after a certain number of bars or dynamically adjusts zones based on recent price action.
Max Zone Count: Limits the number of supply and demand zones shown on the chart to maintain clarity.
Backtesting & Win Rate: The script includes a backtesting engine to calculate the percentage of respect on the interaction between price and demand/supply zones. Results are displayed in a table at the bottom of the chart, showing the percentage rating for both long and short zones. Please note that this is not a win rate of a simulated strategy, it simply is a measure to understand if the current assets tends to respect more supply or demand zones.
How to Use:
Load the script onto your chart. The default settings are optimized for identifying key price action zones and structure on intraday charts of liquid assets.
Customize the settings according to your strategy. For example, adjust the "Max Orderblocks" and "Strength Filter" to focus on more significant price action areas.
Monitor the liquidity grabs, breakouts, and FVGs for potential trade opportunities.
Use the bias and market structure analysis to align your trades with the prevailing market trend.
Refer to the backtesting win rates to evaluate the effectiveness of the zones in your trading.
Terms & Conditions:
By using this script, you agree to the following terms:
Educational Purposes Only: This script is provided for informational and educational purposes and does not constitute financial advice. Use at your own risk.
No Warranty: The script is provided "as-is" without any guarantees or warranties regarding its accuracy or completeness. The creator is not responsible for any losses incurred from the use of this tool.
Open-Source License: This script is open-source and may be modified or redistributed in accordance with the TradingView open-source license. Proper credit to the original creator, OmegaTools, must be maintained in any derivative works.

Volumetric Volatility Breaker Blocks [UAlgo]The "Volumetric Volatility Breaker Blocks " indicator is designed for traders who want a comprehensive understanding of market volatility combined with volume analysis. This indicator provides a clear visualization of significant volatility areas (or blocks), characterized by price movements that exceed a specific volatility threshold, as calculated using the ATR (Average True Range). The concept is enhanced by integrating volume-based insights, offering a view of market activity that helps users to recognize when significant price changes are being supported by an appropriate level of market participation.
The indicator calculates breaker blocks for both bullish and bearish market conditions, providing distinct visual elements that identify periods of high volatility and substantial volume divergence. The focus on both volume and volatility makes this tool versatile, allowing traders to assess the strength of price movements as well as areas where price might break above or below previously established levels.
It supports adjustable parameters, such as volatility length, smoothness factor, and volume display, allowing traders to fine-tune the indicator according to their trading strategy and market environment. The highlighted breaker blocks assist in identifying zones of potential price reversal or continuation, which can be critical for making informed trading decisions.
🔶 Key Features
Volatility-Based Block Identification: The indicator uses the Average True Range (ATR) to determine the volatility of the market. When the ATR exceeds a specified threshold (smooth ATR multiplied by a user-defined multiplier), it highlights these areas as volatility blocks. The idea is to mark periods where price activity is significantly divergent from normal conditions, which often signals market opportunities.
Volume Integrated Analysis: In addition to tracking volatility, the indicator incorporates volume data, allowing traders to see the amount of activity that occurs during these high-volatility periods. This helps in identifying whether a price movement is likely sustainable or whether it lacks market support.
User Adjustable Parameters: The indicator offers customization options for the volatility length (using ATR), smooth length, and multiplier for sensitivity adjustment. These settings enable users to modify the indicator’s responsiveness to market conditions.
The option to display the last few volatility blocks allows traders to manage clutter on their charts and focus only on the most recent significant data.
Mitigation Method: Users can select between different mitigation methods ("Close" or "Wick") to determine how blocks are broken. This adds an extra layer of adaptability, allowing traders to modify the indicator's response based on different price action strategies.
Dynamic Visual Representation: The indicator dynamically draws boxes for volatility blocks and shades them according to market direction, with split areas showing the bullish and bearish strength contributions. It also provides percentage volume for each block, helping traders understand the relative market participation during these moves.
🔶 Interpreting the Indicator
Identifying High Volatility Areas: When a new volatility block appears, it signifies that the market is experiencing higher-than-usual volatility, driven by increased ATR values. Traders should pay attention to these blocks, as they often indicate that a significant price move is occurring. Bullish blocks suggest upward pressure, whereas bearish blocks indicate downward pressure.
Volume Insights: The volume associated with each volatility block provides an insight into how much market participation accompanies these moves. Higher volume within a block implies that the market is actively supporting the price change, which may be a sign of continuation. Low volume suggests that the movement may lack the strength to persist.
Bullish vs. Bearish Strength Analysis: Each block is split into bullish and bearish strength, giving a clearer picture of what’s happening within the volatility period. If the bullish portion dominates, it indicates strong upward sentiment during that period. Conversely, if the bearish side is more prominent, there is more selling pressure. This breakdown helps in understanding intra-block market dynamics.
Volume Percentage Display: The indicator also displays the volume percentage in each block, which provides context for the strength of the move relative to recent market activity. Higher percentages mean more market engagement, which could confirm the legitimacy of a trend or a significant breakout.
🔶 Disclaimer
Use with Caution: This indicator is provided for educational and informational purposes only and should not be considered as financial advice. Users should exercise caution and perform their own analysis before making trading decisions based on the indicator's signals.
Not Financial Advice: The information provided by this indicator does not constitute financial advice, and the creator (UAlgo) shall not be held responsible for any trading losses incurred as a result of using this indicator.
Backtesting Recommended: Traders are encouraged to backtest the indicator thoroughly on historical data before using it in live trading to assess its performance and suitability for their trading strategies.
Risk Management: Trading involves inherent risks, and users should implement proper risk management strategies, including but not limited to stop-loss orders and position sizing, to mitigate potential losses.
No Guarantees: The accuracy and reliability of the indicator's signals cannot be guaranteed, as they are based on historical price data and past performance may not be indicative of future results.

Price Action Volumetric Breaker Blocks [UAlgo]The Price Action Volumetric Breaker Blocks indicator is designed to identify and visualize significant price levels in the market. It combines concepts of price action, volume analysis, and market structure to provide traders with a comprehensive view of potential support and resistance areas. This indicator identifies "breaker blocks," which are price zones where the market has shown significant interest in the past.
These blocks are created based on swing highs and lows, and are further analyzed using volume data to determine their strength. The indicator also tracks market structure shifts, providing additional context to price movements.
By visualizing these key levels and market structure changes, traders can gain insights into potential areas of price reversal or continuation, helping them make more informed trading decisions.
🔶 Key Features
Dynamic Breaker Block Identification: The indicator automatically detects and draws breaker blocks based on swing highs and lows. These blocks represent areas of potential support and resistance.
Volume-Weighted Strength Analysis: Each breaker block is analyzed using volume data to determine its bullish and bearish strength. This is visually represented by the proportion of green (bullish) and red (bearish) coloring within each block.
Market Structure Break (MSB) and Break of Structure (BOS): The indicator identifies and labels Market Structure Breaks (MSB) and Break of Structure (BOS) events, providing context to larger market trends.
Customizable Settings:
- Adjustable swing length for identifying pivot points
- Option to show a specific number of recent breaker blocks
- Choice between wick or close price for violation checks
- Toggle to hide overlapping blocks for cleaner analysis
Violation Detection: Automatically detects when a breaker block has been violated (broken through), either by wick or close price, depending on user settings.
Overlap Control: Provides an option to hide overlapping order blocks, ensuring that the chart remains clean and easy to read when multiple blocks are detected in close proximity.
🔶 Interpreting Indicator
Breaker Blocks:
Breaker blocks are key areas where the price moves through and invalidates a previously identified order block. The indicator detects a breaker block when the price violates an order block by exceeding its high or low (depending on whether it's a bullish or bearish block). This violation is determined by either the wick or the close of a candle, depending on the user's selection in the "Violation Check" setting. When a breaker block is detected, the indicator removes the violated order block from the chart, signaling that the zone is no longer relevant for future price action.
Bullish Breaker Block: This occurs when a bearish order block (red) is violated by the price closing above the block’s top boundary or when the wick surpasses this level. It signals that a prior bearish structure has been invalidated, and the market may shift to a bullish trend.
Bearish Breaker Block: This occurs when a bullish order block (teal) is violated by the price closing below the block’s bottom boundary or when the wick drops below it. It suggests that a previous bullish structure has been broken, indicating potential bearish momentum.
Market Structure Labels:
"MSB" (Market Structure Break) labels indicate a potential change in trend direction.
"BOS" (Break of Structure) labels confirm the continuation of the current trend after breaking a significant level.
Block Strength:
A block with more green indicates stronger bullish interest.
A block with more red indicates stronger bearish interest.
The relative sizes of the green and red portions show the balance of power between buyers and sellers at that level.
🔶 Disclaimer
Use with Caution: This indicator is provided for educational and informational purposes only and should not be considered as financial advice. Users should exercise caution and perform their own analysis before making trading decisions based on the indicator's signals.
Not Financial Advice: The information provided by this indicator does not constitute financial advice, and the creator (UAlgo) shall not be held responsible for any trading losses incurred as a result of using this indicator.
Backtesting Recommended: Traders are encouraged to backtest the indicator thoroughly on historical data before using it in live trading to assess its performance and suitability for their trading strategies.
Risk Management: Trading involves inherent risks, and users should implement proper risk management strategies, including but not limited to stop-loss orders and position sizing, to mitigate potential losses.
No Guarantees: The accuracy and reliability of the indicator's signals cannot be guaranteed, as they are based on historical price data and past performance may not be indicative of future results.

Price Action Volumetric Order Blocks [UAlgo]"Price Action Volumetric Order Blocks" indicator aims to identify significant price zones in the market based on a combination of price action and volume analysis. It utilizes the concept of "Order Blocks," which are areas on the chart where large orders are believed to have been placed, influencing price behavior. By analyzing price swings and volume activity, the indicator attempts to highlight potential support and resistance levels.
🔶 Key Features
Swing Length: This input allows you to adjust the timeframe used to identify price swings for order block detection. A longer swing length will focus on larger timeframes and potentially capture stronger order blocks.
Show Last X Order Blocks: This controls the number of order blocks displayed on the chart. You can choose to visualize a specific number of the most recent order blocks.
Violation Check: This setting determines how the indicator identifies potential order block violations. You can choose between "Wick" or "Close" violations. A "Wick" violation occurs when the price (wick) extends beyond the order block boundaries, while a "Close" violation signifies that the closing price breaches the order block.
Hide Overlap: This option allows you to manage the display of overlapping order blocks. If set to "True," only non-overlapping order blocks will be shown, potentially offering a clearer visualization.
Colors: You can customize the color scheme for bullish (upward) and bearish (downward) order blocks to enhance visual clarity on the chart.
🔶 Interpreting the Indicator
Order Blocks: The teal-colored boxes represent bullish order blocks, indicating areas of demand where buying pressure is likely to be strong. Red-colored boxes represent bearish order blocks, indicating areas of supply where selling pressure is likely to be dominant. These zones often signal potential reversal points or consolidation areas.
Strength Calculations: The indicator calculates the relative strength of bullish and bearish blocks based on volume. A higher bullish strength indicates stronger buying pressure, while higher bearish strength suggests more selling pressure. Traders can use this information to gauge the strength of a price level and predict future price movements.
Market Structure Lines: The indicator displays horizontal lines to depict the current market structure, labeled as "MSB" (Market Sell Balance) or "BOS" (Break of Structure). These lines can help visualize the prevailing trend direction.
Order Block Violations: When a price wick or close breaches an order block (depending on the chosen violation type), the corresponding order block visualization is removed from the chart. This can signify a potential weakening of the identified support or resistance zone.
🔶 Disclaimer
Use with Caution: This indicator is provided for educational and informational purposes only and should not be considered as financial advice. Users should exercise caution and perform their own analysis before making trading decisions based on the indicator's signals.
Not Financial Advice: The information provided by this indicator does not constitute financial advice, and the creator (UAlgo) shall not be held responsible for any trading losses incurred as a result of using this indicator.
Backtesting Recommended: Traders are encouraged to backtest the indicator thoroughly on historical data before using it in live trading to assess its performance and suitability for their trading strategies.
Risk Management: Trading involves inherent risks, and users should implement proper risk management strategies, including but not limited to stop-loss orders and position sizing, to mitigate potential losses.
No Guarantees: The accuracy and reliability of the indicator's signals cannot be guaranteed, as they are based on historical price data and past performance may not be indicative of future results.
