Kaufman Adaptive Least Squares Moving AverageIntroduction
It is possible to use a wide variety of filters for the estimation of a least squares moving average, one of the them being the Kaufman adaptive moving average (KAMA) which adapt to the market trend strength, by using KAMA in an lsma we therefore allow for an adaptive low lag filter which might provide a smarter way to remove noise while preserving reactivity.
The Indicator
The lsma aim to minimize the sum of the squared residuals, paired with KAMA we obtain a great adaptive solution for smoothing while conserving reactivity. Length control the period of the efficiency ratio used in KAMA, higher values of length allow for overall smoother results. The pre-filtering option allow for even smoother results by using KAMA as input instead of the raw price.
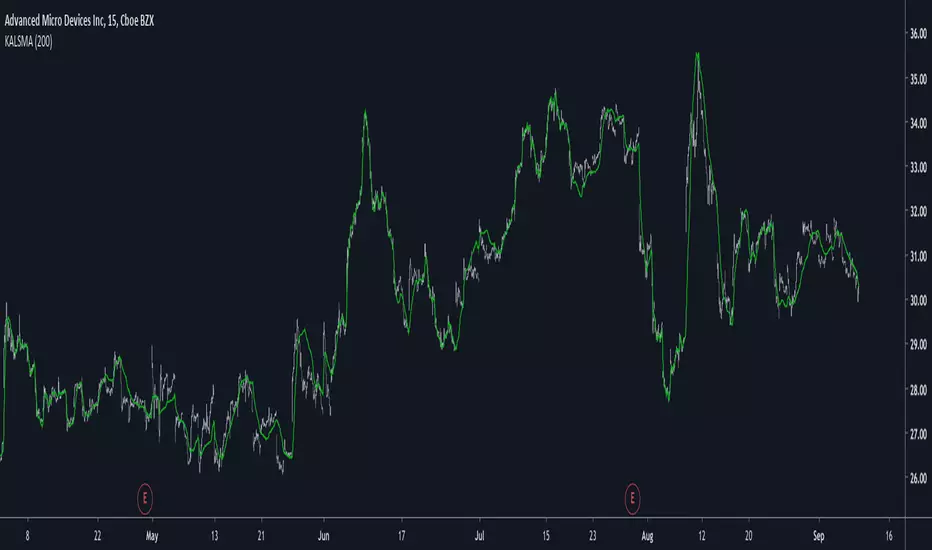
The proposed indicator without pre-filtering in green, a simple moving average in orange, and a lsma with all of them length = 200. The proposed filter allow for fast and precise crosses with the moving average while eliminating major whipsaws.
Same setup with the pre-filtering option, the result are overall smoother.
Conclusion
The provided code allow for the implementation of any filter instead of KAMA, try using your own filters. Thanks for reading :)
Wyszukaj w skryptach "smart"
Kaufman Adaptive Moving AverageKaufman Adaptive Moving Average script.
This indicator was originally developed by Perry J. Kaufman (`Smarter Trading: Improving Performance in Changing Markets`, 1995).

Candle CountingI was talking with one of the biggest hedge fund traders in the world the other day. He goes to me, "Brian, why don't you come and work for us, since you're a better trader than anyone at our firm?" Well I said I would, but there's no one there with an iq as high as mine, so I'd have no one to talk to when I'm eatin my sammiches. Man I'm a savant mate, I'm a f***ing CANDLE COUNTER. I tell people all the time, know your market. And that's your tip of the day really, I mean nobody out there knows Yen better than me. I mean the other day I was 70,000 in the hole, but I didn't get out, I was balls deep making a cheese sammich on the George Forman. Now I mean you can try and do what I'm doing, but understand something, I am 100% smarter than you, and your machines. In the industry, they call me Mr. Yen, I touch the sun, and my d*ck, regularly.

Liquidation Reversal Hunter ## Liquidation Reversal Hunter V2
### What This Indicator Does
Liquidation Reversal Hunter V2 identifies potential reversal zones where significant liquidation events have occurred. It detects abnormal volume spikes combined with large price wicks—conditions that often precede price reversals when leveraged positions are forcibly closed.
The indicator displays:
- **Horizontal zone lines** marking where major liquidations likely occurred
- **Buy/Sell signals** when price action suggests a reversal from these zones
- **Heatmap coloring** showing the relative importance of each zone
---
### How It Works: The Methodology
#### 1. Volume Anomaly Detection (Z-Score Analysis)
The indicator uses statistical z-score analysis to identify abnormal volume:
```
Z-Score = (Current Volume - Average Volume) / Standard Deviation
```
- A z-score ≥ 2.0 indicates volume is 2 standard deviations above average (occurs ~2.5% of the time)
- Higher z-scores indicate increasingly rare and significant volume events
- The lookback period (default 50 bars) establishes the baseline for comparison
This statistical approach adapts to each asset's typical volume profile rather than using fixed thresholds.
#### 2. Liquidation Size Estimation
Liquidation magnitude is estimated by combining volume with price range:
```
Liquidation Size = (Volume in Millions) × (High - Low)
```
This proxy metric captures the "energy" of the move—large volume combined with large price movement suggests significant position liquidation. The indicator then calculates a z-score for this metric to identify statistically significant events.
#### 3. Stop Hunt Pattern Detection
The indicator identifies "stop hunt" patterns—where price sweeps beyond recent swing highs/lows then reverses:
**Bullish Stop Hunt:**
- Price makes a new 5 or 10-bar low
- Candle closes bullish (above open)
- Close is in the upper portion of the range
- Lower wick exceeds body size (for strong patterns)
**Bearish Stop Hunt:**
- Price makes a new 5 or 10-bar high
- Candle closes bearish (below open)
- Close is in the lower portion of the range
- Upper wick exceeds body size (for strong patterns)
These patterns often indicate that stops were triggered before price reversed.
#### 4. Multi-Factor Signal Strength Scoring
Each potential signal is scored on a 0-10 scale based on:
| Factor | Points | Logic |
|--------|--------|-------|
| Volume Z-Score | 0-2 | Higher abnormality = more points |
| Liquidation Magnitude | 0-2 | Larger events = more points |
| Stop Hunt Pattern | 0-2.5 | Strong patterns get bonus points |
| RSI Momentum | 0-1 | Oversold/overbought confirmation |
| Wick Rejection | 0-1.5 | Larger wicks indicate stronger rejection |
| Divergence (optional) | 0-1 | RSI/MACD divergence confirmation |
Signals only trigger when the combined score meets the minimum threshold (default: 2).
#### 5. Smart Zone Cleanup System
Unlike static level indicators, zones are dynamically managed:
- **Tagging**: When price touches a zone, it's marked as "tagged"
- **Sweep Removal**: When price closes beyond a zone, it's removed (level has been "taken out")
- **Time Decay**: Zone importance decays over time (default: 1% per bar)
- **Age Limits**: Old zones are removed unless they maintain high importance
This prevents chart clutter from stale levels.
---
### Why These Components Work Together
The indicator combines three distinct edge concepts:
1. **Volume Anomalies** identify when unusual activity is occurring—often institutional or liquidation-related
2. **Stop Hunt Patterns** identify the specific price action signature of liquidity grabs
3. **Statistical Thresholds** ensure only significant events are flagged, reducing false signals
The combination is more effective than any single approach:
- Volume alone would flag many non-reversal events
- Wicks alone would miss the volume context
- Stop hunts alone might catch minor moves
Together, they filter for high-probability reversal setups where:
- Significant volume entered the market
- Price made an extreme move (likely triggering stops)
- Price action rejected the extreme (wick formation)
---
### How to Use This Indicator
**For Entries:**
1. Wait for a signal flag to appear
2. Confirm with your own analysis (trend, structure, etc.)
3. Consider the zone line as a potential support/resistance level
**For Zone Analysis:**
- **Brighter/thicker lines** = higher importance zones
- **Green zones** = short liquidations occurred (potential support)
- **Red zones** = long liquidations occurred (potential resistance)
- **Dashed lines** = zones that have been tested (tagged)
**Recommended Settings:**
- Lower timeframes (1m-15m): Use stricter filters, fewer max lines
- Higher timeframes (1H+): Can use default or relaxed settings
- High volatility: Increase z-score threshold
- Low volatility: Decrease thresholds
**Best Practices:**
- Use with trend analysis—reversals are higher probability with trend
- Don't trade every signal—use as confluence with other analysis
- Monitor zone reactions—price behavior at zones provides information
---
### Input Settings Explained
**Liquidation Detection:**
- Volume Multiplier: How many times above average volume must be
- Z-Score Threshold: Statistical significance level (2.0 = 95th percentile)
- Min Liquidation Size: Minimum estimated liquidation in millions
**Signal Quality:**
- Stop Hunt Detection: Enable sweep-and-reversal pattern detection
- Divergence Filter: Require RSI/MACD divergence (reduces signals)
- Momentum Filter: Require RSI oversold/overbought
- Signal Cooldown: Minimum bars between signals
**Zone Cleanup:**
- Tagged Zone Lifespan: Bars before tested zones disappear
- Max Zone Age: Oldest zones allowed
- Age Decay Rate: How fast importance decreases
---
### Limitations and Disclaimers
- This indicator identifies potential reversal zones, not guaranteed reversals
- Volume data quality varies by exchange and asset
- Works best on liquid assets with reliable volume data
- Past liquidation zones do not guarantee future reactions
- Always use proper risk management and position sizing
- This is a tool for analysis, not a complete trading system
---
### Summary
Liquidation Reversal Hunter V2 uses statistical analysis of volume anomalies, price action patterns, and dynamic zone management to identify where significant liquidation events have likely occurred. The multi-factor scoring system filters for higher-probability setups while the smart cleanup system keeps the chart clean and focused on relevant levels.

Aether | SkyWalker Cloud Algo☁️ Aether | SkyWalker Cloud Algo
The SkyWalker Cloud Algo is a high-confluence trend-following system designed to filter out market noise and capture significant volatility expansions. By combining a sensitive trailing stop engine (UT Bot) with a "Tri-Factor" of momentum, volume, and trend filters, this script visualizes the market as a navigational flight path—keeping you in the clear "Blue Sky" during uptrends and alerting you to "Storms" during downtrends.
🧠 The Logic Behind the Cloud
This script is not just a buy/sell signal generator; it is a Confluence Engine. A signal is only generated when the core cloud logic aligns with specific atmospheric conditions (Filters).
1. The Core Engine: Variable Sensitivity Cloud (UT Bot)
At its heart, the script uses a modified ATR Trailing Stop (often known as the UT Bot).
Ascend (Bullish): When price breaks above the trailing "Updraft" line.
Descend (Bearish): When price breaks below the trailing "Downdraft" line.
Customization: You can tweak the Sensitivity (ATR Period) and Smoothness (Key Value) to fit any timeframe, from scalping (1m) to swing trading (4H+).
2. The Confluence Filters (The Weather System)
To prevent false signals in choppy markets, the "SkyWalker" logic checks three distinct market forces before confirming a trade:
🌬️ Prevailing Wind (Supertrend): Ensures you are trading in the direction of the macro trend. If the wind is against you, the signal is grounded.
🌡️ Atmospheric Pressure (QQE Mod): Uses a smoothed RSI with volatility bands to detect genuine momentum shifts. It ensures there is enough "pressure" to sustain the move.
💧 Vapor Flow (Chaikin Money Flow): Analyzes volume flow. A Buy signal requires positive money flow (Inflow), and a Sell requires negative money flow (Outflow).
3. Market Structure (SMC)
Optional Filter: You can enable the SMC Structure Alignment in the settings. This forces the algorithm to only take Longs when the market is making Higher Highs and Shorts when making Lower Lows, adding an extra layer of safety.
🌤️ Visuals & The "Flight Deck"
The script completely overhauls the standard chart visual to keep your focus on price action and targets.
Aether Mist: The space between the price and the trailing stop is filled with a dynamic cloud, providing an instant visual read on trend strength.
Dynamic Targets (TP/SL): When a signal fires, the script automatically projects Take Profit and Stop Loss lines on your chart based on volatility (ATR). These lines update in real-time.
The Flight Deck (Dashboard): Located in the corner of your chart, this panel provides a real-time status report of your filters (Wind, Barometer, Flow) and tracks the "Flight Accuracy" (Win Rate) of the signals on the current chart history.
🛠️ How to Use
Entry: Wait for a "🌤️ ASCEND" (Long) or "⛈️ DESCEND" (Short) label. This confirms that price has broken the cloud and all enabled filters (Supertrend, QQE, CMF) are in agreement.
Stop Loss: Place your initial stop at the dotted white line provided by the signal.
Take Profit: Aim for the dashed colored line (Dynamic TP). Alternatively, you can ride the trend until the Cloud changes color.
Trailing: If the "Show Trailing Cloud" option is on, the SL line will move with the price, locking in profits as the trend continues.
⚙️ Settings Overview
Updraft/Downdraft Sensitivity: Lower numbers = faster signals (scalping); Higher numbers = fewer signals (swinging).
Confluence Group: Toggle the Supertrend, QQE, or CMF filters on/off individually to loosen or tighten the strategy.
Visuals: Toggle the Dashboard, TP/SL lines, or the background cloud fill.

Scalp Precision Matrix [BullByte]SCALP PRECISION MATRIX (SPM)
OVERVIEW
Scalp Precision Matrix (SPM) is a comprehensive decision-support framework designed specifically for scalpers and short-term traders. This indicator synthesizes five distinct analytical layers into a unified system that helps identify high-quality setups while avoiding common pitfalls that trap traders.
━━━━━━━━━━━━━━━━━━━━━━━━━━━━━━━━━━━━━━━━━━━
THE CORE PROBLEM THIS INDICATOR ADDRESSES
Scalping demands rapid decision-making while simultaneously processing multiple data points. Traders constantly ask themselves: Is momentum still alive? Am I entering near a potential reversal zone? Is this the right session to trade? What is my actual risk-to-reward? Most traders either overwhelm themselves with too many separate indicators (creating analysis paralysis) or use too few (missing crucial context).
SPM was developed to consolidate these essential checks into one cohesive framework. Rather than overlaying disconnected indicators, each component in SPM directly informs and adjusts the others, creating an integrated analytical system.
━━━━━━━━━━━━━━━━━━━━━━━━━━━━━━━━━━━━━━━━━━━
WHY THESE SPECIFIC COMPONENTS AND HOW THEY WORK TOGETHER
The five analytical layers in SPM are not arbitrarily combined. Each addresses a specific question in the scalping decision process, and together they form a logical workflow:
LAYER 1: MOMENTUM FUEL GAUGE
This answers the question: "Does the current move still have energy?"
After any impulse move (a significant directional price movement), momentum naturally decays over time. The Fuel Gauge estimates remaining momentum by analyzing four factors:
Body Strength (30% weight): Compares recent candle body sizes against the historical average. Strong momentum produces candles with large bodies relative to their wicks. The calculation takes the 3-bar average body size divided by the 20-bar average body size, then scales it to a 0-100 range.
Wick Rejection (25% weight): Measures the wick-to-body ratio. When wicks are large relative to bodies, it suggests rejection and weakening momentum. A ratio of 2.0 or higher (wicks twice the body size) scores low; smaller ratios score higher.
Volume Consistency (20% weight): Compares recent 3-bar average volume against the lookback period average. Sustained moves require consistent volume support. Volume dropping off suggests the move may be losing participation.
Time Decay (25% weight): Tracks how many bars have passed since the last detected impulse. Momentum naturally fades over time. The typical impulse duration is adjusted based on the current volatility regime.
These components are weighted and combined, then smoothed with a 3-period EMA to reduce noise. The result is a 0-100% gauge where:
- Above 70% = Strong momentum (green)
- 40-70% = Moderate momentum (amber)
- Below 40% = Weak momentum (red)
- Below 20% = Exhausted (triggers EXIT warning)
The Fuel Gauge also estimates how many bars of momentum remain based on the current burn rate.
IMPORTANT DISCLAIMER : The Fuel Gauge is NOT order flow, volume profile, or depth of market data. It is a technical proxy calculated entirely from standard OHLCV (Open, High, Low, Close, Volume) data. The term "Fuel" is used metaphorically to represent estimated remaining momentum energy.
LAYER 2: TRAP ZONE DETECTION
This answers the question: "Am I walking into a potential reversal area?"
Price tends to reverse at levels where it has reversed before. SPM identifies these zones by detecting clusters of historical swing points:
How it works:
1. The indicator detects swing highs and swing lows using the Swing Detection Length setting (default 5 bars on each side required to confirm a pivot).
2. Recent swing points are stored (up to 10 of each type).
3. For each potential zone, the algorithm counts how many swing points cluster within a tolerance of 0.5 ATR.
4. Zones with 2 or more clustered swing points, positioned between 0.3 and 4.0 ATR from current price, are marked as Trap Zones.
5. A Confluence Score is calculated based on cluster density and proximity to current price.
The percentage displayed (e.g., "TRAP 85%") is a CONFLUENCE SCORE, not a probability. Higher percentages mean more swing points cluster at that level and price is closer to it. This indicates stronger historical significance, not a prediction of future reversal.
CRITICAL DISCLAIMER : Trap Zones are NOT institutional order flow, liquidity pools, smart money footprints, or any proprietary data feed. They are calculated purely from historical swing point clustering using standard technical analysis. The term "trap" describes how price action has historically reversed at these levels, potentially trapping traders who enter prematurely. This is pattern recognition, not market structure data.
LAYER 3: VELOCITY ANALYSIS
This answers the question: "Is price moving favorably right now?"
Velocity measures how fast price is currently moving compared to its recent average:
Calculation:
- Current velocity = Absolute price change from previous bar divided by ATR
- Average velocity = Simple moving average of velocity over the lookback period
- Velocity ratio = Current velocity divided by average velocity
Classification:
- FAST (ratio above 1.5 ): Price is moving significantly faster than normal. Good for momentum continuation plays.
- NORMAL (ratio 0.5 to 1.5) : Typical price movement speed.
- SLOW (ratio below 0.5 ): Price is moving sluggishly. Often indicates ranging or choppy conditions where scalping becomes difficult.
The velocity score contributes 18% to the overall quality score calculation.
LAYER 4: SESSION AWARENESS
This answers the question: "Is this a good time to trade?"
Different trading sessions have different characteristics. SPM automatically detects which major session is active and adjusts its quality assessment:
Session Times (all in UTC):
- A sia Session : 00:00 - 08:00 UTC
- London Session : 08:00 - 16:00 UTC
- New York Session : 13:00 - 21:00 UTC
- London/NY Overlap : 13:00 - 16:00 UTC
- Off-Peak : Outside major sessions
Session Quality Weighting:
- Overlap : 100 points (highest liquidity, best movement)
- London : 85 points
- New York : 80 points
- Asia : 50 points (tends to range more)
- Off-Peak : 30 points (lower liquidity, more false signals)
The session score contributes 17% to the overall quality calculation. Signals are also filtered to prevent firing during off-peak hours.
Note : These are fixed UTC times and may not perfectly match your broker's session boundaries. Use them as general guidance rather than precise timing.
LAYER 5: VOLATILITY REGIME ADAPTATION
This answers the question: "How should I adjust for current market conditions?"
SPM compares current volatility (14-period ATR) against historical volatility (50-period ATR) to categorize the market:
HIGH Volatility (ratio above 1.3): Current ATR is 30%+ above normal. SPM widens thresholds to filter noise and extends target projections.
NORMAL Volatility (ratio 0.7 to 1.3): Typical conditions. Standard parameters apply.
LOW Volatility (ratio below 0.7): Current ATR is 30%+ below normal. SPM tightens thresholds for sensitivity and reduces target expectations. The market state may show AVOID during prolonged low volatility.
This adaptation prevents false signals during erratic markets and missed signals during quiet markets.
━━━━━━━━━━━━━━━━━━━━━━━━━━━━━━━━━━━━━━━━━━━
THE SYNERGY: WHY THIS COMBINATION MATTERS
These five layers are not independent indicators placed on one chart. They form an interconnected system:
- A signal only fires when momentum exists (Fuel above 40%), price is away from danger zones (Trap Zones factored into quality score), movement is favorable (Velocity contributes to score), timing is appropriate (Session is not off-peak), and volatility is accounted for (thresholds adapt to regime).
- The Trap Zones directly influence Entry Zone placement. Entry zones are positioned beyond trap zones to avoid getting caught in reversals.
- Target projections automatically adjust to avoid placing take-profit levels inside detected trap zones.
- The Fuel Gauge affects which signal tier fires. Insufficient fuel prevents all signals.
- Session quality is weighted into the overall score, reducing signal quality during less favorable trading hours.
This integration is the core originality of SPM. Each component makes the others more useful than they would be in isolation.
━━━━━━━━━━━━━━━━━━━━━━━━━━━━━━━━━━━━━━━━━━━
HOW THE QUALITY SCORE IS CALCULATED
The Quality Score (0-100) synthesizes all layers into a single number for each direction (long and short):
For Long Quality Score:
- Fuel Component (28% weight) : Full fuel value if impulse direction is bullish; 60% of fuel value otherwise
- Trap Avoidance (22% weight) : 75 points if no trap zone below; otherwise 100 minus the trap confluence score (minimum 20)
- Velocity Component (18% weight) : Direct velocity score
- Session Component (17% weight) : Current session quality score
- Trend Alignment (15% bonus) : Adds 12 points if price is above the 20-period SMA
For Short Quality Score:
- Same structure but reversed (bearish impulse direction, trap zone above, price below SMA)
The direction with the higher score becomes the current Bias. A 12-point difference is required to switch bias, preventing flip-flopping in neutral conditions.
━━━━━━━━━━━━━━━━━━━━━━━━━━━━━━━━━━━━━━━━━━━
SIGNAL TYPES AND WHAT THEY MEAN
SPM generates four types of signals, each with specific visual representation:
PRIME SIGNALS (Cyan Diamond)
These represent the highest quality confluence. Requirements:
- Quality score crosses above the Prime threshold (default 80)
- Bias aligns with signal direction
- Fuel is sufficient (above 40%)
- Session is active (not off-peak)
- Cooldown period has passed
Prime signals appear as cyan-colored diamond shapes. Long signals appear below the bar; short signals appear above.
STANDARD SIGNALS (Green Triangle Up / Red Triangle Down)
These represent good quality setups. Requirements:
- Quality score crosses above the Standard threshold (default 75) but below Prime
- Same bias, fuel, and cooldown requirements as Prime
Standard signals appear as small triangles in green (long) or red (short).
CAUTION SIGNALS (Small Faded Circle)
These represent minimum threshold setups. Requirements:
- Quality score crosses above the Caution threshold (default 65) but below Standard
- Same additional requirements
Caution signals appear as small, faded circles. These suggest the setup exists but with weaker confluence. Consider these only when broader market context supports them, or skip them entirely during uncertain conditions.
EXHAUSTION SIGNAL (Purple X with "EXIT" text)
This warning appears when the Fuel Gauge drops below 20% from above, indicating momentum has depleted. This is not a trade signal but a warning to:
- Consider exiting existing positions
- Avoid entering new trades in the current direction
- Wait for new momentum to develop
All signals use CONFIRMED bar data only (referencing the previous closed bar) to prevent repainting. Once a signal appears, it will never disappear or change position on historical bars.
━━━━━━━━━━━━━━━━━━━━━━━━━━━━━━━━━━━━━━━━━━━
READING THE CHART ELEMENTS
TRAP ZONES (Red Dashed Box with "TRAP XX%" Label)
These mark price levels where multiple historical swing points cluster. The red dashed box shows the zone boundaries. The percentage is the confluence score indicating cluster strength and proximity.
How to use: When price approaches a trap zone, be cautious about entering in that direction. If your bias is LONG and there's a strong trap zone above, consider taking partial profits before price reaches it or adjusting your target below it.
ENTRY ZONES (Green Solid Box with "ENTRY" Label)
These show suggested entry areas based on the current bias direction. For LONG bias, the entry zone appears below the trap zone (buying the dip beyond support). For SHORT bias, it appears above the trap zone (selling the rally beyond resistance).
How to use: Rather than entering at current price, consider placing limit orders within the entry zone. This positions you beyond where typical trap reversals occur.
TARGET ZONES (Blue Dotted Box with "TARGET" Label)
These project potential take-profit areas based on ATR multiples, adjusted for:
- Current volatility regime (wider in high volatility, tighter in low)
- Impulse direction (larger targets when aligned with impulse)
- Nearby trap zones (targets adjust to avoid placing TP inside trap zones)
How to use: These are suggestions, not guarantees. Consider taking partial profits before the target or using trailing stops once price moves favorably.
STOP LEVEL (Orange Dashed Line with "STOP" Label)
This shows suggested stop-loss placement, calculated as 0.8 ATR beyond the trap zone (or 2.0 ATR from current price if no trap zone exists).
How to use: This provides a reference for risk calculation. The dashboard R:R ratio is calculated using this stop level.
Chart Example: Scalp Precision Matrix displays real-time market analysis through dynamic zones and quality scores. ENTRY/TARGET/STOP zones show potential price levels based on current market structure - they appear continuously as reference points, NOT as trade instructions. Actual trade signals (diamonds, triangles, circles) fire only when multiple conditions align: quality score thresholds are crossed, fuel gauge is sufficient, session is active, and cooldown period has passed. The zones help you understand market context; the signals tell you when to act.
━━━━━━━━━━━━━━━━━━━━━━━━━━━━━━━━━━━━━━━━━━━
UNDERSTANDING THE DASHBOARD (Top Right Panel)
The main dashboard provides comprehensive market context:
Row 1 - Header:
- "SPM " : Indicator name
- Market State : Current overall condition
Market States Explained:
- PRIME : Excellent conditions. Quality score meets prime threshold, session is active. Best opportunities.
- READY : Good conditions. Quality score meets standard threshold. Solid setups available.
- WAIT : Mixed conditions. Some factors favorable, others not. Patience recommended.
- AVOID : Poor conditions. Off-peak session or very low volatility. High risk of false signals.
- EXIT : Fuel exhausted. Momentum depleted. Consider closing positions or waiting.
Row 2-3 - Quality Bars:
- " UP ########## " : Visual meter for long quality (each # = 10 points, . = empty)
- " DN ########## " : Visual meter for short quality
- The number on the right shows the exact quality score
Row 4 - Bias:
- Shows current directional lean: LONG, SHORT, or NEUTRAL
- Color-coded: Green for long, red for short, gray for neutral
Rows 5-7 (Full Mode Only) - Trade Levels:
- Entry : Suggested entry price for current bias direction
- Stop : Suggested stop-loss price
- Target : Projected take-profit price
Row 8 - Risk:Reward Ratio:
- Format : "1:X.X" where X.X is the reward multiple
- Color-coded : Green if 2:1 or better, amber if 1.5:1 to 2:1, red if below 1.5:1
Row 9 - Fuel:
- Shows percentage and estimated bars remaining in parentheses
- Example : "72% (8)" means 72% fuel with approximately 8 bars remaining
- Color-coded : Green above 70%, amber 40-70%, red below 40%
Row 10-11 (Full Mode Only) - Market Conditions:
- Vol : Current volatility regime (HIGH/NORMAL/LOW)
- Speed : Current velocity zone (FAST/NORMAL/SLOW)
Row 12 - Session:
- Shows active trading session
- Color-coded by session type
Row 13 (Full Mode Only) - Remaining:
- Time remaining in current session (hours and minutes)
Row 14 (Conditional) - Trap Warning:
- Appears when a significant trap zone exists in your bias direction
- Shows direction (ABOVE/BELOW) and confluence percentage
━━━━━━━━━━━━━━━━━━━━━━━━━━━━━━━━━━━━━━━━━━━
UNDERSTANDING THE QUICK PANEL (Bottom Left)
The Quick Panel provides essential information at a glance without looking away from price action:
Row 1: Current Bias and Quality Score (large text for quick reading)
Row 2: Market State
Row 3: Fuel Percentage
Row 4: Estimated Bars Remaining
Row 5: Risk:Reward Ratio
Row 6: Current Session
Both panels can be repositioned using the settings, and each can be toggled on/off independently.
━━━━━━━━━━━━━━━━━━━━━━━━━━━━━━━━━━━━━━━━━━━
SETTINGS EXPLAINED
CORE SETTINGS:
Analysis Lookback (Default: 20)
Number of bars used for statistical calculations including average volume and average body size. Higher values create smoother but slower-reacting analysis. Lower values are more responsive but may include more noise.
Swing Detection Length (Default: 5)
Bars required on each side to confirm a swing high or low. A setting of 5 means a swing high must have 5 lower highs on each side. Lower values detect more swings (more trap zones, more sensitivity). Higher values find only major pivots (fewer but more significant zones).
Impulse Sensitivity (Default: 1.5)
Multiplier for ATR when detecting impulse moves. Lower values (like 1.0) detect smaller price movements as impulses, refreshing the fuel gauge more frequently. Higher values (like 2.5) require larger moves, making impulse detection less frequent but more significant.
SIGNAL SETTINGS:
Prime/Standard/Caution Thresholds (Defaults: 80/75/65)
These control the quality score required for each signal tier. You can adjust these based on your preference:
- More conservative : Raise thresholds (e.g., 85/80/70) for fewer but higher-quality signals
- More aggressive : Lower thresholds (e.g., 75/70/60) for more signals with slightly lower quality
Signal Cooldown (Default: 8 bars)
Minimum bars between signals to prevent signal spam. After any signal fires, no new signals can appear until this many bars pass. Increase for fewer signals in choppy markets; decrease if you want faster signal refresh.
Show Prime/Standard/Caution/Exhaustion Signals
Toggle each signal type on or off based on your preference.
ZONE DISPLAY:
Show Trap Zones / Entry Zones / Target Zones / Stop Levels
Toggle each zone type on or off. Turning off zones you don't use reduces chart clutter.
Zone Transparency (Default: 88)
Controls how transparent zone boxes appear. Higher values (closer to 95) make zones barely visible; lower values (closer to 75) make them more prominent.
Zone History (Default: 25 bars)
How far back zone boxes extend on the chart. Purely visual preference.
BACKGROUND:
Background Mode (Options: Off, Subtle, Normal)
Controls whether and how intensely the chart background is colored. Subtle is barely noticeable; Normal is more visible; Off disables background coloring entirely.
Background Type (Options: Bias, Fuel)
- Bias : Colors background based on current directional lean (green for long, red for short)
- Fuel : Colors background based on momentum level (green for high fuel, amber for moderate, red for low)
DASHBOARD / QUICK PANEL:
Show Dashboard / Show Quick Panel
Toggle each panel on or off.
Compact Mode
When enabled, the main dashboard shows only essential rows (quality bars, bias, R:R, fuel, session) without entry/stop/target levels, volatility, velocity, or time remaining.
Position Settings
Choose where each panel appears on your chart from six options: Top Right, Top Left, Bottom Right, Bottom Left, Middle Right, Middle Left.
ALERTS:
Alert Prime Signals / Standard Signals / Fuel Exhaustion
Enable or disable TradingView alerts for each condition. When enabled, you can set up alerts in TradingView that will notify you when these conditions occur.
━━━━━━━━━━━━━━━━━━━━━━━━━━━━━━━━━━━━━━━━━━━
RECOMMENDED TIMEFRAMES AND USAGE
OPTIMAL TIMEFRAMES:
- 1-minute to 5-minute : Best for active scalping with quick entries and exits
- 5-minute to 15-minute : Balanced scalping with slightly more confirmation
- 15-minute to 1-hour : Short-term swing entries, fewer but more significant signals
Zone visualizations only appear on intraday timeframes to prevent chart clutter on higher timeframes.
BEST PRACTICES:
1. Trade primarily during LONDON, NEW YORK, or OVERLAP sessions. The indicator weights these sessions higher for good reason - liquidity and movement are typically better.
2. Prioritize PRIME signals. These represent the highest confluence and have proven most reliable. Use STANDARD signals as secondary opportunities. Treat CAUTION signals with extra scrutiny.
3. Respect the Fuel Gauge. Avoid entering new positions when fuel is below 40%. When the EXIT signal appears, seriously consider closing or reducing positions.
4. Pay attention to TRAP warnings. When the dashboard shows a trap zone in your bias direction, be cautious about holding through that level.
5. Verify R:R before entry. The dashboard shows the risk-to-reward ratio. Ensure it meets your minimum requirements (many traders require at least 1.5:1 or 2:1).
6. When state shows AVOID or EXIT, step back. These conditions typically produce poor results.
7. Combine with your own analysis. SPM is a decision-support tool, not a standalone system. Use it alongside your understanding of market structure, news events, and overall context.
━━━━━━━━━━━━━━━━━━━━━━━━━━━━━━━━━━━━━━━━━━━
PRACTICAL EXAMPLE
Scenario : You're watching a 5-minute chart during London session. A cyan diamond (Prime Long signal) appears below the bar.
Before entering, you check the dashboard:
- State shows "PRIME" - conditions are favorable
- Fuel shows "72% (8)" - plenty of momentum remaining (approximately 8 bars)
- R:R shows "1:2.3" - acceptable risk-to-reward ratio
- Session shows "LONDON" - active session with good liquidity
- No TRAP warning in dashboard - no immediate resistance cluster in your way
- Entry zone visible on chart at a lower price level
- Stop and Target zones clearly marked
With this confluence of factors, you have context for a more informed decision. The signal indicates quality, the fuel suggests momentum remains, the R:R is favorable, and no immediate trap threatens your trade.
However, you also notice the target zone sits just below where a trap zone would be if there were one. This is by design - SPM adjusts targets to avoid placing them inside reversal zones.
This multi-factor confirmation delivered in a single glance is what SPM provides.
Chart Example :This chart demonstrates how the Scalp Precision Matrix identifies key market transitions. After a strong bullish impulse (cyan PRIME signal at ~08:30), price reached a historical reversal cluster (TRAP ZONE at 92,300). The indicator detected momentum exhaustion (purple EXIT signal) as fuel dropped below 20%, warning traders to exit longs. Now showing a SHORT bias with entry/stop/target zones clearly marked. The 92% trap zone confluence indicates a strong cluster of previous swing highs where price historically reversed.
━━━━━━━━━━━━━━━━━━━━━━━━━━━━━━━━━━━━━━━━━━━
DATA WINDOW VALUES
For detailed analysis and strategy development, SPM exports the following values to TradingView's Data Window (visible when you hover over the chart with the indicator selected):
- Long Quality Score (0-100)
- Short Quality Score (0-100)
- Fuel Gauge (0-100%)
- Risk:Reward Ratio
These values can be useful for understanding how the indicator behaves over time and for developing your own insights about when it works best for your trading style.
━━━━━━━━━━━━━━━━━━━━━━━━━━━━━━━━━━━━━━━━━━━
NON-REPAINTING CONFIRMATION
All signals in SPM are generated using CONFIRMED bar data only. The signal logic references the previous closed bar's values ( and in Pine Script terms). This means:
- Signals appear at the OPEN of the new bar (after the previous bar closes)
- Signals will NEVER disappear once they appear
- Signals will NEVER change position on historical bars
- What you see in backtesting is what you would have seen in real-time
The dashboard and zones update in real-time to provide current market context, but the trading signals themselves are non-repainting.
━━━━━━━━━━━━━━━━━━━━━━━━━━━━━━━━━━━━━━━━━━━
IMPORTANT DISCLAIMERS
TERMINOLOGY CLARIFICATION:
This indicator uses terms that might imply access to data it does not have. To be completely transparent:
- "Trap Zones" are calculated from historical swing point clustering. They are NOT institutional liquidity pools, order blocks, smart money footprints, or any form of order flow data. The term "trap" is metaphorical, describing how price has historically reversed at these levels.
- "Fuel Gauge" is a technical momentum proxy. It is NOT order flow, volume profile, depth of market, or bid/ask data. It estimates momentum remaining based entirely on standard OHLCV price and volume data.
- "Quality Scores" are weighted combinations of the technical factors described above. A high score indicates multiple conditions align favorably according to the indicator's logic. It does NOT predict or guarantee trade success.
- The percentages shown on trap zones are CONFLUENCE SCORES measuring cluster density and proximity. They are NOT probability predictions of reversal.
TRADING RISK WARNING:
Trading involves substantial risk of loss and is not suitable for all investors. This indicator is a technical analysis tool designed to assist with decision-making. It does not constitute financial advice, trading advice, or any other sort of advice. Past performance of any signal or pattern does not guarantee future results. Markets are inherently unpredictable.
Always use proper risk management. Define your risk before entering any trade. Never risk more than you can afford to lose. Consider consulting with a licensed financial advisor before making trading decisions.
━━━━━━━━━━━━━━━━━━━━━━━━━━━━━━━━━━━━━━━━━━━
ORIGINALITY STATEMENT - NOT A MASHUP
Scalp Precision Matrix is an original work that combines several analytical concepts into a purpose-built scalping framework. While individual components like ATR calculations, pivot detection, session timing, and trend alignment exist in various forms elsewhere, the specific implementation here represents original synthesis:
- The Fuel Gauge decay model with its four-component weighted calculation
- The Trap Zone cluster detection with confluence scoring
- The multi-factor quality scoring system that integrates all layers
- The trap-aware entry and target zone placement logic
- The volatility regime adaptation across all components
- The session weighting is integrated into the quality assessment
The indicator does not simply overlay separate indicators on one chart. It creates interconnected layers where each component informs and adjusts the others. This integration is the core originality of SPM.
━━━━━━━━━━━━━━━━━━━━━━━━━━━━━━━━━━━━━━━━━━━
For best results, combine SPM with your own market understanding and always practice proper risk management.
-BullByte

CandelaCharts - SMT 📝 Overview
The CandelaCharts – SMT indicator is a professional-grade Smart Money Technique (SMT) divergence detector designed to compare price action between correlated markets (intermarket analysis).
It identifies moments where the main chart makes a swing high or low while one or more comparison symbols fail to confirm the move—revealing potential institutional imbalance, distribution, or accumulation .
By automatically detecting pivot-based divergences and drawing clean, contextual lines and labels directly on price, SMT helps traders spot high-probability reversal or continuation zones driven by relative strength and weakness across markets.
📦 Features
Automatic SMT divergence detection – Identifies divergences between the main chart and up to two comparison symbols.
Pivot-based logic – Uses swing highs and swing lows to ensure structurally meaningful SMT signals.
Dual-symbol comparison – Compare the main market against one or two correlated instruments simultaneously.
Bullish & bearish SMT filtering – Show only bullish, bearish, or both divergence types.
Clear visual mapping – Divergence lines are drawn directly between pivots for intuitive price-context reading.
Smart labels – Compact labels display symbol(s), volume, and directional markers.
Detailed tooltips – Hover tooltips include divergence type, symbols involved, prices, volume, timestamps, and pivot settings.
Highly customizable visuals – Control colors, line width, and label styling.
⚙️ Settings
Lookback – Pivot lookback length used to detect swing highs and lows. Higher values produce fewer but more significant SMT signals.
Bias – Control which SMTs are displayed: Both, Bearish or Bullish
Swing High Color – Line and label color for SMT at swing highs.
Swing Low Color – Line and label color for SMT at swing lows.
Line Width – Thickness of SMT divergence lines.
Symbol 1 – Enable and select the first comparison instrument (e.g., NQ vs ES).
Symbol 2 – Enable and select the second comparison instrument (optional).
⚡️ Showcase
Bullish and Bearish SMTs
Bearish SMTs
Bullish SMTs
🚨 Alerts
This indicator does not include built-in alert conditions.
⚠️ Disclaimer
This indicator is provided for educational and informational purposes only and does not constitute financial or investment advice. Trading and investing involve substantial risk, and losses can exceed expectations. Past performance is not indicative of future results. You are solely responsible for your trading decisions. CandelaCharts assumes no liability for any outcomes resulting from the use of this indicator.

Pullbacks CompletoThis indicator is a comprehensive Trend Following toolkit that combines two distinct, high-probability pullback strategies into a single, intelligent interface. It is designed to help traders identify precise entry points during corrections in established trends, filtering out low-quality noise.
The indicator features Smart Conflict Detection: if the two strategies generate opposing signals on the same candle, the system blocks the individual alerts and displays a Purple "X", warning the trader of market indecision.
Strategy 1: Stoch Pullback (Triangles)
Visual: Green/Red Triangles Logic:
Trend: Defined by the alignment of the Fast EMA (21) and Slow EMA (100).
The Setup: The indicator waits for the Stochastic RSI to enter an Overbought or Oversold zone.
Strict Filter: A signal is only valid if, while in the zone, the price physically tests the Fast EMA (closes against it). This filters out "shallow" pullbacks.
Trigger: The signal is fired when the Stochastic RSI crosses back out of the extreme zone, resuming the trend.
Strategy 2: Dave Landry Setup (Dots)
Visual: Green/Red Circles Logic:
Trend: Filtered by MACD Histogram momentum and the relation to the Fast EMA (21).
The Pattern: Looks for a correction of at least 2 candles making lower lows (for uptrends) or higher highs (for downtrends).
Trigger: Enters when the price breaks the high/low of the previous candle, provided it closes in favor of the EMA 21.
Anti-Climax Filter: Includes a "Stretched" filter to prevent buying/selling on exhausted "Elephant Bars" (huge candles that have already consumed the move).
Key Features
Dual Alert System: Receive specific alerts for "Pullback" or "Landry" setups.
Conflict Warning: If Strategy A says "Buy" and Strategy B says "Sell" simultaneously, a "Doubtful Signal" alert is triggered, and a purple Cross appears on the chart.
Smart Visibility: The indicator automatically hides or shows the Moving Averages depending on which strategies you have enabled in the settings.
Educational Tooltips: Hover over the "i" icons in the settings menu to read the rationale behind each specific filter.
How to Use
Green Triangle: Look for Long opportunities (Stoch Pullback).
Green Dot: Look for Long opportunities (Landry Breakout).
Red Triangle: Look for Short opportunities (Stoch Pullback).
Red Dot: Look for Short opportunities (Landry Breakout).
Purple X: Stay Out. The setups are conflicting (Trend vs. Momentum disagreement).
Configuration You can toggle each strategy on/off in the settings menu. You can also choose to display the Overbought/Oversold background zones to visualize where the Stoch Pullback is "arming".

SA Range Rank WMT DAY 1.13.2026 PM SESSIONDAILY — PREPARE / POSITION MODE
Developer Note: Bias & Position Framing
This daily view is preparatory, not executable.
The purpose of the Daily timeframe is to define directional bias, not entries.
It helps frame which side of the market deserves attention and which activity should be ignored.
The goal here is context, not action.
________________________________________
Purpose on Daily
The Daily timeframe is used to:
• Define directional bias for the week
• Prepare position-building zones
• Identify environments where participation is unnecessary or elevated-risk
• Reduce overtrading by narrowing focus
Daily charts answer one question only:
“If I participate this week, which side makes sense?”
________________________________________
What Matters Most (Public View)
SA Range Indicator (RI):
→ Is the market transitioning or trending?
→ Is energy building, releasing, or rotating?
SA ZoneEngine (visual context only):
→ Are daily moves aligned with higher-timeframe structure?
→ Is price operating with or against dominant bias?
These visuals explain environment, not decisions.
________________________________________
How to Interpret Public Daily Posts
• Daily is not timing
• Daily is not execution
• Daily is not a signal
Daily charts prepare the trader mentally and structurally by clarifying:
• what deserves patience
• what deserves caution
• what deserves no attention at all
________________________________________
Messaging Line
“Daily charts prepare the trade — they don’t execute it.”
________________________________________
SEO Intent
daily equity bias, position preparation, market structure analysis
________________________________________
🤝 For Those Who Find Value
If these daily posts help you see the market more clearly:
• Follow, boost, and share my scripts, Ideas, and MINDS posts
• Feel free to message me directly with questions or build requests
• Constructive feedback and collaboration are always welcome
For traders who want to go deeper, optional memberships may include:
• Additional signal access
• Early previews
• Occasional free tools and upgrades
🔗 Membership & Signals
trianchor.gumroad.com
________________________________________
________________________________________
⏱ 15-MIN — PREPARE / POSITION MODE
Developer Note: Setup Formation Phase
The 15-minute timeframe is where setups begin to form, not where they are acted on.
This view exists to separate developing structure from noise.
________________________________________
Purpose on 15-Minute
The 15-minute timeframe is used to:
• Spot trap-prone conditions
• Identify developing structure
• Observe compression, rotation, or early expansion
• Prepare for execution — without acting
This timeframe answers a different question:
“Is something forming — or is this noise?”
________________________________________
What Matters Most (Public View)
SA Range Indicator (RI):
→ Compression → expansion transitions
→ Energy buildup vs premature release
SA CloudRegimes (visual only):
→ Whether price behavior reflects continuation, pullback, or contraction
→ Whether movement is controlled or impulsive
These visuals describe behavior, not entries.
________________________________________
How to Interpret Public 15-Minute Posts
• 15m is setup formation
• 15m is environmental awareness
• 15m is not execution
Most errors occur when traders act before structure has finished forming.
This timeframe exists to slow that impulse down.
________________________________________
Messaging Line
“Preparation happens before the move — not during it.”
________________________________________
SEO Intent
15 minute futures setup, market preparation, stop hunt behavior
________________________________________
🤝 For Those Who Find Value
If these posts help you better recognize developing structure:
• Follow, boost, and share my scripts, Ideas, and MINDS posts
• Feel free to message me directly with questions or build requests
• Constructive feedback and collaboration are always welcome
For traders who want to go deeper, optional memberships may include:
• Additional signal access
• Early previews
• Occasional free tools and upgrades
🔗 Membership & Signals
trianchor.gumroad.com
Daily (D) — Swing Bias / “This is the side that has permission”
Goal: Define swing participation: are we in a supported trend or mean-revert risk?
How to use:
• Daily RECLAIM = “permission restored” after a shock move / trend resumption.
• Use it to decide:
Hold adds / reduce hedges / stop fighting direction.
Best use case:
• After earnings/news displacement days
• After large liquidation candles
• After a major gap day
Settings:
• dispMult 1.1–1.5
• reclaimWindow 12–25
• cooldown 6–12
🔵 DAILY — Swing Environment & Risk Framing
1️⃣ Range Indicator (RI)
• Compression → swing expansion likely
• Expansion → continuation or exhaustion
Use:
Tells you whether to expect patience or momentum.
________________________________________
2️⃣ ZoneEngine (Structure)
• Confirms whether daily swings align with higher bias
• Filters false daily breakouts
Use:
Only trust daily moves that occur inside structure.
________________________________________
3️⃣ Cloud / Reclaim (Behavior)
• Trend Clouds → continuation environment
• Pullback Clouds → reload or fade zones
• Reclaim shows acceptance back into value
Use:
Distinguishes real pullbacks from traps.
________________________________________
4️⃣ Stop-Hunt Proxy
• Clears weak swing participants
• Often precedes continuation when aligned
Use:
Stop-hunt + compression + trend cloud = swing continuation context.

SA Range Rank NQ 1.13.2026 PM SESSION15 MINUTE — PREPARE / POSITION MODE
Developer Note: Bias & Position Framing
This daily view is preparatory, not executable.
The purpose of the Daily timeframe is to define directional bias, not entries.
It helps frame which side of the market deserves attention and which activity should be ignored.
The goal here is context, not action.
________________________________________
Purpose on Daily
The Daily timeframe is used to:
• Define directional bias for the week
• Prepare position-building zones
• Identify environments where participation is unnecessary or elevated-risk
• Reduce overtrading by narrowing focus
Daily charts answer one question only:
“If I participate this week, which side makes sense?”
________________________________________
What Matters Most (Public View)
SA Range Indicator (RI):
→ Is the market transitioning or trending?
→ Is energy building, releasing, or rotating?
SA ZoneEngine (visual context only):
→ Are daily moves aligned with higher-timeframe structure?
→ Is price operating with or against dominant bias?
These visuals explain environment, not decisions.
________________________________________
How to Interpret Public Daily Posts
• Daily is not timing
• Daily is not execution
• Daily is not a signal
Daily charts prepare the trader mentally and structurally by clarifying:
• what deserves patience
• what deserves caution
• what deserves no attention at all
________________________________________
Messaging Line
“Daily charts prepare the trade — they don’t execute it.”
________________________________________
SEO Intent
daily equity bias, position preparation, market structure analysis
________________________________________
🤝 For Those Who Find Value
If these daily posts help you see the market more clearly:
• Follow, boost, and share my scripts, Ideas, and MINDS posts
• Feel free to message me directly with questions or build requests
• Constructive feedback and collaboration are always welcome
For traders who want to go deeper, optional memberships may include:
• Additional signal access
• Early previews
• Occasional free tools and upgrades
🔗 Membership & Signals
trianchor.gumroad.com
________________________________________
________________________________________
⏱ 15-MIN — PREPARE / POSITION MODE
Developer Note: Setup Formation Phase
The 15-minute timeframe is where setups begin to form, not where they are acted on.
This view exists to separate developing structure from noise.
________________________________________
Purpose on 15-Minute
The 15-minute timeframe is used to:
• Spot trap-prone conditions
• Identify developing structure
• Observe compression, rotation, or early expansion
• Prepare for execution — without acting
This timeframe answers a different question:
“Is something forming — or is this noise?”
________________________________________
What Matters Most (Public View)
SA Range Indicator (RI):
→ Compression → expansion transitions
→ Energy buildup vs premature release
SA CloudRegimes (visual only):
→ Whether price behavior reflects continuation, pullback, or contraction
→ Whether movement is controlled or impulsive
These visuals describe behavior, not entries.
________________________________________
How to Interpret Public 15-Minute Posts
• 15m is setup formation
• 15m is environmental awareness
• 15m is not execution
Most errors occur when traders act before structure has finished forming.
This timeframe exists to slow that impulse down.
________________________________________
Messaging Line
“Preparation happens before the move — not during it.”
________________________________________
________________________________________
🤝 For Those Who Find Value
If these posts help you better recognize developing structure:
• Follow, boost, and share my scripts, Ideas, and MINDS posts
• Feel free to message me directly with questions or build requests
• Constructive feedback and collaboration are always welcome
For traders who want to go deeper, optional memberships may include:
• Additional signal access
• Early previews
• Occasional free tools and upgrades
🔗 Membership & Signals
trianchor.gumroad.com
15 Minute (15m) — Tactical Entry Alignment / “Permission + Timing”
Goal: Convert higher-timeframe permission into tradable timing.
How to use:
• Trade the first clean reclaim after a pullback.
• Avoid taking a reclaim if price is already extended far beyond the wake edge (late reclaim).
Best conditions:
• Works extremely well when:
o 1H agrees
o session structure is active (open/close windows)
o reclaim occurs near VWAP or a key level you already respect
Settings:
• dispMult 0.75–1.05
• reclaimWindow 6–14
• cooldown 3–6
🟠 15-MINUTE — Intraday Structure & Session Logic
1️⃣ Range Indicator (RI)
• Session compression → impulse likely
• Expansion → follow, don’t fade
Use:
Defines session behavior.
________________________________________
2️⃣ ZoneEngine (Structure)
• Filters session traps
• Explains failed breakouts
Use:
Keeps you aligned with real participation.
________________________________________
3️⃣ Cloud / Reclaim (Behavior)
• Identifies pullback vs continuation
• Reclaim confirms acceptance
Use:
Contextual confirmation.
________________________________________
4️⃣ Stop-Hunt Proxy
• Session liquidity sweeps
• Common near opens and transitions
Use:
Stop-hunt + compression = likely session impulse.

Breaker Blocks Finder | Gold | ProjectSyndicateProjectSyndicate Breaker Blocks Finder
📊 Overview
The ProjectSyndicate Breaker Blocks Finder (PS BB Finder) is a professional-grade Pine Script indicator designed to detect and display Bullish and Bearish Breaker Blocks based on Smart Money Concepts (SMC) methodology. This indicator is specifically optimized for XAUUSD (Gold) trading but works reliably across all symbols and timeframes.
Key Features
✅ Non-Repainting: Breaker blocks never change position after formation
✅ Multi-Timeframe Support: Optimized for M5, M10, M15, M20, M30, and H1
✅ Highly Customizable: 10+ user-configurable settings
✅ Visual Clarity: Color-coded boxes and labels for easy identification
✅ Performance Optimized: Handles 1000+ candles without lag
✅ Cross-Symbol Compatible: Works on Forex, Crypto, Stocks, Indices, and Commodities
✅ Displacement Detection: Uses ATR-based displacement to filter false signals
🎯 What are Breaker Blocks?
A Breaker Block is a failed order block that becomes a new support or resistance zone after being invalidated by price. It represents a market structure shift where institutional traders (smart money) have flipped their position.
Bullish Breaker Block
A Bullish Breaker Block forms when:
1 A bearish order block (resistance zone) exists
2 Price breaks ABOVE this zone with strong displacement
3 The former resistance zone now becomes SUPPORT
4 Price may retest this zone before continuing higher
Visual: Green box with "BB ▲" label
Bearish Breaker Block
A Bearish Breaker Block forms when:
5 A bullish order block (support zone) exists
6 Price breaks BELOW this zone with strong displacement
7 The former support zone now becomes RESISTANCE
8 Price may retest this zone before continuing lower
Visual: Red box with "BB ▼" label
⚙️ Default Settings
Setting Default Range Description
Lookback Period 1000 100-5000 Number of historical candles to analyze
Max Breaker Blocks 5 1-50 Maximum number of breaker blocks to display
Swing Detection Length 10 2-20 Bars on each side to confirm swing high/low. Higher = more significant swings
Use Displacement Filter true true/false Enable to filter breaker blocks by displacement size
Displacement Multiplier 2.0 0.5-5.0 Minimum move size as multiple of ATR. Higher = stricter detection
Invalidation Method Close Close/Wick Close = Conservative (candle must close beyond zone)Wick = Aggressive (wick touch is enough)
📈 Recommended Timeframes & Settings
This indicator is optimized for the following timeframes. Use these settings as a starting point.
Lower Timeframes (M5, M10, M15, M20)
These settings are designed to capture faster price movements and are the default settings for the indicator.
Setting Recommended Value
Lookback Period 1000
Max Breaker Blocks 5
Swing Detection Length 10
Use Displacement Filter true
Displacement Multiplier 2.0
Invalidation Method Close
Higher Timeframes (M30, H1)
For these timeframes, a less strict displacement filter is recommended to capture more significant, but less frequent, breaker blocks.
Setting Recommended Value
Lookback Period 1000
Max Breaker Blocks 5
Swing Detection Length 10
Use Displacement Filter true
Displacement Multiplier 1.0
Invalidation Method Close
🎓 How to Use
Step 1: Identify Breaker Blocks
Once the indicator is loaded, breaker blocks will automatically appear on your chart:
• Green boxes = Bullish breaker blocks (former resistance, now support)
• Red boxes = Bearish breaker blocks (former support, now resistance)
Step 2: Wait for Retest
The most reliable trading opportunities occur when price retests the breaker block zone:
• For bullish breaker blocks, wait for price to come back down to the green zone
• For bearish breaker blocks, wait for price to come back up to the red zone
Step 3: Look for Confluence
Combine breaker blocks with other SMC concepts for higher probability setups:
• Fair Value Gaps (FVG) within the breaker block zone
• Liquidity grabs before the retest
• Break of Structure (BoS) or Change of Character (ChoCH) confirmation
Step 4: Enter the Trade
Bullish Setup:
• Entry: At or near the bullish breaker block zone
• Stop Loss: Below the breaker block
• Take Profit: Previous swing high or higher
Bearish Setup:
• Entry: At or near the bearish breaker block zone
• Stop Loss: Above the breaker block
• Take Profit: Previous swing low or lower
🛡️ Non-Repainting Guarantee
This indicator is 100% non-repainting, meaning:
✅ Breaker blocks never change position after formation
✅ Historical breaker blocks remain in the exact same location indefinitely
✅ Backtesting results are reliable and consistent
🐛 Troubleshooting
Issue: No Breaker Blocks Appearing
Solutions:
• Ensure "Use Displacement Filter" is enabled.
• On M30/H1, try lowering the "Displacement Multiplier" to 1.0.
• Scroll back in history; blocks may not be present on the most recent bars.
Issue: Too Many Breaker Blocks
Solutions:
• Increase "Displacement Multiplier" to 2.5 or 3.0.
• Increase "Swing Detection Length" to 12-15.
• Decrease "Max Breaker Blocks" to 3-4.

Wave Dynamics - Neural Adaptive Engine🌊 WAVE DYNAMICS - NEURAL ADAPTIVE ENGINE
The Official Reference Manual & Trading Protocol
═════════════════════════════════════════════════════════════
📖 PREFACE: THE END OF STATIC ANALYSIS
The financial markets are not linear; they are fractal. They do not move in straight lines; they breathe. They expand in trending volatility and contract in chopping noise.
The fundamental failure of traditional technical analysis is Static Sensitivity .
• A 14-period RSI works beautifully in a range but fails in a trend.
• A 12,26 MACD captures trends but destroys capital in chop.
Wave Dynamics solves this by treating the market as a living organism. At its core is a Neural Adaptive Engine that calculates the Hurst Exponent (Fractal Dimension) in real-time. It measures the "roughness" of price action and automatically adjusts the lookback periods of every subsystem—Waves, Ribbons, and Oscillators—to match the current market regime.
This manual is your guide to navigating this adaptive framework.
PART 1: THEOLOGY & MARKET PHYSICS
To use this tool, you must understand the three pillars of its logic:
1. The Hurst Exponent (Chaos Theory)
The engine continuously calculates H (Hurst) on a rolling window.
• Persistent Regime (H > 0.5): "What is happening now is likely to continue." The market is trending. The Engine Tightens sensitivity to catch fast pullbacks.
• Anti-Persistent Regime (H < 0.5): "What is happening now is likely to reverse." The market is chopping/ranging. The Engine Widens sensitivity to filter out noise and stop runs.
2. The Elliott Wave Cycle (Crowd Psychology)
Price moves in 5-wave motive sequences followed by corrections.
• Waves 1 & 3: Institutional Accumulation/Mark-up.
• Waves 2 & 4: Profit Taking (The Pullback). These are the only safe entry points.
• Wave 5: Retail FOMO (The Trap). Identified by Momentum Divergence .
3. Smart Money Concepts (Liquidity)
Price moves from liquidity to liquidity.
• Order Blocks: Where institutions initiated the move.
• Breakers: Where institutions trapped traders (Support flips to Resistance).
• Fair Value Gaps: Where price moved too fast, leaving inefficiency.
PART 2: VISUAL INTELLIGENCE (COLOR THEORY)
The chart communicates instantly through a strict color-coded language.
🎨 THE RIBBON (Adaptive Equilibrium)
The background "Cloud" is an Adaptive EMA ribbon.
• Neon Green (#00FF88): Bullish Trend. Only look for Longs. Price is above the equilibrium mean.
• Neon Red (#FF3366): Bearish Trend. Only look for Shorts. Price is below the equilibrium mean.
• Grey/Narrow: Compression. The market is deciding. Do not trade inside a grey ribbon.
🎨 INSTITUTIONAL ZONES
• Green/Red Boxes (Order Blocks): Standard Support/Resistance. Valid entry zones, but lower probability.
• Vivid Purple Boxes (#9C27B0) - THE BREAKER: CRITICAL. This appears when a Green Order Block is smashed through by price. It turns Purple to signify it has flipped from Support to Resistance (or vice versa). A retest of a Purple Zone is the highest probability setup in the system.
• Dotted Outlines (FVG): Magnets. Do not place stops inside these; price will likely travel through them.
🎨 WAVE ANATOMY
• Cyan Lines: Valid Impulse Waves (1, 3, 5).
• Orange Lines/Dots: EXHAUSTION. If a wave line turns Orange, Angular Momentum is decaying. The trend is dying.
• Diamonds (◆): DIVERGENCE. Price made a Higher High, but the internal oscillator (MPI) made a Lower Low. Immediate reversal warning.
🎨 SIGNALS
• Triangles: Confirmed Entries. (Green = Long, Red = Short).
• Labels (e.g., A+): The Grade of the trade based on Confluence.
• A+: Perfect Confluence (Trend + Structure + Zone + Momentum).
• C: Counter-trend or Weak.
PART 3: THE DASHBOARD ECOSYSTEM
Three panels provide Total Situational Awareness. You must read them in order: Top Right → Bottom Left → Bottom Right.
1. MISSION CONTROL (Top Right)
This panel tells you the "Weather Report."
• Neural Status:
• 🧠 TREND: Safe to trade breakout and trend-following strategies.
• 🧠 CHOP: Danger. Use mean-reversion or stay out.
• 🧠 RND (Random): No clear edge.
• Phase: Displays the Bias (Bull/Bear) and Strength. "WEAK BEARISH" usually signals a bottom is forming.
• Score Bar: A live visual meter of the Confluence Score (0-100%).
2. THE ASSISTANT (Bottom Left)
This panel acts as your co-pilot, translating data into English.
• Situation:
• "💎 BULL GEM": You are in a range, at the bottom, showing exhaustion. Buy immediately.
• "🔥 COMPRESSION": Volatility squeeze. A violent move is imminent.
• Action: Tells you exactly what to do (e.g., "Wait for confluence," "Trail Stop," "Let it develop").
• Pro Metrics (Simulated):
• Win Rate: The percentage of signals on the current visible chart that hit Target 1.
• Profit Factor: Gross Win / Gross Loss. If this is < 1.0, stop trading this asset immediately.
• Buckets: Shows the win rate of A-Grade signals vs. C-Grade signals.
3. WAVE INTELLIGENCE (Bottom Right)
This panel provides structural context.
• Channel Gauge (0-100%):
• 0-20%: Oversold / Channel Bottom.
• 80-100%: Overbought / Channel Top.
• 50%: Equilibrium.
• W3/W1 Ratio: The "Health Check" of the trend.
• < 1.0: Weak. Wave 3 is shorter than Wave 1. The trend is struggling.
• > 1.618: Extended. The move is parabolic. Expect a snap-back.
• Trend Health (0-100): Composite score of sub-wave physics. If Health < 30, the trend is effectively dead.
PART 4: PARAMETER OPTIMIZATION (THE INPUTS)
Every input allows you to tune the engine. Here is the deep dive:
🧠 NEURAL ADAPTIVE ENGINE
• Enable Neural Adaptive Engine: Master switch for the Hurst calculation.
• Hurst Period (100):
• Adjustment: Increase to 200 for Crypto/Alts (too much noise). Decrease to 50 for
Forex/Indices (need speed).
• How to tell: If the dashboard says "TREND" but the chart is sideways, INCREASE this value.
• Min/Max Lookback: Defines the constraints. Only adjust if you are an advanced user creating a custom scalping setup (e.g., Min 3 / Max 10).
🌊 WAVE & STRUCTURE
• Base Swing Detection (8): The "Anchor."
• Scalpers (1m-5m): Set to 5-8.
• Swing Traders (1H-4H): Set to 15-20.
• Min Wave Size (ATR): Prevents the script from labeling tiny wicks as waves. Increase this during high-volatility news events.
🔗 MTF STRUCTURE MAPPING
• Require Macro Align: Strict Mode. If enabled, the script checks the Higher Timeframe (e.g., 4H). If 4H is Bearish, it BLOCKS all Long signals on the 5m chart. Use this to prevent counter-trend losses.
🏦 SMART MONEY CONCEPTS
• Enable Breakers: ALWAYS ON. This turns failed Order Blocks into Breaker Zones (Purple).
• Institutional Mode: ULTRA STRICT. If enabled, signals will ONLY fire if price is physically touching an Order Block, FVG, or Breaker. This creates very few, very high-quality signals.
🎯 SIGNAL ENGINE
• Signal Mode:
• Strict: Grades A+ and A only.
• Balanced: Grades B and above.
• Aggressive: Includes counter-trend scalps (Grade C).
• Min Confluence Score (5-35): The raw points needed to trigger. 5 is standard. 10 is conservative.
PART 5: TRADE EXECUTION PLAYBOOKS
PLAYBOOK A: THE "BREAKER RETEST" (Highest Probability)
1. Context: Ribbon is Green.
2. Event: Price creates a Red Order Block, then smashes upward through it.
3. Change: The Red Block turns Purple (Bullish Breaker).
4. Trigger: Price pulls back down to touch the top of the Purple Box.
5. Signal: Green Triangle appears.
6. Action: Max Size Entry. Stop Loss below the Purple Box. Target Wave 3 Projection.
PLAYBOOK B: THE "WAVE 4 DIP" (Trend Following)
1. Context: Wave count shows "3". Ribbon is Green.
2. Event: Price pulls back towards the Ribbon.
3. Wave Panel: Wave count flips to "4".
4. Trigger: Price touches Ribbon, prints Green Triangle.
5. Action: Standard Size Entry. Stop Loss at Swing Low. Target New High (Wave 5).
PLAYBOOK C: THE "HIDDEN GEM" (Range Reversal)
1. Context: Ribbon is Grey (Consolidation). Neural Status is CHOP.
2. Wave Panel: Channel Gauge is < 10% (Extreme Bottom).
3. Visuals: Orange Exhaustion Dot + Divergence Diamond (◆).
4. Assistant: Reads "💎 BULL GEM".
5. Action: Half Size Entry. This is a counter-trend trade. Target the middle of the range (50% Channel).
PLAYBOOK D: THE "BULL TRAP" (When to Fold)
1. Context: Wave Count is "5".
2. Wave Panel: Trend Health < 30. W3/W1 Ratio > 1.618 (Extended).
3. Visuals: Orange Line appears on price high.
4. Signal: Green Triangle appears (Grade C).
5. Action: NO TRADE. The system is warning you that even though a signal fired, the structural physics indicate exhaustion.
PART 6: GRADING & SCORING MATRIX
Every signal is graded on a 35-point scale. Know what you are buying.
• Trend Alignment (5 pts): Ribbon & HTF agreement.
• Structure (5 pts): BOS (Break of Structure) & Higher Highs.
• Physics (5 pts): MPI (Volume Flow) & Angular Velocity.
• Institutional Location (10 pts):
• Inside Order Block: +3 pts
• Inside Breaker: +4 pts
• Wave 2/4 Pullback: +3 pts
• Penalty: Wave 5 Extension (-3 pts).
Grade Scale:
• A+ (Score ≥ 70%): "All In" Setup.
• A (Score 55-69%): Strong Setup.
• B (Score 40-54%): Standard Setup.
• C (Score < 40%): Dangerous.
PART 7: RISK DISCLOSURE & LIMITATIONS
1. The Reality of Adaptation (Redrawing):
The Neural Engine is dynamic. As new data arrives, the calculation of "Chaos" changes. This means historical channel lines or wave labels may shift to fit the matured trend. HOWEVER: Entry Signals (Triangles) NEVER repaint once the bar is closed.
2. Simulation vs. Reality:
The Dashboard metrics (Win Rate, Profit Factor) are Simulations run on the historical data visible on your chart. They do not account for spread, slippage, or liquidity. They are a tool to gauge the current market personality, not a promise of future returns.
3. No Financial Advice:
Wave Dynamics is a tool for structural analysis. It helps you see the market, but it cannot trade for you. You are responsible for your own risk management.
CLOSING THOUGHTS
Wave Dynamics is not just an indicator; it is a lens. It allows you to see the market not as a random walk of candles, but as a structured, breathing entity.
Trust the Neural Status. Respect the Breakers. Fear the Exhaustion.
Taking you to school. — Dskyz, Trade with insight. Trade with anticipation.

Signal Architect Stop-Hunt !GC HOUR.1.12.2026 AM Signal Architect™ — Developer Note
These daily posts are intentional.
They are designed to help potential users visually observe consistency—not just in outcomes, but in process—across multiple futures products, market conditions, and timeframes, using the Stop Hunt Indicator alongside my proprietary Signal Architect™ framework.
The goal is simple:
To show how structure, behavior, and probability repeat—every day—despite a constantly changing market.
If you follow these posts over time, you will begin to recognize that:
• The same behaviors appear across different futures contracts
• The same reactions occur on multiple timeframes
• The same structural traps and stop events repeat regardless of volatility regime
That consistency is not coincidence.
Consistency is the signal.
Over time, that consistency should become familiar—
and familiarity should become your edge.
________________________________________
🧠 What You’re Seeing (And Why It Matters)
This indicator includes a limited visual preview of a proprietary power signal I have personally developed and refined across:
• Futures
• Algorithmic trading systems
• Options structure
• Equity market behavior
Every tool I release is built around one core principle:
Clarity of direction without over-promising or over-fitting.
That is why all Signal Architect™ tools emphasize:
• Market structure first
• High-probability directional context
• Clear, visual risk framing
• No predictive claims
• No curve-fit illusions
What you see publicly is not the full system—only controlled, educational previews meant to demonstrate how structure and probability align in real markets.
________________________________________
📊 Background & Scope
Over the years, I have personally developed 800+ programs, including:
• Equity systems
• Futures strategies
• Options structure tools
• Dividend & income frameworks
• Portfolio construction and allocation logic
This includes 40+ Nasdaq-100 trading bots, several operating under extremely strict rule-sets and controlled deployment conditions.
Nothing shared publicly represents my complete internal framework.
Public posts exist for education, observation, and pattern recognition—not signals, not advice, and not promises.
________________________________________
🤝 For Those Who Find Value
If these daily posts help you see the market more clearly:
• Follow, boost, and share my scripts, Ideas, and MINDS posts
• Feel free to message me directly with questions or build requests
• Constructive feedback and collaboration are always welcome
For traders who want to go deeper, optional memberships may include:
• Additional signal access
• Early previews
• Occasional free tools and upgrades
🔗 Membership & Signals:
trianchor.gumroad.com
________________________________________
⚠️ Final Note
Everything published publicly is educational and analytical only.
Markets carry risk.
Discipline, patience, and risk management always come first.
Watch the consistency.
Study the structure.
Let the market repeat itself.
— Signal Architect™
________________________________________
🔗 Personally Developed GPT Tools
• AuctionFlow GPT
chatgpt.com
• Signal Architect™ Gamma Desk – Market Intelligence
chatgpt.com
• Gamma Squeeze Watchtower™
chatgpt.com

Signal Architect Stop-Hunt !GC. 15 MIN. 1.12.2026 . AM SESSIONSignal Architect™ — Developer Note
These daily posts are intentional.
They are designed to help potential users visually observe consistency—not just in outcomes, but in process—across multiple futures products, market conditions, and timeframes, using the Stop Hunt Indicator alongside my proprietary Signal Architect™ framework.
The goal is simple:
To show how structure, behavior, and probability repeat—every day—despite a constantly changing market.
If you follow these posts over time, you will begin to recognize that:
• The same behaviors appear across different futures contracts
• The same reactions occur on multiple timeframes
• The same structural traps and stop events repeat regardless of volatility regime
That consistency is not coincidence.
Consistency is the signal.
Over time, that consistency should become familiar—
and familiarity should become your edge.
________________________________________
🧠 What You’re Seeing (And Why It Matters)
This indicator includes a limited visual preview of a proprietary power signal I have personally developed and refined across:
• Futures
• Algorithmic trading systems
• Options structure
• Equity market behavior
Every tool I release is built around one core principle:
Clarity of direction without over-promising or over-fitting.
That is why all Signal Architect™ tools emphasize:
• Market structure first
• High-probability directional context
• Clear, visual risk framing
• No predictive claims
• No curve-fit illusions
What you see publicly is not the full system—only controlled, educational previews meant to demonstrate how structure and probability align in real markets.
________________________________________
📊 Background & Scope
Over the years, I have personally developed 800+ programs, including:
• Equity systems
• Futures strategies
• Options structure tools
• Dividend & income frameworks
• Portfolio construction and allocation logic
This includes 40+ Nasdaq-100 trading bots, several operating under extremely strict rule-sets and controlled deployment conditions.
Nothing shared publicly represents my complete internal framework.
Public posts exist for education, observation, and pattern recognition—not signals, not advice, and not promises.
________________________________________
🤝 For Those Who Find Value
If these daily posts help you see the market more clearly:
• Follow, boost, and share my scripts, Ideas, and MINDS posts
• Feel free to message me directly with questions or build requests
• Constructive feedback and collaboration are always welcome
For traders who want to go deeper, optional memberships may include:
• Additional signal access
• Early previews
• Occasional free tools and upgrades
🔗 Membership & Signals:
trianchor.gumroad.com
________________________________________
⚠️ Final Note
Everything published publicly is educational and analytical only.
Markets carry risk.
Discipline, patience, and risk management always come first.
Watch the consistency.
Study the structure.
Let the market repeat itself.
— Signal Architect™
________________________________________
🔗 Personally Developed GPT Tools
• AuctionFlow GPT
chatgpt.com
• Signal Architect™ Gamma Desk – Market Intelligence
chatgpt.com
• Gamma Squeeze Watchtower™
chatgpt.com

Signal Architect Stop-Hunt GOLD 5MINSignal Architect™ — Developer Note
These daily posts are intentional.
They are designed to help potential users visually observe consistency—not just in outcomes, but in process—across multiple futures products, market conditions, and timeframes, using the Stop Hunt Indicator alongside my proprietary Signal Architect™ framework.
The goal is simple:
To show how structure, behavior, and probability repeat—every day—despite a constantly changing market.
If you follow these posts over time, you will begin to recognize that:
• The same behaviors appear across different futures contracts
• The same reactions occur on multiple timeframes
• The same structural traps and stop events repeat regardless of volatility regime
That consistency is not coincidence.
Consistency is the signal.
Over time, that consistency should become familiar—
and familiarity should become your edge.
________________________________________
🧠 What You’re Seeing (And Why It Matters)
This indicator includes a limited visual preview of a proprietary power signal I have personally developed and refined across:
• Futures
• Algorithmic trading systems
• Options structure
• Equity market behavior
Every tool I release is built around one core principle:
Clarity of direction without over-promising or over-fitting.
That is why all Signal Architect™ tools emphasize:
• Market structure first
• High-probability directional context
• Clear, visual risk framing
• No predictive claims
• No curve-fit illusions
What you see publicly is not the full system—only controlled, educational previews meant to demonstrate how structure and probability align in real markets.
________________________________________
📊 Background & Scope
Over the years, I have personally developed 800+ programs, including:
• Equity systems
• Futures strategies
• Options structure tools
• Dividend & income frameworks
• Portfolio construction and allocation logic
This includes 40+ Nasdaq-100 trading bots, several operating under extremely strict rule-sets and controlled deployment conditions.
Nothing shared publicly represents my complete internal framework.
Public posts exist for education, observation, and pattern recognition—not signals, not advice, and not promises.
________________________________________
🤝 For Those Who Find Value
If these daily posts help you see the market more clearly:
• Follow, boost, and share my scripts, Ideas, and MINDS posts
• Feel free to message me directly with questions or build requests
• Constructive feedback and collaboration are always welcome
For traders who want to go deeper, optional memberships may include:
• Additional signal access
• Early previews
• Occasional free tools and upgrades
🔗 Membership & Signals:
trianchor.gumroad.com
________________________________________
⚠️ Final Note
Everything published publicly is educational and analytical only.
Markets carry risk.
Discipline, patience, and risk management always come first.
Watch the consistency.
Study the structure.
Let the market repeat itself.
— Signal Architect™
________________________________________
🔗 Personally Developed GPT Tools
• AuctionFlow GPT
chatgpt.com
• Signal Architect™ Gamma Desk – Market Intelligence
chatgpt.com
• Gamma Squeeze Watchtower™
chatgpt.com

Signal Architect Stop-Hunt Signal Architect™ — Developer Note
These daily posts are intentional.
They are designed to help potential users visually observe consistency—not just in outcomes, but in process—across multiple futures products, market conditions, and timeframes, using the Stop Hunt Indicator alongside my proprietary Signal Architect™ framework.
The goal is simple:
To show how structure, behavior, and probability repeat—every day—despite a constantly changing market.
If you follow these posts over time, you will begin to recognize that:
• The same behaviors appear across different futures contracts
• The same reactions occur on multiple timeframes
• The same structural traps and stop events repeat regardless of volatility regime
That consistency is not coincidence.
Consistency is the signal.
Over time, that consistency should become familiar—
and familiarity should become your edge.
________________________________________
🧠 What You’re Seeing (And Why It Matters)
This indicator includes a limited visual preview of a proprietary power signal I have personally developed and refined across:
• Futures
• Algorithmic trading systems
• Options structure
• Equity market behavior
Every tool I release is built around one core principle:
Clarity of direction without over-promising or over-fitting.
That is why all Signal Architect™ tools emphasize:
• Market structure first
• High-probability directional context
• Clear, visual risk framing
• No predictive claims
• No curve-fit illusions
What you see publicly is not the full system—only controlled, educational previews meant to demonstrate how structure and probability align in real markets.
________________________________________
📊 Background & Scope
Over the years, I have personally developed 800+ programs, including:
• Equity systems
• Futures strategies
• Options structure tools
• Dividend & income frameworks
• Portfolio construction and allocation logic
This includes 40+ Nasdaq-100 trading bots, several operating under extremely strict rule-sets and controlled deployment conditions.
Nothing shared publicly represents my complete internal framework.
Public posts exist for education, observation, and pattern recognition—not signals, not advice, and not promises.
________________________________________
🤝 For Those Who Find Value
If these daily posts help you see the market more clearly:
• Follow, boost, and share my scripts, Ideas, and MINDS posts
• Feel free to message me directly with questions or build requests
• Constructive feedback and collaboration are always welcome
For traders who want to go deeper, optional memberships may include:
• Additional signal access
• Early previews
• Occasional free tools and upgrades
🔗 Membership & Signals:
trianchor.gumroad.com
________________________________________
⚠️ Final Note
Everything published publicly is educational and analytical only.
Markets carry risk.
Discipline, patience, and risk management always come first.
Watch the consistency.
Study the structure.
Let the market repeat itself.
— Signal Architect™
________________________________________
🔗 Personally Developed GPT Tools
• AuctionFlow GPT
chatgpt.com
• Signal Architect™ Gamma Desk – Market Intelligence
chatgpt.com
• Gamma Squeeze Watchtower™
chatgpt.com

Elliott Wave: Pro ForecastElliott Wave: Pro Forecast (Dual-Path Prediction)
The "Fork in the Road" for Price Action. Most indicators show you where price has been. This indicator predicts where price could go using standard Elliott Wave Fibonacci ratios and volatility analysis.
Unlike standard forecasters that force a single path, Pro Forecast acknowledges that the market is probabilistic. It visualizes the two most likely outcomes simultaneously:
Continuation: The current trend extends deeper (or higher).
Reversal: The trend exhausts and begins a new 5-wave motive structure.
How It Works
The script identifies the most recent "Live Pivot" (the unconfirmed high or low currently forming) and calculates volatility based on the previous swing. It then projects future price action using two distinct models:
The Extension Model: Projects a generic 0.5 volatility continuation.
The Wave Model: Projects a standard Elliott Wave 5-step sequence (or ABC correction) using classic Fibonacci ratios (0.382 retracements, 1.618 extensions).
Key Features
Dual-Path Visualization: See the Bearish breakdown and Bullish bounce scenarios at the same time.
"Dip Buy" Mode (Linked Scenarios): A unique feature that links the two paths. Instead of reversing now, it simulates a reversal starting after the extension. This is perfect for planning entries at lower support levels.
Smart Target Grid: Draws horizontal dotted lines at key price targets, making it easier to line up predictions with existing Support/Resistance zones.
Invalidation Level: Automatically marks the "Hard Stop" level (Start of Wave 1). If price crosses this red line, the bullish/bearish thesis is invalid.
Zero-Floor Logic: Smart math ensures projections never predict negative stock prices, even on high-volatility/low-cap assets.
Settings Guide
Sensitivity: Controls how fast pivots are detected.
Daily Chart: Recommend 3-4 for a 1-week outlook.
4H Chart: Recommend 8-12.
Show Continuation: Toggles the "Extension" line (Orange).
Show Reversal: Toggles the "Next Wave" sequence (Blue).
Start Reversal after Extension?:
Unchecked: Reversal starts from the current price (Current Bounce).
Checked: Reversal starts from the end of the Extension line (Future Bounce).
Risk Disclaimer
This tool is for educational purposes and visualization only. It projects geometric probabilities based on past volatility, not certainty. Always use proper risk management.

Alpha Hunter System [MTF + Risk Manager] by Amit NamdeoThis is a comprehensive, "Institutional-Grade" Trend Following System. It is designed not just to give signals, but to filter out bad trades, manage risk automatically, and help you exit at the right time.
Here is a breakdown of exactly how your script works:
1. The Core Engine (High/Low Channel)
The Foundation: Instead of a single line, the script creates a Channel using two Exponential Moving Averages (EMAs).
Green Line: 50 EMA calculated on the Highs of the candles.
Red Line: 50 EMA calculated on the Lows of the candles.
The Logic: This creates a "No-Trade Zone" in the middle.
BUY Signal: Generated when price forcefully breaks above the Green High band.
SELL Signal: Generated when price forcefully breaks below the Red Low band.
2. The "Smart Filters" (Safety Mechanisms)
To prevent false signals (whipsaws), the script checks three separate conditions before showing a Buy or Sell label:
A. Sensitivity Filter (ATR): The price must not just touch the line; it must break it by a specific margin (based on Volatility/ATR). This filters out small wicks.
B. Volume Filter: A breakout is ignored if the Volume is low. The script requires the breakout candle's volume to be higher than the recent average. This ensures "Smart Money" supports the move.
C. Sideways Filter (ADX): Uses the Average Directional Index (ADX). If the trend is weak (ADX < 20), the channel turns Gray and blocks all signals. This saves you from trading in choppy, flat markets.
D. Multi-Timeframe (MTF) Consensus: This is the "60% Rule." The script secretly checks the trend on the 5m, 15m, 1H, 4H, and Daily charts. It only allows a signal if the majority of these timeframes agree with the direction.
3. Automatic Risk Management
This feature automates the math that professional traders usually do in Excel:
Dynamic Stop Loss (SL):
On a Buy, the SL is set to the Red (Low) Band.
On a Sell, the SL is set to the Green (High) Band.
Why? This adapts the SL to the current market volatility.
Take Profit Targets (TP):
It calculates your Risk (Entry - SL).
TP1: 1.5x Risk.
TP2: 2.5x Risk.
TP3: 4.0x Risk.
Visuals: It draws these lines on the chart immediately when a signal appears, so you know exactly where to place your orders.
4. Trailing Stop (The Purple Line)
What it is: A dynamic Purple Line that appears behind the candles.
How it works: It acts like a "Chandelier Exit."
As price moves in your favor, the line moves up to lock in profit.
It never moves backward.
Exit Rule: If a candle closes across this purple line, the trend is likely over, and you should exit.
Live Label: A label follows the line showing the exact price (e.g., "Trail SL: 1950.2") so you can update your order easily.
5. Alerts & Dashboard
Dashboard (Top Right): A live status panel showing:
Current Trend (Bullish/Bearish/Sideways).
MTF Consensus (Are the other timeframes agreeing?).
Volume Status (Pass/Fail).
Alerts: You can set phone/desktop notifications for:
Entries: Buy/Sell.
Targets: TP1, TP2, TP3 Hit.
Safety: Trailing Stop Hit (Exit trade).
Summary of Visual Colors
🟢 Green Channel: Bullish Trend (Look for Buys).
🔴 Red Channel: Bearish Trend (Look for Sells).
⚪ Gray Channel: Sideways Market (Do Not Trade).
🟣 Purple Line: Your Trailing Stop Loss.

Kalman Absorption/Distribution Tracker 3-State EKFQuant-Grade Institutional Flow: 3-State EKF Absorption Tracker
SUMMARY
An advanced, open-source implementation of a 3-State Extended Kalman Filter (EKF) designed to track institutional Order Flow. By analyzing 1-second intrabar microstructure data, this script estimates the true Position, Velocity, and Volatility of the Cumulative Volume Delta (CVD), revealing hidden Absorption and Distribution events in real-time.
INTRODUCTION: THE SIGNAL AMIDST THE NOISE
In the world of technical analysis, noise is the enemy. Traditional indicators rely on Moving Averages (SMA, EMA) to smooth out price and volume data. The problem is the "Lag vs. Noise" paradox: to get a smooth signal, you must accept lag; to get a fast signal, you must accept noise.
This indicator solves that paradox by introducing aerospace-grade mathematics to the TradingView community: The 3-State Extended Kalman Filter (EKF).
Unlike moving averages that blindly average past data, a Kalman Filter is a probabilistic state-space model. It constantly predicts where the order flow "should" be, compares it to the actual measurement, and updates its internal model based on the calculated uncertainty of the market.
This script is not just another volume oscillator. It is a full microstructure analysis engine that digests intrabar data (down to 1-second resolution) to track the true intent of "Smart Money" while filtering out the noise of retail chop.
THE INNOVATION: WHY 3 STATES?
Most Kalman Filters found in public libraries are "1-State" (tracking price only) or occasionally "2-State" (tracking price and velocity). This script introduces a highly advanced 3-State EKF.
The filter tracks three distinct variables simultaneously in a feedback loop:
State 1: Position (The True CVD)
This is the noise-filtered estimate of the Cumulative Volume Delta. It represents the actual inventory accumulation of aggressive buyers versus sellers, stripped of random noise.
State 2: Velocity (The Momentum)
This tracks the rate of change of the order flow. Is buying accelerating? Is selling pressure fading even as price drops? This provides a leading signal before the cumulative value even turns.
State 3: Volatility (The Adaptive Regime)
This is the game-changer. The filter estimates the current volatility of the order flow (Log-Volatility). In high-volatility environments (like news events), the filter automatically widens its uncertainty bands (Covariance) and reacts faster. In low-volatility environments (chop), it tightens up and ignores minor fluctuations.
THE LOGIC: DETECTING ABSORPTION AND DISTRIBUTION
The core philosophy of this indicator is based on Wyckoff Logic: Effort vs. Result.
-- Effort: Represented by the CVD (Buying/Selling pressure).
-- Result: Represented by Price Movement.
When these two diverge, we have an actionable signal. The script uses the EKF Velocity state to detect these moments:
Absorption (Bullish)
This occurs when the EKF detects high negative Velocity (aggressive selling), but Price refuses to drop. The "Smart Money" is absorbing the sell orders via limit buys. The indicator highlights this as a Blue Event in the dashboard.
Distribution (Bearish)
This occurs when the EKF detects high positive Velocity (aggressive buying), but Price refuses to rise. Limit sellers are capping the market. The indicator highlights this as an Orange Event.
TECHNICAL DEEP DIVE: UNDER THE HOOD
For the developers and quants, here is how the Pine Script is architected using the "type" and "method" features of Pine Script v5.
1. Data Ingestion (Microstructure)
The script uses "request.security_lower_tf" to pull intrabar data regardless of your chart timeframe. This allows the script to see "inside" the bar. A 5-minute candle might look green, but the microstructure might reveal that 80% of the volume was selling absorption at the wick. This script sees that.
2. Tick Classification
Standard CVD assumes that if Price Close is greater than Price Open, all volume is buying. This is often flawed. This script offers three modes of tick handling, including a "High-Low Distribution" method that statistically apportions volume based on where the tick closed relative to its high and low.
3. The EKF Mathematics
The script implements the standard Extended Kalman Filter equations manually. It calculates the Jacobian matrix to handle the non-linear relationship between volatility and price. The "Process Noise Matrix" (Q) is dynamically scaled by the Volatility State. This means the mathematics of the indicator literally "breathe" with the market conditions—expanding during expansion and contracting during consolidation.
THE DASHBOARD & VISUALS:
The indicator features a professional-grade HUD (Heads Up Display) located on the chart table.
-- EKF State Vector: Displays the real-time Position, Velocity, and Volatility values derived from the matrix.
-- Ease of Movement (Wyckoff): Calculates how much price moves per 1,000 contracts of CVD. For example, if Price moves +5 points per 1k Buy CVD, but only -2 points per 1k Sell CVD, the "Path of Least Resistance" is clearly UP.
-- Session State: Tracks cumulative confirmed Bullish vs. Bearish events for Today, Yesterday, and the Day Before (3-Day Profile).
-- Bias Summary: An algorithmic conclusion telling you if the day is "Confirmed Bullish," "Accumulating," or "Neutral."
HOW TO TRADE THIS INDICATOR
Strategy A: The Reversal (Absorption Play)
Look for price making a Lower Low.
Look for the EKF Velocity (Histogram) to be Deep Red (High Selling Pressure).
Watch the Dashboard "Absorption" count increase.
SIGNAL: When EKF Velocity crosses back toward zero and turns grey/green, the absorption is complete. This indicates sellers are exhausted and limit buyers have control.
Strategy B: The Trend Continuation (Ease of Movement)
Check the Dashboard "Ease of Movement" section.
If "Price per +1K CVD" is significantly higher than "Price per -1K CVD", buyers are efficient.
Wait for a pullback where EKF Velocity hits the "Neutral Zone" (Gray).
SIGNAL: Enter Long when Velocity ticks positive again, aligning with the dominant Ease of Movement stats.
CONFIGURATION GUIDE:
Because this is a quant-grade tool, the settings allow for fine-tuning the physics of the filter.
-- Velocity Decay: Controls how fast momentum resets to zero. Set high (0.98) for trending markets, or lower (0.85) for mean-reverting chop.
-- Volatility Persistence: Controls how "sticky" volatility regimes are.
-- Process Noise: Increase this if the filter feels too laggy; decrease it if the filter feels too jittery (noisy).
-- Measurement Noise: Increase this to trust the Mathematical Model more than the Price Data (smoother output).
WHY OPEN SOURCE?
Complex statistical filtering is often sold behind closed doors in expensive "Black Box" algorithms. By releasing this 3-State EKF open source, the goal is to raise the standard of development on TradingView.
I encourage the community to inspect the code, specifically the "ekf_update_3state" function, to understand how matrix operations can be simulated in Pine Script to create adaptive, self-correcting indicators. And also update me for improvements.
DISCLAIMER:
This tool analyzes microstructure volume data. It requires a subscription plan that supports Intrabar inspection (Premium/Pro recommended for best results). Past performance of the Kalman Filter logic does not guarantee future results. Volume analysis is subjective and should be used as part of a comprehensive strategy.
SUGGESTED SETTINGS
-- Timeframe: Works best on 1m, 3m, or 5m charts (Intrabar data is fetched from 1S).
-- Asset Class: Highly effective on Futures (ES, NQ, BTC) and high-volume Forex/Crypto pairs where volume data is reliable.
-- Background: Dark mode recommended for Dashboard visibility.
WHAT IS A KALMAN FILTER?
Imagine driving a car into a tunnel where your GPS signal is lost.
Prediction: Your car knows its last speed (Velocity) and position. It predicts where you are every second inside the tunnel.
Update: When you exit the tunnel, the GPS connects again. The system compares where it thought you were versus where the satellite says you are.
Correction: It corrects your position and updates its estimate of your speed.
Now apply this to trading:
-- The Tunnel: Market Noise, wicks, and Fake-outs.
-- The Car: The True Market Trend.
-- This Indicator: The navigation system that tells you where the market actually is, ignoring the noise of the tunnel.
Enjoy the indicator and trade safe!
Dr. Jay Desai
(Investment Management & Derivatives Area, Gujarat University)

SMC + Dual UT Bot buy and sell AlertsThis script is a composite indicator for TradingView (Pine Script v5) that merges Smart Money Concepts (SMC) with a Dual-instance UT Bot. It has been styled with a high-contrast "Neon Cyberpunk" theme (Cyan/Pink) and is fully compliant with the CC BY-NC-SA 4.0 license.
Here is a breakdown of its two main components:
1. Smart Money Concepts (SMC)
This portion, originally by LuxAlgo, is designed to identify institutional price levels and structural market shifts. It provides a detailed map of market structure rather than simple entry/exit signals.
Market Structure (BOS & CHoCH):
BOS (Break of Structure): Marks trend continuation (e.g., breaking a higher high in an uptrend).
CHoCH (Change of Character): Marks potential trend reversals (e.g., the first time a higher low is broken in an uptrend).
Order Blocks (OB):
Highlights specific candles where institutional buying or selling likely occurred. These act as high-probability support/resistance zones.
Neon Blue/Cyan for Bullish OBs.
Neon Pink for Bearish OBs.
Fair Value Gaps (FVG):
Identifies imbalances (gaps) in price action where the market often returns to "fill" orders.
Neon Mint for Bullish FVGs.
Neon Red for Bearish FVGs.
Premium/Discount Zones: Automatically plots the range equilibrium (50% level) to help you buy in "Discount" (low) and sell in "Premium" (high) areas.
Liquidity (EQH/EQL): Automatically detects "Equal Highs" and "Equal Lows," which are magnets for price as they represent liquidity pools (stop losses).
2. Dual UT Bot Alerts
This portion provides the actual Entry Signals. It runs two separate instances of the "UT Bot" strategy simultaneously with different sensitivity settings to filter noise.
Instance 1 (Buy Only):
Settings: Key Value = 4, ATR Period = 10 (Faster, more sensitive).
Visual: Plots a Neon Cyan "Buy" label.
Function: Looks for bullish reversals earlier to catch the start of a move.
Instance 2 (Sell Only):
Settings: Key Value = 7, ATR Period = 20 (Slower, smoother).
Visual: Plots a Neon Pink "Sell" label.
Function: Uses a wider ATR band to avoid getting shaken out of shorts too early, focusing on major downtrends.
How to Use It
The strength of this script is confluence.
Wait for a Signal: Look for a UT Bot "Buy" or "Sell" tag.
Confirm with SMC: Check if the signal aligns with SMC concepts.
Example Buy: Did the UT Bot give a "Buy" signal while price was bouncing off a Bullish Order Block?
Example Buy: Did price just sweep Liquidity (EQL) before the Buy signal?
Example Sell: Is the "Sell" signal happening inside a Premium Zone or a Bearish Fair Value Gap?

Ultimate Futures Daytrade Suite v1 - The Strategy GuideHere is the complete **Strategy Guide** translated into English.
---
# 📘 Ultimate Futures Daytrade Suite – The Strategy Guide
### 1. The Visual Legend (What is what?)
Before you trade, you need to understand the hierarchy of your lines. Not every line has the same importance.
* **🟣 Daily EMA 50 (Neon Violet):** The **"Big Boss"**. It determines the **Macro Trend**.
* *Price above:* We are primarily looking for Longs.
* *Price below:* We are primarily looking for Shorts.
* **🟢 4h EMA 50 (Neon Green):** The **"Swing Trend"**. Your most important level for **Pullback Entries** (Re-entries).
* **🟡 POC (Gold) & TPO:** The **"Magnet"**. Price often returns here.
* *Rule:* Never open a trade directly *on* the POC (Risk of "Chop"). Use it as a **Target** (Take Profit).
* **🟠 IB High/Low (Orange Lines):** The **"Daily Structure"**.
* A breakout from the IB (Initial Balance) often indicates the trend direction for the day.
* **🟥/🟩 Boxes (Supply/Demand):** Resistance and Support zones from the 1h timeframe.
* **⬜ FVG Boxes:** "Gaps" in the market that are often filled.
---
### 2. The Trading Workflow (Top-Down Method)
Go through this mental checklist before every trade:
#### Step 1: Trend Check (The Traffic Light)
Look at the **Violet Line (Daily)** and the **Green Line (4h)**.
* **Bullish:** Price is above Violet AND above Green. -> *Focus: Buy dips.*
* **Bearish:** Price is below Violet AND below Green. -> *Focus: Sell rallies.*
* **Mixed:** Price is between Violet and Green. -> *Caution! Market is undecided (Range Trading).*
#### Step 2: Location (The Context)
Where is the price currently located?
* Are we at a **Green Demand Zone**?
* Are we testing the **4h EMA 50 (Green)** from above?
* Are we at the **VWAP**?
* *Never trade in "No Man's Land"!* Wait until the price touches one of your lines.
#### Step 3: Trigger (The Execution)
Now zoom into your lower timeframe (e.g., 5min or 15min).
* Wait for a reaction at the zone.
* Use the **EMA 9 (Yellow)** as a momentum trigger. If price breaks the EMA 9 and closes above/below it, that is your "Go".
---
### 3. The Setup Blueprints
Here are the two most profitable scenarios you can trade with this script:
#### A) The "Golden Trend" Setup (Long)
* **Context:** Price > **Daily EMA (Violet)**.
* **Preparation:** Price corrects (drops) back to the **4h EMA 50 (Green)** or to the **VWAP**.
* **Confluence:** Ideally, there is also a **Demand Zone (Green Box)** or an **FVG** at that level.
* **Entry:** As soon as a candle touches the zone and closes bullish again (or reclaims the EMA 9).
* **Stop-Loss:** Below the 4h EMA 50.
* **Take-Profit:** Next **Supply Zone (Red)** or the **IB High (Orange)**.
#### B) The "Daytrade Breakout" (Intraday)
* **Context:** Price opens inside yesterday's Value Area.
* **Signal:** Price breaks through the **IB High (Orange)** with momentum.
* **Filter:** Price must be above the **VWAP**.
* **Entry:** On the retest of the IB High or directly on the breakout.
* **Target:** Price often trends in that direction for the rest of the day.
---
### 4. Warning Signals (When NOT to trade)
1. **The "Concrete Ceiling":** If you want to go Long, but the **Violet Daily EMA 50** is running directly above you. This is massive resistance. Better wait until it is broken.
2. **The "POC Dance":** If price is dancing sideways around the **Gold Line (POC)**. This is a "No-Trade Zone". Day traders lose the most money here due to fees and whipsaws.
3. **Overextension:** If price is extremely far away from the **4h EMA 50 (Green)** (Rubber Band Effect). Do not enter in the trend direction here; wait for a pullback to the line.
### Summary
Your chart is now telling you a story:
* **Violet** tells you the Direction.
* **Green** gives you the Entry.
* **Red/Green Boxes** show you the Obstacles.
* **Yellow (EMA 9)** gives you the Timing.
Good luck with the Suite! This is a setup similar to what institutional traders use.

ULTIMATE SMC FUSION 💎 ULTIMATE SMC FUSION
━━━━━━━━━━━━━━━━━━━━━━━━━━━━━━━━━━━━━━━━━━━━━━━━━━━━━━━━━━━━━━━━━
A premier Smart Money Concepts (SMC) indicator that masterfully combines multi-dimensional structure analysis with precision momentum filtering. This edition is optimized for manual SMC traders looking for clarity and performance.
🚀 KEY FEATURES:
• FULL SMC SUITE: Automated Break of Structure (BOS) and Change of Character (CHoCH) detection.
• HTF ADAPTIVITY: Fine-tuned logic specifically for $30m$, $1h$, and $4h$ charts to catch the major institutional moves.
• PRECISION REVERSAL ENGINE: Advanced detection for Pinbar and Engulfing patterns at key liquidity zones.
• SMART SCORING SYSTEM: Integrated analysis of ADX (Trend Strength), RSI (Momentum), and Volume.
• ZERO-API ARCHITECTURE: Streamlined for maximum efficiency on your local TradingView terminal.
• 2026 V2026 VISUALS: Modern, premium interface with glassmorphic stats and high-contrast signals.
BEST FOR: SMC Traders, Prop Firm Challenges, and High-Precision Analysis.
Feel free to adjust the settings to your own needs.
Do not put your full confidence into a script, make your own decisions allways.
Trade at your own risk.

EDUVEST QQE Grade System - S/A/B/C Signal ClassificationEDUVEST QQE Grade System - S/A/B/C Signal Classification
━━━━━━━━━━━━━━━━━━━━━━━━━━━━━━━━━━━━━━━━━━━━━━━━
█ ORIGINALITY
This indicator introduces a unique grading system (S/A/B/C) for QQE signals, combining traditional QQE analysis with SMC (Smart Money Concepts) price zones and trading session filters. Unlike standard QQE indicators that show all signals equally, this version classifies signals by quality to help traders focus on the highest probability setups.
━━━━━━━━━━━━━━━━━━━━━━━━━━━━━━━━━━━━━━━━━━━━━━━━
█ WHAT IT DOES
- Generates BUY/SELL signals with S/A/B/C grade classification
- Automatically detects asset type and applies optimized QQE factors
- Integrates SMC price zones (support/resistance) for grade enhancement
- Filters signals by trading session time
- Displays real-time session and market status
Grade Hierarchy:
- S (Gold/Orange): Signal near SMC zone + active trading hours - Highest quality
- A (Green/Red): Score 70+ during trading hours - High quality
- B (Darker): Score 50-69 during trading hours - Medium quality
- C (Gray, small): Outside trading hours or weak signal - Low quality
━━━━━━━━━━━━━━━━━━━━━━━━━━━━━━━━━━━━━━━━━━━━━━━━
█ HOW IT WORKS
【QQE Core Calculation】
The QQE (Quantitative Qualitative Estimation) is calculated as:
1. RSI with configurable period (default: 14)
2. EMA smoothing of RSI (Smoothing Factor: 5)
3. Dynamic bands using Wilder's smoothing: RSI ± (ATR of RSI × QQE Factor)
QQE Factor is auto-adjusted per asset:
- USD/JPY: 4.238
- EUR/USD: 3.8
- Gold (XAU/USD): 8.0
- NASDAQ/US100: 9.0
【Signal Generation】
- BUY: QQE line crosses above its trailing stop (QQExlong == 1)
- SELL: QQE line crosses below its trailing stop (QQExshort == 1)
【Internal Scoring System】
Score components (0-100):
- Signal Base: +25 points when signal occurs
- QQE Strength: +10 to +20 based on RSI distance from 50
- Volatility: +15 (optimal ATR ratio 1.1-2.0), -10 (low volatility)
- Volume Confirmation: +10 (high volume), -5 (low volume)
- Session Bonus: +5 during London/NY sessions
- Base: +20 points
【Grade Assignment】
- Grade S: Signal near user-defined SMC price zone (within tolerance %) AND during trading hours
- Grade A: Internal score >= 70 AND during trading hours
- Grade B: Internal score >= 50 AND during trading hours
- Grade C: Outside trading hours OR score < 50
【SMC Price Zone Integration】
Users can set support/resistance levels for each asset. When price is within the tolerance percentage of these levels, signals are upgraded to S-grade, indicating confluence with institutional price levels.
【Trading Session Filter】
Configurable active trading hours (JST timezone):
- Default: 15:00 - 01:00 JST (London + NY overlap)
- Signals outside this window receive C-grade
━━━━━━━━━━━━━━━━━━━━━━━━━━━━━━━━━━━━━━━━━━━━━━━━
█ HOW TO USE
【Recommended Settings】
- Timeframe: 15M, 1H, 4H
- Best on: USD/JPY, EUR/USD, Gold, NASDAQ
- Focus on: S and A grade signals
【Trading Strategy】
- S-Grade (Gold/Orange): Highest conviction - consider larger position
- A-Grade (Green/Red): Strong signal - standard position
- B-Grade: Valid but use additional confirmation
- C-Grade: Avoid or use minimal size
【Setting Up SMC Zones】
1. Identify key support/resistance on higher timeframe
2. Input prices in SMC Price Settings
3. Adjust tolerance % (default: 0.15%)
4. S-grade appears when signal occurs near these levels
【Info Panel】
Top-right panel shows:
- Asset name and detection mode (Auto/Manual)
- Current session (Tokyo/London/NY)
- Trading hours status
- SMC zone proximity
【Alert Setup】
1. Enable alerts in settings
2. Create alert with "Any alert() function call"
3. Alerts include grade, price, and session info
━━━━━━━━━━━━━━━━━━━━━━━━━━━━━━━━━━━━━━━━━━━━━━━━
█ SETTINGS
Basic Settings:
- Enable Alerts: Turn on/off notifications
- Time Filter: Activate trading hour filter
- Start/End Hour: Define active trading window (JST)
QQE Settings:
- RSI Period: RSI calculation period
- RSI Smoothing: EMA smoothing factor
- Auto QQE Factor: Auto-detect optimal factor per asset
- Manual QQE Factor: Override when auto is disabled
SMC Price Settings:
- Support/Resistance levels for each asset
- Tolerance %: How close to SMC line for S-grade
Display Settings:
- Grade Only: Hide QQE lines, show only signals
- Show SMC Lines: Display support/resistance on chart
- Show Debug: Display asset detection info
━━━━━━━━━━━━━━━━━━━━━━━━━━━━━━━━━━━━━━━━━━━━━━━━
█ CREDITS
QQE concept originally developed by John Ehlers.
SMC (Smart Money Concepts) integration and grading system by EduVest.
License: Mozilla Public License 2.0
