MACD + RSI with Trade SignalsThis indicator by default comes with the MACD shown but can be switched to show the RSI instead. Settings for each indicator can also be customized as well as Buy/Sell signals given based on pull back crossovers that follow the 200 EMA of the price Chart. There's an above/below middle fill option you can use but I tend not to but I know some traders like to see when an oscillator is above/below the middle and use it as a trend diretion. By the way, the fourth setting for the MACD (which is 2 by default) is the size of the histogram.
Buy Signal = Price is above the 200 EMA. Current or previous MACD or RSI line is/was below middle line and now crossed above the signal line.
Sell Signal = Price is below the 200 EMA. Current or previous MACD or RSI line is/was above middle line and now crossed below the signal line.
There are alerts for each signal as well (MACD and RSI, both buy and sell).
Feel free to leave a comment regarding issues or suggestions for this indicator or ideas for the next one I should do :)
Wyszukaj w skryptach "signal"

Money Maykah -- DC-ATR , Stochastic RSI signals v.1-89 --This indicator shows the Stochastic RSI (SSRI) for overbought when the Donchian Channel (DC) is in the upper zone (between basis and upper), and SSRI for oversold when the DC is in the lower zone.
The DC upper and lower have a percentage of the ATR added I call this DC-ATR.
There can be numerous ways to form a strategy based on this. For a bull trend, an ABCD could be traced by A/C = blue signals and B/D = red signals.
Let me know what you think or if there is something wrong with the code. It's probably not the cleanest or more efficient but I am not a pro. If you find a good way to make a strategy from the indicator let me know.
Hope you enjoy!
-Casey R

BB+RSI+EMA BUY/SELL SignalsBINANCE:BTCUSDT
* * * TESTED ON BTCUSDT 4H CHART * * *
The indicator gives signals based on candles touching BB lines and RSI oversold/overbought conditions, also a 200 EMA filter is used to trade following the major trend.
Only LONG signals are given.
Signals are divided in 3 categories based on their strenght:
- Weak BUY/SELL (green/red circles on chart)
- normal BUY/SELL (green/red triangles with "BUY" or "SELL" text on chart)
- strong BUY/SELL (green/red labels with "STRONG BUY" or "STRONG SELL" text on chart)
You can use signals from the same category as triggers for entering or exiting a trade or you can try using signals from different categories
All indicators settings can be costumized
Every signal label can be turned ON/OFF
EMA that changes color based on last candle close can be turned ON/OFF
Alerts can be set for:
- General Signals (every signal will trigger it)
- Weak Signals (only weak signals will trigger it)
- Normal Signals (only normal signals will trigger it)
- Strong Signals (only strong signals will trigger it)

Stochastic Weighted RSI w/ Divergence + Signals🐢 Tawtis' Stochastic Weighted Relative Strength Index , aka SWRSI
This indicator combines the Stochastic RSI and the classic RSI we all know and love to create a more effective indication of seller/buyer dominance, and in turn, trend. I have named it the "Stochastic Weighted RSI". The script also includes a standard RSI, so you can use both at the same time!
Loads of customisation, pretty much every input can be changed to fit your preferences, however, the default settings are what I would personally recommend for the best results. Either way, feel free to change them!
By looking at the indicator, you can also establish the trend that may follow in the candles to come.
Typically, an indicator reading of over 70 is considered overbought, and an indicator reading of under 30 is considered oversold.
The calculations for the SWRSI and its signals take into account a multitude of exponential moving averages, a Stochastic RSI and a classic RSI, among other things.
There are 2 types of signals provided by the indicator, being strong and weak. You do not have to follow these, and they aren't always accurate (it's impossible to be accurate 100% of the time), however, they can give a good idea of the trend that will ensue.
Strong buy signals are created when:
SWRSI is under 30
SWRSI is over the EMA (default 2) of the SWRSI
Short EMA (default 20) is under the long EMA (default 50)
Strong sell signals are created when:
SWRSI is over 70
SWRSI is under the EMA (default 2) of the SWRSI
Short EMA (default 20) is over the long EMA (default 50)
Weak buy and sell signals are printed as green and red background highlights, and operate the same as the strong buy and sells, without the short/long EMA criterion. Both of these signal types can be toggled off using the settings if you do not want to see them.
Enjoy!

Price Volume Trend + Signal and HistogramThis is a script based on PVT + Signal Line, which can be EMA or SMA. It then plots a histogram which is equal to PVT - Signal. This makes it easier to spot divergences.
To better match up the scales, we decided to add a multiplication factor to the histogram. Each asset and even timeframe requires a different multiplication factor, so please experiment to find what suits you.
Credits and special thanks are listed on the source code.

Ichimoku all signalsIchimoku Cloud All Signals!
This indicator shows all Ichimoku Cloud signals for (entering/exiting/confirming/or even staying) in a position.
you can choose a signal related to your strategy and use it.
you can choose which signals to be shown on the chart by changing the settings.
here are some examples of signals that you can get from this indicator:
Crossover/under conversion line & base line
Crossover/under lead line1 & lead line2
Crossover/under conversion line & lead line1
Crossover/under base line & lead line1
Crossover/under conversion line & lead line2
Crossover/under base line & lead line2
Crossover/under close & base line
Cloud Breakouts in both directions!
and 74 signals more !!!!

Ichimoku Kinko Hyo SignalsIchimoku Kinko Hyo Signals
This script show signals based on my understanding in Ichimoku Kinko Hyo.
/!\ Please do not follow signals blindly and always make your own analysis /!\
Buy : Han Ne lines are up, price is up, and also stochastic (K=30, D=10) is up
Strong Buy : Is a Sanyaku Kouten and can show a potential reverse in current tendance and Buy Signal conditions
Sell : Han Ne lines are down, price is down, and also stochastic (K=30, D=10) is down
Strong Sell : Is a Sanyaku Gyakuten and can show a potential reverse in current tendance and Sell Signal conditions
Exit : Show a potential time to take profit based on previous Sell, Strong Sell, Buy, or Strong Buy signal

[NLX-L2] Hurst Exponent Signal Filter- Hurst Exponent Signal Filter -
The Hurst Exponent Signal Filter is meant to be used with an external signal source, this can be any indicator with a signal plot output (-1 Sell / 1 Buy)
It filters out a lot of noisy signals and improves the performance of many indicators.
- Example: How to Use -
1. Add a trend Indicator like Trend Index MTF to your chart
2. Add an indicator with a signal plot like Fishers Stochastic Center of Gravity to your Chart and select the Trend Index MTF with Type L1 in the Settings as Signal Source
3. Add this Hurst Signal Filter to your Chart and select the Fishers Stochastic Center of Gravity with Type L2 in the Settings as Signal Source
4. Add the Backtest Module to your Chart and select the Hurst Signal Filter with Type L2 as Source
- Alerts for Automated Trading -
See my signature below. Contact me for the Alert module.

Keltner Channel with signals [ChuckBanger]This is Keltner Channel where I added Bull and Bear signals. It has a lot of settings to play around with. Have fun...
For more information on Keltner Channel: www.investopedia.com

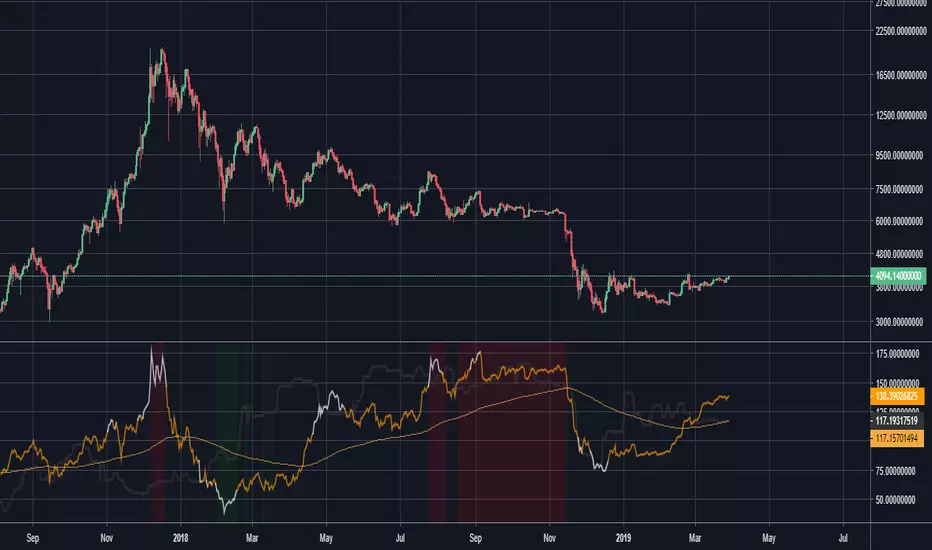
NVT Signal with RMA and thresholds [alertable]NVT Signal, or NVTS, is an indicator that compares the market cap of Bitcoin to the aggregate USD value of daily transactions on the Bitcoin blockchain. It is a value indicator that shows a multiple of Bitcoin price against the actual usage of its blockchain. When the NVTS is low, it suggests Bitcoin price is low relative to the amount of utility the network provides, and vice versa.
For more information on NVTS, visit medium.com
This indicator aims to provide the following:
1. An open-source implementation of NVTS on Tradingview, as the most popular one currently is closed-source.
2. To provide two simple ways to define and visualize "overbought" or "oversold" conditions using the NVTS. Here, we have absolute value of NVTS & deviation from a long-term moving average.
3. Crude integration into Tradingview's alert system.
What this indicator CANNOT do:
1. Timeframes below 1d.
2. Signals based on statistical analyses, such as seen in Bollinger Bands et al. (However, with the appropriate type of account, you can add BBands on top of this indicator.)
I would like to express my gratitude to Willy Woo, Chris Burniske and Dimitry Kalichkin for their work on NVT Ratio and NVT Signal, without which my indicator would not have been created.
Feel free to fork & improve, or experiment with settings. I hope this indicator will be useful to someone.
ProfitTrailer Example TradingView Signals [v2019-01-31]ProfitTrailer Example TradingView Signal
This script provides an example of a TradingView Signal for use with ProfitTrailer's
new SIGNALS functionality and it's new TradingView integration capability.
This signals script implements a simple Moving Average Cross strategy
that works on any chart timeframe.
It allows you to pick the Price source i.e. Open, Close (default), etc.
You are able to choose between EMA (default) or SMA moving average
calculations.
You can define the fast and slow period lengths for use within the
moving average calculations.
If you get some value out of this indicator please consider making
a small donation to my favourite charity the Save the Childrens Fund.
Every donation will make a difference to the lives of children.
All donations over $2 are tax deductable. You can donate here:
savethechildrenfundraising.org.au
Copyright (c) 2019, Grant Cause aka CryptoCoyns

LongSetups with Entry Signals and Trailing Stop(HA)High probable Long Setups for any time frame and asset.
75+ win rate
Trailing stop always used as exit point
To trade only with the trand - enable MAs in the Inputs tab
x - means Entry signal is active and waiting for long validation
B - on a closed bar is entry signal for long
C - on a developing bar is exit long signal
Green line - long validation line. must close above to go long
Pink line - trailing stop
On Long Entry alert - use Once Per Bar Close option.
On Long Exit alert (Trailing stop triggered) - use Once Per Bar option to trigger sooner and protect your capital.
Always do your own analysis and make trades on your own risk. Find a confluence point where everything aligns and make your own decision. Don't enter a trade because the indicator tells you so. You are free to make a copy of the script and change it to your own needs for your own personal use.
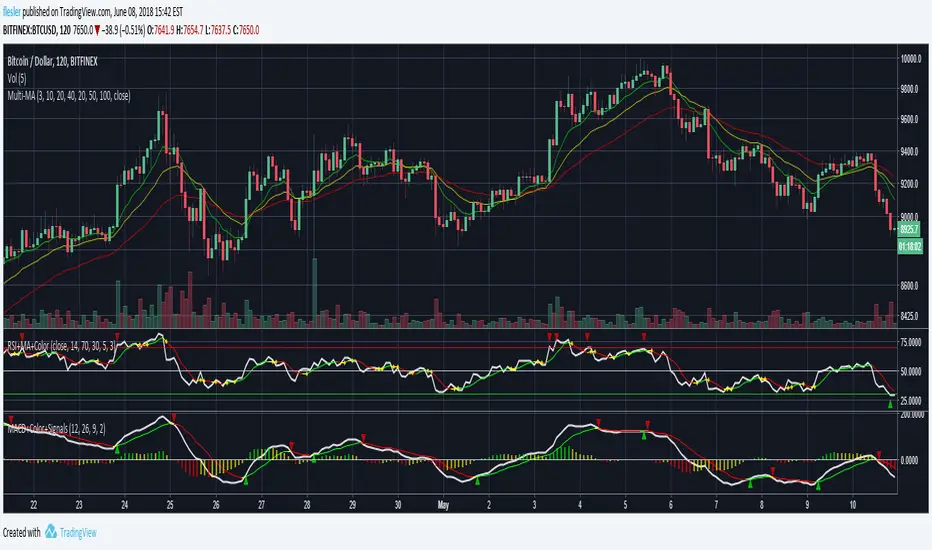
MACD + Colors + Signals
Standard MACD with signal and histogram
MACD and signal crossovers are marked with up/down triangles
Signal is colored based on its direction, can be turned to a single color
Histograms can be green, red and yellow based on their side and direction
Histograms can be switch to be green when positive and red when negative
SW Magic Signals EMA [Sergio Waldoke]// SW Magic Signals EMA , shorttitle="MagicSignalsEMA"
// Script created by Sergio Waldoke (BETA VERSION v0.99)
// Buy Long when you see a Green buy arrow
// Sell Short when you see a Red sell arrow
// Basis Signal is the difference between EMA's. When the difference change from increase to decrease or inversely, signals are triggered
// Step signal shows if difference increases or decreases

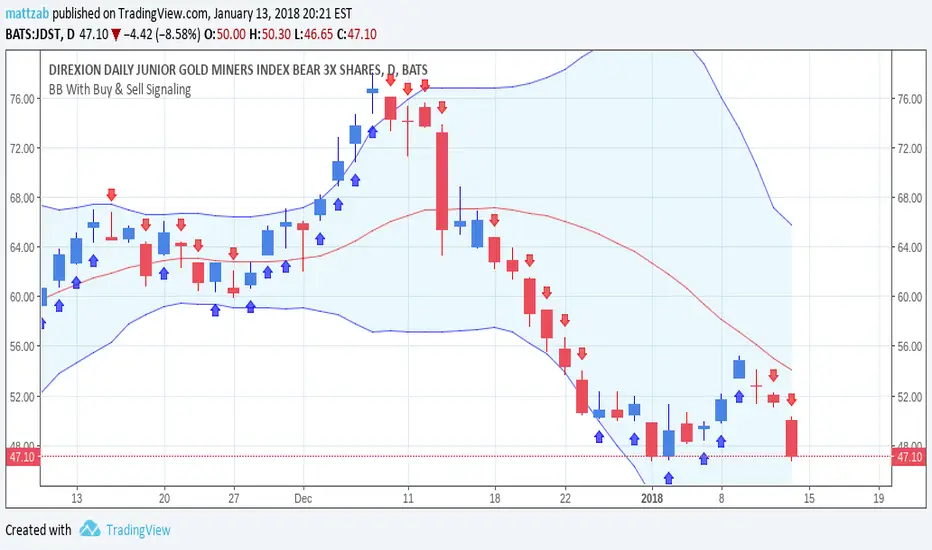
BB With Buy & Sell Signaling by mattzabThis is an unmodified Bollinger Band, with the addition of buy/sell arrows.
No arrow = hold the position (whether in or out)
Blue up = buy
Red down = sell
Arrows are produced by MACD histogram moving in the same direction as price.
MACD settings are:
Fast EMA = 10
Slow EMA = 20
Signal Smoothing SMA = 5
Rally Base Drop Signals [LuxAlgo]The Rally Base Drop indicator is built around the Supply and Demand (SND) concept known as "Rally, Base & Drop" Candles. These candle types are commonly used in this trading approach to identify price structure.
This indicator highlights bars by labeling them as "Rally," "Drop," or "Base" candles. It also identifies specific sequence patterns formed by these candles.
🔶 USAGE
The Rally, Base, Drop candlestick approach is a straightforward method for identifying price action structure.
Candles are categorized into three types, which are then analyzed to understand market structure and Supply/Demand levels.
Rally: Two or more consecutive bullish candles.
Drop: Two or more consecutive bearish candles.
Base: A single bullish or bearish candle that breaks the previous trend.
🔹 Rally & Drop Candles
These candles show clear directional momentum and signal whether demand or supply is dominating. They are helpful when identifying trends, as they highlight strong price movement.
🔹 Base Candles
In most SND strategies, "Base" can have several interpretations.
Typically, base candles represent short periods of consolidation that test the trend before continuation. They can also be found at turning points (tops or bottoms).
For this indicator, a base candle is simply one that does not follow the direction of nearby candles or is where a Drop and Rally meet. Multiple base candles often reflect indecision in the market, suggesting a temporary balance between buyers and sellers.
🔹 Reversal Sequences
Rally-Base-Drop (RBD)
Drop-Base-Rally (DBR)
In Supply and Demand analysis, these sequences are considered reversals. They mark zones where buyer and seller activity has shifted, which can lead to future price reactions. These areas are known as "Supply or Demand Zones" and are often revisited by price, making them useful for trade setups.
🔹 Continuation Sequences
Rally-Base-Rally (RBR)
Drop-Base-Drop (DBD)
Continuation sequences show a brief pause in the trend, followed by further movement in the same direction. In SND terms, they represent zones where orders accumulate before a continuation move. These are typically used to join ongoing trends, as they indicate sustained interest from buyers or sellers.
🔶 DETAILS
🔹 Color Modes
The script includes three color modes. "No Color" is self-explanatory, while the other two options relate to how candles are detected.
A Rally or Drop requires at least two candles to be successfully identified. As a result, detection occurs on the second candle. However, the full Rally or Drop includes both candles.
Two coloring methods are available:
Full Color: Once a Rally or Drop is detected (on the second bar), both candles are colored, starting from the first. This reflects the full pattern.
Color on Detection: Only the second candle (where detection occurs) is colored. This avoids changing past bars and may be useful for live analysis.
🔶 SETTINGS
Sequences: Select which sequences to display on the chart.
Bar Color Logic: Choose the preferred bar coloring method.

ACD Indicator [TradingFinder] M Fisher Pivots Methodology Signal🔵 Introduction
The book "The Logical Trader" begins with a comprehensive review of the ACD Methodology principles, which include identifying specific price points related to the opening range.
This method allows you to set reference points for trading and use points "A" and "C" for trade entry. You will also learn about the "Pivot Range" and how to combine them with the ACD method to maximize position size and minimize risk.
In this indicator, the strategy is implemented to make it easier to use.
🔵 How to Use
The "ACD" strategy can be applied to various markets such as stocks, commodities, or forex, providing buy and sell signals that allow you to set your price targets and stop losses.
This strategy is based on the assumption that the opening range of trades is statistically significant each day, meaning the initial market fluctuations influence the market until the end of the day.
The ACD trading strategy is known as a breakout strategy and performs best in volatile or strongly trending markets, such as crude oil and stocks.
Some of the rules for using the ACD strategy include the following :
Consider points A and C as reference points and continuously pay attention to these points during trades. These points serve as entry and exit points for trades.
Examine daily and multi-day pivot ranges to analyze market trends. If the price is above the pivots, the trend is upward, and if below the pivots, the trend is downward.
Trading with the ACD strategy in forex is possible using the ACD indicator. This indicator is a technical tool used to measure the balance between supply and demand in the market. By analyzing trading volume and price, this indicator helps traders identify trend strength and suitable entry and exit points.
To use the ACD indicator, consider the following :
Identifying strong trends: The ACD indicator can help you identify strong and stable trends in the market.
Determining entry and exit points: ACD provides buy and sell signals to enter or exit trades at the best possible time.
Bullish Setup :
When the "A up" line is broken, it is advisable to wait for some time to ensure that this is not a "Fake Breakout" and that the price stabilizes above this line.
After entering the trade, the best stop loss you can choose is below the "A down" line. However, it is recommended to test this in backtests to achieve the best results. The suitable reward-to-risk ratio for this strategy is 1, which should also be backtested.
Bearish Setup :
When the "A down" line is broken, it is advisable to wait for some time to ensure that this is not a "Fake Breakout" and that the price stabilizes below this line.
After entering the trade, the best stop loss you can choose is above the "A up" line. However, it is recommended to test this in backtests to achieve the best results. The suitable reward-to-risk ratio for this strategy is 1, which should also be backtested.
🔵 Setting
NDay Pivot Range Period : Using this entry you can specify the number of days to calculate NDay Pivot Range.
Show Daily Pivot Range : Set the Daily Pivot color and displayed or not.
Show NDay Pivot Range : Set the NDay Pivot color and displayed or not.
ATR Period Levels : Determining the period of the ATR indicator, which is used to determine the A and C levels.
Show Tokyo ACD Setup : Set the Tokyo ACD Setup color and displayed or not.
Tokyo Opening Range Time : The amount of time taken to determine the opening range. You can set this number between 5 and 60 minutes.
Tokyo Session : Market start and end time.
A Level Multiplier : The coefficient that is multiplied by ATR to determine the distance of line A up and A down.
C Level Multiplier : The coefficient that is multiplied by ATR to determine the distance of line C up and C down.
The same settings exist for the London and New York sessions.

Range Based Signals and AlertsThis script produces a compiled version of rule based signals that is meant to be used mainly on 5 Min timeframe based on daily(as default) Highs and Lows on average and the main purpose is to give user settings to change and adapt based on their needs and make it as adjustable as possible. This entry strategy idea does not belong to me but for TV's in-house rule reasons i can't disclose whose idea it is but i think people that will use this indicator will know who the original idea belongs to.
Rules used for signal production:
- Daily(As default) High-Low points
- Moving Average for detecting reversing of price
- MTF MACD (Daily as default) for detecting overall trend
Signals produced based on extensions of price out of daily zones and when they drop or rise back into moving average. A conditional checker is used for reducing repeated unnecessary signals and alerts.
Happy trading.

Random Signal Generator
Random Signals Indicator generates random long and short signals on the chart. Please note that these signals are purely random and should not be used for actual trading decisions. The indicator allows you to set the minimum number of bars between signals and adjust the sensitivity of the random generation. Use this indicator for educational or testing purposes only, and always rely on proper trading strategies and analysis for real trading.
---
Индикатор случайных сигналов генерирует случайные сигналы на покупку и продажу на графике. Обратите внимание, что эти сигналы полностью случайные и не должны использоваться для принятия реальных торговых решений. Индикатор позволяет установить минимальное количество баров между сигналами и настроить чувствительность генерации случайных значений. Используйте этот индикатор только для образовательных или тестовых целей, а при реальной торговле полагайтесь на надлежащие торговые стратегии и анализ.
Parabolic SAR + EMA 200 + MACD SignalsParabolic SAR + EMA 200 + MACD Signals Indicator, a powerful tool designed to help traders identify optimal entry points in the market.
This indicator combines three popular technical indicators: Parabolic SAR (Stop and Reverse), EMA200 (Exponential Moving Average 200) and MACD (Moving Average Convergence Divergence) - to provide clear and concise buy and sell signals based on market trends.
The MACD component of this indicator calculates the difference between two exponentially smoothed moving averages, providing insight into the trend strength of the market. The Parabolic SAR component helps identify potential price reversals, while the EMA200 acts as a key level of support and resistance, providing additional confirmation of the overall trend direction.
Whether you're a seasoned trader or just starting out, the MACD-Parabolic SAR-EMA200 Indicator is a must-have tool for anyone looking to improve their trading strategy and maximize profits in today's dynamic markets.
Buy conditions
The price should be above the EMA 200
Parabolic SAR should show an upward trend
MACD Delta should be positive
ُSell conditions
The price should be below the EMA 200
Parabolic SAR should show an downward trend
MACD Delta should be negative

HeikinAshi / MS-Signal (HA-MS)Hello?
Traders, welcome.
If you "Follow", you can always get new information quickly.
Please also click "Boost".
Have a good day.
-------------------------------------
I would like to take the time to explain the indicators needed for trading among the two indicator formulas previously disclosed.
The HA-MS indicator is an indicator created using the Heikin Ashi formula and the MACD formula.
Therefore, the reliability of the indicator is considered to be high.
If you want a comprehensive indicator, you can share the chart being published as an idea and use the MRHAB-T indicator.
The shared indicators can be used without any restrictions if you are a paid member of TradingView.
(Free members have many restrictions on sharing charts.)
The MS-Signal indicator using MACD is an indicator composed of M-Signal and S-Signal lines.
I made it possible to display the M-Signal line of the 1D, 1W, and 1M charts separately so that the trend can be checked on other timeframe charts.
Therefore, by looking at the 15m chart or 1h chart to check the overall trend when trading, we prevented getting caught up in temporary volatility, that is, a whipsaw, and made this M-Signal line to be used as support and resistance.
If you touch these M-Signal lines when a surge or plunge occurs, it means that there is a high possibility of indicating support or resistance.
If the 5EMA line on the 1D chart rises above the 5EMA line enough to be called a soaring moving average, it means that there is a high possibility of a sudden movement.
Therefore, the 5EMA line of the 1D chart is displayed separately so that it can be checked in time frames other than 1D (15m, 1h charts, etc.).
This 5EMA line can also be used as support and resistance like the M-Signal line of the 1D, 1W, and 1M charts described above.
The MS-Signal indicator is for viewing trends.
So, if the price stays above the MS-Signal indicator and the MS-Signal indicator turns into a bullish sign, it means that the uptrend is likely to continue.
Conversely, if the price stays below the MS-Signal indicator and the MS-Signal indicator turns to a bearish sign, then the downtrend is likely to continue.
Therefore, even if it temporarily rises above the MS-Signal indicator, it cannot be said that it will show an uptrend unless it is converted to an uptrend.
So, when the price surges and rises above the MS-Signal indicator, it is important to hold the price until the MS-Signal indicator turns into an uptrend.
If the HA-Low line or HA-High line is passing through these movements, you should respond by looking at whether you are supported or resisted on these lines.
The HA-Low line and the HA-High line are lines created for trading using Heikin Ashi candles.
Therefore, it can be interpreted that if it is supported by the HA-Low or HA-High line, it is highly likely to show an uptrend.
However, since the HA-Low and HA-High lines are calculated together with the RSI indicator, they are displayed on the chart as interactions.
The HA-Low line is a line created near the low point,
The HA-High line is a line created near the high point.
Therefore, if it shows support at the HA-Low line, it is time to buy.
And, if the price rises and rises above the HA-High line, it is likely to show a sharp movement.
Because of this movement, the HA-Low line is called the buy line, and the HA-High line is called the soaring line.
Since the HA-High line is a soaring line, if it is resisted by the HA-High line, it also means that there is a high possibility of a sharp decline.
If you see support at the HA-High line, you can buy it, but as I said, it is a sharp rise line, so you have to respond from a short-term perspective.
The Heikin Ashi body indicator is significant as it marks the first trend reversal.
So, you can see the first reversal move, either when the price first makes a move from a downtrend to an uptrend, or when the price first makes a move from an uptrend to a downtrend.
For example, if the price is in a downtrend and stops falling and moves sideways or rises slightly, the Heikin Ashi body indicator is likely to turn into an uptrend.
If this turns into a bullish sign, aggressive buying is possible.
However, since there is a high possibility that it will not rise higher and fall immediately, it is better to think of a trading strategy when it shows support by rising above the 5EMA line, HA-Low line, and MS-Signal indicator.
Let's assume that from an uptrend in price, the Heikin Ashi body indicator turns to a downtrend.
Then, if you touch the 5EMA line, the HA-High line, and the MS_Signal indicator, I think you can buy some time to think about a selling strategy.
-------------------------------------------------- -
It doesn't matter how you trade and what tools you use.
What matters is whether you can create a trading strategy.
We tend to spend more time on analysis like chart analysis, economic analysis.
Also, many analytical techniques are studied to do this kind of analysis.
I have spent a lot of time studying various analysis techniques and putting a lot of effort into using them in trading.
However, I realized that acquiring all of these things did not make me a good trader.
The indicators released today also do not mean much in reality.
It merely provides minimal information for creating a trading strategy.
I think it is better to put aside the idea of investing a lot of time in chart analysis and economic analysis and proceeding with trading.
Instead, I recommend spending a lot of time thinking about how to buy at the point or section you are trading, how to sell if the price rises, and how to stop loss if the price falls.
Quickly learn that learning difficult analytical techniques doesn't make you profitable on your trades.
I hope you understand.
An analytical technique or tool that allows you to earn a steady income is the best technique.
Creating a trading strategy is not difficult.
It's just that it feels difficult because I haven't organized my thoughts until now.
trading strategy
1. Investment period
2. Investment scale
3. Trading method and profit realization method
You just need to think in order and then start trading.
The most important thing in this trading strategy is the investment period.
The most important thing is whether to trade the coin (token) you want to trade by investing for a period such as the same day, short term, mid term, or long term.
This is because even though this first button is not connected properly, the following fund management and trading methods are all wrong.
I hope the day will come soon when you can play with the movement of the chart and get away from wrestling with the chart.
thank you.
---------------------------------

BBSS - Bollinger Bands Scalping SignalsModified Bollinger Bands Indicator
Added:
- color change divergence (green) and narrowing (red) of the upper and lower bands
- color change of the moving average - upward trend (green) and downward trend (red)
- the appearance of a potential signal for long and short positions when the candle closes behind the upper or lower bands.
How to use the indicator:
Long conditions:
- the price breaks through the upper band
- Bollinger bands are expanding and should be green
- the mid-line is green
- the trigger candle should be green
Short conditions:
- the price breaks through the lower band
- Bollinger bands are expanding and should be red
- the mid-line is red
- the trigger candle should be red

Ichimoku Buy/Sell Signals of manual MTF Tenkan crossing KijunIchimoku Buy/Sell Signals based on fast, small time frame Tenkans crossing longer timeframes Kijuns - Manual MTF Analysis
This code marks the potential change of direction based on the input of one timeframe's Ichimoku Tenkan (conversion) line crossing over a higher, longer timeframe's Ichimoku Kijun (base) line.
Feel free to change the inputs if need be and to hide the yellow box. Use Ichimoku rules of Tenkan, Kijun, Lagging Span, and Cloud for Take profit/Stop Losses. It is best to wait 3-5 minutes after the signal to enter to confirm the trend and to confirm if the Lagging Span has broken key levels. I refer to the book Trading with Ichimoku - A Practical Guide to Low-Risk Ichimoku Strategies by Karen Peloille as the Ichimoku rulebook. Good luck.
For day trading/scalping/intraday - 1min/3min/5min
Tenkan Line Timeframe = 1min
Kijun Line Timeframe = 5min
For swing trading - multiple days/weeks - 4HR/Daily/Weekly Charts
Tenkan Line Timeframe = day
Kijun Line Timeframe = week
