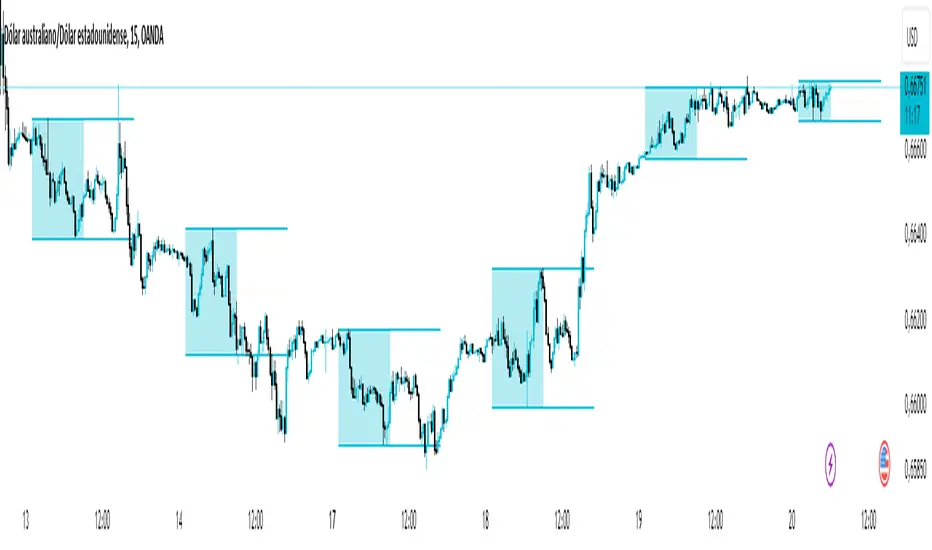
Tips,Notes,RulesEasy Annotation:
Quickly create custom annotations during your trading sessions to capture important ideas, strategies and observations as you go.
User-friendly Interface:
The indicator offers an intuitive interface, ensuring a smooth experience for adding notes to your chart.
Custom Appearance:
Personalize your annotations according to your preferences.
Adjust the text size to make your notes easily readable and tailored to your visual preferences.
Choose from a variety of colors to make your annotations visually distinct and recognizable.
Align your text according to your preferences to create a visually appealing graphic.
Flexible Positioning:
Place your annotations at the top, middle, or bottom of the chart, providing flexibility without obstructing your view of the price action.
Clear View of Price Action:
Make sure your personalized notes don't interfere with your analysis of market movements.
Tracking Trading Rules:
Use the indicator to record your trading rules, ensuring that you follow your established strategies consistently.
Implement and follow your risk management plans, helping you maintain control over your transactions.
Capture and examine the psychological cues that influence your decisions, promoting greater discipline in your approach to trading.
Improved Trading Experience:
The Trading Notes indicator integrates seamlessly into your trading workflow, allowing you to focus on market analysis and decision-making.
Develop a complete record of your trading sessions, facilitating post-analysis and continuous improvement.
Wyszukaj w skryptach "sessions"
The only Indicator you need
Maybe even a bit more than you need.
Gives you the option to color the bars based on Trading Sessions (Asia, London and US).
Session timings are based on UTC-4, but can be changed individually as needed.
Helps keeping a clear view of what happened during the Sessions without having to stack multiple Session Indicators, or having the background of your chart looking like a rainbow.
Keeping it plain and simple.
Also has the Option for plotting previous Weeks High and Low on Chart.
Found this to be helpful in determining Price behaviour in these Areas.
Also has an option to color the chart background for different time periods.
Helps marking News Releases on the Chart and avoid entering a Trade before major releases.
Has 2 presets for 30min / 2h into US Session and 2 Custom Timeperiods. All can of course be changed as you see fit.
Colors and plotting can obviously be changed as usual.
I am thankful for further Input and Ideas!
Range Projections [TFO]The purpose of this indicator is to see how often price reached certain standard deviations from a selected time range. The inspiration for this was to study ICT (Inner Circle Trader) concepts regarding the Central Bank Dealer’s Range (CBDR), which is 2:00 pm - 8:00 pm New York local time according to ICT Core Content. However, the idea and data collection could certainly be applied to any range of time.
The main settings of this indicator are session time, range type, and the standard deviation filter. The session time is the window of price that will be utilized for range projections. The range type can be either body or wick (on the current timeframe). The standard deviation filter is used to eliminate sessions whose ranges (from high to low) are greater than the desired/input number of standard deviations from all available session ranges.
In this example, the time range is set to 16:00 - 20:00, or the time between the New York session close and the Asia session open. Our standard deviations are set to 1, 2, 2.5, and 4. Now, by taking this session’s price range and extrapolating these extensions from the initial range, we can use these levels to see if and how price interacts with them before the next 16:00 - 20:00 session.
Furthermore, we can enable the Data Table to analyze how often price trades to these levels for the sessions that are deemed valid (determined by the standard deviation filter). This time our standard deviations are set to 1, 2, 3, and 4.
This concept can theoretically be applied to any window of time. ICT has mentioned that, in instances where the CBDR is too large, the Asia range may be used instead. We can observe that the indicator behaves the same way when we change the session to the Asia range, 20:00 - 00:00.
90 Minute Cycles + MTFCredit goes to LuxAlgo for the inspiration from 'Sessions' which allowed users to analyse specific price movements within a user defined period with tools such as trendline, mean and vwap.
Settings
Sessions
Enable Session: Allows to enable or disable all associated elements with a specific user set session.
Session Time: Opening and closing times of the user set session in the hh:mm format.
Range: Highlights the associated session range on the chart.
Ranges Settings
Range Area colour: Set each range to a specific colour.
Range Label: Shows the session label at the mid-point of the session interval.
Usage
By breaking 24hrs in quarters, starting with an Asian range of 18:00 NY time you can visualise the principles of Accumulation, Manipulation, Distribution and Rebalance. Know as AMD or PO3 (Power of Three), the principle is that the Manipulation phase will break above or below the Accumulation, before moving in an apposing direction and then rebalancing. This only works when there is a higher timeframe PD array or liquidity to support an apposing move.
Further to the daily quarters, each one can then be broken down again into 90min cycles. Again, each represents AMD, allowing the user an opportunity to watch for reversals during the 90min manipulation phase.
Note: Ensure the Asian Cycle always begins at 18:00 NY time.
The example shows that the 90min cycle occurs, followed by an apposing move away in price action
Here is the Daily cycle, highlighting the Manipulation phase.
Enjoy!
NSDT Custom High and Low LinesFirst, the credit for the original script to plot a High and Low between a certain time goes to developer paaax.
I took that idea, converted it to Pinescript V5, cleaned up the code, and added a few more lines so you can plot different levels based on time of day.
Published open source like the original.
The example shown has:
Blue - plotting from the start of the Futures Asian session to the start of the Futures USA Session. (6:00PM - 9:30AM Eastern)
Yellow - plotting from the start of the Futures Europe session to the start of the Futures USA Session. (3:00AM - 9:30AM Eastern)
Green - plotting from the start of the Futures US Premarket session to the start of the Futures USA Session. (8:00AM - 9:30AM Eastern)
These are great levels to use for breakouts and/or support and resistance.
Combine these levels with the 5 min Open Range levels, as you have some good trades.
Each of the three sessions have individual start and end times that can be modified by the trader, so you can easily mark off important areas for your style of trading.
Initial Balance |ASE|Introduction
Initial Balance (IB) refers to the price data that is formed during the first hour of a trading session. It is an important concept in trading as it provides insights into the market's opening sentiment and potential trading opportunities or reversals for the day. There are multiple trading sessions throughout the day. The most popular, the NY Session, is open from 9:30 am to 4:00pm EST making the Initial Balance(IB) range the first hour (9:30-10:30) The other sessions include London, Tokyo, and Sydney.
IB Customization
The Initial Balance lines are fully customizable to fit the traders need.
Show Initial Balance
This setting will plot the Initial Balance
Fill/Extend IB Range
The Fill IB Range toggle fills the area in between the IB High and IB Low. Use the IB Fill Color option to change the fill color in the “Line Settings” group on the settings panel.
The Extend IB Range extends the IB lines until the market closes.
Show 1x/2x Extensions
The Show 1x Extension toggle displays 1 times the IB range line (IB High - IB Low) above IB High and 1 times the IB range line below IB Low.
The Show 2x Extension toggle displays the 2 times the IB range line (IB High - IB Low) above IB High and 2 times the IB range line below IB Low.
*Use the Extension Level Color in the “Line Settings” to change the color of the lines.
Show Middle Levels
The Show Middle Levels toggle shows all the 50% lines between the upper 2x and upper 1x line, upper 1x and IB high, IB high and IB low, IB low and lower 1x line, and the lower 1x and lower 2x line.
*Use the Mid Level Color in the “Line Settings” to change the color of the lines.
Delete Previous Day’s Levels
This setting will only show the current day's Initial Balance and delete all previous day levels to produce a clean chart.
How To Use:
The Initial Balance Range can support a bias as it shows the opening market sentiment. By watching price action interact with the Initial Balance Range we can watch for indications of trending or failing moves at the high or the low and overall a ranging or trending session.
The extension levels are projections as to where price could potentially reach in a trending market. If we are bullish and trending higher, we would want to see price reach the first extension, signs of strength at these levels can be used as confirmation to target other levels.
Overall, all these levels can and should be used as support and resistance levels, and as always, can not be used by themselves and require additional confirmation, whether that be an indicator or price action. Below you can see chart examples of these levels in action.
Statistics: High & Low timings of custom session; 1yr historyGet statistics of the Session High and Session Low timings for any custom session; based on around 1yr of data.
//Purpose:
-To get data on the 'time of day' tendencies of an asset.
-Narrow in on a custom defined session and get statistics on that session.
//Notes:
-Input times are always in New York time (but changing the timezone after setting WILL adust both table stats and background highlight correctly.
-For particularly long sessions, make sure text size is set to 'tiny' (very long vertical table), or adjust table to display horizontally.
-You'll notice most assets show higher readings around NY equities open (9:30am NY time). Other assets will have 'hot-spots' at other times too.
-Timings represent the beginning of a 15m candle. i.e. reading for 15:45 represents a high occurring between 15:45 and 1600.
-Premium users should get 20k bars => around 1year's worth of data on a 15minute chart. Days of history is displayed in the top left corner of the table.
//Limitations
-only designed and working on 15minute timeframe (to gather a full year of meaningful/comparable % stats, need 15minute 'buckets' of time.
-sessions cannot cross through midnight, or start at midnight (00:15 is ok). 00:15 >> 23:45 is the max session length. On BTC, same applies but 01:00 instead of midnight (all in NY time).
-if your session crosses through 'dead time' (e.g. 17:00-18:00 S&P NY time); table will correctly omit these non-existent candles, but it will add on the missing hour before the start time.
//Cautionary note:
-Since markets are not uncommonly in a trending state when your defined session starts or ends, the high/low timings % readings for start and end of session may be misleadingly high. Try to look for unusually high readings that are not at the start/end of your session.
Wheat (ZW1!) 15min chart; Table displayed vertically:
Nasdaq (NQ1!) 15m chart; Table displayed horizontally and with smaller text to view a very long custom session:
SMC sessionzz by JelleThe main function of this indicator is to make it easy to identify several smart money concepts (SMC) and ICT practices by using a single indicator. The functions themselves are not my original content, but rather a collection of several scripts with some tweaking, combined into a single indicator.
Main functions:
- Provides the ability to set bar color for London, New York and Asia sessions
- Provides the ability to set background color for London, New York and Asia sessions
- Provides the ability to indicate NY and GMT midnight on the chart by plotting vertical lines
- Provides several smart features to turn bar color and background color on/off depending on the timeframe
Usage example:
- Easily determine each session high and low by using the bar color feature
- Easily determine the daily high and low by using the vertical midnight lines
- Easily determine ICT kill zones by setting background color for each session
- Easily avoid clutter on your chart by using the timeframe filters
Three Bar Gap (Simple Price Action - with 1 line plot)This script is tailored towards experienced traders who prefer to view raw price charts during live execution. It searches for a three-bar pattern of what is colloquially called "fair value gap", or "imbalance" and uses a single line to plot the results. The goal is to display price in a way that is as simple as possible so that chart readers who don't prefer to add indicators on their screen will still find this indicator as an acceptable option to consider for.
From a code perspective, this script explores a new PineScript feature called UDT (user-defined types). This is an incredible update because it brings developers one step close to having the ability to create abstract data types.
█ What is price action?
Experienced traders will tell you that the chart that they use for live execution is raw, clean, and uses no indicators. They say they execute on price action, so what exactly is price action?
There is no formal definition to it, but one can agree that it implies the process of analyzing price without considering the fundamentals, without needing to know what the news was about, and without needing to know any of the Greeks (except for the desire to “seek alpha” Ha.haa...). This is not to say that price action traders are executing in their own vacuums without the need to know what is happening around the world. Surely fundamentals and financial models can be used beforehand for developing a bias for what is being traded, but it’s price-first at the moment of execution. That said, Factor (A) is Price.
Factor (B) is time-perception, it’s how the trader reads the tape. How the trader perceives price to change with respect to time is valuable information. Interpretation of "time" will be elaborated in the next section that talks about candlestick patterns detected by this script.
Putting this together, price action means the analysis of price movement by only considering (A) price, and (B) time, to predict which direction the market will move. A speculative trader is timing the market with the expectation to make a quick in-and-out profit; she/she is using price action. On the other hand, a long term investor holding a diversified portfolio with a strategy based on modern portfolio theory combined with fundamental analysis (at this point candlesticks are irrelevant) but has one additional criteria of, say, can only go Long on a stock when it has closed Green on Daily; he/she is also considered to be executing on price action.
█ Candlestick patterns
This script calculates the displacement of highs and lows over three consecutive bars.
A) Down move = When High of the recent confirmed bar is lower than the Low of the previous-previous candle
B) Up move = When Low of the recent confirmed bar is higher than the High of the previous-previous candle
(Note that its the confirmed bar that is being talked about, so it does not repaint)
An ATR filter will be applied to reduce the number of lines generated as many times they might just be associated with minor price changes.
Interpretations:
When price moves quickly across three bars, it can be thought that it has gapped. Although the candle in the middle appears to be solid, it’s not from a conceptual perspective. This is because time itself is arbitrary; timeframes don’t necessarily have to be fixed intervals. Take stocks with regular trading hours for example, if price makes a breakaway gap and you bundle the after-hours and pre-market sessions together as one candle, never minding that intervals should be fixed, then you will see the exact three-bar-gap patterns. Similar happens during intraday sessions on lower timeframes, if you zoom-in closer, you’ll see that ticks within the middle candle are sparsely dispersed. This is why it's called a gap.
█ Parameters with fixed inputs & assumptions used:
ATR is used for filtering out minor movements that will likely be deemed as irrelevant by trader for the purpose of live execution. The following inputs are required:
A) ATR lookback period
B) Multiplier
The product of ATR(len=A) and B produces a threshold for minimum distance that price must gap by. Initially, it was proposed to be only based on one ATR, but often an ATR is too wide and using it will filter out too many lines. Because of this observation, a multiplier (Parameter B) has been introduced to allow users to apply fractional ATR as a threshold.
█ Applications:
For trend followers: Follow the direction of the gap. Entering above recent high/low points above/below the first impulse with a stop-limit order is a viable tactic.
For contrarians fading a trend: The mid-point is a good point of reference for predicting potential areas of support/resistance.
PSAR BBPT ZLSMA BTC 1minLong entry:
PSAR gives buy signal
BBPT prints green histogram
ZLSMA is below the price
ZLSMA has uptrend
SL is smaller than the max SL
Optional Sessions and EMA filters
Short entry
PSAR gives sell signal
BBPT prints red histogram
ZLSMA is above the price
ZLSMA has downtrend
SL is smaller than the max SL
Optional Sessions and EMA filters
SL:
Placed below ZLSMA + offset on long
Placed above ZLSMA + offset on short
TP1:
1x the SL by default
Takes no profit by default, 50% is also a good setting
TP2:
2x the SL by default
Take out all remaining position size.
If price reaches TP1, the SL is set to the entry price.
JustaBox_NY_LexThis indicator marks two boxes around the opening hour of the chosen session(s). One around the highs and lows and one around the highest open/close and lowest open/close for that hour., its main purpose if for backtesting the DR/IDR strategy but is useful for live trading as it auto adds the boxes and STD levels. The buy and sell signals that show up are not meant for trade entries, they just give an idea of whether there was a signal that day which is a close above or below the IDR (inner box lines), from there loops are started and it tests which STD levels get hit or if the opposite end of the box is crossed it considers it a stop out and closes the loops. The data from these loops can be pulled to email and then excel using the alert system.
This is the first thing i've ever coded, I put alot of work into it but id recommend going thru a few days randomly and checking the data matches up as expected.
This indicator only pulls data from the NY session, I have two others of identical functionality, the only difference being they pull the data from the London and Tokyo sessions respectively, wanted to include all three in one but I reached a limit. Search JustaBox_LDN_Lex and JustaBox_TKO_Lex
When live, once the hour of the chosen session resolves it marks the DR and IDR lines onward for a few hours, adds a 0.5 retracement line in the middle and STD levels above and below at 0.5, 1, 1.5, 2, 2.5, & 3.
There are labels that can be turned off, they show the prices these lines are set at.
Read the tooltips in the menu for more information.
(Might be self explanatory when you pull it but I'll add a key here for the titles of the data(had to keep them short due to character limit) and explain how the test works in the next couple of days but quickly:
Each STD levels has a true, false or NaN state, if its a buy signal for the session the STD levels below the bottom DR are turned off and will return NaN, but if its a sell signal they'll return false if they don't get hit true if they do. Each level has a cross time this is a bar number, you also get a bar number for the last bar in the DR box and one for when you received the buy or sell signal, so you subtract one of these from the STD X number and it will give you number of bars since 10:30 for NY sess or from when you received signal. Multiply that number by 5 to get the number of minutes. Gives prices for boxes, open and close prices of first and last candles in box and price of the NY day open for all sessions)
RF+ Divergence Scalping SystemRF+ Divergence Scalping System + Custom Signals + Alerts.
This chart overlay indicator has been developed for the low timeframe divergence scalper.
Built upon the realtime divergence drawing code from the Divergence for Many indicator originally authored by Lonsometheblue, this chart overlay indicator bundles several additional unique features and modifications to serve as an all-in-one divergence scalping system. The current key features at the time of publishing are listed below (features are optional and can be enabled or disabled):
- Fully configurable realtime divergence drawing and alerting feature that can draw divergences directly on the chart using data sourced from up to 11 oscillators selected by the user, which have been included specifically for their ability to detect divergences, including oscillators not presently included in the original Divergence for Many indicator, such as the Ultimate Oscillator and TSI.
- Optional on chart table showing a summary of key statuses of various indicators, and nearby divergences.
- 2 x Range Filters with custom settings used for low timeframe trend detection.
- 3 x configurable multi-timeframe Stochastic RSI overbought and oversold signals with presentation options.
- On-chart pivot points drawn automatically.
- Automatically adjusted pivot period for up to 4 configurable time frames to fine tune divergences drawn for optimal divergence detection.
- Real-price line for use with Heikin Ashi candles, with styling options.
- Real-price close dots for use with Heikin Ashi candles, with styling options.
- A selection of custom signals that can be printed on-chart and alerted.
- Sessions indicator for the London, New York, Tokyo and Sydney trading sessions, including daylight savings toggle, and unique ‘invert background color’ option, which colours the entire chart - except the trading session you have selected, leaving your chart clear of distracting background color.
- Up to 4 fully configurable moving averages.
- Additional configurable settings for numerous built in indicators, allowing you to alter the lengths and source types, including the UO, TSI, MFI, TSV, 2 x Range Filters.
- Configurable RSI Trend detection signal filter used in a number of the signals, which filters buy signals where the RSI is over the RSI moving average, and only prints sell signals where RSI is under the moving average.
- Customisable on-chart watermark, with inputs for a custom title, subtitle, and also an optional symbol | timeframe | date feature.
The Oscillators able to be selected for use in drawing divergences at the time of publishing are as follows:
- Ultimate Oscillator (UO)
- True Strength Indicator (TSI)
- Money Flow Index (MFI)
- Cumulative Delta Volume (CDV)
- Time Segmented Volume (TSV)
- Commodity Channel Index (CCI)
- Awesome Oscillator
- Relative Strength Index (RSI)
- Stochastic
- On Balance Volume (OBV)
- MACD Histogram
What are divergences?
Divergence is when the price of an asset is moving in the opposite direction of a technical indicator, such as an oscillator, or is moving contrary to other data. Divergence warns that the current price trend may be weakening, and in some cases may lead to the price changing direction.
There are 4 main types of divergence, which are split into 2 categories;
regular divergences and hidden divergences. Regular divergences indicate possible trend reversals, and hidden divergences indicate possible trend continuation.
Regular bullish divergence: An indication of a potential trend reversal, from the current downtrend, to an uptrend.
Regular bearish divergence: An indication of a potential trend reversal, from the current uptrend, to a downtrend.
Hidden bullish divergence: An indication of a potential uptrend continuation.
Hidden bearish divergence: An indication of a potential downtrend continuation.
Setting alerts.
With this indicator you can set alerts to notify you when any/all of the above types of divergences occur, on any chart timeframe you choose, also when the triple timeframe Stochastic RSI overbought and oversold confluences occur, as well as when custom signals are printed.
Configurable pivot period values.
You can adjust the default pivot period values to suit your prefered trading style and timeframe. If you like to trade a shorter time frame, lowering the default lookback values will make the divergences drawn more sensitive to short term price action. By default, this indicator has enabled the automatic adjustment of the pivot periods for 4 configurable time frames, in a bid to optimize the divergences drawn when the indicator is loaded onto any of the 4 time frames selected. These time frames and their associated pivot periods can be fully reconfigured within the settings menu. By default, these have been further optimized for the low timeframe scalper trading on the 1-15 minute time frames.
How do traders use divergences in their trading?
A divergence is considered a leading indicator in technical analysis , meaning it has the ability to indicate a potential price move in the short term future.
Hidden bullish and hidden bearish divergences, which indicate a potential continuation of the current trend are sometimes considered a good place for traders to begin, since trend continuation occurs more frequently than reversals, or trend changes.
When trading regular bullish divergences and regular bearish divergences, which are indications of a trend reversal, the probability of it doing so may increase when these occur at a strong support or resistance level . A common mistake new traders make is to get into a regular divergence trade too early, assuming it will immediately reverse, but these can continue to form for some time before the trend eventually changes, by using forms of support or resistance as an added confluence, such as when price reaches a moving average, the success rate when trading these patterns may increase.
Typically, traders will manually draw lines across the swing highs and swing lows of both the price chart and the oscillator to see whether they appear to present a divergence, this indicator will draw them for you, quickly and clearly, and can notify you when they occur.
How do traders use overbought and oversold levels in their trading?
The oversold level is when the Stochastic RSI is above the 80 level is typically interpreted as being 'overbought', and below the 20 level is typically considered 'oversold'. Traders will often use the Stochastic RSI at, or crossing down from an overbought level as a confluence for entry into a short position, and the Stochastic RSI at, or crossing up from an oversold level as a confluence for an entry into a long position. These levels do not mean that price will necessarily reverse at those levels in a reliable way, however. This is why this version of the Stoch RSI employs the triple timeframe overbought and oversold confluence, in an attempt to add a more confluence and reliability to this usage of the Stoch RSI.
This indicator is intended for use in conjunction with related panel indicators including the TSI+ (True Strength Indicator + Realtime Divergences), UO+ (Ultimate Oscillator + Realtime Divergences), and optionally the STRSI+ (MTF Stochastic RSI + Realtime Divergences) and MFI+ (Money Flow Index + Realtime Divergences) available via this authors’ Tradingview profile, under the scripts section. The realtime divergence drawing code will not identify all divergences, so it is suggested that you also have panel indicators to observe. Each panel indicator also offers additional means of entry confirmation into divergence trades, for example, the Stochastic can indicate when it is crossing down from overbought or up from oversold, the TSi can indicate when the 2 TSI bands cross over one another upward or downward, and the UO and MFI can indicate an entry confluence when they are nearing, or crossing their centerlines, for more confidence in your divergence trade entries.
Additional information on the settings for this indicator can be found via the tooltips within the settings menu itself. Further information on feature updates, and usage tips & tricks will be added to the comments section below in due course.
Disclaimer: This indicator uses code adapted from the Divergence for Many v4 indicator authored by Lonesometheblue, and several stock indicators authored by Tradingview. With many thanks.
1+KillZoneLiteRemove plot line for a better view. I've made this to work on "US30 Global Prime" probably works on other pairs the codes left open to mod.
This Indicator shows 3 sessions to help you focus on timing. This will help you with learning pattern recognition aswell.
1. Gray zone is spreads. The gray zone will show up 30 min before spreads open up.
2. Blue is new york
3. Red is london reversal zone.
4. Look between the zones and also how price reacts within the zones and at what time.
5. This indicator also prints the sessions 1 day in advance to help with back testing aswell.
Phantom - My Session RangeThis is a modification of a script by RobMinty, "FXN - Asian Session Range" The script provides functionality to track specific trading sessions based on user preference rather than just the market sessions open and close. The idea is to help you hold yourself accountable to your specific trading times as well as backtest various marketing timings suitable to your schedule.
This script utilizes RobMinty's pine code to visualize your market session. We have adjusted the script to project the end of the session before the candles print - as well as adding/subtracting the horizontal and/or vertical lines around the current session box. This should help you understand how much time you have left in your session with a quick visual representation. While we have made some additions and adjustments to RobMinty's script- The inputs and functions of the combined script have not changed significantly from the originals. Like the originals, the code has been made open-source. If this script is reused or modified, please provide credit to RobMinty. If you plan to use this specific code with the ability to remove lines from the box and project session end forward, please credit both of us.
FULL MA Optimization ScriptHello!
This script measures the performance of 10 moving averages and compares them!
Crossover and crossunders are both tested.
The tested moving averages include: TEMA, DEMA, EMA, SMA, ALMA, HMA, T3 Average, WMA, VWMA, LSMA.
You can select the length of the moving averages and the data source (I.E, close, open, ohlc4, etc.) and the script will calculate your selections!
For instance, if you select a length of 32 and a source of ohlc4 for crossovers, the script will assign the ten moving averages that length and data source and compare the performance for ohlc4 crossovers of the 32TEMA, 32DEMA, 32SMA, 32WMA, etc. If you select crossunder, the script will calculate the performance of ohlc4 crossunders of the same moving average lengths.
Moving average performances are listed in descending order (best to worst) and are categorized by tier: Upper-Tier, Mid-Tier, Lower-Tier. The Upper-Tier displays the three best performing averages relative to the MA length and data source, for the asset on the relevant chart timeframe. The Lower-Tier displays the three worst performing averages. The Mid-Tier displays the moving averages whose performance did not achieve a top three spot or a bottom three spot.
Also calculated is the moving average which achieved the highest cumulative gain/loss and the lowest cumulative gain/loss. Any asset and timeframe can be tested; the script recalculates relative to the chart timeframe. I added a "Benchmark Moving Average" free parameter and a "Custom Moving Average" free parameter. The two operate identically; you can set the length and data source of both for quick and simple comparison between differing average lengths and sources.
If "Crossover" is selected, the "(X Candles)" displayed on the tables reflects the average number of sessions the data source remains above a moving average following a crossover. If "Crossunder" is selected, the "(X Candles)" reflects the average number of sessions the data source remains below the moving average following a crossunder.
If "Crossover" is selected, the listed "X%" reflects the average percentage gain/loss following a source crossover of a moving average up until the source crosses back under the moving average. If "Crossunder" is selected, the listed "X%" reflects the average percentage gain/loss following a source crossunder of a moving average up until the source crosses back over the moving average.
If "Crossover" is selected, the listed "X Crosses" reflects the number of instances in which the source crossed over a moving average. If "Crossunder" is selected, the listed "X Crosses" reflects the number of instances in which the source crossed under a moving average.
Additional tooltips and instructions are included should you access the user input menu.
The moving averages can be plotted as a gradient (highest priced MA to lowest priced MA) alongside the best performing moving average. The moving averages can be plotted in full color, light color alongside the best performing average, or not plotted.
This script improves upon a similar script I have released:
I decided not to update the previous script. The previous script calculates crossovers only and, due to being less code intensive, calculates much quicker. If a user is concerned only with price crossovers, not crossunders, the original script is a better option! It's faster, making it the preferable choice!
This script "FULL MA Optimization" calculates crossovers/crossunders and incorporates additional plot styles. I ran into trouble a few times where the script was too large to run on TV. This script is not "slow", I suppose; however, calculations and parameter modifications take a bit longer than the original script!
SetSessionTimesLibrary "SetSessionTimes"
Function to automatically set session times for symbols and eventually timezone.
Useful mainly for futures contracts, to differentiate between pit and overnight sessions, and for 24 hours symbols if you want to "create" sessions for them
This library only returns correct session times to the calling script and does nothing by itself on the chart. the calling script must then use the returned session times to do anything.
For example, in the attached chart this library is used by my initial balance indicator, which calls it to retrieve the correct session times for the selected symbol in the chart, given that different futures contracts have different pit session times (RTH times) and Tradingview hasn't implemented that yet.
SetSessionTimes()
Koalafied Initial Balance Levels and ExtensionsShows the Initial Balance and range extensions for either the Daily session or individual market sessions (Asia, London, New York).
Initial Balance is the range represented by the first two segments (typically half-hour segments) of a trading session. Range extensions are a function of the longer-term trader participation, pushing price outside of the beginning 'fair' range established by the local traders. With the introduction of 24/7 markets the initial balance is often now regarded as less important than in the past, however re-calculating IB for multiple trading sessions may reinstitute insight to Market Direction and Confidence
Kviateq - Session PivotsFirst of all, I must say that this script wouldn't be possible without the help of one of the best script developers on TradingView - @ahancock (thanks a bunch for your help)
This script draws opening ranges for each of the sessions - Tokyo, London and New York and plots session high, low and pivot range of the previous session.
So if you trade London session - you would only take longs if we're above the Tokyo pivot range and vice versa for shorts.
Often times previous session's highs act as resistance and lows act as support, so careful trading around those levels.
It is obviously meant for lower timeframes, since each of the sessions only lasts a few hours.
Default settings are set to the exchange that I use and my timezone (GMT +7), so you might need to adjust the settings accordingly.
Tokyo - 12am GMT
London - 7am GMT
New York - 12pm GMT
Historic VPoCs and pseudo VPVRThis study tries to recreate session based historic VPoCs
and VPVR Volume Profile
as they are used by
TradingLatino TradingView user.
It's aimed at BTCUSDT pair and 4h timeframe.
HOW IT WORKS
HOW IT WORKS - VPVR Profile Block
It gathers volume from the last chosen Bars
in order to draw the vpvr profile block
Volume that intersects with current level range
being studied is added to its value.
Additionally the current level price is modified
so that it matches the level price where most
of the volume has concentrated
So you get a pretty accurate price for drawn volume
while at the same time the levels are not stuck
to arbitrary level prices.
HOW IT WORKS - VPoC
It calculates a Volume Profile for the
given historic session but then
it only outputs that Volume Profile VPoC.
SETTINGS
Show VPVR Volume Profile {True}.
Show Historic VPoC lines {True}.
Show Historic VPoC labels {True}.
Extend Historic VPoC lines {True}: If this option is turned off the VPoC lines are only shown during the session duration.
Show tick difference from current price {False}: BETA. Feedback is needed because I'm not sure how it should work this setting.
VPVR Number of bars {100}: Define the Visible Range in number of bars so that its Volume Profile can be shown.
VPVR Profile width (in bars) {15}: VPVR Profile can be make larger or smaller in width thanks to this option.
VPVR Profile offset (in bars) {15}: VPVR Profile can be shown more to the left or to the right if the defaults do not suit you.
Historic Session Volume Profile timeframe {1D}: Historic VPoC use 1 day as their timeframe reference by default.
Number of decimal digits {2}: How many decimal digits are shown in label prices.
Number of previous sessions to print VPoC {5}: How many previous sessions VPoCs are to be printed. The maximum for this setting is 20.
Historic VPoC lines width (in pixels) {2}.
Historic VPoC labels size {small}.
History VPoC line offset (in bars) {5}: How far to the right VPoCs lines are to be extended. Note: This setting does not apply when 'Extend Historic VPoC lines' is set to 'False'.
WARNING
Please be aware that VPoC from the first previous session might not be accurate due to Pine Script limitations.
VPVR USAGE
This is not a VPVR like the official TradingView indicator.
This is a pseudo VPVR and that means it needs some manual input from you.
But, don't worry it's quite easy to do and if you always use the same number
of bars to calculate your VPVR then you might even just set it up once.
In order to show the VPVR (or Volume Profile on the Visible Range):
Rescale your chart so that you see all the bars for your Visible Range.
Click on the ruler tool.
Click on the last bar (far to the right) shown on the screen
Drag the ruler to first bar (far to the left) shown on the screen
Check what the ruler says
E.g. it says: 101 bars
Open this study settings
Modify: 'VPVR Number of bars ' setting
So that its value matches your measured number of bars (101)
Press OK to confirm and wait for the indicator to refresh.
STRATEGY USAGE
If your strategy uses VPoC
to define your resistances
or supports
you can check the VPoCs shown here.
FEEDBACK
I have only used this identifier in BTCUSDT 4h timeframe.
I'm interested to know what needs to be tweaked
in other securities and timeframes.
PINE STUDY TRICK
This study let's you choose the number of decimals the label will use.
CREDITS
I have reused and adapted some code from
'Poor man's volume profile' study
which it's from TradingView IldarAkhmetgaleev user.
I also wanted to thank him for helping me understanding his study.
I have reused some code from
'MTF Selection Framework - PineCoders FAQ' study
which it's from TradingView PineCoders user.
Session S/RThis indicator marks the resistances and supports of the post, pre and market sessions of the previous day projecting up to the market of the day, also it marks the hours of these three markets allowing to identify the beginning and end of the sessions in London, Hong Kong, and America.
RVOL - R4RocketRelative volume or RVOL for short is an indicator that is used to measure how 'In Play' the stock is. Simply put, it helps to quantify how interested everybody is in the given stock - higher the value, higher the interest and hence higher is the probability for movement in the stock.
I have tried to create RVOL (Relative Volume ) Indicator as per the description that I read on SMB Capital blog. The blog is a great resource.
...................................................................................................................................................................................
How to use the indicator - The indicator is meant for INTRADAY ONLY.
The indicator has following inputs -
1. RVOL Period - Value from 3 to 14 (Default Value = 4)
This is used to calculate the average volume over the given period of days. e.g. average volume for the last 5 days, last 3 days, last 10 days etc. NOTE - If you use higher RVOL Period on smaller timeframes, the code will give an error. So I recommend using 4 or lower for 5 min timeframe. (Nothing will work on 1 min chart and you can experiment for other timeframes.)
2. RVOL Sectional - True / False (Default Value = False)
If you check this box then you will be able to calculate the RVOL for a particular session (or between particular sessions) in that trading day.
What do I mean by session?
Well I have divided the trading day into 6 (almost) equally spaced sessions in time, i.e. 6 hours and 15 mins (for NSE - India) of trading day is divided into 1 hr - 1st session, 1 hr - 2nd session, 1 hr - 3rd session, 1 hr - 4th session, 1 hr - 5th session, 1 hr and 15 min - 6th session.
Before using 3rd and 4th inputs of indicator, RVOL Sectional box MUST BE CHECKED FIRST.
3. RVOL From Session - 1 to 6 (Default Value = 1)
4. RVOL To Session - 1 to 6 (Default Value = 2)
Now if you select 2 in "RVOL From Session" input and 3 in "RVOL To Session" input, the indicator will calculate RVOL for the 2nd and 3rd hour of the trading day. If you select 3 in both the inputs, then the indicator will give RVOL for the 3rd hour of the trading day.
5. RVOL Trigger - 0.2 to 10 (Default Value = 2)
Filter to find days having RVOL above that value. The indicator turns green (or colour of your choice) when RVOL is more than "RVOL Trigger".
...................................................................................................................................................................................
Hope this indicator will add some value in your trading endeavor.
“Only The Game, Can Teach You The Game” – Jesse Livermore
Yours sincerely,
R4Rocket
**If you have some awesome idea for improvement of the indicator - request you to update the code and share the same.
TRADING VIEW INDICATOR - PINE TUTORIAL 5After a long gap, I have written the 5th tutorial for the pine script. You can find the others below, if you read through all of these you should be good to do your own writing.
This script mimics the Trading View Indicator . For example this one below.
www.tradingview.com
It shows the net result of the 28 indicator, either as buy or sell. I have worked hard to make sure it matches the trading view results but I am not in hundred percent agreement with tradingView on SMA, EMA and Ichimoku indicator.
There are many commented plots because I needed to check separately if each indicator is working correctly.
Someone else wrote this code but they did not make it public. It took me about 3 weeks to write this and to be honest it could be cleaner and better commented.
If you find any mistake please let me know. I hope it will be useful in your learning.
Sim PackThis is a custom indicator that includes the following:
EMA's 50, 100 and 200
SMA 20
Moving average cross support and resistance levels
Colored bars associated with 4-hour AM sessions for Asia, UK, and US
1-hour alerts prior to AM sessions
Plots of previous AM session close during current AM session


