ICT Silver Bullet [LuxAlgo]The ICT Silver Bullet indicator is inspired from the lectures of "The Inner Circle Trader" (ICT) and highlights the Silver Bullet (SB) window which is a specific 1-hour interval where a Fair Value Gap (FVG) pattern can be formed.
When a FVG is formed during the Silver Bullet window, Support & Resistance lines will be drawn at the end of the SB session.
There are 3 different Silver Bullet windows (New York local time):
The London Open Silver Bullet (3 AM — 4 AM ~ 03:00 — 04:00)
The AM Session Silver Bullet (10 AM — 11 AM ~ 10:00 — 11:00)
The PM Session Silver Bullet (2 PM — 3 PM ~ 14:00 — 15:00)
🔶 USAGE
The ICT Silver Bullet indicator aims to provide users a comprehensive display as similar as possible to how anyone would manually draw the concept on their charts.
It's important to use anything below the 15-minute timeframe to ensure proper setups can display. In this section, we are purely using the 3-minute timeframe.
In the image below, we can see a bullish setup whereas a FVG was successfully retested during the Silver Bullet session. This was then followed by a move upwards to liquidity as our target.
Alternatively, you can also see below a bearish setup utilizing the ICT Silver Bullet indicator outlined.
At this moment, the indicator has removed all other FVGs within the Silver Bullet session & has confirmed this FVG as the retested one.
There is also a support level marked below to be used as a liquidity target as per the ICT Silver Bullet concept suggests.
In the below chart we can see 4 separate consecutive examples of bullish & bearish setups on the 3-minute chart.
🔶 CONCEPTS
This technique can visualize potential support/resistance lines, which can be used as targets.
The script contains 2 main components:
• forming of a Fair Value Gap (FVG)
• drawing support/resistance (S/R) lines
🔹 Forming of FVG
1 basic principle: when a FVG at the end of the SB session is not retraced, it will be made invisible.
Dependable on the settings, different FVG's will be shown.
• 'All FVG': all FVG's are shown, regardless the trend
• 'Only FVG's in the same direction of trend': Only FVG's are shown that are similar to the trend at that moment (trend can be visualized by enabling ' Show ' -> ' Trend ')
-> only bearish FVG when the trend is bearish vs. bullish FVG when trend is bullish
• 'strict': Besides being similar to the trend, only FVG's are shown when the closing price at the end of the SB session is:
– below the top of the FVG box (bearish FVG)
– above bottom of the FVG box (bullish FVG)
• 'super-strict': Besides being similar to the trend, only FVG's are shown when the FVG box is NOT broken
in the opposite direction AND the closing price at the end of the SB session is:
– below bottom of the FVG box (bearish FVG)
– above the top of the FVG box (bullish FVG)
' Super-Strict ' mode resembles ICT lectures the most.
🔹 Drawing support/resistance lines
When the SB session has ended, the script draws potential support/resistance lines, again, dependable on the settings.
• Previous session (any): S/R lines are fetched between current and previous session.
For example, when current session is ' AM SB Session (10 AM — 11 AM) ', then previous session is
' London Open SB (3 AM — 4 AM) ', S/R lines between these 2 sessions alone will be included.
• Previous session (similar): S/R lines are fetched between current and previous - similar - session.
For example, when current session is ' London Open SB (3 AM — 4 AM)' , only S/R lines between
current session and previous ' London Open SB (3 AM — 4 AM) ' session are included.
When a new session starts, S/R lines will be removed, except when enabling ' Keep lines (only in strict mode) '
This is not possible in ' All FVG ' or ' Only FVG's in the same direction of trend ' mode, since the chart would be cluttered.
Note that in ' All FVG ' or ' Only FVG's in the same direction of trend ' mode, both, Support/Resistance lines will be shown,
while in Strict/Super-Strict mode:
• only Support lines will be shown if a bearish FVG appears
• only Resistance lines if a bullish FVG is shown
The lines will still be drawn the the end of the SB session, when a valid FVG appears,
but the S/R lines will remain visible and keep being updated until price reaches that line.
This publication contains a "Minimum Trade Framework (mTFW)", which represents the best-case expected price delivery, this is not your actual trade entry - exit range.
• 40 ticks for index futures or indices
• 15 pips for Forex pairs.
When on ' Strict/Super-Strict ' mode, only S/R lines will be shown which are:
• higher than the lowest FVG bottom + mTFW, in a bullish scenario
• lower than the highest FVG bottom - mTFW, in a bearish scenario
When on ' All FVG/Only FVG's in the same direction of trend ' mode, or on non-Forex/Futures/Indices symbols, S/R needs to be higher/lower than SB session high/low.
🔶 SETTINGS
(Check CONCEPTS for deeper insights and explanation)
🔹 Swing settings (left): Sets the length, which will set the lookback period/sensitivity of the Zigzag patterns (which directs the trend)
🔹 Silver Bullet Session; Show SB session: show lines and labels of SB session
Labels can be disabled separately in the ' Style ' section, color is set at the ' Inputs ' section.
🔹 FVG
– Mode
• All FVG
• Only FVG's in the same direction of trend
• Strict
• Super-Strict
– Colors
– Extend: extend till last bar of SB session
🔹 Targets – support/resistance lines
– Previous session (any): S/R lines fetched between current and previous SB session
– Previous session (similar): S/R lines fetched between current and previous similar SB session
– Colors
– Keep lines (only in strict mode)
🔹 Show
– MSS ~ Session: Show Market Structure Shift , only when this happens during a SB session
– Trend: Show trend (Zigzag, colored ~ trend)
Wyszukaj w skryptach "session high"

Refic PackRefic Pack - Session Highs/Lows & Fair Value Gaps
A comprehensive trading tool that combines session-based analysis with Fair Value Gap (FVG) detection across multiple market sessions. This indicator highlights key trading zones and inefficiencies during:
Asia Session (1:00-2:00 AM London time)
London AM (8:00-9:00 AM London time)
New York AM (2:30-3:30 PM London time)
New York PM (6:30-7:30 PM London time)
Features:
Color-coded session backgrounds for easy identification
Automatic detection of the first Fair Value Gap in each session
Customizable FVG box colors, borders, and extension length
Session high/low tracking for key support/resistance levels
Clean visual presentation with manageable box limits
Perfect for traders who focus on session-based strategies, institutional order flow, and price inefficiency trading. Works on all timeframes and helps identify high-probability reversal and continuation zones during key market hours.

Futures Key LevelsKey Levels — Sessions, Previous Ranges & Opens (Chicago-aligned sessions)
What it does
This indicator plots commonly used reference levels across multiple timeframes to help you frame the day and find confluence:
Sessions (Chicago TZ): London, New York, and Asia session high/low ranges.
Previous Period Ranges: Previous Day / Week / Month / Quarter / Year High/Low and optional Mid.
Opens: Current Daily / Weekly / Monthly / Quarterly / Yearly opens.
Intraday (4H): Previous 4-Hour High/Low + optional Mid.
Monday Range: Captures Monday’s High/Low (and optional Mid) to use as a weekly reference.
Price-scale markers: Optional markers that track key levels on the price scale without adding extra lines.
How it works (concepts & calculations)
Higher-timeframe values are retrieved using request.security() and update when a new period begins (e.g., previous day’s H/L become fixed at the start of the new day).
Session ranges are built from bar data within session windows using time(session, "America/Chicago"):
London: 02:00–05:00 CT
New York: 08:30–15:00 CT
Asia: 20:00–00:00 CT
“Mid” levels are simple midpoints between each period’s High and Low.
Merge Levels: when different levels land at the same price, their labels are merged to reduce clutter (e.g., “PDH / PWH”).
Why this version is useful / original bits
All-white baseline for clean charts; session colors stand out by design: London = Yellow, New York = Aquatic Blue, Asia = Red.
Right-anchored mode lets you park levels to the right side of the chart with a configurable anchor distance.
Label merging keeps the display minimal when multiple levels coincide.
Price-scale-only markers available when you prefer fewer lines on the chart.
Inputs & customization
Display Style: Standard or Right Anchored (+ distance controls).
Levels toggles: enable/disable each period (Daily/Weekly/Monthly/Quarterly/Yearly), Monday range, 4H range, and session ranges.
Text: optional shorthand labels (e.g., PDH/PDL, PWH/PWL).
Colors: global white theme, with session highlights; you can override in the Inputs.
Price-scale markers: on/off toggle.
How to use it
Use previous High/Low as liquidity pools and areas to watch for sweeps, breaks, or retests.
The Monday range often frames the rest of the week; breaks or rejections around Monday H/L can be informative.
The 4H previous range gives intraday context—great for mean-reversion vs. continuation reads.
Session ranges help you see where the active session expanded price and where liquidity may remain.
Notes & limitations
Sessions are computed in America/Chicago; higher-TF levels use the symbol’s exchange timezone.
This is an indicator, not a strategy; it does not place trades or claim performance.
Always combine levels with your own execution rules (structure, momentum, risk).
Credit: inspired by spacemanBTC; this version adds the all-white styling, Chicago-aligned sessions, right-anchoring, label merging, and price-scale markers.
Also my mentor to tell me about the levels
Disclaimer
This tool is for educational purposes only and is not financial advice. Markets involve risk; do your own research and manage risk appropriately.

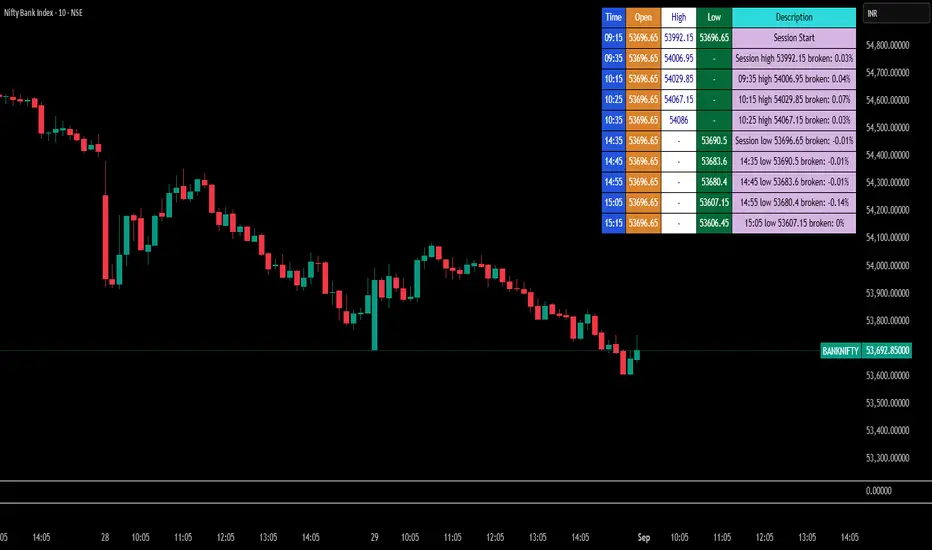
Break Point Record Table — GSK-VIZAG-AP-INDIA "Break Point Record Table — GSK-VIZAG-AP-INDIA" indicator captures key break points during each trading session and presents a clear, color-coded table overlay on the chart for quick visual reference. Specifically, it logs sessions' open price and monitors subsequent price action for notable breaks in the session high or low prices. Each break event is recorded with the time, price, and percentage change from the previous break, helping traders identify significant price movements within the session at a glance.
Key Features:
Records the session start time and opening price for context.
Tracks every intraday break above the previous session high or below the previous session low.
Calculates and displays the percentage change at each break event.
Highlights breaks with descriptive text including break time and values to aid trade decision-making.
Displays a table with columns for Time, Open, High, Low, and a Description of the event.
Uses color-coded cells to differentiate between session start, highs, lows, and break descriptions for better readability.
Maintains performance and readability by limiting the table to the latest 30 break events.
Usage & Benefits:
This indicator is ideal for intraday traders who want reliable visual cues to monitor momentum shifts and breakout/breakdown points during the trading day. By capturing these break points as discrete events and organizing the data into an easily accessible, visually intuitive table, it improves situational awareness and supports timely trading decisions.
LevelsThis Indicator is meant to plot some of the most common levels that traders use.
The display of these levels is highly customizable, as you can choose the line type , color , thickness and whether it shows you no label, price only, reduced label or full label next to the line. All labels (except for "no Label") will show the price at this level.
Also You have the option to mark the start on each timeframe with either a individually colored background or a vertical line where you can choose the line style and color.
Full List of available Levels and Optional inputs to these levels:
Previous HTF Candle Levels:
• Previous HTF Candle Open
• Previous HTF Candle High
• Previous HTF Candle Low
• Previous HTF Candle Close
Optional:
• Choose any higher timeframe
• Mark start of new HTF candle
Session Levels:
• Session Open
• Session High
• Session Low
• Session Close
Optional:
• Choose any time as start and end of your session
• Mark start of session
• Mark full session
Daily Levels:
• Current Day Open
• Current Day High
• Current Day Low
• Previous Day Open
• Previous Day High
• Previous Day Low
• Previous Day Close
Optional:
• Choose start of day (standard, NY Midnight, custom start time)
• Mark start of day
Weekly Levels:
• Current Week Open
• Current Week High
• Current Week Low
• Previous Week Open
• Previous Week High
• Previous Week Low
• Previous Week Close
Optional:
• Mark start of Week
Monthly Levels:
• Current Month Open
• Current Month High
• Current MonthLow
• Previous Month Open
• Previous Month High
• Previous Month Low
• Previous Month Close
Optional:
• Mark start of Month

Malama's KAYCAP Pre-Market Box# Pre-Market Single Candle Range Box
## What Makes This Script Original
While many scripts plot entire pre-market session ranges, this indicator focuses specifically on **a single user-defined candle** within the pre-market period rather than the entire session. This targeted approach allows traders to isolate the most relevant price action from a specific time (default: 4:00 AM EST) that often establishes key levels for the trading day.
## Core Methodology & Technical Implementation
**Single Candle Isolation:**
- Captures OHLC data from one specific minute within pre-market hours (user configurable)
- Differentiates between the candle's body (open/close range) and wicks (high/low extremes)
- Creates four distinct reference levels instead of traditional session high/low boxes
**Dual Box Structure:**
- **Inner Box (Body):** Plots the range between open and close prices of the target candle
- **Outer Boundaries:** Separately plots the high and low of that same candle
- **Visual Differentiation:** Uses different colors and line weights to distinguish body vs. wick levels
**Time-Specific Logic:**
The script uses precise time matching (`hour == boxHour and minute == boxMinute`) to capture data from exactly one candle, rather than aggregating an entire session. This creates four specific price levels:
- Box Top: Higher of open/close (body boundary)
- Box Bottom: Lower of open/close (body boundary)
- Box High: Candle high (wick extreme)
- Box Low: Candle low (wick extreme)
## Why This Approach Differs from Standard Session Boxes
**vs. Full Session Ranges:** Focuses on a single critical minute rather than entire pre-market period
**vs. Traditional S/R:** Creates both body and wick levels from one specific candle
**vs. Opening Range:** Uses pre-market data rather than regular session opening minutes
## Practical Application
The 4:00 AM EST default targets a time when institutional pre-market activity often establishes initial sentiment and key levels. By isolating this specific candle's range:
- **Body levels** often act as initial support/resistance during regular hours
- **Wick extremes** provide broader range boundaries for breakout analysis
- **Precise timing** allows focus on the most statistically relevant pre-market moment
## Technical Considerations
- Requires intraday timeframes (1-minute recommended) to capture specific candle data
- Time settings should match your broker's timezone for accurate candle selection
- Works best on liquid instruments where pre-market activity is meaningful
- The selected candle must exist in your data feed for the levels to plot
## Customization Options
All timing parameters are adjustable:
- Target candle hour and minute
- Pre-market session definition (for context)
- Visual styling for all four level types
This focused approach provides more granular analysis than broad session ranges while maintaining simplicity in execution.

MJBFX-Strategy (Futures Optimized)The MJBFX-Strategy is a complete market mapping tool designed to give traders a clear view of liquidity, session dynamics, and premium/discount levels. It loads automatically on any chart, fully optimized for futures and forex trading.
🔑 Key Features
Asian Session Range
Highlights the previous Asian session with a shaded box
Fixed until London open for precise reference
VWAP from Asian Session
Plots the VWAP of the previous Asian session
Dynamic fair value benchmark for intraday trading
Liquidity Sweeps (Optimized)
Detects sweeps of the Asian session high/low
Shown only on 30m, 1h, and 4h charts to reduce noise
Clean, minimal labels for clarity
Automatic Fibonacci Zone
Draws a shaded retracement zone (38.2%–61.8%) of the Asian range
Transparent fill makes it easy to read price action
Killzones
Highlights London (07:00–10:00) and New York (13:00–16:00) killzones
Semi-opaque shading to keep charts clean
Auto Trade Box (Risk/Reward)
On sweep confirmation, plots a 2R target box
Auto stop loss and take profit levels based on futures tick size
🎯 Why Use It?
The MJBFX-Strategy removes the need for manual drawing.It automatically maps:
Session highs and lows
Liquidity sweeps
VWAP and fib retracement zones
Key killzones
Perfect for session-based intraday trading in both futures and forex.
⚡ No manual settings required.Just load it onto your chart for an instant institutional view of the market.

Multi Vertical Timeline V3English Description
Multi Vertical Timeline V3 + 3 Time Blocks
A professional trading indicator for precise time marking and session highlighting on your charts.
Key Features:
📍 6 Vertical Time Lines:
Individually configurable times (hour/minute)
Customizable colors, line widths, and styles (solid, dashed, dotted)
Enable/disable toggle for each timeline
Optional time labels
🎨 3 Trading Session Blocks:
Colored background highlights for important trading hours
Pre-configured for NY, London, and Tokyo sessions
Fully customizable start and end times
Transparent coloring for optimal chart readability
⏰ Smart Time Control:
Precise timezone offset setting (-12 to +12 hours)
Automatic adjustment for daylight saving time
Worldwide timezone support
Special handling for time blocks crossing midnight
🛠️ User-Friendly Design:
Clear grouping of all settings
Global on/off control for all labels
No performance impact through optimized code
Instant visual feedback
Use Cases:
Forex Trading (mark session overlaps)
Futures Trading (market opening hours)
Intraday Strategies (entry/exit times)
Multi-timeframe Analysis
Backtesting with time-based rules
Perfect for traders who need precise time markings and session highlights for their strategies!

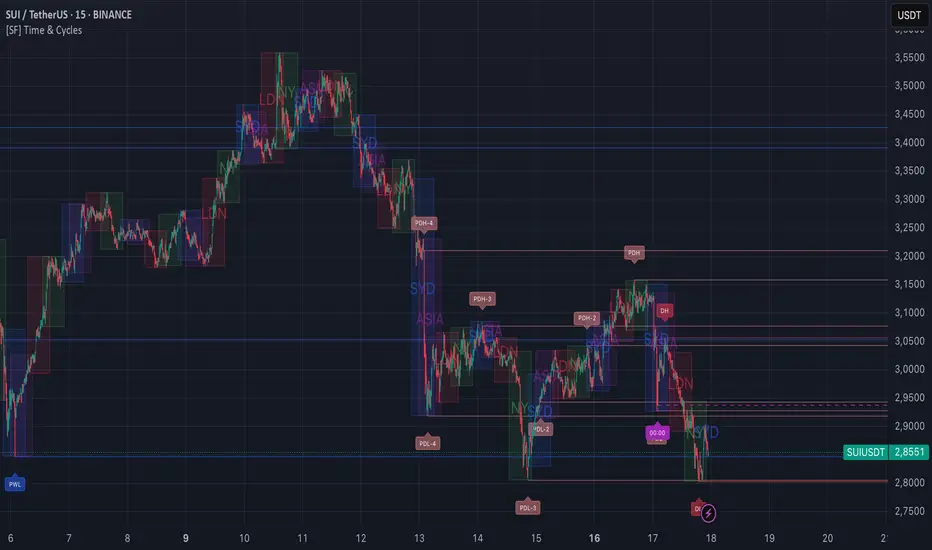
[FS] Time & Cycles Time & Cycles
A comprehensive trading session indicator that helps traders identify and track key market sessions and their price levels. This tool is particularly useful for forex and futures traders who need to monitor multiple trading sessions.
Key Features:
• Multiple Session Support:
- London Session
- New York Session
- Sydney Session
- Asia Session
- Customizable TBD Session
• Session Visualization:
- Clear session boxes with customizable colors
- Session labels with adjustable visibility
- Support for sessions crossing midnight
- Timezone-aware calculations
• Price Level Tracking:
- Daily High/Low levels
- Weekly High/Low levels
- Previous session High/Low levels
- Customizable history depth for each level type
• Customization Options:
- Adjustable colors for each session
- Customizable border styles
- Label visibility controls
- Timezone selection
- History level depth settings
• Technical Features:
- High-performance calculation engine
- Support for multiple timeframes
- Efficient memory usage
- Clean and intuitive visual display
Perfect for:
• Forex traders monitoring multiple sessions
• Futures traders tracking market hours
• Swing traders identifying key session levels
• Day traders planning their trading hours
• Market analysts studying session patterns
The indicator helps traders:
- Identify active trading sessions
- Track session-specific price levels
- Monitor market activity across different time zones
- Plan trades based on session boundaries
- Analyze price action within specific sessions
Note: This indicator is designed to work across all timeframes and is optimized for performance with minimal impact on chart loading times.
TradeJorno - Time + Price Levels
Tired of manually drawing and updating important ICT or SMC time and price levels on your charts every day?
Here’s an indicator to draw important TIME and PRICE levels automatically.
Here’s what you can highlight in realtime on your charts:
1. Previous major highs and lows
⁃ Previous daily and weekly highs and low
- Weekly dividing lines
2. Session highs/lows
⁃ Plot the high and low of Asia and London sessions.
⁃ Customise the timeframe and appearance on the chart.
- Previous session settlement price.
3. Various price levels
⁃ Pre-market opening prices : midnight, 7:30 and 8:30
⁃ Regular market opening prices: 9:30, 10:00, 14:00
- end of session settlement prices
4. Market opening range high and low
⁃ Lines extending throughout the current session
⁃ Customise the timeframe and appearance on the chart.
5. ICT Macro times
- Draw customisable vertical lines and labels to indicate the start of each ICT macro
period.
Let us know in the comments below if there’s anything else we need to add!

AMD Liquidity Sweep with AlertsAMD Liquidity Sweep with Alerts
Identify key liquidity levels from the Asian trading session with visual markers and alerts.
📌 Key Features:
Asia Session Detection
Customizable start/end hours (0-23) to match your trading timezone
Automatically calculates session high/low
Smart Swing Level Identification
Finds the closest significant swing high ≥ Asia high
Finds the closest significant swing low ≤ Asia low
Adjustable pivot sensitivity (# of left/right bars)
Professional Visuals
Dashed reference lines extending into the future
Blue-highlighted key levels
Clean label formatting with precise price levels
Trading Alerts
Price-cross alerts for liquidity breaks
Visual markers (triangles) when levels are breached
Separate alerts for buy-side/sell-side liquidity
Customization Options
Toggle intermediate swing highlights
Adjust label sizes
💡 Trading Applications:
Institutional Levels: Identify zones where Asian session liquidity pools exist
Breakout Trading: Get alerted when price breaches Asian session ranges
S/R Flip Zones: Watch how price reacts at these key reference levels
London/NY Open: Use Asian levels for early European session trades
🔧 How to Use:
Set your preferred Asia session hours
Adjust pivot sensitivity (default 1 bar works for most timeframes)
Enable alerts for breakouts if desired
Watch for reactions at the plotted levels

ORB-HL1. Opening Range Detection
Automatically calculates the high and low of the first 15 minutes after the selected session opens.
Supported sessions:
New York (Futures): 08:30–08:45 EST
New York (Equities): 09:30–09:45 EST
London: 03:00–03:15 GMT
Asia: 19:00–19:15 JST
Plots ORB high/low lines for the rest of the day.
2. Breakout Signals
Highlights the first valid breakout above or below the ORB range on the:
5-minute timeframe
15-minute timeframe
Green arrows = breakout up (long)
Red arrows = breakout down (short)
3. 1-Minute Projection
When a breakout is confirmed on a higher timeframe (5m or 15m), a projection label (e.g., "5m", "15m") appears on the 1-minute chart.
Purple label = 5m breakout
Teal label = 15m breakout
Helps you confirm momentum in real time while on the 1-minute chart.
4. Trailing Stop System
Uses ATR to create an adaptive trailing stop after breakout.
Turns green when price is above stop (bullish), red when below (bearish).
Optional Buy / Sell signal labels appear on crossover events.
5. Session High/Low Visualization
Tracks and displays the previous session’s High and Low for:
Tokyo
London
New York
Lines extend into the current session to act as S/R reference.
Labels like "NY High", "Asia Low" are placed at the end of each line.
6. Alerts
Built-in alerts for:
First 5m or 15m breakout (long/short)
Trailing stop Buy/Sell crossover
7. Customization Options
Turn session H/L lines on/off per session
Customize projection visibility
Adjust ATR period and sensitivity
Set how far each session line extends using bar offsets

London/NY Sessions + SMC Levels📜 Indicator Description: London/NY Sessions + SMC Levels
Overview: This indicator highlights the key trading sessions — London, New York, NY Lunch, and Asian Range — providing structured visual guides based on Smart Money Concepts (SMC) and ICT principles.
It dynamically plots:
Session Backgrounds and Boxes for London, NY, Lunch, and Asian sessions
Reference Levels for the High, Low, and Close from today, previous day, or weekly data
Midnight Open line for ICT-style power of three setups
Real-time alerts for session starts, session closes, and important price level crossings
Features:
🕰️ Session Visualization:
Toggle London, NY, Lunch, and Asian session ranges individually, with customizable colors and transparent backgrounds.
🔔 Built-in Alerts:
Alerts for:
Price crossing the previous day's high/low
Price crossing the Midnight Open
Start and end of major sessions (London, NY, Lunch, Asian)
🟩 Reference Levels:
Plot selectable session reference levels:
Today’s intraday High/Low/Close
Previous Day’s High/Low/Close
This Week’s or Previous Week’s levels for broader context.
🌙 Midnight Open:
Track the Midnight New York Open as a reference point for daily bias shifts.
🎯 Customizable Settings:
Choose your session time zones (UTC, New York, London, etc.)
Customize all border colors, background colors, and session hours.
Use Cases:
Identify killzones and optimal trade entry windows for Smart Money Concepts (SMC) and ICT strategies.
Monitor liquidity pool sweeps and session transitions.
Confirm or refine your intraday or swing trading setups by referencing session highs/lows.
Recommended For:
ICT traders
Smart Money Concepts (SMC) practitioners
Forex, indices, crypto, and futures traders focusing on session-based volatility patterns
Anyone wanting a clean, professional session mapping tool
📈
Designed to help you trade with session precision and Smart Money accuracy.
Integrates seamlessly into any ICT, Wyckoff, or Liquidity-based trading approach.

Live SessionsLive sessions plots the highs and lows of the previous for sessions.
It also marks when these are broken by price.
Default Time Frames are:
London Session = "0000-0600", "UTC-4"
New York Session = "0830-1230", "UTC-4"
Asia Session = "1800-0000", "UTC-4"
New York Close Session = "1330-1630", "UTC-4"
Useful for highlighting when price has gone through a previous session high or low and quickly seeing where liquidity still lies.

ICT Bread and Butter Sell-SetupICT Bread and Butter Sell-Setup – TradingView Strategy
Overview:
The ICT Bread and Butter Sell-Setup is an intraday trading strategy designed to capitalize on bearish market conditions. It follows institutional order flow and exploits liquidity patterns within key trading sessions—London, New York, and Asia—to identify high-probability short entries.
Key Components of the Strategy:
🔹 London Open Setup (2:00 AM – 8:20 AM NY Time)
The London session typically sets the initial directional move of the day.
A short-term high often forms before a downward push, establishing the daily high.
🔹 New York Open Kill Zone (8:20 AM – 10:00 AM NY Time)
The New York Judas Swing (a temporary rally above London’s high) creates an opportunity for short entries.
Traders fade this move, anticipating a sell-off targeting liquidity below previous lows.
🔹 London Close Buy Setup (10:30 AM – 1:00 PM NY Time)
If price reaches a higher timeframe discount array, a retracement higher is expected.
A bullish order block or failure swing signals a possible reversal.
The risk is set just below the day’s low, targeting a 20-30% retracement of the daily range.
🔹 Asia Open Sell Setup (7:00 PM – 2:00 AM NY Time)
If institutional order flow remains bearish, a short entry is taken around the 0-GMT Open.
Expect a 15-20 pip decline as the Asian range forms.
Strategy Rules:
📉 Short Entry Conditions:
✅ New York Judas Swing occurs (price moves above London’s high before reversing).
✅ Short entry is triggered when price closes below the open.
✅ Stop-loss is set 10 pips above the session high.
✅ Take-profit targets liquidity zones on higher timeframes.
📈 Long Entry (London Close Reversal):
✅ Price reaches a higher timeframe discount array between 10:30 AM – 1:00 PM NY Time.
✅ A bullish order block confirms the reversal.
✅ Stop-loss is set 10 pips below the day’s low.
✅ Take-profit targets 20-30% of the daily range retracement.
📉 Asia Open Sell Entry:
✅ Price trades slightly above the 0-GMT Open.
✅ Short entry is taken at resistance, targeting a quick 15-20 pip move.
Why Use This Strategy?
🚀 Institutional Order Flow Tracking – Aligns with smart money concepts.
📊 Precise Session Timing – Uses market structure across London, New York, and Asia.
🎯 High-Probability Entries – Focuses on liquidity grabs and engineered stop hunts.
📉 Optimized Risk Management – Defined stop-loss and take-profit levels.
This strategy is ideal for traders looking to trade with institutions, fade liquidity grabs, and capture high-probability short setups during the trading day. 📉🔥

Price Alert Indicator with TableIndicator Description: Price Alert Indicator with Table
The Custom Price Alert Indicator with Table is a TradingView script designed to help traders monitor and react to significant price levels during the Asian and London trading sessions. This indicator provides visual alerts and displays relevant session data in a user-friendly table format.
Key Features:
User-Defined Session Times:
Users can specify the start and end hours for both the Asian (default: 8 AM to 2 PM) and London (default: 2 PM to 8 PM) trading sessions in their local time zone.
This flexibility allows traders from different regions to customize the indicator according to their trading hours.
Real-Time Highs and Lows:
The indicator calculates and tracks the high and low prices for the Asian and London sessions in real-time.
It continuously updates these values as new price data comes in.
Touch Notification Logic:
Alerts are triggered when the price touches the session high or low points.
Notifications are designed to avoid repetition; if the London session touches the Asian high or low, subsequent touches are not alerted until the next trading day.
Interactive Table Display:
A table is presented in the bottom right corner of the chart, showing:
The Asian low and high prices
The London low and high prices
Whether each price level has been touched.
Touched levels are visually highlighted in green, making it easy for traders to identify relevant price actions.
Daily Reset of Notifications:
The notification statuses are reset at the end of the London session each day, preparing for the next day’s trading activity.
Use Cases:
Traders can utilize this indicator to stay informed about pivotal price levels during important trading sessions, aiding in decision-making and strategy development.
The clear visual representation of price levels and touch statuses helps traders quickly assess market conditions.
This indicator is particularly beneficial for day traders and those who focus on price movements around key high and low points during the trading day.

Gap Down Reversal Strategy█ STRATEGY OVERVIEW
The "Gap Down Reversal Strategy" capitalizes on price recovery patterns following bearish gap-down openings. This mean-reversion approach enters long positions on confirmed intraday recoveries and exits when prices breach previous session highs. This strategy is NOT optimized.
█ What is a Gap Down Reversal?
A gap down reversal occurs when:
An instrument opens significantly below its prior session's low (price gap)
Selling pressure exhausts itself during the session
Buyers regain control, pushing price back above the opening level
Creates a candlestick with:
• Open < Prior Session Low (true gap)
• Close > Open (bullish reversal candle)
█ SIGNAL GENERATION
1. LONG ENTRY CONDITION
Previous candle closes BELOW its opening price (bearish candle)
Current session opens BELOW prior candle's low (gap down)
Current candle closes ABOVE its opening price (bullish reversal)
Executes market order at session close
2. EXIT CONDITION
A Sell Signal is generated when the current closing price exceeds the highest high of the previous seven bars (`close > _highest `). This indicates that the price has shown strength, potentially confirming the reversal and prompting the strategy to exit the position.
█ PERFORMANCE OVERVIEW
Ideal Market: High volatility instruments with frequent gaps
Key Risk: False reversals in sustained downtrends
Optimization Tip: Test varying gap thresholds (1-3% ranges)

London/NY Sessions [jpkxyz]London/NY Sessions Indicator Guide
This indicator tracks the forex market's most active trading periods: London session, New York session, and their overlap.
This characteristics of the London and New York trading sessions are well documented and many traders use them as a key element in their trading strategies. It is most relevant in forex trading, however it is to an extend also applicable in cryptocurrencies.
London Session (08:00-16:00 UTC)
Most active trading session (35% of daily forex volume)
Highest trading volume and liquidity
Major price movements and trend development
Significant institutional participation
New York Session (13:00-20:00 UTC)
Second most active trading period
High institutional order flow
Major US economic releases
Significant impact on USD pairs
London/New York Overlap (13:00-16:00 UTC)
The most active period in forex markets:
Maximum market liquidity
Highest daily trading volume
Strong price movements
Tightest spreads
Peak institutional activity
This indicator helps traders:
Visualize key trading sessions
Track session highs and lows
Monitor overlap dynamics
Identify potential support/resistance levels (session highs/lows)

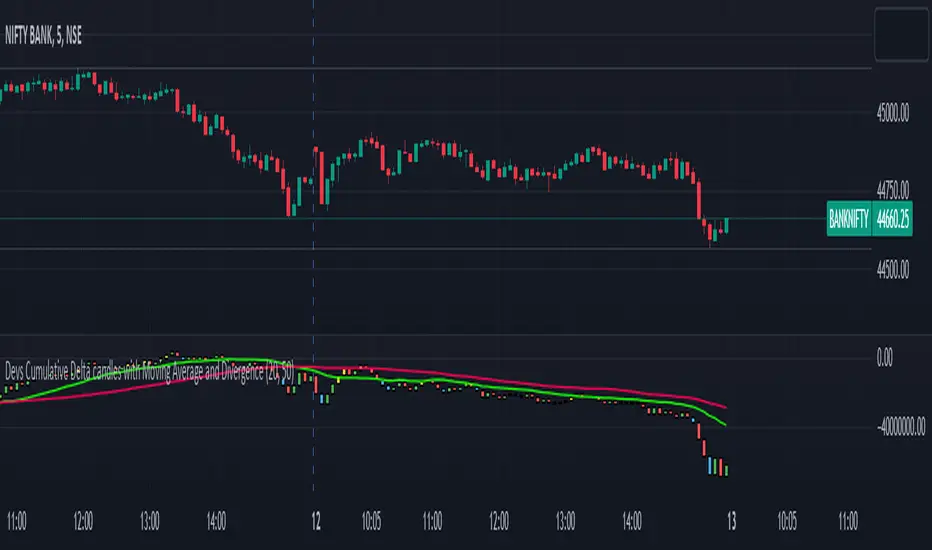
Devs Cumulative Delta candles with Moving Average and DivergenceDELTA = BUY Volume – SELL Volumes
Delta = Positive => Aggressiveness on the Buy side
Delta = Negative => Aggressiveness on the Sell side
If delta is greater than 0 you have more buying than selling pressure. If delta is less than 0, you have more selling than buying pressure.
When there is more Buying than Selling (Delta=Positive), the price candle is Green and when there is more Selling than Buying (Delta=Negative), the price candle is Red. We use delta to understand the relationship between buying or selling pressure and price.
Let’s imagine a price bar that reached the low for the day but delta was actually positive and the bar closed higher than it opened.
In simple terms we can describe this as:
Price made a new low
The bar closed higher
Delta demonstrated more buying than selling : Volume delta is a key metric to understand when making trading decisions based on volume and order flow. However, on its own it can be too much information to interpret quickly when trading in a volatile market.
What are Delta Bars?
Delta Bars is a candlestick representation of Delta. In other words, it has an Open, High (also called Delta Max), Low (also called Delta Min) and Close point in every candle (1min, 5min, 30min etc.)
The Delta Open in every candle is always 0
The Delta Close is the cumulative BUY less cumulative SELL at the close if the candle
The Delta Max is the maximum value of Delta during the candle session (lowest Delta Max possible = 0)
The Delta Min is the minimum value of Delta during the candle session (highest Delta Min possible = 0) The Delta bars are uncorrelated to the Tick Multiplier of the symbol.
Generally you would expect Price to move UP when Delta is positive and Price to move DOWN when Delta is negative. So what happens when the above rule is not followed. We have Divergence
Divergence:
Any two parameters that should be in sync (Price and Delta in this case) towards supporting a particular move (Up or Down) but are in reality not (in sync) form a Divergence
Cumulative volume delta takes the delta values for every bar and successively adds them together to visually provide as seen in the chart.
While volume delta is great for comparing delta bar to bar, cumulative volume delta is useful when determining buying or selling pressure at different price levels such as swing highs or lows. I just gave you a details regarding delta and delta bars.
What details would you see in the indicator??
When you apply this indicator on the chart, you will find the CD(Cumulative delta) candles, which move up and down the way price moves in a chart. Moreover, in case of a divergence, you will find a change in colour of delta candles. If the price is still green but the delta is negative, you will find a bullish divergence, marked with Yellow colour and if the price is red and you have a positive delta, you will have a bearish divergence, marked with blue coloured delta candle. Usually it has been seen that a repeated divergence generally depicts end of a trend or slow down of a trend.
Moreover, I have placed 2 moving averages in the script which you can customize as per your needs. I prefer 20 and 50 day MA for better accuracy as most reversals happen at 20 and 50 day MA.
This indicator works in almost all index, stocks, currencies excepting few where the volume past is invisible. This indicator purely works taking the buying and selling volume into consideration. Sometimes when you change the timeframe in chart, you may have to manually adjust for the display in chart.
ICT Sessions_One Setup for Life [MK]The script plots the High/Low of the following trading sessions:
London - 02:00-05:00
NY AM - 09:30-12:00
New York Lunch - 12:00-13:30
New York PM - 13:30-16:00
Due to the high level of liquidity (resting orders), highs and lows of these sessions may be used as buy/sell areas and also as profit target areas. Typically, buy orders would be initiated below a session low and sell orders would be initiated above a
session high.
The script also plots 'RTH (Regular Trading Hours) Opening Gaps'. The RTH gaps are drawn from the closing price of regular trading at 16:15 (EST) to the open price of regular trading at 09:30 (EST). Gaps can be areas that traders might anticipate to be filled at some time in the future. A gap 'midline' is available if needed and yesterday RTH close line can be shown and extended to the current bar.
This script is simply a means to draw boxes around certain areas/periods on the charts. It is in no way a trading strategy and users should spend much time to study the concept and should also perform extensive back-testing before taking any trades.
By setting the lookback value to a much higher value then the default of 6, users can utilise the script to perform their own backtesting studies.
The above chart shows the default setup of the indicator. Note that the user has to choose how far (in days) to lookback and draw the sessions/gaps.
It is also possible to show the session high//low lines and extend them to the current bar time. If this is used it is advised to keep the lookback period as low as possible to ensure charts stay clean/uncluttered.
All boxes/lines styles/colors are fully customisable.

Take Session High/Low Alert [MsF]Japanese below / 日本語説明は英文の後にあります。
-------------------------
This indicator that displays High/Low lines for each session. The Key Levels of each session can be visually recognized, which is useful for PD Array analysis. You can display the last 3 days. Based on trinity by ICT.
The biggest feature is that the color shape of the line changes when reaching High/Low. Of course, you can also set alerts.
Unreached High/Low lines can be extended to the right. hides all timeframes over 1 hour. (alert is alive)
You can choose 4 sessions. If you only want to use 3 sessions, you can do that by setting the same session time for 2 of the 4 session settings.
About Parameter Settings
Session Time: Please set it to be a 24-hour cycle. You can also specify the time zone. The default is NY time.
Basis/Other color: The first time specified in "Session Time" in this indicator's parameter is the "Basis color". "Other color" is a line other than that.
Enable Time Lines: You can turn on/off the display of vertical lines.
High/Low color: High/Low line setting that has not been reached.
Taken color: High/Low line setting that has already been reached.
Extend Lines: Allows unreached High/Low lines to be extended to the right in the chart.
-------------------------
セッションごとのHigh/Lowをライン表示するインジケーターです。
過去約3日分を表示することができます。
最大の特徴はHigh/Low到達時にラインの色形が変わることです。もちろんアラート設定も可能です。
未到達のHigh/Lowラインは右側に延長することができます。
チャート表示がビジーとなる為、1時間を超える時間足ではすべて非表示とする仕様です。(アラートは生きてます)
セッションは4つ指定できます。
もしセッションを3つのみ使用したい場合は、4つのセッション設定の内2つに同じセッション時間を設定することで実現可能です。
■パラメータ設定
Session Time:24時間周期となるように設定してください。またタイムゾーンが指定できます。デフォルトはNY timeです。
Basis/Other color:パラメータの"Session Time"にて一番最初に指定した時間が基準=Basisとなります。Otherはそれ以外のラインとなります。
Enable Time Lines:垂直ラインの表示ON/OFFが可能です。
High/Low color:未到達のHigh/Lowライン設定となります。
Taken color:到達済みのHigh/Lowライン設定となります。
Extend Lines:未到達のHigh/Lowラインを右に延長できます。

Custom Session highlighterHighlight a custom defined time range on your chart.
handy for if you trade certain hours and just let the indicator highlight that portion of the chart.
Enjoy!

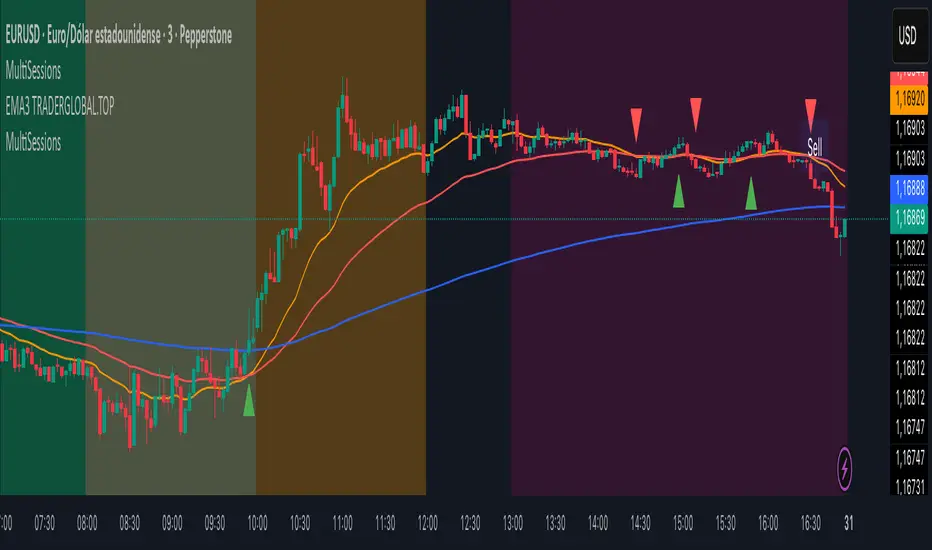
MultiSessions traderglobal.topEste indicador de sesiones está diseñado para traders intradía que desean visualizar con precisión la actividad y la volatilidad característica de cada mercado. Basado en Pine Script v5 y optimizado para la zona horaria “America/New_York”, divide el día en sub-sesiones configurables y resalta sus rangos de precio en tiempo real. En particular, incorpora tres bloques para New York (NY1, NY2, NY3), dos para Londres (LON1, LON2), dos para Tokio (TKO1, TKO2) y mantiene Sídney como sesión opcional. Cada bloque puede activarse o desactivarse de forma independiente y cuenta con su propio color ajustable, lo que permite construir mapas visuales claros para estrategias basadas en horario, solapamientos y micro-estructuras de mercado.
El panel de inputs incluye la opción “Activate High/Low View”. Cuando está activada, el indicador calcula de manera incremental el mínimo y máximo de cada sub-sesión y sombrea el área entre ambos con fill, proporcionando una referencia inmediata del rango intrasesión (útil para medir compresión/expansión y posibles rompimientos). Cuando está desactivada, emplea un simple bgcolor por bloque, ideal para traders que prefieren un gráfico más limpio y solo desean distinguir visualmente los tramos horarios.
La lógica central utiliza dos funciones auxiliares: is_session(sess), que detecta si la vela actual pertenece a un tramo horario concreto, e is_newbar(sess), que determina el inicio de una nueva barra de referencia según la resolución elegida (D, W o M). Gracias a esta combinación, en cada sub-sesión el indicador reinicia sus contadores de alto y bajo al comenzar el período y los actualiza vela a vela mientras el bloque siga activo. Este enfoque evita mezclas de datos entre sesiones y asegura que el rango que se muestra corresponda estrictamente al segmento horario configurado.
Los horarios por defecto están pensados para Forex y contemplan casos que cruzan medianoche (por ejemplo, Tokio 2 y Sídney). Pine Script admite rangos como 2200-0200; no obstante, si tu bróker o la zona horaria del gráfico generan un sombreado parcial, basta con dividir el tramo en dos: 2200-2359 y 0000-0200. Asimismo, cada input.session incluye el patrón :1234567 para habilitar los siete días; puedes restringir días según tu operativa.
En cuanto al uso práctico, el indicador facilita identificar: (1) la estructura del rango por sub-sesión (útil para estrategias de breakout/mean-reversion), (2) los solapamientos entre Londres y New York, donde suele concentrarse la liquidez, y (3) períodos de menor volatilidad (tramos tardíos de Asia o previos a noticias). El color independiente por bloque te permite codificar visualmente la importancia o tu plan de trading (por ejemplo, tonos más intensos en ventanas de alta probabilidad).
Finalmente, su diseño modular hace sencilla la personalización: puedes ajustar colores, activar/desactivar bloques, cambiar horarios y modificar la resolución de reseteo del rango. Como posible mejora, se pueden añadir alertas de ruptura de máximos/mínimos de sub-sesión o etiquetas con la altura del rango (pips) al cierre. Este indicador no sustituye el juicio del trader ni constituye recomendación financiera, pero ofrece una base visual robusta para integrar el factor tiempo en la toma de decisiones.
This sessions indicator is built for intraday traders who want a precise, time-aware view of market activity and typical volatility patterns across the day. Written in Pine Script v5 and optimized for the “America/New_York” timezone, it divides the trading day into configurable sub-sessions and highlights their price ranges in real time. Specifically, it provides three blocks for New York (NY1, NY2, NY3), two for London (LON1, LON2), two for Tokyo (TKO1, TKO2), and keeps Sydney as an optional session. Each block can be enabled or disabled independently and comes with its own adjustable color, letting you build clear visual maps for time-based strategies, overlaps, and microstructure nuances.
In the inputs panel you’ll find the “Activate High/Low View” option. When enabled, the indicator incrementally computes each sub-session’s low and high and shades the area between them with fill, giving you an immediate reference to the intra-session range (useful for gauging compression/expansion and potential breakouts). When disabled, it switches to a clean bgcolor background by block—ideal if you prefer a minimal chart and simply want to distinguish time windows at a glance.
The core logic relies on two helper functions: is_session(sess), which detects whether the current bar falls within a given time window, and is_newbar(sess), which identifies the start of a new reference bar according to your chosen reset resolution (D, W, or M). With this combination, each sub-session resets its high/low at the beginning of the period and updates them bar by bar while the block remains active. This prevents cross-contamination between sessions and ensures the range you see belongs strictly to the configured segment.
Default hours are suited to Forex and include segments that cross midnight (e.g., Tokyo 2 and Sydney). Pine Script supports ranges like 2200-0200; however, if your broker or chart timezone causes partial shading, simply split the segment into two: 2200-2359 and 0000-0200. Each input.session uses the :1234567 suffix to enable all seven days; you can easily restrict days to match your plan.
Practically speaking, the indicator helps you identify: (1) range structure by sub-session (great for breakout or mean-reversion frameworks), (2) overlaps between London and New York, where liquidity and directional moves often concentrate, and (3) lower-volatility windows (late Asia or pre-news lulls). Independent colors per block let you visually encode priority or your trading plan (for example, richer tones in high-probability windows).
Thanks to its modular design, customization is straightforward: adjust colors, toggle blocks, change hours, and tweak the range-reset resolution to suit your routine. As a natural extension, you can add alerts for sub-session high/low breakouts or labels that display the range height (in pips) at session close. While no indicator replaces trader judgment or constitutes financial advice, this tool offers a robust visual foundation for incorporating the time factor directly into your decision-making, helping you contextualize price action within the rhythm of global trading sessions.