Session High/Low/PD Selector with Realtime AlertsThis indicator displays key intraday and multi-day price levels directly on the chart for short-term traders. It includes:
Session Highs and Lows for Asia, London, and New York sessions
→ Automatically plots each completed session’s high and low, with lines extended to the right and labeled.
Previous Day High, Low, and Close
→ Draws levels from the prior daily candle with adjustable colors and labels.
Previous Week High and Low
→ Weekly key levels are plotted just like daily ones.
Real-time Alerts
→ Optional alerts trigger immediately when price touches or breaks any session, PDH/PDL, or PWH/PWL levels.
Fully Customizable
→ Toggle sessions, previous day/week levels, label positions, and colors per user preference.
Wyszukaj w skryptach "session high"

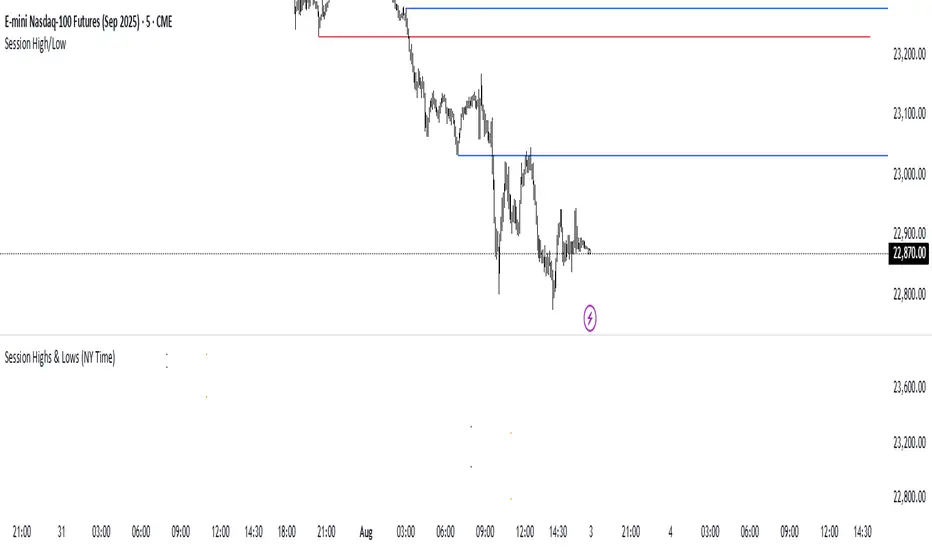
Session Highs & Lows (NY Time)Marks out Asian session high and low, and London session high and low, this makes it easier for you to easily marks out important highs and lows on the chart when trading.
Session High/Low Rays - Last 3 DaysMarks the Tokyo, London and NYC sessions High and Lows from past 3 days upon session close.

Session Highs & Lows - Pinhead TradesMarks out the session highs and lows + Sweeps
*Very good for looking for reversal entry's targeting opposing session liquidity

Session High and Lowmarks out previous NY session high/low, asian and london session high/low and updates automatically. Perfect indicator for overnight liquidity.

Session Highs and LowsShows the current and previous session highs and lows for the New York, London and Asian sessions

Sessions High & LowA tool to save time while trading Forex for example.
Ability to turn on/off up to 4 sessions with user defined range
Separate alerts for a new high/low for each session

Custom Trading Session HighlighterThe Custom Trading Session Highlighter is a simple yet powerful indicator that allows you to visualize specific trading sessions on your chart by highlighting the background within the specified time range. This indicator can be helpful for traders who want to focus on specific market hours or analyze the market behavior during certain time periods.
Features:
>Customizable start and end times: Input your desired trading session start and end times using the format "HHMM" (e.g., "0930" for 9:30 AM). The indicator allows you to select the time range in 30-minute intervals.
>Trading session background color: The specified trading session will be highlighted with a semi-transparent green color, making it easy to differentiate the session from the rest of the chart.
>Overlay: The indicator overlays on the price chart, so it doesn't take up any additional space on your screen.
How to use:
>Add the Custom Trading Session Highlighter to your chart.
>Configure the start and end times of the session you want to highlight using the input fields in the indicator settings.
>Observe the highlighted trading session on your chart to analyze market behavior within that specific time range.

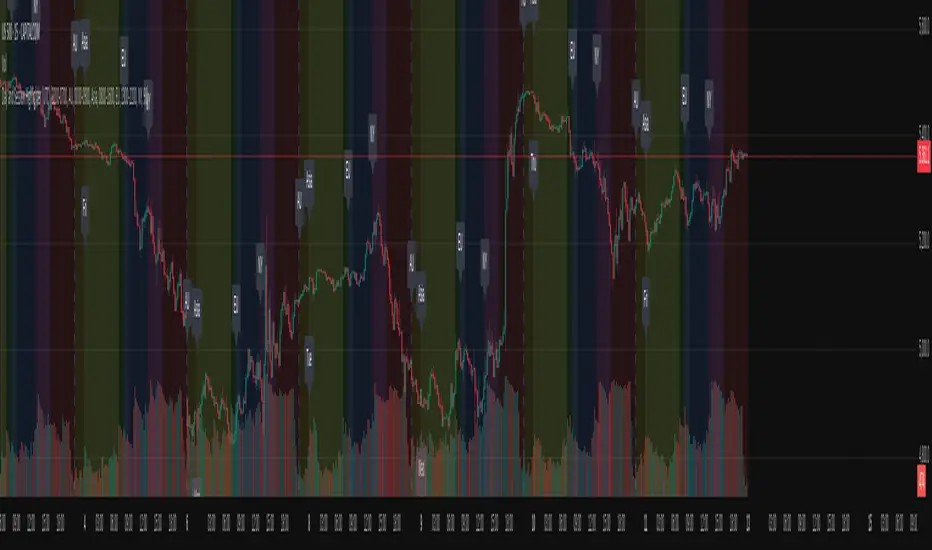
Trading Sessions Highs/Lows | InvrsROBINHOODTrading Sessions Highs/Lows | InvrsROBINHOOD
🚀 A powerful indicator for tracking key trading sessions and the highs and lows of each session!
📌 Description
The Trading Sessions Highs/Lows indicator visually marks the most critical trading sessions—Asia, London, and New York—using small colored dots at the bottom of the candle. It also tracks and plots the highs and lows of each session, along with the Daily Open and Weekly Open levels.
This tool is designed to help traders identify session-based liquidity zones, price reactions, and potential trade setups with minimal chart clutter.
Key Features:
✅ Session markers (Asia, London, NY AM, NY Lunch, NY PM) plotted as small dots
✅ Plots session highs and lows for market structure insights
✅ Daily Open line for intraday reference
✅ Weekly Open line for higher timeframe bias
✅ Alerts for session high/low breaks to capture momentum shifts
✅ User-defined UTC offset for global traders
✅ Customizable session colors for personal preference
📖 How to Use the Indicator
1️⃣ Understanding the Sessions
Asia Session (Yellow Dot) → Marks liquidity buildup & pre-London moves
London Session (Blue Dot) → Strong volatility, breakout opportunities
New York AM Session (Green Dot) → Major trends & institutional participation
New York Lunch (Red Dot) → Low volume, ranging market
New York PM Session (Dark Green Dot) → End-of-day movements & reversals
2️⃣ Session Highs & Lows for Market Structure
Session Highs can act as resistance or breakout points.
Session Lows can act as support or stop-hunt zones.
Break of a session high/low with volume may indicate continuation or reversal.
3️⃣ Using the Daily & Weekly Open
The Daily Open (Black Line) helps gauge the intraday trend.
Above Daily Open → Bearish Bias
Below Daily Open → Bullish Bias
The Weekly Open (Red Line) sets the higher timeframe directional bias.
4️⃣ Alerts for Breakouts
The indicator will trigger alerts when price breaks session highs or lows.
Useful for setting stop-losses, breakout trades, and risk management.
💡 Why This Indicator is Important for Beginners
1️⃣ Avoids Overtrading:
Many beginners trade in low-volume periods (NY Lunch, Asia session) and get stuck in choppy price action.
This indicator highlights when volatility is high so traders focus on better opportunities.
2️⃣ Session-Based Liquidity Traps:
Market makers often run stops at session highs/lows before reversing.
Watching session breaks prevents traders from falling into liquidity grabs.
3️⃣ Reduces Emotional Trading:
If price is above the Daily Open, a beginner shouldn’t look for shorts.
If price is below a key session low, it may signal a fake breakout.
4️⃣ Aligns with Institutional Trading:
Smart money traders use session highs/lows to set stop hunts & reversals.
Beginners can use this indicator to spot these zones before entering trades.
🛡️ How to Mitigate Risk with This Indicator
✅ Wait for Confirmations – Don’t trade blindly at session highs/lows. Look for wicks, rejections, or break/retests.
✅ Use Stop-Loss Above/Below Session Levels – If you’re going long, set SL below a session low. If short, set SL above a session high.
✅ Watch Volume & News Events – Breakouts without strong volume or news may be fake moves.
✅ Combine with Other Strategies – Use price action, trendlines, or EMAs with this indicator for higher probability trades.
✅ Use the Weekly Open for Trend Bias – If price stays below the Weekly Open, avoid bullish setups unless key support holds.
🎯 Who is This Indicator For?
📌 Beginners who need clear session-based trading levels.
📌 Day traders & scalpers looking to refine their intraday setups.
📌 Smart money traders using liquidity concepts.
📌 Swing traders tracking higher timeframe momentum shifts.
🚀 Final Thoughts
This indicator is an essential tool for traders who want to understand market structure, liquidity, and volatility cycles. Whether you’re trading forex, stocks, or crypto, it helps you stay on the right side of the market and avoid unnecessary risks.
🔹 Set it up, customize your colors, define your UTC offset, and start trading smarter today! 🏆📈

Quantura - Session High/LowIntroduction
“Quantura – Session High/Low” is a professional-grade session mapping indicator that automatically identifies and visualizes the highs, lows, and ranges of key global trading sessions — London, New York, and Asia. It helps traders understand when and where liquidity tends to accumulate, allowing for better market structure analysis and session-based strategy alignment.
Originality & Value
This indicator unifies the three most influential global sessions into a single, adaptive visualization tool. Unlike typical session indicators, it dynamically updates live session highs and lows in real time while marking session boundaries and transitions. Its multi-session management system allows for immediate recognition of overlapping liquidity zones — a crucial feature for institutional and intraday traders.
The value and originality come from:
Real-time tracking of session highs, lows, and developing ranges.
Simultaneous visualization of multiple global sessions.
Optional vertical range lines for clearer visual segmentation.
Customizable session times, colors, and time zone offset for global accuracy.
Automatically extending and updating lines as each session progresses.
Functionality & Core Logic
Detects the start and end of each trading session (London, New York, Asia) using built-in time logic and user-defined UTC offsets.
Initializes session-specific high and low variables at the start of each new session.
Continuously updates session high/low levels as new candles form.
Draws color-coded horizontal lines for each session’s high and low.
Optionally adds vertical dotted lines to visually connect session range extremes.
Locks each session’s range once it ends, preserving historical structure for review.
Parameters & Customization
New York Session: Enable/disable, customize time (default 15:30–21:30), and set color.
London Session: Enable/disable, customize time (default 09:00–16:30), and set color.
Asia Session: Enable/disable, customize time (default 02:30–08:00), and set color.
Vertical Line: Toggle dotted vertical lines connecting session high and low levels.
UTC Offset: Adjust session timing to align with your chart’s local time zone.
Visualization & Display
Each session is color-coded for quick identification (default: blue for London, red for New York, green for Asia).
Horizontal lines track evolving session highs and lows in real time.
Once a session closes, the lines remain fixed to mark historical range boundaries.
Vertical dotted lines (optional) visually connect the session’s high and low for clarity.
Supports full overlay display without interfering with other technical indicators.
Use Cases
Identify liquidity zones and range extremes formed during active trading sessions.
Observe session overlaps (London–New York) to anticipate volatility spikes.
Combine with volume or market structure tools for session-based confluence.
Track how price interacts with prior session highs/lows to detect potential reversals.
Analyze session-specific performance patterns for algorithmic or discretionary systems.
Limitations & Recommendations
The indicator is designed for intraday analysis and may not provide meaningful output on daily or higher timeframes.
Adjust session times and UTC offset based on your broker’s or exchange’s timezone.
Does not provide trading signals — it visualizes session structure only.
Combine with liquidity and volatility indicators for full contextual understanding.
Markets & Timeframes
Compatible with all asset classes — including crypto, forex, indices, and commodities — and optimized for intraday timeframes (1m–4h). Particularly useful for traders analyzing session overlaps and volatility transitions.
Author & Access
Developed 100% by Quantura. Published as a Open-source script indicator. Access is free.
Compliance Note
This description fully complies with TradingView’s Script Publishing Rules and House Rules . It provides a detailed explanation of functionality, parameters, and realistic use cases without making any performance or predictive claims.

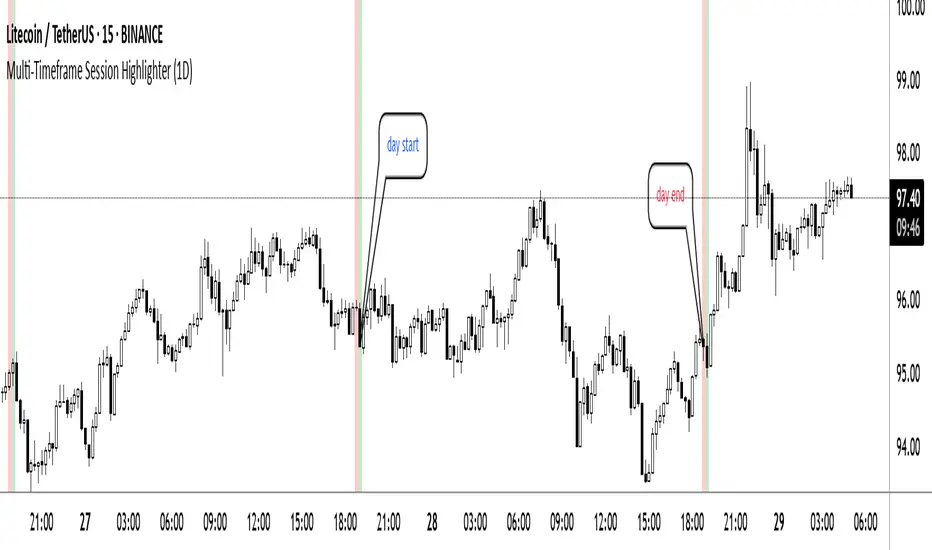
Multi-Timeframe Session HighlighterWhat is the Multi-Timeframe Session Highlighter?
It’s a simple Pine Script indicator that paints two special candles on your chart, no matter what timeframe you’re looking at. Think of it as a highlighter pen for session starts and ends—can be used for session-based strategies or just keeping an eye on key turning points.
How it works:
Green Bar (Session Open): Marks the exact bar when your chosen higher-timeframe session kicks off. If you select “4H,” on the indicator, you’ll see green on every 4-hour open, even if you’re staring at a 15-minute chart.
Red Bar (Session Close): Highlights the very last lower-timeframe candle immediately before that session wraps up. So on a 1H chart with “Daily” selected, you’ll get a red band on the 23:00 hour before the new daily bar at midnight.
Customizable: Pick your own colors and transparency level to match your chart theme.
Getting started:
Add the indicator to your chart.
In the inputs, select the session timeframe (for example, “240” for 4H or “D” for daily).
Choose your favorite green and red shades.
That’s it.
RTH Session Highs & LowsA Pine Script indicator designed to track and plot the Regular Trading Hours (RTH) session highs and lows on a chart, typically for U.S. equity markets (e.g., S&P 500, Nasdaq, etc.), which operate from 9:30 AM to 4:00 PM Eastern Time.
Session High & Low Lines:
During the RTH session, the indicator draws green and red horizontal lines that represent the highest and lowest price seen so far within that trading session.
These levels help traders identify intraday support (low) and resistance (high) levels.
New High/Low Markers:
Small triangle markers are placed:
Above the bar when a new intraday high is made (green triangle).
Below the bar when a new intraday low is made (red triangle).
This visually flags when momentum may be building or reversing.
Intraday Strategy Support:
Use the session high/low as dynamic support/resistance for scalping or breakout strategies.
For example:
Breakouts above session highs may indicate bullish strength.
Breakdowns below session lows may suggest bearish momentum.
Mean Reversion Tactics:
Prices approaching these lines and then rejecting can be used for mean reversion setups.
Combine with volume or candlestick patterns for confirmation.
Risk Management:
Set stops or targets relative to session highs/lows.
For instance, use session high as a stop-loss level in a short position.
Volatility Gauge:
Tracking how frequently new highs/lows are formed can help assess intraday volatility or range expansion.
Complement with Indicators:
Combine this with our "McGinley Dynamic Channel with Directional Shading" indicator or our "EMA Crossover with Shading" indicator to add context to breakouts or rejections.

GT3_Trades Sessions Highs & LowsThis indicator automatically identifies and displays the session highs and lows for the three major global market sessions: Asia, London, and New York. It is designed for intraday traders who rely on session-based structure, liquidity levels, and volatility windows. The script dynamically tracks and plots the highest and lowest price reached during each session and extends these levels forward on the chart for strong visual clarity.
Key Features
Session-Based Highs & Lows
Calculates and updates the high and low for each session (Asia, London, New York) in real time as price develops within the session window.
Fully Customizable Display Options
Traders can individually toggle the visibility of each session’s high and low levels.
Line colors, styles (Solid, Dashed, Dotted), and thickness are also user-configurable.
Accurate Timezone Handling
Session times are defined using user-selected timezone settings (default UTC+3), ensuring session boundaries match the trader’s desired market timing.
Automatic Daily Reset
At the start of each new trading day, the indicator clears the previous levels and begins tracking fresh highs and lows for the new day.
Dynamic Line Drawing
Each level is plotted using real Pine Script line objects, which update automatically as new highs or lows form. Once created, each line extends forward to the right—providing clear, persistent references for potential liquidity zones, breakouts, and reversions.
Efficient Tracking Logic
The script keeps track of the bar index where each high/low occurs and updates the line endpoints in real time. Historical levels are not reused, ensuring clean, uncluttered visuals.
How It Helps Traders
Identifies liquidity pools and sweep areas based on session extremes.
Highlights intraday structure shifts when price breaks or respects session highs/lows.
Provides a clear overview of volatility cycles across the global trading day.
Helps detect potential reversal or continuation setups when interacting with session boundaries.
Ideal For
Intraday and scalping strategies
ICT-based session analysis
Liquidity, sweep, and FVG traders
Forex, indices, crypto, and commodities

Context Bundle | VWAP / EMA / Session HighLow (v6)
📌 0DTE Context Bundle (v6)
**VWAP • EMA Cloud • Session High/Low (NY / London / Asia)
The **0DTE Context Bundle** is a *decision-making overlay*, not a signal spam indicator.
It’s designed to help traders clearly see **value, trend, and liquidity levels** across **New York, London, and Asia sessions** — all in one clean, customizable tool.
Built for **NQ, ES, Gold, and FX pairs**, with a focus on **5–15-minute execution charts**.
---
## 🔹 What This Indicator Shows
### ✅ VWAP + ATR Bands
* Session VWAP (fair value)
* ATR-based extension bands (1x / 2x)
* Helps identify **overextension, mean reversion zones, and trend pullbacks**
### ✅ EMA 9 / 21 Cloud
* Visual trend and momentum filter
* Custom colors + opacity
* Identifies **trend continuation vs chop**
### ✅ Session High / Low Levels
* **New York RTH**
* **London**
* **Asia (midnight-safe)**
* Optional previous session highs/lows
* Adjustable line styles, widths, colors, and extensions
### ✅ Anchored VWAP (Optional)
* Reset by:
* Daily
* NY session start
* London session start
* Asia session start
* Useful for tracking **session-specific value shifts**
---
## 🔹 How Traders Use It
This indicator is meant to answer:
* *Are we trading at value or extension?*
* *Is the market trending or rotating?*
* *Where is liquidity likely sitting right now?*
Common use cases:
* Trend pullbacks into VWAP or EMA cloud
* Reversal setups at session highs/lows
* Session breakout + retest confirmation
* Overnight context for London and Asia sessions
---
## 🔹 Customization & Flexibility
Every component can be toggled and styled:
* Colors, widths, line styles
* Cloud up/down colors + opacity
* Session visibility and extensions
* VWAP band multipliers and ATR length
Members can adapt it to **their own style**, market, and timeframe.
---
## ⚠️ Disclaimer
This indicator is provided for **educational and informational purposes only**.
It does **not** provide financial advice or trade signals.
Always manage risk and confirm entries with your own strategy.

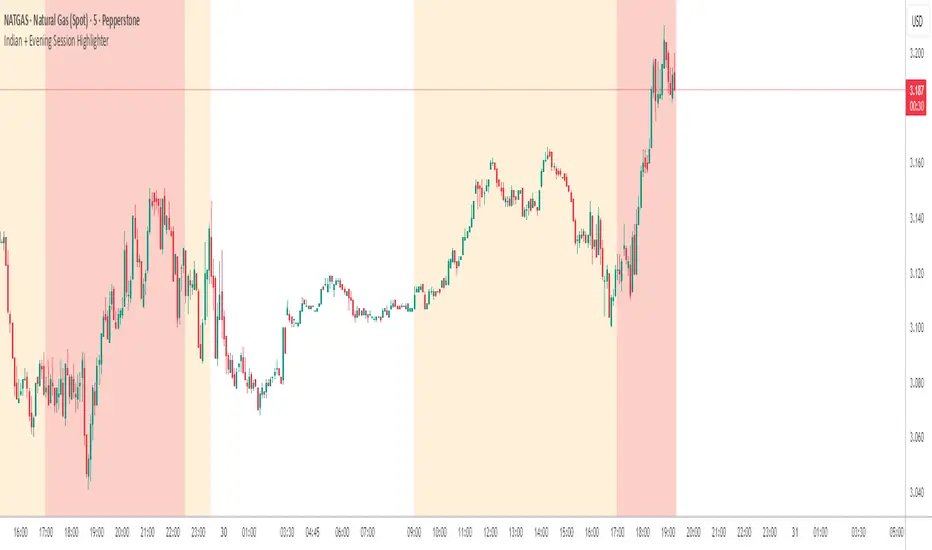
Indian + Evening Session HighlighterThis indicator visually highlights two key trading windows for Indian instruments according to IST:
Indian Session: 9:00 AM to 11:30 PM IST is shaded light orange on the chart, representing the main domestic trading hours for stocks, indices, commodities, or derivatives.
Evening Session: 5:00 PM to 10:30 PM IST is shaded light red, marking the commonly followed evening window, which often captures the impact of US and European market movements.
The indicator automatically overlays these session backgrounds on your chart, helping you quickly identify when price action occurs during India’s core and evening trade windows. This allows traders to focus on strategies specific to these time intervals, identify session-based volatility, and avoid trading during less active periods. If the evening session overlaps with the Indian session, the colors are layered for visual clarity.
It is ideal for intraday traders, option strategists, and anyone monitoring Indian market rhythms or US-linked volatility impacts on Indian assets. No inputs are required; simply apply the script and view distinct session highlights for improved timing and decision making.
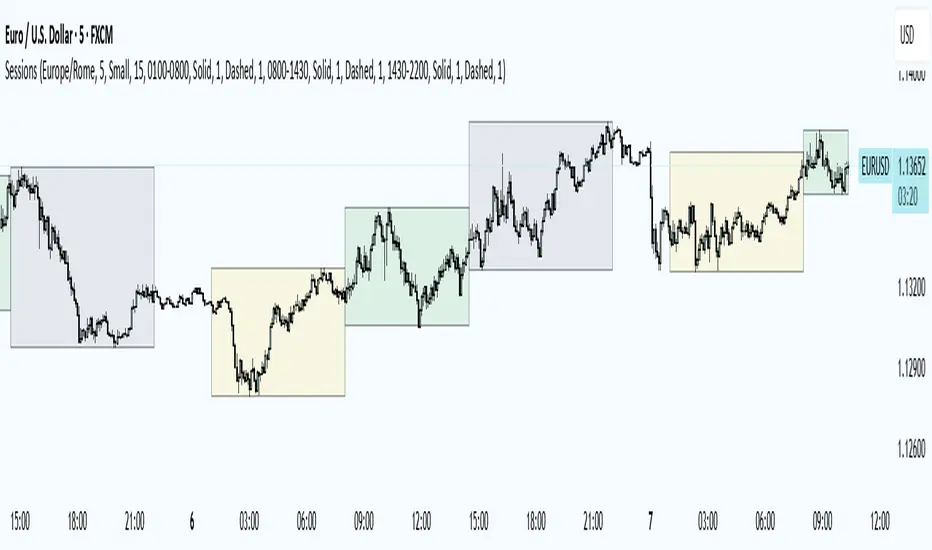
Trading Sessions
Trading Sessions
Highlights the Asia, London, and New York trading sessions with dynamic High-Low boxes.
General
Timezone : select your reference zone (e.g. Exchange, UTC, Europe/Rome, America/New_York).
Extend Session High/Low : extend the High/Low lines to the last candle.
Extend Lines (bars) : number of bars to extend lines beyond the last candle (0–100, default 15).
Show High/Low Labels : display labels for the High/Low levels.
Show Mitigated Levels : also show mitigated (broken) levels.
Show Only Recent Levels : filter levels from the last N days.
Number of Recent Days : sets how many days are considered “recent” (1–30).
Show Debug Info : enable a panel with current time, session status, and active filters.
Sessions
Asia , London , New York : enable or disable each session.
Session Time : set the start/end times with the time picker.
Box Color : choose a semi-transparent highlight color for each session.
Line Style & Width : customize style (Solid, Dotted, Dashed) and width of current and past High/Low lines.
Text Size : select the label text size (Tiny, Small, Normal, Large).
Show Only Recent Levels – filters High/Low lines to show only those from the last Number of Recent Days .
Number of Recent Days – sets how many days are considered “recent” for the filter.
Show Mitigated Levels – enables display of broken levels; otherwise only active levels remain visible.
Show High/Low Labels – toggles text labels at the ends of lines on or off.
Show Debug Info – displays a floating panel showing:
Current time in the selected timezone
On/Off status of Asia, London, NY sessions
Active filters (recent days, mitigated levels)
Line style settings for each session
Key Benefits
Visualize session-specific volatility and potential breakouts.
No historical limit: scroll back through any past sessions.
Filter and extend High/Low levels for precise price context.
Fully customize to fit any chart layout.
Ideal For
Intraday traders who need clear session boundaries and price level context.
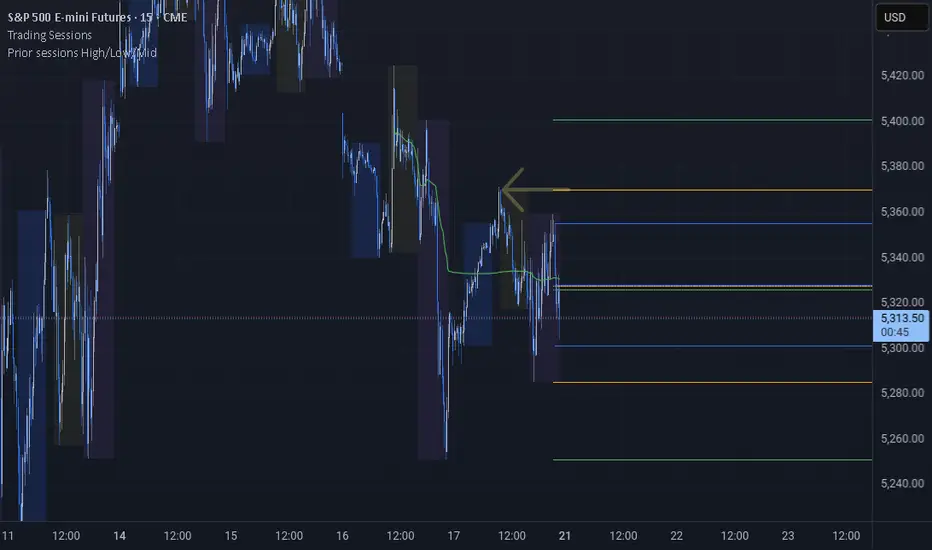
Prior sessions High/Low/MidThis indicator highlights the High, Low, and Midpoint of the most recently completed trading sessions. It helps traders visualize key price levels from the previous session that often act as support, resistance, or reaction zones.
It draws horizontal lines for the high and low of the last completed session, as well as the midpoint, which is calculated as the average of the high and low. These lines extend to the right side of the chart, remaining visible as reference levels throughout the day.
You can independently enable or disable the Tokyo, London, and New York sessions depending on your preferences. Each session has adjustable start and end times, as well as time zone settings, so you can align them accurately with your trading strategy.
This indicator is particularly useful for intraday and swing traders who use session-based levels to define market structure, bias, or areas of interest. Session highs and lows often align with institutional activity and can be key turning points in price action.
Please note that this script is designed to be used only on intraday timeframes such as 1-minute to 4-hour charts. It will not function on daily or higher timeframes.
Day and Session Highlighter (UTC)Day and Session Highlighter (UTC Forced)", is designed to overlay your chart and display both session background colors and informative labels at the start of each trading session—all calculated in UTC. The script targets four distinct sessions: AU (Australia), Asia (Singapore/Hong Kong/JP), Europe, and New York. In addition to session highlighting, it displays labels that combine the UTC day-of‑week and the session’s starting time. All elements are configurable via on-screen toggles.
FX Session High/Low Bands - Last 5 EST Days
FX Session High/Low Bands - Last 5 Days
Description:
This indicator plots horizontal bands representing the high and low price levels from the major forex trading sessions over the last 5 days. It helps traders identify key support and resistance zones based on recent session activity.
Features:
Multiple Session Tracking: Displays high/low levels for major FX sessions:
Asian Session (Tokyo)
European Session (London)
US Session (New York)
5-Day Lookback: Captures the highest high and lowest low from each session over the previous 5 trading days
Visual Bands: Clear horizontal lines or filled zones showing session boundaries
Dynamic Updates: Automatically recalculates as new session data becomes available
How to Use:
Support/Resistance: Previous session highs/lows often act as key price levels
Breakout Trading: Watch for price breaking above/below session bands
Range Trading: Trade within the bands during consolidation periods
Session Overlap: Pay attention to multiple session bands converging
Ideal For:
Forex day traders
Session-based trading strategies
Support/resistance identification
Multi-timeframe analysis

Last 10 Sessions: High, Low, Pivot, GapLast 10 Sessions: High, Low, Pivot, Gap
This indicator highlights the most important price levels from the last 10 completed trading sessions to help intraday and swing traders quickly spot potential support, resistance, and price reaction zones.
Key Features:
Previous Highs and Lows : Visualize the high and low from each of the past 10 sessions. These are the most commonly tested breakout and reversal points for day trading.
Session Pivots: The classic pivot formula ((High + Low + Close) / 3) for each of the last 10 sessions, often acting as a market “equilibrium” or intraday magnet.
Gaps: Displays the difference between each day’s open and the previous session’s close (“gap”), showing sentiment shifts and possible gap fill targets.
Clean, Faded Visuals: All lines and labels are subtly faded so your chart remains clear and uncluttered, with each level labeled by how many sessions ago it occurred.
Full Customization: Instantly toggle any level type (High, Low, Pivot, Gap) ON/OFF in settings, extend lines to the right, and adjust their forward length.
Bulletproof Logic: Never throws runtime errors. Lines and labels only display when valid data is present.
How to Use:
Use recent highs/lows for breakout, breakdown, or mean reversion trades.
Spot where multiple levels from past sessions cluster together for high-probability reversal or breakout areas.
Watch pivots for intraday bias, and gaps for sentiment and possible fill plays.
Perfect for all intraday timeframes.
If you want a powerful yet minimal map of where price is most likely to react, this indicator is for you!
Developed by

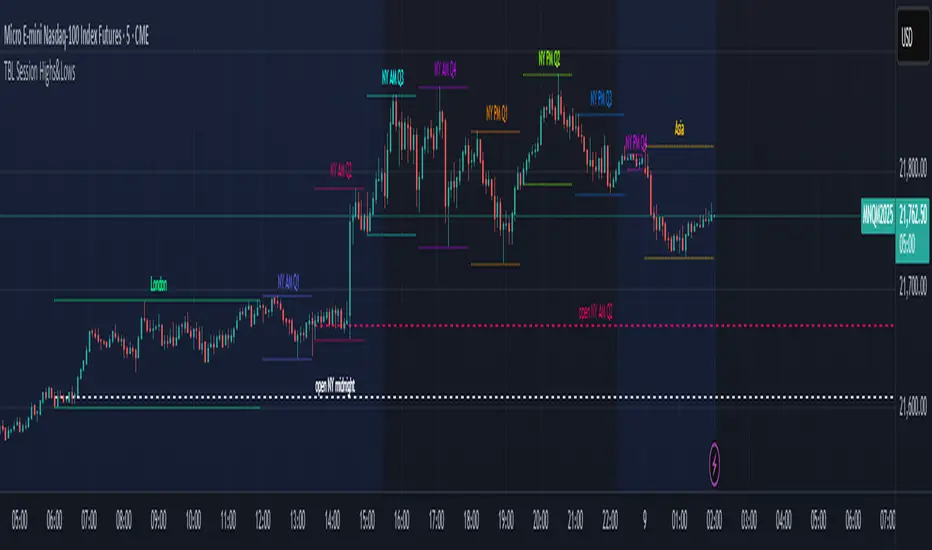
TBL Session Highs&LowsBL Session Highs&Lows is a versatile intraday tool that highlights key price levels within up to 11 configurable trading sessions. It displays session highs, lows, and optional open levels, with customizable lines, labels, and boxes — perfect for tracking price behavior across sessions like Asia, London, and New York.
🔧 Key Features
🧩 Up to 11 fully customizable sessions
📍 High, Low, and Open lines with adjustable color, style, and width
🧱 Optional boxes showing session range, dynamically colored based on price movement
🏷️ Session labels for visual orientation
🔁 Extendable lines to project levels beyond the session
🌐 Custom time zone support for each session
🎨 Fully customizable visuals for clear chart integration
📈 Designed for:
Intraday session tracking (e.g., Asia, London, NY)
Session-based strategies (breakouts, reversals, liquidity zones)
Open-level reference (e.g., NY open)
Visual separation of trading periods
Example Scenarios:
🟦 "Asia" session: 18:00–00:00 GMT-4 with full box and lines
🟩 "London" session: 00:00–06:00 with high/low lines only
🟥 Segmented NY sessions (Q1–Q4) for fine-grained intraday tracking
✅ Tip: Enable only the sessions you need to keep your chart clean and focused.
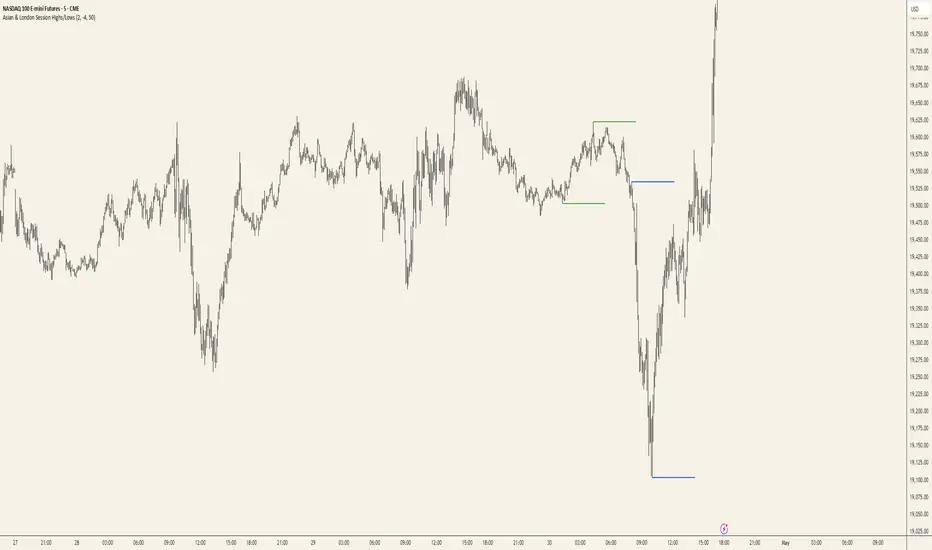
Asian & London Session Highs/LowsAsian & London Session Highs/Lows with Extendable Lines
This TradingView script automatically marks the highs and lows of the Asian and London trading sessions for the most recent day, allowing traders to identify key levels during these active periods. The lines representing the high and low of each session are drawn at the exact price point where the high/low occurred, and they extend to the right for a customizable number of bars, helping to visualize how the price reacts to these key levels after the session ends.
Key Features:
Session High/Low Tracking: Automatically tracks the highest and lowest points for the Asian and London sessions.
Extendable Lines: Lines start at the exact bar where the high/low occurred and can be extended to the right for a specified number of bars.
Timezone Adjustment: Allows you to input a timezone offset to adjust session times based on your local time or desired market time zone.
Customizable Colors & Line Thickness: Adjust the color and thickness of the session high and low lines to suit your visual preferences.
Clear & Precise Levels: Helps identify important support and resistance levels, making it easier to spot market reactions around session highs and lows.
This indicator is perfect for day traders and those looking to trade during specific market hours, offering clear visual markers of session boundaries and critical price levels.