BEST ABCD Pattern StrategyHello traders
This is the strategy version of this script
I - Concept
I present to you, ladies and gentlemen, the first screener for harmonic patterns.
Starting with an ACBD pattern screener this time!!
I used the calculations from Ricardo Santo's script
In short, he's using fractals (regular or Bill Williams ) for the pattern calculations. A masterpiece !!!
II - Definitions
The ABCD pattern ( AB=CD ) is one of the classic chart patterns which is repeated over and over again.
The ABCD pattern shows perfect harmony between price and time.
The Williams Fractal is an indicator, developed by Bill Williams, that aims to detect reversal points (highs and lows) and marks them with arrows.
Up fractals and down fractals have specific shapes. The Williams Fractal indicator helps users determine in which direction price will develop
💎Strategy filters💎
I included some cool backtest filters:
- flexible take profit in USD value (plotted in blue)
- flexible stop loss in USD value (plotted in red)
The take profit and stop loss should work with Forex/FX pairs as well
All the BEST
Dave
Wyszukaj w skryptach "screener"

WoAlgo Premium v3.0
WoAlgo Premium v3.0 - Smart Money Analysis
Overview
** WoAlgo Premium v3.0 ** is an advanced technical analysis indicator designed for educational purposes. This tool combines Smart Money Concepts with multi-factor confluence analysis to help traders identify potential market opportunities across multiple timeframes.
The indicator integrates market structure analysis, order flow concepts, and technical momentum indicators into a comprehensive dashboard system. It is designed to assist traders in understanding institutional trading patterns and market dynamics through visual analysis tools.
### What It Does
This indicator provides:
**1. Smart Money Concepts Analysis**
- Market structure identification (Break of Structure and Change of Character patterns)
- Order block detection with volume confirmation
- Fair value gap recognition
- Liquidity zone mapping (equal highs and lows)
- Premium and discount zone calculations
**2. Multi-Factor Confluence Scoring**
The indicator calculates a proprietary confluence score (0-100) based on five key components:
- Price action analysis (30% weight)
- Volume confirmation (20% weight)
- Momentum indicators (25% weight)
- Trend strength measurement (15% weight)
- Money flow analysis (10% weight)
**3. Multi-Timeframe Analysis**
- Scans 5 different timeframes (5M, 15M, 1H, 4H, Daily)
- Calculates alignment percentage across timeframes
- Displays trend and structure status for each period
**4. Visual Dashboard System**
- Comprehensive main dashboard with 13 metrics
- Real-time screener table with 10 data columns
- Multi-timeframe scanner
- Performance tracking panel
### How It Works
**Market Structure Detection**
The indicator identifies key structural changes in price action:
- **BOS (Break of Structure)**: Indicates trend continuation when price breaks previous swing points
- **CHoCH (Change of Character)**: Signals potential trend reversal when market structure shifts
**Order Block Identification**
Order blocks are detected when:
- Significant volume appears at swing points
- Price shows strong directional movement from these levels
- Enhanced detection with extreme volume confirmation (OB++ markers)
**Fair Value Gap Recognition**
Gaps between candles are identified when:
- Price leaves inefficiencies in the market
- Three consecutive candles create a gap pattern
- Gap size exceeds minimum threshold based on ATR
**Confluence Calculation**
The system evaluates multiple technical factors:
1. **Price Position**: Relative to moving averages (EMA 20, 50, 200)
2. **Volume Analysis**: Standard deviation-based volume spikes
3. **Momentum**: RSI, MACD, Stochastic indicators
4. **Trend Strength**: ADX measurements
5. **Money Flow**: MFI indicator readings
Each factor contributes weighted points to create an overall confluence score that helps assess signal strength.
### Signal Types
**Confirmation Signals (▲ / ▼)**
Generated when:
- EMA crossovers occur (20/50 cross)
- Volume confirmation is present
- RSI is in appropriate zone
- Confluence score exceeds 50%
**Strong Signals (▲+ / ▼+)**
Higher-confidence signals requiring:
- Confluence score above 70%
- Extreme volume confirmation
- Alignment with 200 EMA trend
- MACD confirmation
- Bullish or bearish market structure
**Contrarian Signals (⚡)**
Reversal indicators appearing when:
- RSI reaches extreme levels (<30 or >70)
- Stochastic shows oversold/overbought conditions
- Price touches Bollinger Band extremes
- Potential divergence patterns emerge
**Reversal Zones**
Visual boxes highlighting areas where:
- Market structure conflicts with momentum
- High probability of directional change
- Key support/resistance levels interact
**Smart Trail**
Dynamic stop-loss indicator that:
- Adjusts based on ATR (Average True Range)
- Follows trend direction
- Updates automatically as price moves
- Provides risk management reference points
### Dashboard Components
**Main Dashboard (13 Metrics)**
1. **Confluence Score**: Current bull/bear percentage (0-100)
2. **Market Regime**: Trend classification (Strong Up/Down, Range, Squeeze)
3. **Signal Status**: Active buy/sell signal indication
4. **Structure State**: Current market structure (Bullish/Bearish/Neutral)
5. **Trend Strength**: ADX-based measurement
6. **RSI Level**: Momentum indicator with overbought/oversold zones
7. **MACD Direction**: Trend momentum confirmation
8. **Money Flow Index**: Smart money sentiment
9. **Volume Status**: Current volume relative to average
10. **Volatility Rating**: ATR percentage measurement
11. **ATR Value**: Average true range for position sizing
12. **MTF Alignment**: Multi-timeframe agreement percentage
**Screener Table (10 Columns)**
- Current symbol and timeframe
- Real-time price and percentage change
- Quality rating (star system)
- Active signal type
- Smart trail status
- Market structure state
- MACD direction
- Trend strength percentage
- Bollinger Band squeeze detection
**MTF Scanner (5 Timeframes)**
Displays for each timeframe:
- Trend direction indicator
- Market structure classification
- Visual confirmation with color coding
**Performance Metrics**
- Win rate percentage (simplified calculation)
- Total signals generated
- Current confluence score
- MTF alignment status
- Volatility level
### Settings and Customization
**Preset Styles**
Choose from predefined configurations:
- **Conservative**: Fewer, higher-quality signals
- **Moderate**: Balanced approach (recommended)
- **Aggressive**: More frequent signals
- **Scalper**: Short-term focused
- **Swing**: Longer-term oriented
- **Custom**: Full manual control
**Smart Money Concepts Controls**
- Toggle each feature independently
- Adjust swing length (3-50 periods)
- Enable/disable internal structure
- Control order block display
- Manage breaker block visibility
- Show/hide fair value gaps
- Display liquidity zones
- Premium/discount zone visualization
**Signal Configuration**
- Enable/disable confirmation signals
- Toggle strong signal markers
- Control contrarian signal display
- Show/hide reversal zones
- Smart trail activation
- Sensitivity adjustment (5-50)
**Visual Customization**
- Moving average display options
- MA period adjustments (Fast: 20, Slow: 50, Trend: 200)
- Support/resistance line toggle
- Dynamic S/R lookback period
- Candle coloring based on trend
- Color scheme customization
- Dashboard size options (Small/Normal/Large)
- Position placement (4 corners)
### How to Use
**Step 1: Initial Setup**
1. Add indicator to chart
2. Select appropriate preset or use Custom
3. Adjust timeframe to match trading style
4. Configure dashboard visibility preferences
**Step 2: Analysis Workflow**
1. Check MTF Scanner for timeframe alignment
2. Review Main Dashboard confluence score
3. Observe Market Regime classification
4. Identify active signals on chart
5. Confirm with Smart Money Concepts (order blocks, FVG, structure)
**Step 3: Trade Consideration**
Strong signals (▲+ / ▼+) require:
- Confluence score >70%
- MTF alignment >60%
- Confirmation from multiple dashboard metrics
- Support from Smart Money Concepts
- Appropriate volume levels
**Step 4: Risk Management**
- Use Smart Trail as dynamic stop-loss reference
- Consider ATR for position sizing
- Monitor volatility rating
- Respect support/resistance levels
- Combine with personal risk parameters
### Best Practices
**For Scalping (1M-5M timeframes)**
- Use Scalper preset
- Reduce swing length to 5-7
- Focus on strong signals only
- Monitor MTF alignment closely
- Quick entries near order blocks
**For Intraday Trading (15M-1H timeframes)**
- Use Moderate preset (recommended)
- Default swing length (10)
- Combine confirmation and strong signals
- Check MTF scanner before entry
- Use fair value gaps for entries
**For Swing Trading (4H-D timeframes)**
- Use Swing preset
- Increase swing length to 15-20
- Focus on strong signals
- Require high MTF alignment
- Patient approach with major structure levels
### Technical Specifications
**Indicators Used**
- Exponential Moving Averages (20, 50, 200)
- Hull Moving Average
- Relative Strength Index (14)
- MACD (12, 26, 9)
- Money Flow Index (14)
- Stochastic Oscillator (14, 3)
- ADX / DMI (14)
- Bollinger Bands (20, 2)
- ATR (14)
- Volume Analysis (SMA 20 with standard deviation)
**Calculation Methods**
- Swing detection using pivot high/low functions
- Volume confirmation via statistical analysis
- Multi-factor scoring with weighted components
- Dynamic support/resistance using highest/lowest functions
- Real-time MTF data via security() function
### Limitations and Considerations
**Important Notes**
1. This indicator is designed for educational and analytical purposes only
2. Historical performance does not guarantee future results
3. Signals should be confirmed with additional analysis
4. Market conditions vary and affect indicator performance
5. Not all signals will be profitable
6. Risk management is essential for all trading
**Known Limitations**
- Confluence scoring is algorithmic and not predictive
- MTF analysis requires sufficient historical data
- Effectiveness varies across different market conditions
- Sideways markets may produce conflicting signals
- High volatility can affect signal reliability
- Backtesting results shown are simplified calculations
**Not Suitable For**
- Automated trading without human oversight
- Sole basis for trading decisions
- Guaranteed profit expectations
- Inexperienced traders without proper education
- Trading without risk management plans
### Market Applicability
**Effective On**
- Trending markets (any direction)
- Clear structure formation periods
- Liquid instruments with consistent volume
- Multiple asset classes (forex, stocks, crypto, commodities)
- Various timeframes with appropriate settings
**Less Effective During**
- Extended ranging/choppy conditions
- Extremely low volume periods
- Major news events causing gaps
- Early market open with high spread
- Illiquid instruments with erratic price action
### Risk Disclaimer
**⚠️ IMPORTANT NOTICE**
This indicator is provided for **educational and informational purposes only**. It does not constitute financial advice, investment recommendations, or trading signals.
**Key Risk Factors:**
- Trading financial instruments involves substantial risk of loss
- Past performance does not indicate future results
- No indicator can predict market movements with certainty
- Users should conduct independent research and analysis
- Professional financial advice should be sought when appropriate
- Risk management and position sizing are critical to successful trading
- Users are solely responsible for their trading decisions
**Responsible Usage:**
- Combine with comprehensive market analysis
- Use appropriate stop-loss orders
- Never risk more than you can afford to lose
- Maintain realistic expectations
- Continue education on technical analysis principles
- Test thoroughly on demo accounts before live trading
- Understand all indicator features before using
### Educational Resources
**Understanding Smart Money Concepts**
Smart Money Concepts analyze how institutional traders and large market participants operate. Key principles include:
- Institutional order flow patterns
- Market structure changes
- Liquidity manipulation
- Supply and demand imbalances
- Order block formations
**Multi-Timeframe Analysis Theory**
Analyzing multiple timeframes helps:
- Identify overall market direction
- Improve entry timing
- Confirm trend strength
- Recognize consolidation periods
- Reduce conflicting signals
**Confluence Trading Approach**
Using multiple confirming factors:
- Increases signal reliability
- Reduces false signals
- Provides conviction for trades
- Helps with position sizing
- Improves risk-reward ratios
### Version History
**v3.0 (Current)**
- Multi-factor confluence scoring system
- Complete Smart Money Concepts implementation
- Real-time multi-timeframe analysis
- Four professional dashboard panels
- Enhanced order block detection
- Breaker block identification
- Premium/discount zone calculations
- Smart trail stop-loss system
- Customizable preset configurations
- Performance tracking metrics
**Development Philosophy**
This indicator was developed with focus on:
- Educational value for traders
- Transparent methodology
- Comprehensive feature set
- User-friendly interface
- Flexible customization options
### Technical Support
**For Questions About:**
- Indicator functionality
- Parameter optimization
- Signal interpretation
- Dashboard metrics
- Best practice recommendations
Please use TradingView's comment section below. The developer monitors comments and provides assistance to users learning to use the indicator effectively.
### Acknowledgments
This indicator implements concepts from:
- Smart Money Concepts trading methodology
- Multi-timeframe analysis techniques
- Technical indicator theory
- Market structure analysis principles
- Institutional order flow concepts
All implementations are original code and calculations based on established technical analysis principles.
---
## ADDITIONAL INFORMATION SECTION
**Category**: Indicators
**Type**: Market Structure / Multi-Timeframe Analysis
**Complexity**: Intermediate to Advanced
**Open Source**: Code visible for transparency and education
**Pine Script Version**: v6
**Chart Overlay**: Yes
**Maximum Objects**: 500 boxes, 500 lines, 500 labels

Multi-indicator Signal Builder [Skyrexio]Overview
Multi-Indicator Signal Builder is a versatile, all-in-one script designed to streamline your trading workflow by combining multiple popular technical indicators under a single roof.
It features a single-entry, single-exit logic, intrabar stop-loss/take-profit handling, an optional time filter, a visually accessible condition table, and a built-in statistics label.
Traders can choose any combination of 12+ indicators (RSI, Ultimate Oscillator, Bollinger %B, Moving Averages, ADX, Stochastic, MACD, PSAR, MFI, CCI, Heikin Ashi, and a “TV Screener” placeholder) to form entry or exit conditions.
This script aims to simplify strategy creation and analysis , making it a powerful toolkit for technical traders.
Indicators Overview
RSI (Relative Strength Index)
Measures recent price changes to evaluate overbought or oversold conditions on a 0–100 scale.
Ultimate Oscillator (UO)
Uses weighted averages of three different timeframes, aiming to confirm price momentum while avoiding false divergences.
Bollinger %B
Expresses price relative to Bollinger Bands, indicating whether price is near the upper band (overbought) or lower band (oversold).
Moving Average (MA)
Smooths price data over a specified period. The script supports both SMA and EMA to help identify trend direction and potential crossovers.
ADX (Average Directional Index)
Gauges the strength of a trend (0–100). Higher ADX signals stronger momentum, while lower ADX indicates a weaker trend.
Stochastic
Compares a closing price to a price range over a given period to identify momentum shifts and potential reversals.
MACD (Moving Average Convergence/Divergence)
Tracks the difference between two EMAs plus a signal line, commonly used to spot momentum flips through crossovers.
PSAR (Parabolic SAR)
Plots a trailing stop-and-reverse dot that moves with the trend. Often used to signal potential reversals when price crosses PSAR.
MFI (Money Flow Index)
Similar to RSI but incorporates volume data. A reading above 80 can suggest overbought conditions, while below 20 may indicate oversold.
CCI (Commodity Channel Index)
Identifies cyclical trends or overbought/oversold levels by comparing current price to an average price over a set timeframe.
Heikin Ashi
A type of candlestick charting that filters out market noise. The script uses a streak-based approach (multiple consecutive bullish or bearish bars) to gauge mini-trends.
TV Screener
A placeholder condition designed to integrate external buy/sell logic (like a TradingView “Buy” or “Sell” rating). Users can override or reference external signals if desired.
Unique Features
Multi-Indicator Entry and Exit
You can selectively enable any subset of 12+ classic indicators, each with customizable parameters and conditions. A position opens only if all enabled entry conditions are met, and it closes only when all enabled exit conditions are satisfied, helping reduce false triggers.
Single-Entry / Single-Exit with Intrabar SL/TP
The script supports a single position at a time. Once a position is open, it monitors intrabar to see if the price hits your stop-loss or take-profit levels before the bar closes, making results more realistic for fast-moving markets.
Time Window Filter
Users may specify a start/end date range during which trades are allowed, making it convenient to focus on specific market cycles for backtesting or live trading.
Condition Table and Statistics
A table at the bottom of the chart lists all active entry/exit indicators. Upon each closed trade, an integrated statistics label displays net profit, total trades, win/loss count, average and median PnL, etc.
Seamless Alerts and Automation
• Configure alerts in TradingView using “Any alert() function call.”
• The script sends JSON alert messages you can route to your own webhook.
• The indicator can be integrated with Skyrexio alert bots to automate execution on major cryptocurrency exchanges.
Optional MA/PSAR Plots
For added visual clarity, optionally plot the chosen moving averages or PSAR on the chart to confirm signals without stacking multiple indicators.
Methodology
Multi-Indicator Entry Logic
When multiple entry indicators are enabled (e.g., RSI + Stochastic + MACD), the script requires all signals to align before generating an entry. Each indicator can be set for crossovers, crossunders, thresholds (above/below), etc. This “AND” logic aims to filter out low-confidence triggers.
Single-Entry Intrabar SL/TP
• One Position At a Time: Once an entry signal triggers, a trade opens at the bar’s close.
• Intrabar Checks: Stop-loss and take-profit levels (if enabled) are monitored on every tick. If either is reached, the position closes immediately, without waiting for the bar to end.
Exit Logic
All Conditions Must Agree: If the trade is still open (SL/TP not triggered), then all enabled exit indicators must confirm a closure before the script exits on the bar’s close.
Time Filter
Optional Trading Window: You can activate a date/time range to constrain entries and exits strictly to that interval.
Justification of Methodology
Indicator Confluence: Combining multiple tools (RSI, MACD, etc.) can reduce noise and false signals.
Intrabar SL/TP: Capturing real-time spikes or dips provides a more precise reflection of typical live trading scenarios.
Single-Entry Model: Straightforward for both manual and automated tracking (especially important in bridging to bots).
Custom Date Range: Helps refine backtesting for specific market conditions or to avoid known irregular data periods.
How to Use
Add the Script to Your Chart
• In TradingView, open Indicators , search for “Multi-indicator Signal Builder” .
• Click to add it to your chart.
Configure Inputs
• Time Filter: Set a start and end date for trades.
• Alerts Messages: Input any JSON or text payload needed by your external service or bot.
• Entry Conditions: Enable and configure any indicators (e.g., RSI, MACD) for a confluence-based entry.
• Close Conditions: Enable exit indicators, along with optional SL (negative %) and TP (positive %) levels.
Set Up Alerts
• In TradingView, select “Create Alert” → Condition = “Any alert() function call” → choose this script.
• Entry Alert: Triggers on the script’s entry signal.
• Close Alert: Triggers on the script’s close signal (or if SL/TP is hit).
• Skyrexio Alert Bots: You can route these alerts via webhook to Skyrexio alert bots to automate order execution on major crypto exchanges (or any other supported broker).
Visual Reference
• A condition table at the bottom summarizes active signals.
• Statistics Label updates automatically as trades are closed, showing PnL stats and distribution metrics.
Backtesting Guidelines
Symbol/Timeframe: Works on multiple assets and timeframes; always do thorough testing.
Realistic Costs: Adjust commissions and potential slippage to match typical exchange conditions.
Risk Management: If using the built-in stop-loss/take-profit, set percentages that reflect your personal risk tolerance.
Longer Test Horizons: Verify performance across diverse market cycles to gauge reliability.
Example of statistic calculation
Test Period: 2023-01-01 to 2025-12-31
Initial Capital: $1,000
Commission: 0.1%, Slippage ~5 ticks
Trade Count: 680 (varies by strategy conditions)
Win rate: 75.44% (varies by strategy conditions)
Net Profit: +90.14% (varies by strategy conditions)
Disclaimer
This indicator is provided strictly for informational and educational purposes.
It does not constitute financial or trading advice.
Past performance never guarantees future results.
Always test thoroughly in demo environments before using real capital.
Enjoy exploring the Multi-Indicator Signal Builder! Experiment with different indicator combinations and adjust parameters to align with your trading preferences, whether you trade manually or link your alerts to external automation services. Happy trading and stay safe!

My script_DetailedThis is a daily screener for swing trading using the latest screener functionality from trading view. I have been using this for a few months for a fantastic results. I have traded 100 trades with a profit potentiality of 80 percent.
What a way to trade. I use the daily timeframe.

My scriptThis is a daily screener for swing trading using the latest screener functionality from trading view. I have been using this for a few months for a fantastic results. I have traded 100 trades with a profit potentiality of 80 percent.
What a way to trade. I use the daily timeframe.

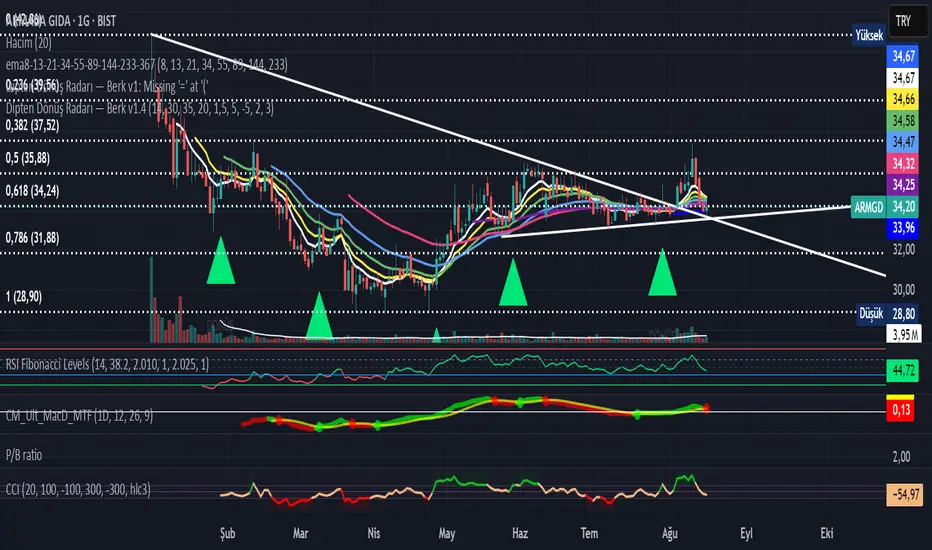
Bottom Reversal Radar — Berk v1.4Bottom Reversal Radar — Berk v1.4
What it does:
Combines RSI recovery after oversold, MACD bull cross, close above EMA8, near-EMA200 proximity, volume expansion, and simple bullish divergence (pivot lows) into a single score.
Signal: Trigger when Score ≥ Threshold (default 3). Set alert via Create Alert → “Dipten Dönüş — Ana Sinyal” → Once per bar close.
How it works
RSI recovery: After touching oversold (30), RSI crosses up 35 within last X bars.
MACD bull cross: MACD Line crosses above Signal.
Close above EMA8 and BOS (close above recent swing high) confirm momentum.
Near EMA200: Price within −5%…+2% band adds a point.
Volume spike: Volume ≥ 1.5× SMA(20) adds a point.
Bullish divergence: Lower price low + higher RSI low (pivot 3/3) adds a point.
Inputs
RSI(14), rsiOS=30, rsiRecover=35, Volume SMA(20) with 1.5× multiplier, EMA200 proximity band −5%…+2%, lookbackBars=5, Score threshold default 3.
Usage tips
Best on Daily / 4H. If too many false positives: raise threshold to 4 and volume to 1.8–2.0×.
Pair with Screener filters: RSI≥35, MACD Line>Signal, Price above EMA8, Volume/Avg(20)≥1.5, and near EMA200 (%).
Disclaimer
For educational purposes only. Not financial advice.
Release notes (v1.4)
Fixed bullDiv typo; simplified visuals; Pine v5.
Tags: rsi, macd, ema, volume, divergence, reversal, trend, screener, bist, stocks, crypto
Equilibrium TrackerWhat does this indicator do?
This is a screener that checks if the current HTF High moves above the previous HTF High.
This also applies for the low moving below the previous low.
If the 50% of the previous candle is touched, this wil also show in the table and send alerts.
Features
Select up to 2 timeframes and 10 instruments.
A screener table will show all instruments and will light up if an event occurs
Alerts can also get fired
Usage:
Select a chart for example 1 minute
Configure the indicator
Create a new alert on the indicator using the lower timeframe chart

Momentum TrackerDescription
To screen for momentum movers, one can filter for stocks that have made a noticeable move over a set period. This initial move defines the momentum or swing move. From this list of candidates, we can create a watchlist by selecting those showing a momentum pause, such as a pullback or consolidation, which later could set up for a continuation.
Momentum = Magnitude × Time
This Momentum Tracker indicator serves as a study tool to visualize when stocks historically met these momentum conditions. It marks on the chart where a stock would have appeared on the screener, allowing us to review past momentum patterns and screener requirements. The indicator measures momentum in three different ways:
Normalized Momentum
Identifies when the current price reaches a new high or low compared to a historical window. This is the most standardized measurement and adapts well across markets.
Normalized = Current Price ≥ Maximum Price in Lookback
Normalized = Current Price ≤ Minimum Price in Lookback
Relative Momentum
Measures the percentage difference between a fast and a slow moving average. This method helps capture acceleration, the rate at which momentum is building over time.
Relative = |Fast MA − Slow MA| ÷ Slow MA × 100
Absolute Momentum
Measures how far price has moved from the highest or lowest point within a defined lookback period.
Absolute = (Current Price − Lowest Price) ÷ Lowest Price × 100
Absolute = (Highest Price − Current Price) ÷ Highest Price × 100
Customization
The tool is customizable in terms of lookback period and thresholds to accommodate different trading styles and timeframes, allowing users to set criteria that align with specific hold times and momentum requirements. While the various calculations can be enabled, the tool is best used in isolation of each to visualize different momentum conditions.

TDMACD Divergence Multi Timeframe and Alert [5ema]I reused some functions, made by (i believe that):
@paaax: The table position function.
@everget: The RSI divergence function.
@QuantNomad: The function calculated value and array to show on table for input symbols.
@ChaosTrader: The function calculated value TDMACD.
-----
What to do?
MACD divergence signal.
The crossing of MACD and Signal line.
The reversal of MACD.
The reversal of Signal line.
The screener follow 6 different timeframes.
Set notification alert when signal appears.
-----
How is it created?
MACD line = fastMA - slowMA.
Signal line = ta.ema(macd(), signalLength)
Make function for pivot low & high point of MACD and price.
Request.security that function for earch time frame.
-----
How to use?
Can be combined with many other indicators or candlestick patterns.
Customize the input indicators to suit your strategy
1. MACD reversed:
2. Signal line reversed:
3. MACD Divergence :
4. MACD crossing Signal line:
5. Signal on Screener for multi time frame:
Green ⦿: Buy.
Red ⦿: Sell.
Green 〇: Review Buy.
Red 〇: Review Sell.
-----
This indicator is for reference only, you need your own method and strategy.
If you have any questions, please let me know in the comments.

Cloud Bunching [5ema]Reused some functions from (i believe made by):
©paaax: The table position function.
@QuantNomad: The function calculated value and array screener for 40+ instruments .
How it uses:
Gives signal when the cloud is bunching with ratio smaller than the set ratio and the close price breaking out the cloud.
Track 40 different symbols, on any timeframe to follow and alert.
When a symbol has a signal, it will display on the chart and send an alert.
How it works:
The cloud created by 5 EMA (20, 50, 200, 460, 610). Upper Cloud is max EMA , Lower Cloud is min EMA . Center line is averange (5 EMA )
If the ratio upper / lower < input bunching (%) -> change color of cloud.
Get the signal if: the close price break out cloud (with bar is shooting, or hammer ,...) and high volume (or not).
With another symbols (max 40 ) also use that function with any time frame. By request.security() and array function.
How it setting:
Change the bunching rate (%) of the clouds for any symbols.
Change the percentage (%) of the close price that breaks out of the bunching cloud.
Choose volume condition.
Show or turn off the cloud, table.
Select the symbol to follow.
Choose a timeframe to follow other symbols.
----
This indicator is for reference only, you need your own method and strategy.
If you have any questions, please let me know in the comments.

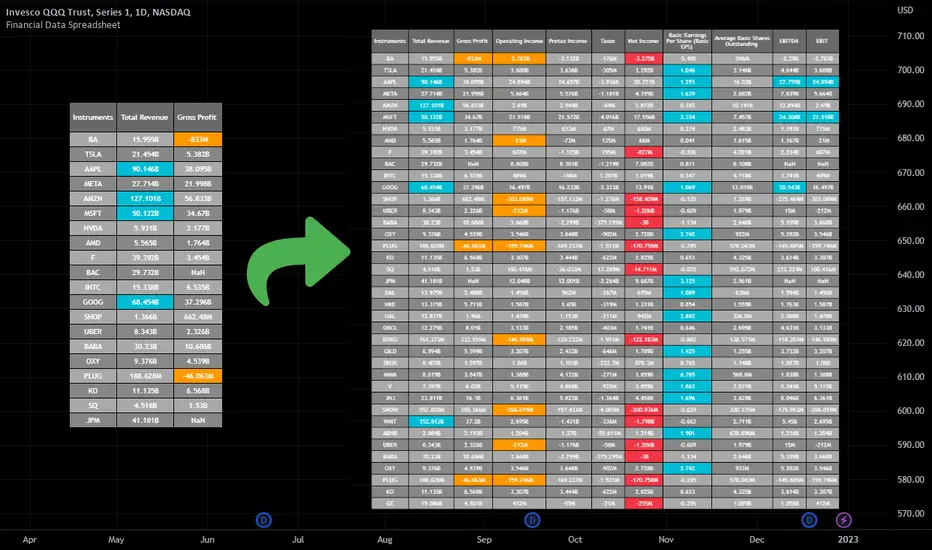
Financial Data Spreadsheet [By MUQWISHI]The Financial Data Spreadsheet indicator displays tables in the form of a spreadsheet containing a set of selected financial performances of a company within the most recent reported period. Analyzing Financial data is one of the classic methods to evaluate whether the company’s stock price is overvalued or undervalued based on its income statement, balance sheet, and cash flow statement. This indicator might be practical to investors to collect needed data of a company to analyze and compare it with other companies on a TradingView chart or print it in spreadsheet form.
█ OVERVIEW
█ BEST PRACTICES
Due to strict limitations on calling request.financial() function, I tried to develop the table with the best ways to be more dynamic to move and the ability to join multiple tables into a spreadsheet. Users can add up to 20 instruments and 2 financial metrics per table. However, it’s possible to add many tables with other financial metrics, then connect them to the main table.
Credits: The idea of joining multiple tables inspired by @QuantNomad Screener for 40+ instruments
█ INDICATOR SETTINGS
1- Moving Table toward right-left up-down from its origin.
2- Hiding Column Title checkmark. Useful for adding a joined table underneath with additional instruments.
3- Hiding Instruments Title checkmark. Useful for adding a joined table on the right with other financial metrics.
4- Shade Alternate Rows checkmark. I believe it’ll make the table easier to read.
5- Selecting Financial Period. (Year, Quarter).
6- Entering a currency.
7- Choosing a financial ID for each column. There’re over 200 financial IDs. Source: What financial data is available in Pine? — TradingView
8- Optional to highlight values in between.
9- Entering the ticker’s symbol with the ability to activate/deactivate.
█ TIP
For best technical performance, use the indicator in a 1D timeframe.
Please let me know if you have any questions.
Thank you.
Crypto-DX Crypto Directional Index [chhslai]Crypto-DX can be used to help measure the overall strength and direction of the crypto market trend.
Furthermore, it can be used as a screener to find out cryptocurrencies which are accumulating momentum and tends to potentially pump or dump.
How this indicator works :
If the Crypto-DX cross above the zero-level, it could be an indication that there is a trend reversal into upward. You should close your short position or place a long order right away.
If the Crypto-DX cross below the zero-level, it could be an indication that there is a trend reversal into downward. You should close your long position or place a short order right away.
If the Crypto-DX is consolidated around the zero-level, it could be an indication that the trend may be ended and followed by a sideway market. You are suggested not to place any order and wait for the market moves.
Divergence based trading strategy is fully applicable, just like the MACD.
Screener features :
Plot "Crypto Index" and "5 Custom Crypto"
Plot "Crypto Index" and "Top 30 Crypto"

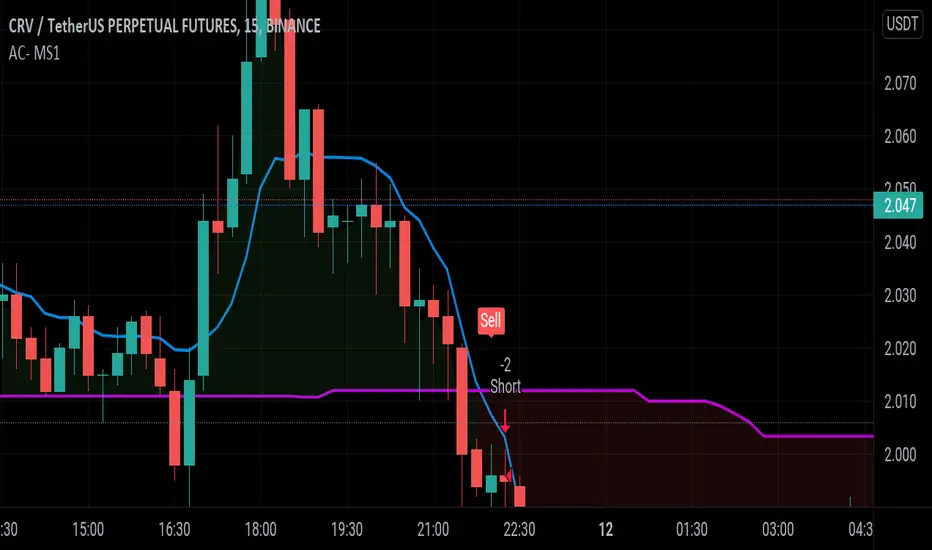
AC- MY SCRIPT1My Ac- My Scrpt1 that the BUY and SELL signals (trend reversals) for many coins defined different tickers in Tradingview charts
Terminology explanation:
Confirmed Reversal: Oxford T reversal that happened in the last bar and cannot be repainted.
Potential Reversal: Oxford T reversal that might happen in the current bar but can also not happen depending upon the timeframe closing price.
Downtrend: Tickers that are currently in the sell zone
Uptrend: Tickers that are currently in the buy zone
List and show has also got a built in Oxford T indicator which users can confirm the reversals on graphs.
Screener explores the 40 tickers in current graph's time frame and also in desired parameters of the OTT indicator.
Also you can optimize the parameters manually with the built in STRATEGY version.
Built in Moving Average type defaultly set as VAR but users can choose from 8 different Moving Average types like:
SMA : Simple Moving Average
EMA : Exponential Movin Average
WMA : Weighted Moving Average
TMA : Triangular Moving Average
VAR : Variable Index Dynamic Moving Average aka VIDYA
WWMA : Welles Wilder's Moving Average
ZLEMA : Zero Lag Exponential Moving Average
TSF : True Strength Force
Tip: In sideways VAR would be a good choice
You can use OxforfT default alarms and Buy Sell signals like:
1-
BUY when Prices are above OxfordT
SELL when Prices are below OxfordT
2-
BUY when OxfordT support Line crosses over OoxfordT line.
SELL when OxfordT support Line crosses under OxfordT line.
3-
BUY when OxfordT line is Green and makes higher highs.
SELL when OxfordT line is Red and makes lower lows.
IMPORTANT: SCREENER ONLY EXPLORES AND SCREENS FOR THE 2nd SIGNAL TYPE:
BUY when OxfordT support Line crosses over OxfordT line.
SELL when OxfordT support Line crosses under OxfordT line.
[JL] How Many Signals last N barsGot this idea after I found Multiple Indicators Screener from QuantNomad.
This script learnt some codes from QuantNomad's great script. Thanks to him.
------------------------------------------------------------------------------------------------------------------------------------------------------------------------
This table show how many signals happened during the last N bars.
I only take care Forex, so this table only has 28 symbols. Feel free to change it.
Calculate the following signals:
RSI cross over/under 50
Short Moving average cross over/under long moving average
Stochastic k cross over/under d
MACD hist cross over/under 0
Williams Fractals: Up and Down fractals happened.
The concept is simple: Range period will always happen more cross signals than the trend period.
When the counter is less than median of all symbols, will be set green color. So more green mean more chance to be trend.

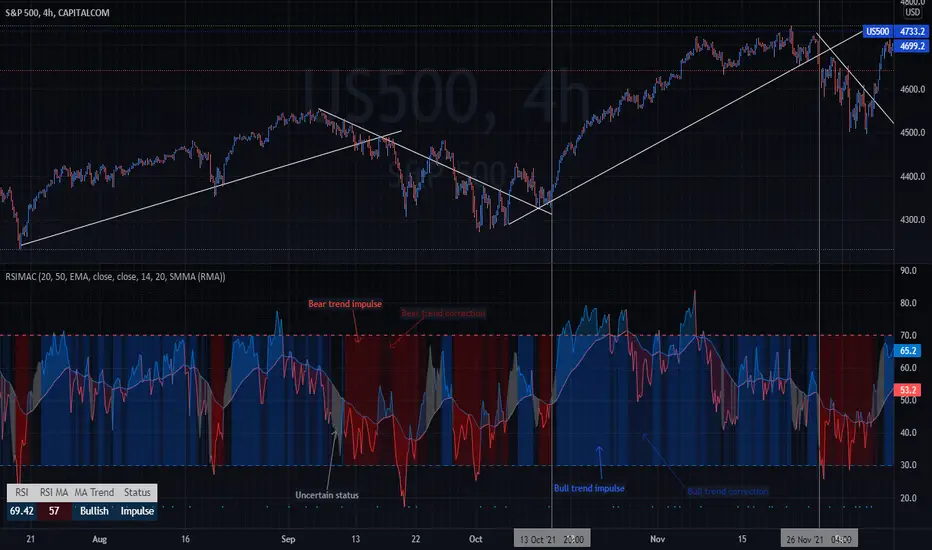
RSI Moving Average CrossoversThis script is an improved version of the RSI indicator, using a moving average on the RSI itself, as well as two other moving averages used to determine the current trend.
A small screener indicating the current movement is displayed in the bottom-left zone of the chart: trend (Bullish/Bearish/Uncertain) and status (Impulse or Correction)
Trends are simply based on moving averages crossovers, coupled to the fact that the current candle closes above the fast MA in a bull trend, and under the fast MA in a bear trend. In other cases, the trend and the movement are considered as "Uncertain" by the indicator.
Options
Various types of moving averages for the RSI and trend MA
Show/Hide crossovers between the RSI and its MA
Color the RSI normal zone with the current trend/movement colors
Show/Hide the screener indicating the current movement
Defaults Parameters
Fast MA 20
Slow MA 50
MA source: Close
RSI Length 14
RSI MA: SMMA (RMA)
RSI MA Length: 20
Don't hesitate to suggest any idea which could improve this indicator.
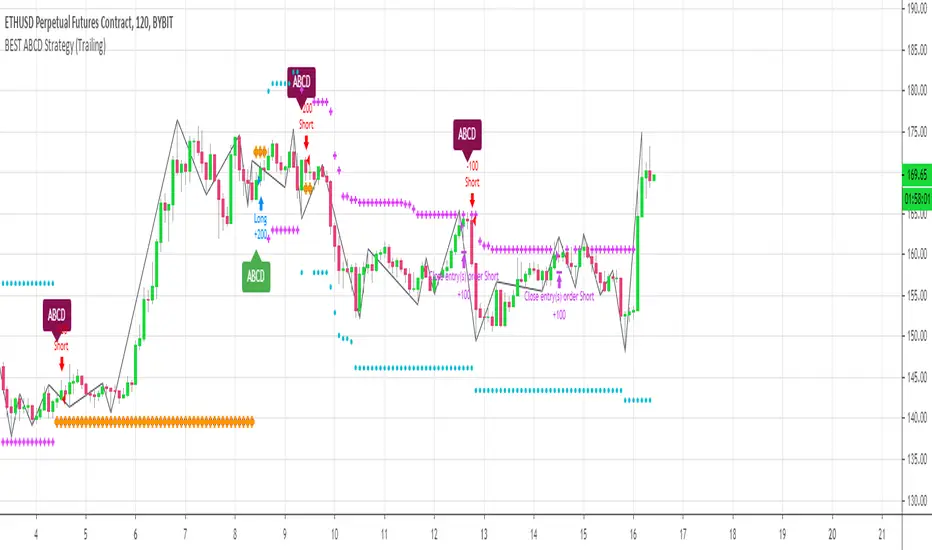
[Daveatt] BEST ABCD Pattern Strategy (Trailing SL + TP)Hello traders
This is the strategy version of my ABCD pattern. I added the Trailing Stop and Trailing Profit upon a follower request
I - Concept
I present to you, ladies and gentlemen, the first screener for harmonic patterns .
Starting with an ACBD pattern screener this time!!
I used the calculations from Ricardo Santo's script
In short, he's using fractals (regular or Bill Williams ) for the pattern calculations. A masterpiece !!!
II - Definitions
The ABCD pattern ( AB=CD ) is one of the classic chart patterns which is repeated over and over again.
The ABCD pattern shows perfect harmony between price and time.
The Williams Fractal is an indicator, developed by Bill Williams , that aims to detect reversal points (highs and lows) and marks them with arrows.
Up fractals and down fractals have specific shapes. The Williams Fractal indicator helps users determine in which direction price will develop
💎Strategy filters💎
I included some cool backtest filters:
- Trailing stop with trigger concept coming from this Trailing Stop Strategy
- Trailing profit with trigger coming from this Trailing Profit Strategy
Last words
It works for all asset classes (Forex, crypto, indices, etc...) and does not repaint
All the BEST
Dave
Smart Money Sector RotationSTOP MISTAKING INFLATION FOR PERFORMANCE.
Your PnL might look green in nominal terms, but are you actually generating wealth, or just floating on a rising tide of liquidity?
The "Smart Money Sector Rotation" indicator is an institutional-grade dashboard designed to answer that single, critical question. It strips away the noise of nominal price action and benchmarks major assets against the "Honest Hurdle"—a dynamic baseline derived from M2 Money Supply, Inflation Breakevens, and Treasury Yields.
If an asset isn't beating the Hurdle, you aren't generating real wealth—you're just keeping pace with debasement.
THE HONEST FRAMEWORK Most screeners rank assets by simple percentage gain. This tool is different. It calculates a "Required Rate of Return" (Min Return) based on live Federal Reserve data (FRED).
1. Quantify the Debasement. We automatically fetch M2 Money Supply Growth and Inflation expectations to set the "floor."
2. Calculate Real Alpha. We measure how far an asset is trading above or below that floor.
3. Classify the Trend. Using RRG-style logic (Relative Rotation Graph), we categorize assets into four actionable phases based on their Real Yield and Momentum.
THE 4 MARKET PHASES Instead of vague signals, get a clear read on the asset's lifecycle:
ZONE 1: ELITE / LEADING (Cyan/Green) -- The State: Expansion. -- The Logic: The asset is generating positive Real Yields (beating the money printer) and has strong momentum relative to its peers.
ZONE 2: IMPROVING (Gold) -- The State: Recovery. -- The Logic: The asset may be below the Hurdle, but momentum is shifting positively. It is "waking up."
ZONE 3: LAGGING / WEAKENING (Orange/Red) -- The State: Contraction. -- The Logic: The asset is failing to keep up with debasement or is actively losing relative strength.
KEY FEATURES -- Auto-Macro Data: Connects directly to FRED for M2 (WM2NS), 10Y Inflation (T10YIE), and Yields (DGS10). No manual entry required. -- Trend Visualization: Tickers are marked with Green/Red indicators based on their 200-day Moving Average status. -- Prestige Color System: A dark-mode optimized, high-contrast palette designed for professional clarity. -- Multi-Asset Universe: Tracks Equities (XLK, XLE, etc.), Commodities (Gold, Silver, Oil), and Rates (TLT, HYG) in a single view.
HOW TO USE
1. Check the Header: Look at the "Min Ret" (Minimum Return). This is your beat-to-profit line.
2. Scan the Status: Focus on assets in the Elite or Leading zones for trend continuation. Watch Improving assets for potential reversals.
3. Respect the Trend: Use the SMA200 indicator as a final filter. A "Leading" status with a Red trend mark may indicate a trend that is rolling over.
DISCLAIMER This tool is for informational and educational purposes only. It visualizes macroeconomic data and does not constitute financial advice or a recommendation to buy/sell.

Top-line % MovesOverview
A clean, text-only overlay that shows price momentum at a glance. It prints one line at the top-center of your chart:
Movement | Day % | 3-Day % | Wk %
What it shows
Day - Percent change from today’s regular-session open to the latest price
3-Day - Percent change from the daily open 3 trading days ago
Wk - Percent change from the daily open 5 trading days ago
How it works
Pulls daily opens via request.security so it stays consistent across intraday and daily timeframes
Calculates percent moves versus those opens and renders a single centered text line
Transparent background, bright white text, no bars or lines, minimal chart footprint
Notes
“Wk” uses 5 trading days. If you prefer 7 calendar days, change the lookback to your preference
Daily opens follow the symbol’s TradingView session settings. Extended or 24h markets may differ from your broker’s definition of “open”
Best for
Quick momentum read without clutter
Screeners, streaming layouts, and compact dashboards
Inputs
None
Tags
percent change, overlay, momentum, daily open, intraday, text display, minimal, Pine v6

Greer Free Cash Flow Yield✅ Title
Greer Free Cash Flow Yield (FCF%) — Long-Term Value Signal
📝 Description
The Greer Free Cash Flow Yield indicator is part of the Greer Financial Toolkit, designed to help long-term investors identify fundamentally strong and potentially undervalued companies.
📊 What It Does
Calculates Free Cash Flow Per Share (FY) from official financial reports
Divides by the current stock price to produce Free Cash Flow Yield %
Tracks a static average across all available financial years
Color-codes the yield line:
🟩 Green when above average (stronger value signal)
🟥 Red when below average (weaker value signal)
💼 Why It Matters
FCF Yield is a powerful metric that reveals how efficiently a company turns revenue into usable cash. This can be a better long-term value indicator than earnings yield or P/E ratios, especially in capital-intensive industries.
✅ Best used in combination with:
📘 Greer Value (fundamental growth score)
🟢 Greer BuyZone (technical buy zone detection)
🔍 Designed for:
Fundamental investors
Value screeners
Dividend and FCF-focused strategies
📌 This tool is for informational and educational use only. Always do your own research before investing.

Sector Relative StrengthDescription
This script compares sector performance relative to the S&P 500. Sector price levels or charts alone can mislead, because they tend to move with the broader market. An increase in a sector’s price does not necessarily indicate strength, as it may simply be following the index.
For more a more reliable picture, the script calculates a ratio between each sector ETF and SPY. If the ratio has increased, the sector has outperformed the index. In case it has declined, the sector has underperformed. If the value is near zero, the sector has moved in line with the index. The sectors are presented in a table and sorted on relative performance.
Calculation Method
The performance is expressed as a percentage change in the ratio over a user-defined lookback period. The default lookback is set to 21 bars, which corresponds to one month on a daily chart. This value can be adopted in the settings to match preferred time period.
Z-Score
In addition to the percentage change, the script calculates a Z-score of the ratio, which measures how far the current value deviates from its recent mean. A high positive Z-score indicates that the ratio is significantly above its average, while a negative value indicates it is below. This normalization allows for comparison between sectors with different price levels or volatility profiles.
Table Columns
- Relative %: The sector's performance relative to SPY over the selected lookback period
- Z-Score: Standardized measure of current performance ratio is relative to its average
- Trend Arrow: Indicates the direction of relative performance up down or flat
Example Interpretation
For example, if XLK shows a 3.7% change, it has outperformed SPY over the selected period. Another sector might show a -2.1% change, which indicates underperformance. While both values shows relative strength or weakness, the Z-score is optional and can provide additional context based on how unusual that performance is compared to the sector's own recent behavior.
Use Case
This approach helps evaluate overall market conditions and supports a top-down method. By starting with sector performance, it becomes easier to identify where the market is showing leadership or weakness. This allows the stock selection process to be more deliberate and can help refine or customize screeners based on certain sectors.

ORB - BO-RT-ENThis script is designed for the Opening Range Breakout (ORB) trader who seeks high-probability entries through price action confirmation. Unlike standard breakout tools that trigger on the first touch, this indicator requires a three-step validation process: Breakout, Retest, and Momentum Confirmation.
High-Level Summary
The script identifies the high and low of the first 5 minutes of the trading session (adjustable via inputs). It then monitors price action to find a confirmed breakout outside this range. To filter out "fakeouts," the script requires the price to return and touch the broken level (the retest) before signaling an entry. If at any point the price closes back inside the opening range before the setup is complete, the trade is invalidated and the sequence resets.
Core Features
Sequential Signal Logic: Tracks the BO → RT → ENTRY process across distinct candles to prevent early entries.
Momentum Confirmation: Entry arrows only trigger after a user-defined candle delay and a close in the trend direction.
Visual Clarity: Plots high-visibility 5-minute range lines that persist until the market close.
Advanced Invalidation: Automatically cancels setups if a "stop-run" or fakeout closes price back within the range.
Scanner Ready: Includes specific alertcondition calls for Breakouts, Retests, and Entries, making it compatible with the TradingView Stock Screener.
How to Use the Script (Steps to Play)
1. Setup the Timeframe
Apply the indicator to a 1-minute chart. While the opening range is calculated based on the first 5 minutes, the entry logic requires the granularity of the 1-minute timeframe to detect precise retests.
2. Define the Range
By default, the script calculates the range from 09:30 to 09:35 EST. If you trade a different market (e.g., London Open or Crypto), adjust the "Opening Range Period" in the settings.
3. Monitor for the Breakout (BO)
Wait for a 1-minute candle to close above the High or below the Low. A label marked "BO" will appear on your chart.
4. The Retest (RT)
After the breakout, look for the price to "wick" or touch the breakout line. A triangle marked "RT" will appear.
Note: If the price closes back inside the range during this phase, the labels will disappear, signaling an invalid setup.
5. Execution (ENTRY)
Once the retest is complete, wait for the "ENTRY" arrow. This triggers when:
The user-defined candle delay (default: 1 bar) has passed since the retest.
The candle closes in the direction of the breakout (Green for Long / Red for Short).
6. Exit Strategy
Following the original strategy parameters, place your Stop Loss at the opposite end of the 5-minute opening range and set your Take Profit at a 2.0 Risk-to-Reward (2R) ratio from your entry price.

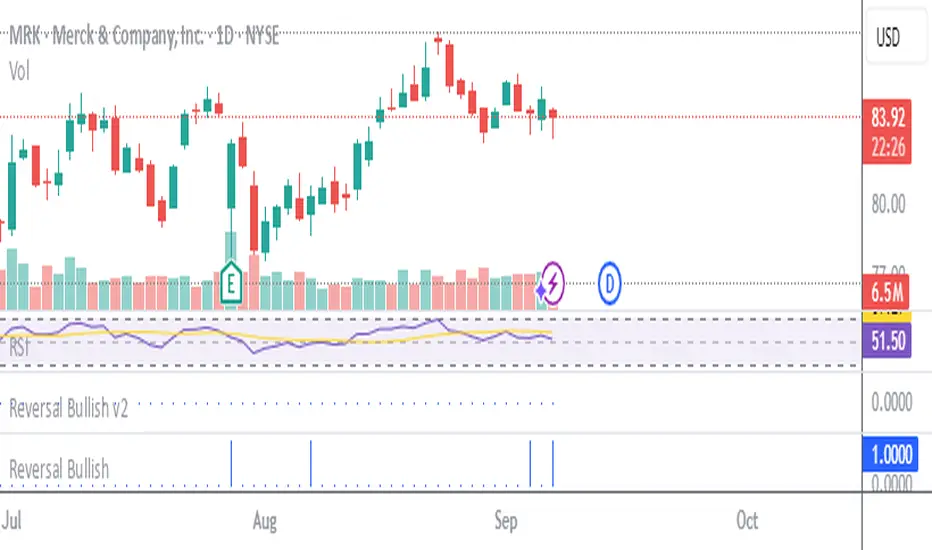
Auto AVWAP (Anchored-VWAP) with Breakout Screener_v2Updated indicator for AWAP breakout. The indicator identified the candle that breaks out of AVWAP

Stockbee Reversal Bullish v2Custom indicator for identifying stocks that meet the Stockbee's Reversal Bullish New criteria. This can be used as a standalone indicator or use it to screen for stocks in Pine Screener.