Scalping criptomania EMA-Volume-BollingerScalping criptomania EMA-Volume-Bollinger
Indicadores
Ema 13
Ema 34
Volumen MV 10
Bandas de bollinger
Entrada : flecha verde
Salida : flecha roja
Alarmas incluidas de posible entrada y posible salida
Wyszukaj w skryptach "scalping"

Scalping criptomania EMA-Volume-BollingerScalping criptomania EMA-Volume-Bollinger
Indicadores
Ema 13
Ema 34
Volumen MV 10
Bandas de bollinger
Entrada : flecha verde
Salida : flecha roja
Alarmas incluidas de posible entrada y posible salida

Pro Scalper AI [BullByte]The Pro Scalper AI is a powerful, multi-faceted scalping indicator designed to assist active traders in identifying short-term trading opportunities with precision. By combining trend analysis, momentum indicators, dynamic weighting, and optional AI forecasting, this tool provides both immediate and latched trading signals based on confirmed (closed bar) data—helping to avoid repainting issues. Its flexible design includes customizable filters such as a higher timeframe trend filter, and adjustable settings for ADX, ATR, and Hull Moving Average (HMA), giving traders the ability to fine-tune the strategy to different markets and timeframes.
Key Features :
- Confirmed Data Processing :
Utilizes a helper function to lock in price and volume data only from confirmed (closed) bars, ensuring the reliability of signals without the risk of intrabar repainting.
- Trend Analysis :
Employs ADX and Directional Movement (DI) calculations along with a locally computed HMA to detect short-term trends. An optional higher timeframe trend filter can further refine the analysis.
- Flexible Momentum Modes :
Choose between three momentum calculation methods—Stochastic RSI, Fisher RSI, or Williams %R—to match your preferred style of analysis. This versatility allows you to optimize the indicator for different market conditions.
- Dynamic Weighting & Volatility Adjustments :
Adjusts the contribution of trend, momentum, volatility, and volume through dynamic weighting. This ensures that the indicator responds appropriately to varying market conditions by scaling its sensitivity with user-defined maximum factors.
- Optional AI Forecast :
For those who want an extra edge, the built-in AI forecasting module uses linear regression to predict future price moves and adjusts oscillator thresholds accordingly. This feature can be toggled on or off, with smoothing options available for more stable output.
- Latching Mode for Signal Persistenc e:
The script features a latching mechanism that holds signals until a clear reversal is detected, preventing whipsaws and providing more reliable trade entries and exits.
- Comprehensive Visualizations & Dashboard :
- Composite Oscillator & Dynamic Thresholds : The oscillator is plotted with dynamic upper and lower thresholds, and the area between them is filled with a color that reflects the active trading signal (e.g., Strong Buy, Early Sell).
- Signal Markers : Both immediate (non-latching) and stored (latched) signals are marked on the chart with distinct shapes (circles, crosses, triangles, and diamonds) to differentiate between signal types.
- Real-Time Dashboard : A customizable dashboard table displays key metrics including ADX, oscillator value, chosen momentum mode, HMA trend, higher timeframe trend, volume factor, AI bias (if enabled), and more, allowing traders to quickly assess market conditions at a glance.
How to Use :
1. S ignal Interpretation :
- Immediate Signals : For traders who prefer quick entries, the indicator displays immediate signals such as “Strong Buy” or “Early Sell” based on the current market snapshot.
- Latched Signals : When latching is enabled, the indicator holds a signal state until a clear reversal is confirmed, offering sustained trade setups.
2. Trend Confirmation :
- Use the HMA trend indicator and the optional higher timeframe trend filter to confirm the prevailing market direction before acting on signals.
3. Dynamic Thresholds & AI Forecasting :
- Monitor the dynamically adjusted oscillator thresholds and, if enabled, the AI bias to gauge potential shifts in market momentum.
4. Risk Management :
- Combine these signals with additional analysis and sound risk management practices to determine optimal entry and exit points for scalping trades.
Disclaimer :
This script is provided for educational and informational purposes only and does not constitute financial advice. Trading involves risk, and past performance is not indicative of future results. Always perform your own analysis and use proper risk management strategies before trading.

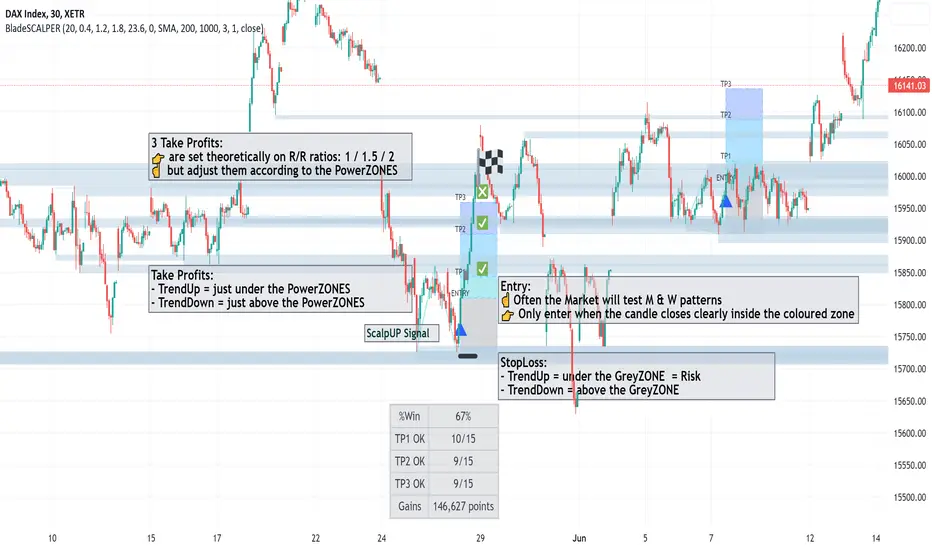
BladeSCALPER by MetaSignalsProBladeSCALPER
The sharpest tool to scalp M and W patterns
--------------------------------------------------------------------------
✔️ Get a clear signal of the next probable reversal move
✔️ Get instantly the zone where the price will probably get attracted to
✔️ Adjust TP1/TP2/TP3 accordingly to the PowerZONES
✔️ Check the winning rate of the M & W patterns on a time period
✔️ Optimize the probability of success of the M & W patterns
---------------------------------------------------------------------------
📌 For who?
---------------
Initialy, scalping is based on small moves, supposedly more predictable than big ones and repeating this operation many times.
For that, scalping means usally daytrading and not everybody can/want to be a daytrader: managing one's emotions is just critical;
But you can also use this indicator on a bigger time frame and trade when you want the M & Ws!
So basicaly BladeSCALPER is for anybody who wants to trade succesfully M&W patterns whatever Timeframe, whatever asset!
📌 For which asset?
-------------------------
BladeSCALPER is universal and works fine on all assets and all time-frames;
📌Why we made these innovations?
--------------------------------------------
"Double Tops" and "Double Bottoms", commonely called "M" and "W" as the letter explicitely shows these patterns, are some of the most predictive patterns you can find.
To exploit them, we needed to have an all in one tool:
◾ a very sharp scalping and innovative tool with embed statistics
◾ identify Risk/Reward ratio for TakeProfits
◾ and advanced Supports and Resistances information i.e the PowerZONES
📌 How to trade with BladeSCALPER ?
-----------------------------------------------
🔹 ScalpUP / ScalpDOWN Signals
The signals are given when the patterns of M and W are identified, in real time and do not repaint.
☝️ Quite often the Market will test the bottoms and the tops before validating such a figure;
👉 Only enter the trade when the candle closes clearly inside the coloured zone and not immediately on the signal.
🔹 PowerZONES
We innovated on the basic Supports and Resistances concept by adding new features with:
◾ zones that correspond better to real life trading than lines
◾ zones that change color depending of their position vs price : they turn red is the price is below them and blue if they are above.
◾ strength / attractivity of these zones = how many times the Support/Resistance have been touched in the past that will magnetize the price
◾ and distance between these zones to give a clear picture
Importance of the PowerZONES
In the current version, the TPs do not adjust to the PowerZONES, precisely to be able to keep a global statistical view;
☝️ But when you plan to trade on a signal, the real relevance is to adjust them according to the PowerZONES, of course;
👉 When buying, place your TPs just below the consecutive PowerZONES that the price could test
👉 When selling, place them just above the consecutive PowerZONES
🔹 TP1/TP2/TP3
TakeProfits are set theoretically and based on 3 risk/reward ratios: 1 / 1.5 / 2 ;
But of course this is just a setting to get an overall view of the effectiveness of the pattern on the current asset;
if you change these settings, you'll see that the Stats change accordingly.
☝️ Again, when you plan to trade on a signal, the real relevance is to adjust them according to the PowerZONES, of course;
🔹 StatsPANEL
With this innovative feature you can now see immediately
◾ the probability of win, based on the past patterns
◾ the exacts number of trades that have reached the TP1/TP2/TP3
◾ and more importantly the gains made by these trades in pips
We introduce also 2 important possibilities to improve the precision and relience of BladeSCALPER
◾ the PatternFACTOR can be changed; it defines a key percentage of the M & W patterns
◾ the MoveringAverageFILTER can be activated to
◽ suppress M patterns when the price is below the selected MovingAverage
◽ suppress W patterns when the price is over the selected MovingAverage
👉 Modifying these variables will change immediately the statistics just like the position of the TP1/TP2/TP3 and HistoryMax variables.
📌 Importance of setting up a Multi TimeFrame and doing a trend analysis
------------------------------------------------------------------------------------------
Even if you are on a scalping mode, it is crucial you set up a Multi Time Frame workspace and that you conduct a trend analysis before entering the market.
If you don't, you won't maximize your chances;
No indicator is 100% reliable, because the market cannot be modelized; anyone who tells you otherwise is lying to your face;
However, a statistical approach to the market is possible, because agents are not incoherent.
This is the meaning of stats we apply on double tops and double bottoms;
But to reinforce this point, you need to know what's happening on the next higher time unit to get a global view.
To do this, it's important to do a trend analysis or have a trend analysis tool.
---------------------------------------------------------------------------------------------------
🎛️ Configuration
----------------------
◾ Buy/Sell Signals: choose if you want to see only W or only M pattern signals
◾ PowerZones: uncheck if you don't want to see them (not recommanded)
◾ RewardBoxText: uncheck if you don't want to see the words "Entry, TP1, TP2, TP3"
◾ TakeProfit1/TakeProfit2/TakeProfit3: by default correspond to the multiple of the risk zone in grey under/above "Entry" i.e it is the classic concept of Risk/Reward ratio
◾ PowerZoneTouch: sets the number of time the zone has been touched
◾ PowerZoneDensity: increase this number if you want the number of zones to increase and reversely
◾ RewardBoxLength: adjust the standard number to the length of the anticipated move in duration
◾ StopLossExtraPoints: for a W pattern (ScalpUP) will bring lower the lower border of the RewardBOX; in a M pattern (ScalpDOWN) will bring higher the higher border of the RewardBOX; it will automatically move the distance of the TP1/TP2/TP3
◾ HistoryMax: the number of units taken into account to set the PowerZONES and the past M & W patterns
◾ PatternFactor: defines a key percentage of the M & W patterns
◾ MovingAverageFilter:
◽ untick (by default) : the filter is OFF
◽ ticked : the filter is ON
◾ MovingAveragePeriod: choose the speed of the average
◾ MovingAverageType: choose among all the types of averages available
◾ Applied to: define on which available moment of the Price the average is applied (close, open, highest...)
🛠️ Calculation & Precisions
------------------------------------
🔹 TP1/TP2/TP3
the 3 risk/reward ratios: 1 / 1.5 / 2 are multiples of the height of the grey zone = distance between your StopLoss and the entry line;
🔹 %WIN
Note that the % of success (%WIN) must be entered correctly;
Your risk/reward ratio is key and more important than the % success of the signal; you can have a % success of 30% (%WIN) which creates more points earned than a % success of 60% depending on your risk/reward ratio = the position of your TPs;
🔹 Calculation of points/pips
These are full points and we don't calculate partial outputs.
So if you have a tp1 at 20 and a tp2 at 100, if you get to tp2 you get 100 and not 20+100.
Stoplosses are of course calculated in negative.
🔹 PowerZONES
The originality of our concept is to test how many times a zone has been touched
The more the market has touched this zone the more probable it becomes a strategic zone where the liquidity will accumulate and thus will be chased!
Dynamic Buy/Sell VisualizationDynamic Trend Visualization Indicator
Description:
This simple and easy to use indicator has helped me stay in trades longer.
This indicator is designed to visually represent potential buy and sell signals based on the crossover of two Simple Moving Averages (SMA). It's crafted to assist traders in identifying trend directions in a straightforward manner, making it an excellent tool for both beginners and experienced traders.
Features:
Customizable Moving Averages: Users can adjust the period length for both short-term (default: 10) and long-term (default: 50) SMAs to suit their trading strategy.
Visual Signals: Dynamic lines appear at the points of SMA crossover, with labels to indicate 'BUY' or 'SELL' opportunities.
Color and Style Customization: Customize the appearance of the buy and sell lines for better chart readability.
Alert Functionality: Alerts are set up to notify users when a crossover indicating a buy or sell condition occurs.
How It Works:
A 'BUY' signal is generated when the short-term SMA crosses above the long-term SMA, suggesting an upward trend.
A 'SELL' signal is indicated when the short-term SMA crosses below the long-term SMA, pointing to a potential downward trend.
Use Cases:
Trend Following: Ideal for markets with clear trends. For example, if trading EUR/USD on a daily chart, setting the short SMA to 10 days and the long SMA to 50 days might help in capturing longer-term trends.
Scalping: In a volatile market, setting shorter periods (e.g., 5 for short SMA and 20 for long SMA) might catch quicker trend changes, suitable for scalping.
Examples of how to use
* Short-term for Quick Trades:
SMA 5 and SMA 21:
Purpose: This combination is tailored for day traders or those looking to engage in scalping. The 5 SMA will react rapidly to price changes, providing early signals for buy or sell opportunities. The 21 SMA, being a Fibonacci number, offers a slightly longer-term view to confirm the short-term trend, helping to filter out minor fluctuations that might lead to false signals.
* Middle-term for Swing Trading:
SMA 10 and SMA 50:
Purpose: Suited for swing traders who aim to capitalize on medium-term trends. The 10 SMA picks up on immediate market movements, while the 50 SMA gives insight into the medium-term direction. This setup helps in identifying when a short-term trend aligns with a longer-term trend, providing a good balance for trades that might last several days to a couple of weeks.
* Long-term Trading:
SMA 50 and SMA 200:
Purpose: Investors focusing on long-term trends would benefit from this pair. The crossover of the 50 SMA over the 200 SMA can indicate the beginning or end of major market trends, ideal for making decisions about long-term holdings that might span months or years.
Example Strategy if not using the Buy / Sell Label Alerts:
Entry Signal: Enter a long position when the shorter SMA crosses above the longer SMA. For example:
SMA 10 crosses above SMA 50 for a medium-term bullish signal.
Exit Signal: Consider exiting or initiating a short position when:
SMA 10 crosses below SMA 50, suggesting a bearish turn in the medium-term trend.
Confirmation: Use these crossovers in conjunction with other indicators like volume or momentum indicators for better confirmation. For instance, if you're using the 5/21 combination, look for volume spikes on crossovers to confirm the move's strength.
When Not to Use:
Sideways or Range-Bound Markets: The indicator might generate many false signals in a non-trending market, leading to potential losses.
High Volatility Without Clear Trends: Rapid price movements without a consistent direction can result in misleading crossovers.
As a Standalone Tool: It should not be used in isolation. Combining with other indicators like RSI or MACD for confirmation can enhance trading decisions.
Practical Example:
Buy Signal: If you're watching Apple Inc. (AAPL) on a weekly chart, a crossover where the 10-week SMA moves above the 50-week SMA could suggest a buying opportunity, especially if confirmed by volume increase or other technical indicators.
Sell Signal: Conversely, if the 10-week SMA dips below the 50-week SMA, it might be time to consider selling, particularly if other bearish signals are present.
Conclusion:
The "Dynamic Trend Visualization" indicator provides a visual aid for trend-following strategies, offering customization and alert features to streamline the trading process. However, it's crucial to use this in conjunction with other analysis methods to mitigate the risks of false signals or market anomalies.
Legal Disclaimer:
This indicator is for educational purposes only. It does not guarantee profits or provide investment advice. Trading involves risk; please conduct thorough or consult with a financial advisor. The creator is not responsible for any losses incurred. By using this indicator, you agree to these terms.

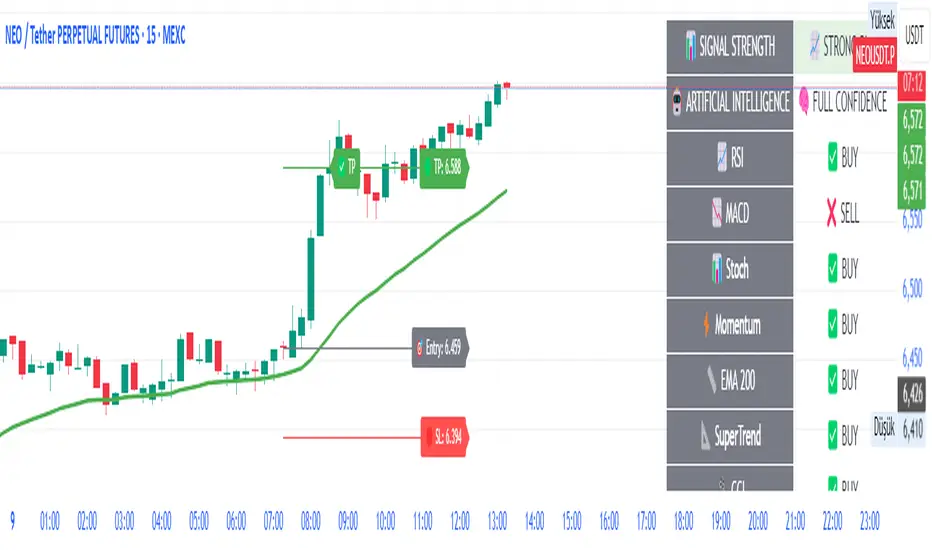
AI-Powered ScalpMaster Pro [By TraderMan]🧠 AI-Powered ScalpMaster Pro How It Works
📊 What Is the Indicator and What Does It Do?
🧠 AI-Powered ScalpMaster Pro is a powerful technical analysis tool designed for scalping (short-term, fast-paced trading) in financial markets such as forex, crypto, or stocks. It combines multiple technical indicators (RSI, MACD, Stochastic, Momentum, EMA, SuperTrend, CCI, and OBV) to identify market trends and generate AI-driven buy (🟢) or sell (🔴) signals. The goal is to help traders seize profitable scalping opportunities with quick and precise decisions. 🚀
Key Features:
🧠 AI-Driven Logic: Analyzes signals from multiple indicators to produce reliable trend signals.
📈 Signal Strength: Displays buy (bull) and sell (bear) signal strength as percentages.
✅ Success Rate: Tracks the performance of the last 5 trades and calculates the success rate.
🎯 Entry, TP, and SL Levels: Automatically sets entry points, take profit (TP), and stop loss (SL) levels.
📏 EMA Zone: Analyzes price movement around the EMA 200 to confirm trend direction.
⚙️ How Does It Work?
The indicator uses a scoring system by combining the following technical indicators:
RSI (14): Evaluates whether the price is in overbought or oversold zones.
MACD (12, 26, 9): Analyzes trend direction and momentum.
Stochastic (%K): Measures the speed of price movement.
Momentum: Checks the price change over the last 10 bars.
EMA 200: Determines the long-term trend direction.
SuperTrend: Tracks trends based on volatility.
CCI (20): Measures price deviation from its normal range.
OBV ROC: Analyzes volume changes.
Each indicator generates a buy (bull) or sell (bear) signal. If 6 or more indicators align in the same direction (e.g., bullScore >= 6 for buy), the indicator produces a strong trend signal:
📈 Strong Buy Signal: bullScore >= 6 and bullScore > bearScore.
📉 Strong Sell Signal: bearScore >= 6 and bearScore > bullScore.
🔸 Neutral: No dominant direction.
Additionally, the EMA Zone feature confirms the trend based on the price’s position relative to a zone around the EMA 200:
Price above the zone and sufficiently distant → Uptrend (UP). 🟢
Price below the zone and sufficiently distant → Downtrend (DOWN). 🔴
Price within the zone → Neutral. 🔸
🖥️ Display on the Chart
Table: A table in the top-right corner shows the status of all indicators (✅ Buy / ❌ Sell), signal strength (as %), success rate, and results of the last 5 trades.
Lines and Labels:
🎯 Entry Level: A gray line at the price level when a new signal is generated.
🟢 TP (Take Profit): A green line showing the take-profit level.
🔴 SL (Stop Loss): A red line showing the stop-loss level.
EMA Zone: The EMA 200 and its surrounding colored zone visualize the trend direction (green: uptrend, red: downtrend, gray: neutral).
📝 How to Use It?
Platform Setup:
Add the indicator to the TradingView platform.
Customize settings as needed (e.g., EMA length, risk/reward ratio).
Monitoring Signals:
Check the table: Look for 📈 STRONG BUY or 📉 STRONG SELL signals to prepare for a trade.
AI Text: Trust signals more when it says "🧠 FULL CONFIDENCE" (success rate ≥ 50%). Be cautious if it says "⚠️ LOW CONFIDENCE."
Entering a Position:
🟢 Buy Signal:
Table shows "📈 STRONG BUY" and bullScore >= 6.
Price is above the EMA Zone (green zone).
Entry: Current price (🎯 entry line).
TP: 2% above the entry price (🟢 TP line).
SL: 1% below the entry price (🔴 SL line).
🔴 Sell Signal:
Table shows "📉 STRONG SELL" and bearScore >= 6.
Price is below the EMA Zone (red zone).
Entry: Current price (🎯 entry line).
TP: 2% below the entry price (🟢 TP line).
SL: 1% above the entry price (🔴 SL line).
Position Management:
If the price hits TP, the trade closes profitably (✅ Successful).
If the price hits SL, the trade closes with a loss (❌ Failed).
Results are updated in the "Last 5 Trades" section of the table.
Risk Management:
Default risk/reward ratio is 1:2 (1% risk, 2% reward).
Always adjust position size based on your capital.
Consider smaller lot sizes for "⚠️ LOW CONFIDENCE" signals.
💡 Tips
Timeframe: Use 1-minute, 5-minute, or 15-minute charts for scalping.
Market Selection: Works best in volatile markets (e.g., BTC/USD, EUR/USD).
Confirmation: Ensure the EMA Zone trend aligns with the signal.
Discipline: Stick to TP and SL levels, avoid emotional decisions.
⚠️ Warnings
No indicator is 100% accurate. Always use additional analysis (e.g., support/resistance).
Be cautious during high-volatility periods (e.g., news events).
The success rate is based on past performance and does not guarantee future results.
Scalper's toolkit - ATR WidgetWidget specifically designed for scalping. Many settings to fit the instrument and view preferences to make it fit into your chart window how you like, even on mobile.
** I have 5 other features to add into this in the very near future, as I use this as my primary tool for Risk reward. This script will be updated in the near future as more features are coded into it. See bottom for notes on plans
Features:
Displays a quick view of the ATR value on the chart, in decimal PIPs or directly in Points - a key value for scalping using the DOM for point value settings and one click trading on fast time frames.
Automatic calculation of stop and target distance for a predetermined Risk Reward Ratio (Set with the settings panel), and then also displayed in PIPs or Points for easy use in quick trading.
Works on most all instruments/pairs/cryptos with multiple precision levels for correct values to be shown in the widget.
Fully customizable -
ATR period Base setting, just like a normal ATR indicator
Display in : PIPs or Points
ATR based stop distance, using a multiplier. 2 is the most common multiplier used, and the default setting.
Risk Reward Calculation using the Stop Loss value.
-Quickly helps with proper target and stop sizing for the volatility in the price on the current trade entry point.
-Set to any ratio you wish, from 1:0.1 all the way to 1:100 or more, unlimited R ratio settings to fit your strategy and risk tolerances.
Position anywhere on the chart window with 9 preset locations available (Pine script limitation)
Show as a column layout or a row layout
Customize the Size, with 5 preset widget sizes, from tiny to huge (Pine script limitation)
-Mobile Friendly - Tiny or Small may be too small on PC, but can be used for Mobile so the widget does not become too large over the chart.
Custom text, background, and boarder colors
Custom Boarder Size - 0 size is no boarder
Set up:
-Open the settings panel.
First section is the basic settings for the ATR - the length (Default is 14) and to use a PIP value display, or Point value display.
Here you also see a "Precision" Setting. **Because each instrument returns different precision ATR values, it is difficult to determine with code what those values will be ahead of time to do the math in the background. Even some 2 decimal instruments return 5 decimal ATR values, so this setting filters that** Just use the dropdown and choose how many decimal places the instrument has from 2 - 5 decimals
The second section is for risk and reward calculations, and can be disabled if you do not want to see these values.
The first value is the "ATR Multiplier" Typically, a 2x multiplier is used on the ATR to determine how far away to place your stop loss from the entry, placing it out of harm's way from normal market activity.
The second value is the Reward target distance, based from the stop loss size. This quickly calculates your target to match your intended reward ratio, saving some manual work to calculate this by hand every trade.
** Note: because of the math used in the code, you may see odd values on some instruments, like indexes. If you have the precision correct, try changing the "Show in Pips" to "Show in Points", as this may solve the issue.
The last two sections are purely for how the widget looks and how/where it shows on the screen. These can be set however you like. To have no boarder, just set the "Frame size" value to 0.
Additional Updates planned:
Pip value calculation (2 feature uses)
-This will serve 2 purposes. The widget will calculate the value of the trade based on the lot size. It will also have a risk limit, so if the ATR get's too high for the current risk settings, It will show red to warn you of a high risk situation before you trade.
Example, you have a set limit of 3 dollars per trade using .02 lot sizing. If the ATR get's too high, The Stop value will be more risk than you would like to use at that trade sizing. Reduce the trade size, or wait for ATR to come lower.
Purpose 2: lot size calculation, so if you wanted to maximize the use of risk available. If you wanted to risk 600 for example, it would use the ATR you have set for the risk, and determine the proper lot size for the amount of volatility in the market. This way, you Risk Exactly, or as close as possible to 600 for the the current trade conditions.
Extra use for this value: Show the Current trade amounts at risk and for gain in money values on the side of the pip/point value. Know what you're risking and also trading for in monetary value.
ATR candle Comparison- Early momentum Detection (2 feature uses)
Will show an additional section on the bottom of the widget to show how each candle compares to the one before, up to the last 5, and show if ATR went down, up, or stayed the same over the last 5 candles.
Show an additional symbol to indicate the current candle status in comparison to the close of the last candle. Real time of if the ATR is getting larger, smaller, or staying the same.

AI Scalping Signals# 🤖 AI-Powered Scalping Indicator - Ultra-Fast Trading Signals
## Overview
This advanced AI-driven **scalping indicator** is specifically engineered for high-frequency traders operating on smaller timeframes. Designed exclusively for **1-minute, 3-minute, and 5-minute charts**, this system combines multiple sophisticated technical analysis methods to identify rapid-fire, high-probability trade entries and exits. The AI algorithms analyze market momentum, micro-trend strength, and instant price dynamics in real-time, delivering lightning-fast BUY and SELL signals perfect for scalping strategies.
## Key Features
### ✨ AI-Enhanced Scalping Signal Generation
- **Machine Learning Integration**: Proprietary AI algorithms process multiple technical indicators simultaneously with millisecond precision to catch quick market moves
- **Smart Cross-Validation**: The AI system validates signals across multiple micro-conditions before generating alerts, perfect for fast-paced scalping
- **Adaptive Micro-Trend Analysis**: Intelligent momentum and trend detection optimized specifically for 1M, 3M, and 5M timeframes
- **Low-Latency Processing**: Designed for speed—signals generate instantly when conditions align for rapid trade execution
### 📊 Clean Visual Interface for Fast Trading
- **Crystal Clear Signals**: Easy-to-read BUY (green) and SELL (red) labels appear directly on your chart—no delay, no confusion
- **Background Confirmation**: Subtle background highlighting provides additional visual confirmation of scalping signals
- **No Chart Clutter**: The indicator focuses on signals only—no unnecessary lines or plots to distract from rapid price action and quick decision-making
- **Optimized for Speed**: Minimalist design allows you to spot and execute trades in seconds
### 🔔 Comprehensive Alert System for Scalpers
- **Real-Time Notifications**: Get instantly notified when AI-confirmed BUY or SELL signals are generated—critical for scalping success
- **Multi-Alert Options**: Separate alerts for buy signals, sell signals, or combined alerts for any scalping opportunity
- **Never Miss a Quick Move**: Set up alerts and let the AI monitor rapid market movements 24/7
- **Mobile-Friendly**: Receive alerts on your phone for on-the-go scalping
## How It Works
The indicator employs a sophisticated multi-layer analysis system optimized for scalping:
1. **Micro-Trend Analysis Layer**: AI algorithms analyze rapid trend shifts using advanced moving average techniques calibrated for small timeframes
2. **Momentum Spike Detection**: Smart momentum oscillators identify instant overbought and oversold conditions with scalping-level precision
3. **Price Action Validation**: Proprietary price cross-detection ensures signals align with actual market microstructure movements
4. **AI Flash Confirmation**: All conditions are processed through ultra-fast AI validation logic for immediate signal generation
### Signal Conditions
**🟢 BUY Signal (Long Scalp Entry)**
Generated when the AI system confirms:
- Bullish micro-trend alignment detected
- Price momentum shows instant strength above key thresholds
- AI-validated upward price breakout occurs on small timeframe
- Multiple technical confirmations align simultaneously for quick profit potential
**🔴 SELL Signal (Short Scalp Entry)**
Generated when the AI system confirms:
- Bearish micro-trend alignment detected
- Price momentum shows instant weakness below key thresholds
- AI-validated downward price breakdown occurs on small timeframe
- Multiple technical confirmations align simultaneously for quick profit potential
## Best Practices for Scalping
### Recommended Usage
- **⚡ Optimal Timeframes**: Specifically calibrated for **1-minute, 3-minute, and 5-minute charts** for maximum scalping performance
- **Markets**: Highly effective on forex pairs (especially majors), crypto (BTC, ETH), and high-liquidity stocks and indices
- **Session Focus**: Best results during high-volume trading sessions (London/NY overlap for forex, market open for stocks)
- **Quick Execution**: This is a scalping tool—execute trades immediately when signals appear
- **Risk Management**: Use tight stop-losses (5-15 pips for forex) and quick take-profits; scalping requires strict risk control
### Scalping Strategy Tips
- Execute trades instantly—scalping requires fast action within seconds of signal generation
- Use 1:1 or 1:2 risk-reward ratios for consistent scalping profits
- Monitor spreads and commissions—they matter significantly for scalpers
- Trade during high liquidity hours to ensure tight spreads and quick fills
- Consider trading multiple signals per session for accumulated gains
- Set mobile alerts to catch quick opportunities throughout the day
- Close positions quickly—don't let scalps turn into swing trades
- The background color change provides a split-second early warning system
## What Makes This Scalping Indicator Different?
Unlike traditional indicators designed for longer timeframes, this AI-powered scalping tool:
- ✅ **Built Exclusively for Scalping**: Optimized specifically for 1M, 3M, and 5M timeframes—not a generic indicator
- ✅ Combines multiple technical analysis methods with millisecond-precision AI processing
- ✅ Uses artificial intelligence to filter noise and validate only the fastest, cleanest scalping signals
- ✅ Eliminates the need to manually analyze multiple indicators during rapid market moves
- ✅ Provides clear, actionable signals with no interpretation required—critical for scalping speed
- ✅ Reduces false signals through multi-condition validation tuned for small timeframes
- ✅ Adapts to rapid volatility changes and micro-trend shifts in real-time
- ✅ Zero lag—signals appear instantly when conditions align for immediate execution
## Important Disclaimers
⚠️ **Scalping Risk Warning**: Scalping involves extremely high frequency trading with substantial risk of loss. This indicator is a tool to assist with fast-paced analysis and should not be the sole basis for trading decisions. Scalping requires experience, discipline, and proper risk management.
⚠️ **No Guarantee**: Past performance and backtested results do not guarantee future performance. No indicator is 100% accurate, especially in volatile scalping conditions.
⚠️ **Due Diligence**: Always conduct your own research and analysis. Use proper risk management with every single trade. Never risk more than 1-2% of your account per scalp trade.
⚠️ **Transaction Costs**: Be aware that scalping involves frequent trading, which means higher commission and spread costs. Ensure your broker offers competitive pricing for high-frequency trading.
⚠️ **Educational Tool**: This indicator is designed as an educational and analytical tool for experienced traders. Users are solely responsible for their own trading decisions.
## Settings & Customization
This is a **protected scalping indicator** with optimized parameters locked specifically for 1-minute, 3-minute, and 5-minute chart performance. The AI algorithms have been fine-tuned through extensive backtesting and live scalping optimization. No manual adjustments are needed—simply add to your small timeframe chart and start receiving rapid-fire signals.
## Support & Updates
This indicator receives regular updates to enhance AI algorithms and improve signal accuracy. For questions or support, please contact the publisher.
---
**Ready to dominate the scalping game with AI-powered lightning-fast signals?** Add this indicator to your 1M, 3M, or 5M chart and experience the difference of intelligent, validated scalping signals designed for rapid-fire trading.
*Remember: Scalping success requires lightning-fast execution, strict discipline, proper risk management, and continuous practice. Use this tool as part of a comprehensive scalping strategy with tight stop-losses and realistic profit targets.*

LNL Scalper ArrowsLNL Scalper Arrows
The indicator consist of various different types of candlestick patterns that are truly time tested by multiple veteran traders. These arrows are a combination of short-term scalping strategies taught by Linda Raschke & a trader that goes by name Quant Trade Edge. These strategies/patterns occur regularly within the markets. They offer high probability quick moves during the trending days. These four patterns are based on pure price action, no oscillators, no trend, no momentum indicators involved. Trend (ema) is there just as a simple trend gauge.
LNL Scalper Arrows were designed specifically for intra-day trading. Mostly useful for the futures but also stocks as well. These arrows can work anywhere between the fast-moving 512 or 1600 tick charts to a 1min, 2min and up to 5min or 10min charts.
Trend Gauge (Exponential Moving Average)
Nothing fancy just a classic EMA that can guide the direction of the short-term trend. I have added a custom coloring of the EMA that is based on a simple RSI filter. That should help to visualize the non-directional moments within the trend. Although the length is adjustable, for scalping it is better to focus on smaller periods such as 9, 13 or 20 or 34 but anything above 50 loses its purpose as a short-term trend gauge. Again, this is a scalping tool not a trend tool, you are not going to get rid of the fakeouts by increasing the period of the trend.
Tail Arrows (Eat the Tail Pattern)
Tail is a candlestick that is either a price rejection spike, or a flag continuation pattern on a lower time frame. A failed action. It is basically a candle with much bigger wick (shadow) of the candle than the actual body. Such candles are usually telling us about strong participation from the other side of the market. Eat the tail pattern occurs whenever the low of the Tail candle is immediately broken on a following candle "the tail is eaten alive". Such a breaks occurs in a most aggressive types of markets with a strong momentum. DO NOT try to trade this in a low volume or a ranging market. Tail Arrows are the most aggressive arrows & should be only used on the highest volume or a parabolic momentum markets.
Scalp Arrows (Scallop Pattern)
Known as Scallops or minor lows or highs, these patterns are the most common within the all scalper arrows. They occur regularly on 1min & 5min charts - basically everyday. Scallops provide the best possible risk to reward entry within the trend without the need of any indicators or oscillators. The Scallop Up 3 bar pattern consist of a high that is lower that the previous high but also low that is lower than the previous low. Scallop Up or a minor low triggers when the last high is broken, creating a three bar mountain or a peak within the 5 bar span.
Hoagie Arrows (Hoagie Pattern)
Hoagies occur way less often than any other scalping patterns. Hoagies represent two (or more) inside candles within the shadow of a first candle. Such a formation is creating a small compression or a range that sooner or later breaks out. The hoagie is triggered whenever the high or low of the shadow (first) candle is broken. The great thing about the hoagies is that they can work either way despite the trend direction. Although this indicator is coded for the 2 bar hoagies, there are no limitations on how much inside bars can hoagie include.
Umbrella Arrows (Umbrella Pattern)
Another really awesome 3 bar pattern that is really fun to trade. Umbrella occurs when the candle before the previous candle is a pin bar or a tail bar and the body of the previous candle is within the shadow or a wick of the candle before. The umbrella is triggered once the high or low of the previous bar is broken. Umbrellas are more frequent than Hoagies but occur much less than the Scallops.
Outside Bar Wedges (Outside Bar Pattern)
Pretty much self-explanatory candlestick pattern. Outside Bar is basically any bar that peaks outside of the both ends of the previous candle. So the range of the candle is higher & it looked beyond the high and beyond the low of the previous candle. These candles are signalizing the potenial momentum change. Ouside Bars usually occur at the tops or bottoms of the moves. I decided to add them because they can serve as a great addition to these scalping patterns.
Signal vs. SignalBreak Mode
The trigger can be viewed in two different ways:
1. Signal: Plots the trigger before the trigger bar, basically right when the pattern is formed but NOT YET triggered. The signal is triggered once the next candle break the high or low of the current candle.
2. SignalBrake: Plots the trigger after the break of the high or low of the actual pattern. It is basically a candle after the signal candle. (Signal is better for trading because it gives you time to prepare for the actual break of the high or low = the actual signal. SignalBrake is great for looking back in history only for the patterns that actually traded).
Pin Bar BTW Ratio
Pin Bar (Body-To-Wick) Ratio represents the size of the body of a pin bar candle for Eat the Tail and Umbrella patterns. Pin Bar BTW Ratio measures the ratio between the wick & the body of the candle. Ref. interval is 2.0 - 5.0 (ideal pin bar is 2.0 - 3.0 = the wick or a shadow is 2x - 3x bigger than the body of the candle)
ATR Stop & Target Labels
I also created three simple labels (tables) that can show you the ideal target & stop as well as the current ATR. Since LNL Scalper Arrows consist of high probability scalping patterns, a good rule of thumb to follow is to use a half of the current ATR as a target and a current ATR as a stop (or two times the target). So if the current 7 period ATR is 30 the target would be 15 pts. and a stop around 30 pts. With such a risk management you should aim for a win rate 70% or higher. Obviously you can adjust the risk management in the settings to your personal preference.
Low Range vs. High Range Markets
There are two major downsides with the Scalper Arrows:
1. You need volume and a volatility. These patterns really do struggle in ranging "boring" sideways action. It is absolutely crucial to recognize the current market environment and really stay cautions and (or completely out) in case the chop continues. Adding something like DMI can help you recognize the potential flat markets.
2. Not only do you need volume & momentum, you also need a decent range. This indicator works better on a rangy market such as NQ futures or YM. But are much tougher to trade on lower range markets such as some stocks or ZB futures or basically any other lower range market.
Hope it helps.

Ayman Entry Signal – Ultimate PRO (Scalping Gold Settings)1. Overview
This indicator is a professional gold scalping tool built for TradingView using Pine Script v6.
It combines multiple price action and technical filters to generate high-probability Buy/Sell signals with built-in trade management features (TP1, TP2, SL, Break Even, Partial Close, Stats tracking).
It is optimized for XAUUSD but can be applied to other assets with proper setting adjustments.
2. Key Features
Multi-Condition Trade Signals – EMA trend, Break of Structure, Order Blocks, FVG, Liquidity Sweeps, Pin Bars, Higher Timeframe confirmation, Trend Cloud, SMA Cross, and ADX.
Full Trade Management – Auto-calculates lot size, SL, TP1, TP2, Break Even, Partial Close.
Dynamic Chart Drawing – Entry lines, SL/TP lines, trade boxes, and real-time PnL.
Statistics Panel – Tracks wins, losses, breakeven trades, and total PnL over selected dates.
Customizable Filters – All filters can be turned ON/OFF to match your strategy.
3. Main Inputs & Settings
Account Settings
Capital ($) – Total trading capital.
Risk Percentage (%) – Risk per trade.
TP to SL Ratio – Risk-to-reward ratio.
Value Per Point ($) – Value per pip/point for lot size calculation.
SL Buffer – Extra points added to SL to avoid stop hunts.
Take Profit Settings
TP1 % of Full Target – Fraction of TP1 compared to TP2.
Move SL to Entry after TP1? – Activates Break Even after TP1.
Break Even Buffer – Extra points when moving SL to BE.
Take Partial Close at TP1 – Option to close half at TP1.
Signal Filters
ATR Period – For SL/TP calculation buffer.
EMA Trend – Uses EMA 9/21 crossover for trend.
Break of Structure (BoS) – Requires structure break confirmation.
Order Block (OB) – Validates trades within OB zones.
Fair Value Gap (FVG) – Confirms trades inside FVGs.
Liquidity Sweep – Checks if liquidity zones are swept.
Pin Bar Confirmation – Uses candlestick patterns for extra confirmation.
Pin Bar Body Ratio – Controls strictness of Pin Bar filter.
Higher Timeframe Filters (HTF)
HTF EMA Confirmation – Confirms lower timeframe trades with higher timeframe trend.
HTF BoS – Confirms with higher timeframe structure break.
HTF Timeframe – Selects higher timeframe.
Advanced Filters
SuperTrend Filter – Confirms trades based on SuperTrend.
ADX Filter – Filters out low volatility periods.
SMA Cross Filter – Uses SMA 8/9 cross as filter.
Trend Cloud Filter – Uses EMA 50/200 as a cloud trend filter.
4. How It Works
Buy Signal Conditions
EMA 9 > EMA 21 (trend bullish)
Optional filters (BoS, OB, FVG, Liquidity Sweep, Pin Bar, HTF confirmations, ADX, SMA Cross, Trend Cloud) must pass if enabled.
When all active filters pass → Buy signal triggers.
Sell Signal Conditions
EMA 9 < EMA 21 (trend bearish)
Same filtering process but for bearish conditions.
When all active filters pass → Sell signal triggers.
5. Trade Execution & Management
When a signal triggers:
Lot size is auto-calculated based on risk % and SL distance.
SL is placed beyond recent swing high/low + ATR buffer.
TP1 and TP2 are calculated from the SL using the reward-to-risk ratio.
Break Even: If enabled, SL moves to entry price after TP1 is hit.
Partial Close: If enabled, half of the position closes at TP1.
Trade Exit: Full exit at TP2, SL hit, or partial close at TP1.
6. Chart Display
Entry Line – Shows entry price.
SL Line – Red dashed line at stop loss level.
TP1 Line – Lime dashed line for TP1.
TP2 Line – Green dashed line for TP2.
PnL Labels – Displays real-time profit/loss in $.
Trade Box – Visual area showing trade range.
Pin Bar Shapes – Optional, marks Pin Bars.
7. Statistics Panel
Stats Header – Shows “Stats”.
Total Trades
Wins
Losses
Breakeven Trades
Total PnL
Can be reset or filtered by date.
8. How to Use
Load the Indicator in TradingView.
Select Gold (XAUUSD) on your preferred scalping timeframe (1m, 5m, 15m).
Adjust settings:
Use default gold scalping settings for quick start.
Enable/disable filters according to your style.
Wait for a Buy/Sell alert.
Confirm visually that all desired conditions align.
Place trade with calculated lot size, SL, and TP levels shown on chart.
Let trade run – the indicator manages Break Even & Partial Close if enabled.
9. Recommended Timeframes
Scalping: 1m, 5m, 15m
Day Trading: 15m, 30m, 1H
Swing: 4H, Daily (adjust settings accordingly)

Short Only Anytime ScalperThis indicator works best in a 2-minute timeframe.
I designed this indicator to work with my proprietary scalping strategy where I use candlestick anatomy, price action, and moving averages to determine potential short entries.
Rules I use for using this indicator:
- I turn the 20MA green
- I turn the 200MA red
- I only take a short entry on the FIRST yellow or red candle painted once the 20MA comes back down crossing the 200MA once the candle fully closes red or yellow from the indicator
- The gap between the 20MA and the 200MA MUST be close (the closer the gap is the stronger the short entry can be). Note: It can be considered a false signal if the bar is colored yellow or red when the gap is far within the 20MA and the 200MA.
- My stop loss is the red line right on the top of the True Bear Bar (red) or Partial True bear bar (yellow)
- My take profit is always at 0.04% (green dots) and then I watch price action, when price action moves under my 0.04% I quickly move to stop loss to that level locking in profit while allowing profit to ride. (This indicator is meant to use in quick price action and I am usually in and out of a trade in 5 minutes or even sooner)
How to read the indicator
- Yellow painted bar at candle close: Partial True Bear Bar
- Red painted bar at candle close: True Bear Bar
- Red line painted on top of candle: Stop loss
- Green dot with green label and price: Goal profit area no matter what
You will notice that sometimes depending on the size of the bear bar, the R:R is very off compared to traditional trading, this is because this is a very quick scalping strategy that either locks in 0.04% no leverage gain or quickly puts stop loss at that level to then let profits ride.

Z.A.H.It's a scalping script, which can be used using Heikin Ashi candle on 5min time frame (I personally use it for BINANCE:BTCUSDT and BINANCE:ETHUSDT scalping).
We've tried to include SL and target (1.5R and 2R) in this as well, and it works well but sometimes (please note SOMETIMES..SOMETIMES, it can be few..few pips here and there)
Idea is simple, you take the trade based on the signal given by the script and place your SL as per the script and then target 1.5R for 80% of your position and 20% for the remaining 20% of your position.
One extra thing which I've found useful is, you can use Awesome Oscillator (default setting) as well for placing SLs. If you use this method for placing SL, then just place your SL at the last green awesome oscillator candle for shorts and at the last red awesome oscillator candle for longs. From there target 1.5R and 2R.
Overall results are same for either, so you can use it as per your convenience. For any query, you can send me a DM on discord or twitter.
Crypto SniperAn easy to follow indicator for scalping or long term trades. You can add this indicator to other analysis as a complementary indicator or use it alone for entry and exit your trades.
Features
• Simple entry signals, buy the contract at the end of the signal candle
• Additional entry signals can be enabled to increase your position and your profits
• Get exit signals for your opened trades.
• Alert conditions for all entries, additional entries and exits
• Enable ATR plot of Take Profit and Stop Loss
• Customize your ATR settings to adapt the indicator to any market
This indicator use some analysis to get the bottom/top of the cycles. Any market or timeframe and can be used. Specially designed for scalping on cryptocurrency futures markets.
Enhanced Scalping IndicatorEnhanced Scalping Indicator - Professional Multi-Confirmation Trading System
Overview
The Enhanced Scalping Indicator is a sophisticated trading tool designed for short-term traders seeking high-probability entry and exit signals. This indicator combines multiple technical analysis techniques with adaptive market conditions to filter noise and identify optimal trading opportunities.
Key Features
🎯 Multi-Confirmation Signal System
- Enhanced RSI with Adaptive Thresholds: Dynamic overbought/oversold levels that adjust based on market volatility (ATR)
- Higher Timeframe Confirmation: Uses 1-hour RSI to validate signals from lower timeframes
- Volume-Weighted Momentum: Incorporates volume analysis to confirm price movements
- Market Structure Analysis: Evaluates price position within recent 20-bar range
📊 Advanced Signal Generation
- Buy Signals: Triggered when RSI is oversold with upward momentum, confirmed by higher timeframe bearish conditions and strong volume
- Sell Signals: Activated when RSI is overbought with downward momentum, validated by higher timeframe bullish conditions and high volume
- Exit Signals: Smart exit conditions based on RSI mean reversion and momentum shifts
🔄 Divergence Detection (Optional)
- Bullish Divergence: Identifies when price makes lower lows while RSI makes higher lows
- Bearish Divergence: Spots when price makes higher highs while RSI makes lower highs
- Volume Confirmation: All divergence signals require above-average volume for validation
⚙️ Customizable Parameters
- RSI Settings: Adjustable length (default: 14) and source
- Moving Average Options: Choose from SMA, EMA, SMMA, WMA, VWMA, or Bollinger Bands
- Higher Timeframe: Configurable confirmation timeframe (default: 1 hour)
- ATR Period: [
/b] Volatility measurement period for adaptive thresholds
📈 Visual Elements
- Dynamic Threshold Lines: Adaptive overbought/oversold levels
- Signal Shapes: Clear buy/sell and exit signals on chart
- Background Highlighting: Color-coded background for active signals
- Real-time Information Table: Displays current RSI, higher timeframe RSI, volatility ratio, market position, and momentum
🚨 Alert System
Complete alert functionality for:
- Enhanced buy signals
- Enhanced sell signals
- Long position exits
- Short position exits
Best Use Cases
- Scalping: 1-5 minute timeframes for quick trades
- Day Trading: 15-30 minute timeframes for intraday positions
- Swing Trading: Higher timeframes with divergence detection enabled
Market Conditions
Works effectively in:
- T rending Markets: Momentum and higher timeframe filters reduce false signals
- Range-bound Markets: Adaptive thresholds adjust to market volatility
- High Volume Sessions: Built-in volume filters ensure signal quality
Strategy Integration
This indicator works well with:
- Support/resistance levels
- Price action analysis
- Risk management rules (stop losses, position sizing)
- Market session awareness (built-in US market hours filter)
Technical Implementation
- Built on Pine Script v6
- Utilizes proper RMA calculations for RSI
- Implements consistent historical data access
- Optimized for performance with minimal repainting
Risk Disclaimer
This indicator is a technical analysis tool and should not be used as the sole basis for trading decisions. Always combine with proper risk management, fundamental analysis, and your trading strategy. Past performance does not guarantee future results.
---
Perfect for: Scalpers, day traders, and swing traders looking for a comprehensive, multi-confirmation trading system with built-in risk management features.

Soul Button Scalping (1 min chart) V 1.0Indicator Description
- P Signal: The foundational buy signal. It should be confirmed by observing RSI divergence on the 1-minute chart.
- Green, Orange, and Blue Signals: Three buy signals generated through the combination of multiple oscillators. These signals should also be cross-referenced with the RSI on the 1-minute chart.
- Big White and Big Yellow Signals: These represent strong buy signals, triggered in extreme oversold conditions.
- BEST BUY Signal: The most reliable and powerful buy signal available in this indicator.
____________
Red Sell Signal: A straightforward sell signal indicating potential overbought conditions.
____________
Usage Guidance
This scalping indicator is specifically designed for use on the 1-minute chart, incorporating data from the 5-minute chart for added context. It is most effective when used in conjunction with:
• VWAP (Volume Weighted Average Price), already included in the indicator.
• RSI on the 1-minute chart, which should be opened as a separate indicator.
• Trendlines, structure breakouts, and price action analysis to confirm signals.
Intended for Crypto Scalping:
The indicator is optimized for scalping cryptocurrency markets.
____________
Future Enhancements:
• Integration of price action and candlestick patterns.
• A refined version tailored for trading futures contracts, specifically ES and MES in the stock market.

TechniTrendMasterIntroducing "TechniTrendMaster"
The TechniTrendMaster indicator is designed to bring clarity and depth to your trading strategy. This indicator combines robust trend analysis with volume insights, giving you a comprehensive view of the market’s pulse. Let's break down the features.
🔵 Analysis Mode
TechniTrendMaster's Analysis Mode provides various configurations tailored to specific market behaviors. Here are the options you can utilize:
🔹Strong Movements: Focuses on powerful market shifts, ideal for capturing major trend changes and high-momentum moves. Perfect for identifying strong breakout opportunities.
🔹Reversal: Detects potential turning points in the market, signaling when a trend might be about to change direction, allowing for well-timed entries and exits.
🔹Consolidations: Spots periods of low volatility where the market moves sideways, helping you avoid trading traps and anticipate breakout scenarios.
🔹Momentum-Driven: Prioritizes momentum in the market, identifying when the force behind price movement is accelerating or decelerating.
🔹Balanced: Offers a well-rounded view of the market by weighing both trend direction and volume equally, making it suitable for stable market conditions.
🔹Volatility Adapted: Adjusts to periods of increased or decreased volatility, providing accurate signals regardless of market conditions.
🔹Trend Confirmation: Confirms the strength and sustainability of a trend, allowing traders to enter trades with higher confidence.
🔹Short-Term Scalping: Tailored for traders who focus on Short-Term and Scalp trades, offering rapid insights for intraday or short-term trading strategies.
🔵 Trend Analysis Mode
The Trend Analysis Mode allows you to customize how trends are detected and analyzed:
🔹Default: A balanced mode for general use, offering reliable trend identification across different market conditions.
🔹Aggressive: A more sensitive setting that reacts quickly to market changes, ideal for traders looking to capitalize on smaller, quicker movements.
🔹Conservative: Takes a cautious approach, favoring long-term stability over short-term fluctuations, perfect for risk-averse traders.
🔹Volatility Aware: Focuses on adapting to volatility shifts, giving accurate trend signals even in erratic markets.
🔹Range Bound: Targets horizontal price movements and channel trades, helping traders take advantage of well-defined ranges.
🔵 Divergence
Divergence is a powerful tool within TechniTrendMaster, highlighting discrepancies between price movement and underlying volume. These differences can indicate potential reversals or trend continuations before they are visible on price charts alone.
🔵 Hidden Divergence
Hidden divergence is a subtle yet crucial signal that reveals when an existing trend might resume after a temporary correction. This mode provides early detection of trend continuity opportunities, giving traders a significant advantage in timing.
🔵 Divergence Mode
TechniTrendMaster includes different divergence detection settings to suit your analysis style:
🔹Standard: Captures typical divergence patterns for general analysis.
🔹Short-Term Focused: Concentrates on short-lived divergences, offering rapid detection of shifts for active traders.
🔹Long-Term Analysis: Highlights divergence in a broader context, which is better for understanding the overall market direction.
🔹High Sensitivity: Prioritizes capturing even the smallest shifts in the market, making it excellent for high-frequency trading or volatile environments.
🔹Low Sensitivity: Reduces market noise, only reacting to more significant changes in trend or volume. It’s perfect for traders who seek higher accuracy with fewer false signals.
🔵 Dynamic Channel
TechniTrendMaster features a Dynamic Channel, that automatically adapts to market conditions. This channel provides a visual guide to price action, adjusting in real-time based on current trends and volatility. It identifies key support and resistance zones, making it easier to spot breakouts, trend continuations, or potential reversals.
🔵 Volume Integration
Volume is a critical part of TechniTrendMaster, offering deeper insights beyond just price movement. By analyzing volume patterns alongside trends, the indicator highlights the strength and reliability of market shifts. This integration ensures that traders can distinguish between genuine movements backed by solid volume and weak trends that might not hold.
🔵 A Solution for All Trading Styles
TechniTrendMaster’s strength lies in its versatility. No matter your trading approach—be it scalping, swing trading, trend following, or range trading—this indicator adapts to your needs. Here's how it caters to different trader profiles:
🔹Scalpers get precise, quick-response insights through the Short-Term Scalping and High Sensitivity settings, helping them capture minute price movements.
🔹Swing Traders benefit from modes like Reversal, Balanced, and Momentum-Driven, which focus on identifying trends and shifts that occur over several days.
🔹Long-Term Investors will find the Conservative, Low Sensitivity, and Long-Term Analysis modes ideal for filtering noise and sticking to broader market trends.
🔹Volatility Traders can rely on the Volatility Adapted and Volatility Aware options to get accurate signals even during unpredictable periods.
🔓 Unlock Access :
Check out the Author's Instructions or Dm me to Unlock the Access.

EMA Scalping StrategyEMA Slope Indicator Overview:
The indicator plots two exponential moving averages (EMAs) on the chart: a 9-period EMA and a 15-period EMA.
It visually represents the EMAs on the chart and highlights instances where the slope of each EMA exceeds a certain threshold (approximately 30 degrees).
Scalping Strategy:
Using the EMA Slope Indicator on a 5-minute timeframe for scalping can be effective, but it requires adjustments to account for the shorter time horizon.
Trend Identification: Look for instances where the 9-period EMA is above the 15-period EMA. This indicates an uptrend. Conversely, if the 9-period EMA is below the 15-period EMA, it suggests a downtrend.
Slope Analysis: Pay attention to the slope of each EMA. When the slope of both EMAs is steep (exceeds 30 degrees), it signals a strong trend. This can be a favorable condition for scalping as it suggests potential momentum.
Entry Points:
For Long (Buy) Positions: Consider entering a long position when both EMAs are sloping upwards strongly (exceeding 30 degrees) and the 9-period EMA is above the 15-period EMA. Look for entry points when price retraces to the EMAs or when there's a bullish candlestick pattern.
For Short (Sell) Positions: Look for opportunities to enter short positions when both EMAs are sloping downwards strongly (exceeding -30 degrees) and the 9-period EMA is below the 15-period EMA. Similar to long positions, consider entering on retracements or bearish candlestick patterns.
Exit Strategy: Use tight stop-loss orders to manage risk, and aim for small, quick profits. Since scalping involves short-term trading, consider exiting positions when the momentum starts to weaken or when the price reaches a predetermined profit target.
Risk Management:
Scalping involves high-frequency trading with smaller profit targets, so it's crucial to implement strict risk management practices. This includes setting stop-loss orders to limit potential losses and not risking more than a small percentage of your trading capital on each trade.
Backtesting and Optimization:
Before implementing the strategy in live trading, backtest it on historical data to assess its performance under various market conditions. You may also consider optimizing the strategy parameters (e.g., EMA lengths) to maximize its effectiveness.
Continuous Monitoring:
Keep a close eye on market conditions and adjust your strategy accordingly. Market dynamics can change rapidly, so adaptability is key to successful scalping.

Smart Money Precision Structure [BullByte]Smart Money Precision Structure
Advanced Market Structure Analysis Using Institutional Order Flow Concepts
---
OVERVIEW
Smart Money Precision Structure (SMPS) is a comprehensive market analysis indicator that combines six analytical frameworks to identify high-probability market structure patterns. The indicator uses multi-dimensional scoring algorithms to evaluate market conditions through institutional order flow concepts, providing traders with professional-grade market analysis.
---
PURPOSE AND ORIGINALITY
Why This Indicator Was Developed
• Addresses the gap between retail and institutional analysis methods
• Consolidates multiple analysis techniques that professionals use separately
• Automates complex market structure evaluation into actionable insights
• Eliminates the need for multiple indicators by providing comprehensive analysis
What Makes SMPS Original
• Six-Layer Confluence System - Unique combination of market regime, structure, volume flow, momentum, price action, and adaptive filtering
• Institutional Pattern Recognition - Identifies smart money accumulation and distribution patterns
• Adaptive Intelligence - Parameters automatically adjust based on detected market conditions
• Real-Time Market Scoring - Proprietary algorithm rates market quality from 0-100%
• Structure Break Detection - Advanced pivot analysis identifies trend reversals early
---
HOW IT WORKS - TECHNICAL METHODOLOGY
1. Market Regime Analysis Engine
The indicator evaluates five core market dimensions:
• Volatility Score - Measures current volatility against 50-period historical baseline
• Trend Score - Analyzes alignment between 8, 21, and 50-period EMAs
• Momentum Score - Combines RSI divergence with MACD signal alignment
• Structure Score - Evaluates pivot point formation clarity
• Efficiency Score - Calculates directional movement efficiency ratio
These scores combine to classify markets into five regimes:
• TRENDING - Strong directional movement with aligned indicators
• RANGING - Sideways movement with mixed directional signals
• VOLATILE - Elevated volatility with unpredictable price swings
• QUIET - Low volatility consolidation periods
• TRANSITIONAL - Market shifting between different regimes
2. Market Structure Analysis
Advanced pivot point analysis identifies:
• Higher Highs and Higher Lows for bullish structure
• Lower Highs and Lower Lows for bearish structure
• Structure breaks when established patterns fail
• Dynamic support and resistance from recent pivot points
• Key level proximity detection using ATR-based buffers
3. Volume Flow Decoding
Institutional activity detection through:
• Volume surge identification when volume exceeds 2x average
• Buy versus sell pressure analysis using price-volume correlation
• Flow strength measurement through directional volume consistency
• Divergence detection between volume and price movements
• Institutional threshold alerts when unusual volume patterns emerge
4. Multi-Period Momentum Synthesis
Weighted momentum calculation across four timeframes:
• 1-period momentum weighted at 40%
• 3-period momentum weighted at 30%
• 5-period momentum weighted at 20%
• 8-period momentum weighted at 10%
Result smoothed with 6-period EMA for noise reduction.
5. Price Action Quality Assessment
Each bar evaluated for:
• Range quality relative to 20-period average
• Body-to-range ratio for directional conviction
• Wick analysis for rejection pattern identification
• Pattern recognition including engulfing and hammer formations
• Sequential price movement analysis
6. Adaptive Parameter System
Parameters automatically adjust based on detected regime:
• Trending markets reduce sensitivity and confirmation requirements
• Volatile markets increase filtering and require additional confirmations
• Ranging markets maintain neutral settings
• Transitional markets use moderate adjustments
---
COMPLETE SETTINGS GUIDE
Section 1: Core Analysis Settings
Analysis Sensitivity (0.3-2.0)
• Default: 1.0
• Lower values require stronger price movements
• Higher values detect more subtle patterns
• Scalpers use 0.8-1.2, swing traders use 1.5-2.0
Noise Reduction Level (2-7)
• Default: 4
• Controls filtering of false patterns
• Higher values reduce pattern frequency
• Increase in volatile markets
Minimum Move % (0.05-0.50)
• Default: 0.15%
• Sets minimum price movement threshold
• Adjust based on instrument volatility
• Forex: 0.05-0.10%, Stocks: 0.15-0.25%, Crypto: 0.20-0.50%
High Confirmation Mode
• Default: True (Enabled)
• Requires all technical conditions to align
• Reduces frequency but increases reliability
• Disable for more aggressive pattern detection
Section 2: Market Regime Detection
Enable Regime Analysis
• Default: True (Enabled)
• Activates market environment evaluation
• Essential for adaptive features
• Keep enabled for best results
Regime Analysis Period (20-100)
• Default: 50 bars
• Determines regime calculation lookback
• Shorter for responsive, longer for stable
• Scalping: 20-30, Swing: 75-100
Minimum Market Clarity (0.2-0.8)
• Default: 0.4
• Quality threshold for pattern generation
• Higher values require clearer conditions
• Lower for more patterns, higher for quality
Adaptive Parameter Adjustment
• Default: True (Enabled)
• Enables automatic parameter optimization
• Adjusts based on market regime
• Highly recommended to keep enabled
Section 3: Market Structure Analysis
Enable Structure Validation
• Default: True (Enabled)
• Validates patterns against support/resistance
• Confirms trend structure alignment
• Essential for reliability
Structure Analysis Period (15-50)
• Default: 30 bars
• Period for structure pattern analysis
• Affects support/resistance calculation
• Match to your trading timeframe
Minimum Structure Alignment (0.3-0.8)
• Default: 0.5
• Required structure score for valid patterns
• Higher values need stronger structure
• Balance with desired frequency
Section 4: Analysis Configuration
Minimum Strength Level (3-5)
• Default: 4
• Minimum confirmations for pattern display
• 5 = Maximum reliability, 3 = More patterns
• Beginners should use 4-5
Required Technical Confirmations (4-6)
• Default: 5
• Number of aligned technical factors
• Higher = fewer but better patterns
• Works with High Confirmation Mode
Pattern Separation (3-20 bars)
• Default: 8 bars
• Minimum bars between patterns
• Prevents clustering and overtrading
• Increase for cleaner charts
Section 5: Technical Filters
Momentum Validation
• Default: True (Enabled)
• Requires momentum alignment
• Filters counter-trend patterns
• Essential for trend following
Volume Confluence Analysis
• Default: True (Enabled)
• Requires volume confirmation
• Identifies institutional participation
• Critical for reliability
Trend Direction Filter
• Default: True (Enabled)
• Only shows patterns with trend
• Reduces counter-trend signals
• Disable for reversal hunting
Section 6: Volume Flow Analysis
Institutional Activity Threshold (1.2-3.5)
• Default: 2.0
• Multiplier for unusual volume detection
• Lower finds more institutional activity
• Stock: 2.0-2.5, Forex: 1.5-2.0, Crypto: 2.5-3.5
Volume Surge Multiplier (1.8-4.5)
• Default: 2.5
• Defines significant volume increases
• Adjust per instrument characteristics
• Higher for stocks, lower for forex
Volume Flow Period (12-35)
• Default: 18 bars
• Smoothing for volume analysis
• Shorter = responsive, longer = smooth
• Match to timeframe used
Section 7: Analysis Frequency Control
Maximum Analysis Points Per Hour (1-5)
• Default: 3
• Limits pattern frequency
• Prevents overtrading
• Scalpers: 4-5, Swing traders: 1-2
Section 8: Target Level Configuration
Target Calculation Method
• Default: Market Adaptive
• Three modes available:
- Fixed: Uses set point distances
- Dynamic: ATR-based calculations
- Market Adaptive: Structure-based levels
Minimum Target/Risk Ratio (1.0-3.0)
• Default: 1.5
• Minimum acceptable reward vs risk
• Higher filters lower probability setups
• Professional standard: 1.5-2.0
Fixed Mode Settings:
• Fixed Target Distance: 50 points default
• Fixed Invalidation Distance: 30 points default
• Use for consistent instruments
Dynamic Mode Settings:
• Dynamic Target Multiplier: 1.8x ATR default
• Dynamic Invalidation Multiplier: 1.0x ATR default
• Adapts to volatility automatically
Market Adaptive Settings:
• Use Structure Levels: True (default)
• Structure Level Buffer: 0.1% default
• Places levels at actual support/resistance
Section 9: Visual Display Settings
Color Theme Options
• Professional (Teal/Red)
- Bullish: Teal (#26a69a)
- Bearish: Red (#ef5350)
- Neutral: Gray (#78909c)
- Best for: Traditional traders, clean appearance
• Dark (Neon Green/Pink)
- Bullish: Neon Green (#00ff88)
- Bearish: Hot Pink (#ff0044)
- Neutral: Dark Gray (#333333)
- Best for: Dark theme users, high contrast
• Light (Green/Red Classic)
- Bullish: Green (#4caf50)
- Bearish: Red (#f44336)
- Neutral: Light Gray (#9e9e9e)
- Best for: Light backgrounds, traditional colors
• Vibrant (Cyan/Magenta)
- Bullish: Cyan (#00ffff)
- Bearish: Magenta (#ff00ff)
- Neutral: Medium Gray (#888888)
- Best for: High visibility, modern appearance
Dashboard Position
• Options: Top Left, Top Right, Bottom Left, Bottom Right, Middle Left, Middle Right
• Default: Top Right
• Choose based on chart layout preference
Dashboard Size
• Full: Complete information display (desktop)
• Mobile: Compact view for small screens
• Default: Full
Analysis Display Style
• Arrows : Simple directional markers
• Labels : Detailed text information
• Zones : Colored areas showing pattern regions
• Default: Labels (most informative)
Display Options:
• Display Analysis Strength: Shows star rating
• Display Target Levels: Shows target/invalidation lines
• Display Market Regime: Shows regime in pattern labels
---
HOW TO USE SMPS - DETAILED GUIDE
Understanding the Dashboard
Top Row - Header
• SMPS Dashboard title
• VALUE column: Current readings
• STATUS column: Condition assessments
Market Regime Row
• Shows: TRENDING, RANGING, VOLATILE, QUIET, or TRANSITIONAL
• Color coding: Green = Favorable, Red = Caution
• Status: FAVORABLE or CAUTION trading conditions
Market Score Row
• Percentage from 0-100%
• Above 60% = Strong conditions
• 40-60% = Moderate conditions
• Below 40% = Weak conditions
Structure Row
• Direction: BULLISH, BEARISH, or NEUTRAL
• Status: INTACT or BREAK
• Orange BREAK indicates structure failure
Volume Flow Row
• Direction: BUYING or SELLING
• Intensity: STRONG or WEAK
• Color indicates dominant pressure
Momentum Row
• Numerical momentum value
• Positive = Upward pressure
• Negative = Downward pressure
Volume Status Row
• INST = Institutional activity detected
• HIGH = Above average volume
• NORM = Normal volume levels
Adaptive Mode Row
• ACTIVE = Parameters adjusting
• STATIC = Fixed parameters
• Shows required confirmations
Analysis Level Row
• Minimum strength level setting
• Pattern separation in bars
Market State Row
• Current analysis: BULLISH, BEARISH, NEUTRAL
• Shows analysis price level when active
T:R Ratio Row
• Current target to risk ratio
• GOOD = Meets minimum requirement
• LOW = Below minimum threshold
Strength Row
• BULL or BEAR dominance
• Numerical strength value 0-100
Price Row
• Current price
• Percentage change
Last Analysis Row
• Previous pattern direction
• Bars since last pattern
Reading Pattern Signals
Bullish Structure Pattern
• Upward triangle or "Bullish Structure" label
• Star rating shows strength (★★★★★ = strongest)
• Green line = potential target level
• Red dashed line = invalidation level
• Appears below price bars
Bearish Structure Pattern
• Downward triangle or "Bearish Structure" label
• Star rating indicates reliability
• Green line = potential target level
• Red dashed line = invalidation level
• Appears above price bars
Pattern Strength Interpretation
• ★★★★★ = 6 confirmations (exceptional)
• ★★★★☆ = 5 confirmations (strong)
• ★★★☆☆ = 4 confirmations (moderate)
• ★★☆☆☆ = 3 confirmations (minimum)
• Below minimum = filtered out
Visual Elements on Chart
Lines and Levels:
• Gray Line = 21 EMA trend reference
• Green Stepline = Dynamic support level
• Red Stepline = Dynamic resistance level
• Green Solid Line = Active target level
• Red Dashed Line = Active invalidation level
Pattern Markers:
• Triangles = Arrow display mode
• Text Labels = Label display mode
• Colored Boxes = Zone display mode
Target Completion Labels:
• "Target" = Price reached target level
• "Invalid" = Pattern invalidated by price
---
RECOMMENDED USAGE BY TIMEFRAME
1-Minute Charts (Scalping)
• Sensitivity: 0.8-1.2
• Noise Reduction: 3-4
• Pattern Separation: 3-5 bars
• High Confirmation: Optional
• Best for: Quick intraday moves
5-Minute Charts (Precision Intraday)
• Sensitivity: 1.0 (default)
• Noise Reduction: 4 (default)
• Pattern Separation: 8 bars
• High Confirmation: Enabled
• Best for: Day trading
15-Minute Charts (Short Swing)
• Sensitivity: 1.0-1.5
• Noise Reduction: 4-5
• Pattern Separation: 10-12 bars
• High Confirmation: Enabled
• Best for: Intraday swings
30-Minute to 1-Hour (Position Trading)
• Sensitivity: 1.5-2.0
• Noise Reduction: 5-7
• Pattern Separation: 15-20 bars
• Regime Period: 75-100
• Best for: Multi-day positions
Daily Charts (Swing Trading)
• Sensitivity: 1.8-2.0
• Noise Reduction: 6-7
• Pattern Separation: 20 bars
• All filters enabled
• Best for: Long-term analysis
---
MARKET-SPECIFIC SETTINGS
Forex Pairs
• Minimum Move: 0.05-0.10%
• Institutional Threshold: 1.5-2.0
• Volume Surge: 1.8-2.2
• Target Mode: Dynamic or Market Adaptive
Stock Indices (ES, NQ, YM)
• Minimum Move: 0.10-0.15%
• Institutional Threshold: 2.0-2.5
• Volume Surge: 2.5-3.0
• Target Mode: Market Adaptive
Individual Stocks
• Minimum Move: 0.15-0.25%
• Institutional Threshold: 2.0-2.5
• Volume Surge: 2.5-3.5
• Target Mode: Dynamic
Cryptocurrency
• Minimum Move: 0.20-0.50%
• Institutional Threshold: 2.5-3.5
• Volume Surge: 3.0-4.5
• Target Mode: Dynamic
• Increase noise reduction
---
PRACTICAL APPLICATION EXAMPLES
Example 1: Strong Trending Market
Dashboard Reading:
• Market Regime: TRENDING
• Market Score: 75%
• Structure: BULLISH, INTACT
• Volume Flow: BUYING, STRONG
• Momentum: +0.45
Interpretation:
• Strong uptrend environment
• Institutional buying present
• Look for bullish patterns as continuation
• Higher probability of success
• Consider using lower sensitivity
Example 2: Range-Bound Conditions
Dashboard Reading:
• Market Regime: RANGING
• Market Score: 35%
• Structure: NEUTRAL
• Volume Flow: SELLING, WEAK
• Momentum: -0.05
Interpretation:
• No clear direction
• Low opportunity environment
• Patterns are less reliable
• Consider waiting for regime change
• Or switch to a range-trading approach
Example 3: Structure Break Alert
Dashboard Reading:
• Previous: BULLISH structure
• Current: Structure BREAK
• Volume: INST flag active
• Momentum: Shifting negative
Interpretation:
• Trend reversal potentially beginning
• Institutional participation detected
• Watch for bearish pattern confirmation
• Adjust bias accordingly
• Increase caution on long positions
Example 4: Volatile Market
Dashboard Reading:
• Market Regime: VOLATILE
• Market Score: 45%
• Adaptive Mode: ACTIVE
• Confirmations: Increased to 6
Interpretation:
• Choppy conditions
• Parameters auto-adjusted
• Fewer but higher quality patterns
• Wider stops may be needed
• Consider reducing position size
Below are a few chart examples of the Smart Money Precision Structure (SMPS) indicator in action.
• Example 1 – Bullish Structure Detection on SOLUSD 5m
• Example 2 – Bearish Structure Detected with Strong Confluence on SOLUSD 5m
---
TROUBLESHOOTING GUIDE
No Patterns Appearing
Check these settings:
• High Confirmation Mode may be too restrictive
• Minimum Strength Level may be too high
• Market Clarity threshold may be too high
• Regime filter may be blocking patterns
• Try increasing sensitivity
Too Many Patterns
Adjust these settings:
• Enable High Confirmation Mode
• Increase Minimum Strength Level to 5
• Increase Pattern Separation
• Reduce Sensitivity below 1.0
• Enable all technical filters
Dashboard Shows "CAUTION"
This indicates:
• Market conditions are unfavorable
• Regime is RANGING or QUIET
• Market score is low
• Consider waiting for better conditions
• Or adjust expectations accordingly
Patterns Not Reaching Targets
Consider:
• Market may be choppy
• Volatility may have changed
• Try Dynamic target mode
• Reduce target/risk ratio requirement
• Check if regime is VOLATILE
---
ALERTS CONFIGURATION
Alert Message Format
Alerts include:
• Pattern type (Bullish/Bearish)
• Strength rating
• Market regime
• Analysis price level
• Target and invalidation levels
• Strength percentage
• Target/Risk ratio
• Educational disclaimer
Setting Up Alerts
• Click Alert button on TradingView
• Select SMPS indicator
• Choose alert frequency
• Customize message if desired
• Alerts fire on pattern detection
---
DATA WINDOW INFORMATION
The Data Window displays:
• Market Regime Score (0-100)
• Market Structure Bias (-1 to +1)
• Bullish Strength (0-100)
• Bearish Strength (0-100)
• Bull Target/Risk Ratio
• Bear Target/Risk Ratio
• Relative Volume
• Momentum Value
• Volume Flow Strength
• Bull Confirmations Count
• Bear Confirmations Count
---
BEST PRACTICES AND TIPS
For Beginners
• Start with default settings
• Use High Confirmation Mode
• Focus on TRENDING regime only
• Paper trade first
• Learn one timeframe thoroughly
For Intermediate Users
• Experiment with sensitivity settings
• Try different target modes
• Use multiple timeframes
• Combine with price action analysis
• Track pattern success rate
For Advanced Users
• Customize per instrument
• Create setting templates
• Use regime information for bias
• Combine with other indicators
• Develop systematic rules
---
IMPORTANT DISCLAIMERS
• This indicator is for educational and informational purposes only
• Not financial advice or a trading system
• Past performance does not guarantee future results
• Trading involves substantial risk of loss
• Always use appropriate risk management
• Verify patterns with additional analysis
• The author is not a registered investment advisor
• No liability accepted for trading losses
---
VERSION NOTES
Version 1.0.0 - Initial Release
• Six-layer confluence system
• Adaptive parameter technology
• Institutional volume detection
• Market regime classification
• Structure break identification
• Real-time dashboard
• Multiple display modes
• Comprehensive settings
## My Final Thoughts
Smart Money Precision Structure represents an advanced approach to market analysis, bringing institutional-grade techniques to retail traders through intelligent automation and multi-dimensional evaluation. By combining six analytical frameworks with adaptive parameter adjustment, SMPS provides comprehensive market intelligence that single indicators cannot achieve.
The indicator serves as an educational tool for understanding how professional traders analyze markets, while providing practical pattern detection for those seeking to improve their technical analysis. Remember that all trading involves risk, and this tool should be used as part of a complete analysis approach, not as a standalone trading system.
- BullByte

VWAP BANDS [qrsq]Description
This indicator is used to find support and resistance utilizing both buying and selling volume. It can be used on lower and higher time frames to understand where price is likely to reject or bounce.
How it works
Instead of calculating the VWAP using the total volume, this script estimates the buying/selling volume and respectively calculates their individual VWAP's. The standard deviations of these are then calculated to create the set of two bands. The top bands being the VWAP from buying volume and bottom bands are from selling volume, with the option to use a double band on either pair.
How to use it
I like to use the bands for LTF scalping as well as HTF swings, I also like to use it alongside my SMA VWAP BANDS.
For scalping:
I tend to use either the 5m or 15m TF
I then set the indicator's TF to 1m
I will take a scalp based on the bands confluence with other PA methods, if price is being either supported or rejected.
For swings:
I tend to use a variety of TFs, including: 30m, 1H, 4H, D
I then set the indicator's TF to "Chart"
I will take a swing based on the bands confluence with other PA methods, if price is being either supported or rejected.
I also tend to use them on perpetual contracts as the volume seems to be more consistent and hence results in more accurate support and resistance.

SMA VWAP BANDS [qrsq]Description
This indicator is used to find support and resistance utilizing both SMA and VWAP. It can be used on lower and higher time frames to understand where price is likely to reject or bounce.
How it works
Rather than using the usual calculation for the VWAP, instead this script smooths the volume first with the SMA and then respectively calculates the smoothed multiplication of high, low and close price with the volume individually. These values are then divided by the smoothed volume to find individual VWAP's for each of the sources. The standard deviations of these are calculated, resulting in an upper, lower and middle band. It is essentially VWAP bands with some smoothed calculations in the middle.
How to use it
I like to use the bands for LTF scalping as well as HTF swings.
For scalping:
I tend to use either the 5m or 15m TF
I then set the indicator's TF to 1m
I will take a scalp based on the bands confluence with other PA methods, if price is being either supported or rejected.
For swings:
I tend to use a variety of TFs, including: 30m, 1H, 4H, D
I then set the indicator's TF to "Chart"
I will take a swing based on the bands confluence with other PA methods, if price is being either supported or rejected.
I also tend to use them on perpetual contracts as the volume seems to be more consistent and hence results in more accurate support and resistance.

RSI Scalping & Swing Signals With AlertsThis RSI indicator shows a green or red ribbon when the smoothed RSI is bullish or bearish. It also includes a long moving average for overall trend confirmation. Wait until the ribbon holds above or below the long moving average and take positions in that direction.
To get an easier to read RSI indicator, I smoothed the RSI out and paired it next to a short term RMA. These two together form the ribbon that will show you early reversals and trend direction. The long moving average is used as an overall trend detector and confirmation for longer term trends.
***HOW TO USE***
Scalping: Enter longs when the ribbon turns green and enter shorts when the ribbon turns red. Exit positions when the ribbon turns the opposite color or crosses the long moving average.
Swing Trading: When the ribbon holds above the long moving average or breaks out and retests it, look for long positions and exit when the ribbon turns red or crosses the long moving average. When the ribbon holds below the long moving average or breaks down and retests it, look for short positions and exit when the ribbon turns green or crosses the long moving average.
***DETAILS***
This indicator gives early reversal signals very well and waiting for the RSI ribbon to cross the long moving average helps to get you into positions when the market is ready to really move while filtering out some of the noise.
The ribbon and background will change to green or red depending on whether it is currently bullish or bearish.
There is also a label that changes colors and tells you if RSI is bullish or bearish and also whether the RSI ribbon is above or below the long moving average.
Green or red circles will appear on the indicator when there is a bullish or bearish cross of the RSI ribbon and the long moving average.
It also has alerts that trigger when RSI is turning bullish/bearish or when the RSI ribbon is crossing the long moving average.
***CUSTOMIZATION***
Each piece of this indicator can be customized to suit your preferences including the RSI source, length, smoothing length, short moving average length and long moving average length. You can also turn off the labels, signals and long moving average. All of these settings can be managed within the indicator settings input tab.
***MARKETS***
This indicator can be used as a signal on all markets, including stocks, crypto, futures and forex.
***TIMEFRAMES***
This RSI Scalping & Swing Signals indicator can be used on all timeframes.
***TIPS***
Try using numerous indicators of ours on your chart so you can instantly see the bullish or bearish trend of multiple indicators in real time without having to analyze the data. Some of our favorites are Trend Friend Scalp & Swing Trade Signals, Volume Spike Scanner, Buy & Sell Pressure Volume Profile, and Momentum Scalper in combination with this RSI indicator. They all have real time Bullish and Bearish labels as well so you can immediately understand each indicator's trend.

Momentum Scalping & Swing Signals With AlertsThis Momentum indicator shows a green or red ribbon when smoothed momentum is bullish or bearish. It also includes a long moving average for overall trend confirmation. Wait until the ribbon holds above or below the long moving average and take positions in that direction.
To get an easier to read momentum indicator, I smoothed the momentum out and paired it next to a short term RMA. These two together form the ribbon that will show you early reversals and trend direction. The long moving average is used as an overall trend detector and confirmation for longer term trends.
***HOW TO USE***
Scalping: Enter longs when the ribbon turns green and enter shorts when the ribbon turns red. Exit positions when the ribbon turns the opposite color or crosses the long moving average.
Swing Trading: When the ribbon holds above the long moving average or breaks out and retests it, look for long positions and exit when the ribbon turns red or crosses the long moving average. When the ribbon holds below the long moving average or breaks down and retests it, look for short positions and exit when the ribbon turns green or crosses the long moving average.
***DETAILS***
This indicator gives early reversal signals very well and waiting for the momentum ribbon to cross the long moving average helps to get you into positions when the market is ready to really move while filtering out some of the noise.
The ribbon and background will change to green or red depending on whether it is currently bullish or bearish.
There is also a label that changes colors and tells you if momentum is bullish or bearish and also whether the momentum ribbon is above or below the long moving average.
Green or red circles will appear on the indicator when there is a bullish or bearish cross of the momentum ribbon and the long moving average.
It includes alerts that trigger when momentum is turning bullish/bearish or when the momentum ribbon is crossing the long moving average.
***CUSTOMIZATION***
Each piece of this indicator can be customized to suit your preferences including the momentum source, length, smoothing length, short moving average length and long moving average length. You can also turn off the labels, signals and long moving average. All of these settings can be managed within the indicator settings input tab.
***MARKETS***
This indicator can be used as a signal on all markets, including stocks, crypto, futures and forex.
***TIMEFRAMES***
This Momentum Scalping & Swing Signals indicator can be used on all timeframes.
***TIPS***
Try using numerous indicators of ours on your chart so you can instantly see the bullish or bearish trend of multiple indicators in real time without having to analyze the data. Some of our favorites are Trend Friend Scalp & Swing Trade Signals, Volume Spike Scanner, Buy & Sell Pressure Volume Profile, and RSI Scalper in combination with this momentum indicator. They all have real time Bullish and Bearish labels as well so you can immediately understand each indicator's trend.

CF - KAMI KAMI EMA-HMA-VWMA SCALPERThis is your dark knight, your shining light in the crypto darkness... It's you and me against the machine..... rage, rage against the dying of the night!
This my greedy minions is the ticket..... the disruptive technology, the red pill, that breaks the Matrix.... get ready to join the revolution.
DESCRIPTION:
Lowest green/red line
The lowest alternating green red band is simply a general market indicator. It's EMA 50 over 200. This is a generally good indicator of current market conditions. If the band is red, you should favor taking short positions. If the band is green, long positions.
The three MA colored bands
This sophisticated indicator uses 3 central MA's in calculating its goodness. The HMA (Hull's Moving Average), at the bottom (of the three principal bands), is the most sensitive and responsive to immediate market conditions. It will generally give you the signal to enter or exit at the beginning of the price action move. But, this could also be a "false" signal - that doesn't continue in the expected direction.
The middle band is VWMA, volume-weighted moving average, and it is sensitive to volume - so it may turn green or red faster as volume increases or decreases. It gives somewhat similar signals to the top moving average which is the EMA or exponential moving average.
The GREEN RED signals
The signals below the bands which are true green and true red are "SUPER" signals which represent that all of the six small bands of each MA agree. These are very strong signals to enter and exit a position. If multiple SUPER signals agree this is even more confirmation.
SETTINGS
You can change the ema signals. They are currently optimized for scalping, but this indicator can work for larger timeframes.
I couldn't make this open-source as it represents a lot of work to get it to this point. If you are interested in this indicator and would like to have a custom version coded for your purposes, let me know.