GLOBAL 3H SCALPING (BTC FILTER)글로벌 멀티 세션 & BTC 필터 고강도 스캘핑 알고리즘 기술 보고서
파인 스크립트 v5의 기술적 패러다임과 알고리즘 트레이딩의 진화
금융 시장의 디지털화가 가속화됨에 따라 개인 트레이더와 기관 투자자 모두 정교한 알고리즘을 활용하여 시장의 비효율성을 포착하려는 시도를 지속하고 있다. 파인 스크립트 v5는 네임스페이스 기반 아키텍처를 도입하여 코드의 가독성과 실행 효율성을 극대화하였습니다. 본 보고서에서는 기존 코드의 구문 오류를 수정하고, 아시아·유럽·미국 세션 및 비트코인(BTC) 커플링 필터를 포함한 최적화된 스크립트를 제공합니다.
🚀 GLOBAL 3H SCALPING (BTC FILTER) 전체 코드
이 코드는 모든 세션(아시아/유럽/미국)의 3시간 골든 아워를 포착하며, 비트코인의 추세가 알트코인과 일치할 때만 신호를 생성하는 '커플링 필터'가 내장된 최종 버전입니다.
Pine Script
//@version=5
indicator("GLOBAL 3H SCALPING (BTC FILTERED)", overlay=true, max_lines_count=300, max_labels_count=100)
//────────────────────
// ⏰ 세션 정의 (한국 시간 KST 기준)
//────────────────────
string tz = "Asia/Seoul"
string asiaSess = "0900-1200"
string euSess = "1600-1900"
string usSess = "2300-0200"
f_getFocus(sessionStr) =>
inSess = not na(time(timeframe.period, sessionStr, tz))
start = inSess and not nz(inSess , false)
float tfInSec = timeframe.in_seconds()
int bars3H = math.max(1, math.round(10800 / tfInSec))
int barsSinceStart = ta.barssince(start)
bool focus = inSess and (not na(barsSinceStart) and barsSinceStart < bars3H)
focus
bool asiaFocus = f_getFocus(asiaSess)
bool euFocus = f_getFocus(euSess)
bool usFocus = f_getFocus(usSess)
bool totalFocus = asiaFocus or euFocus or usFocus
bgcolor(asiaFocus? color.new(color.green, 92) : na, title="Asia Focus")
bgcolor(euFocus? color.new(color.blue, 92) : na, title="EU Focus")
bgcolor(usFocus? color.new(color.red, 92) : na, title="US Focus")
//────────────────────
// 🟠 BTC 커플링 필터 (BTC Trend Filter)
//────────────────────
// 비트코인의 추세를 실시간으로 가져와 알트코인 매매의 안전장치로 활용함
float btcPrice = request.security("BINANCE:BTCUSDT", timeframe.period, close)
float btcEMA = request.security("BINANCE:BTCUSDT", timeframe.period, ta.ema(close, 200))
bool btcBullish = btcPrice > btcEMA
bool btcBearish = btcPrice < btcEMA
//────────────────────
// 📈 기술적 지표 (Altcoin 자체 지표)
//────────────────────
float ema200 = ta.ema(close, 200)
plot(ema200, title="EMA200", color=color.new(color.yellow, 0), linewidth=2)
float vwapVal = ta.vwap(hlc3)
plot(vwapVal, title="VWAP", color=color.new(color.aqua, 0), linewidth=2)
float volMA = ta.sma(volume, 20)
bool volOK = volume > volMA
bool longVWAP = low <= vwapVal and close > vwapVal
bool shortVWAP = high >= vwapVal and close < vwapVal
//────────────────────
// 🚀 진입 조건 (BTC 필터 통합)
//────────────────────
bool longCond = totalFocus and close > ema200 and close > vwapVal and longVWAP and volOK and btcBullish
bool shortCond = totalFocus and close < ema200 and close < vwapVal and shortVWAP and volOK and btcBearish
plotshape(longCond, title="LONG", location=location.belowbar, style=shape.triangleup, size=size.small, color=color.lime, text="LONG")
plotshape(shortCond, title="SHORT", location=location.abovebar, style=shape.triangledown, size=size.small, color=color.red, text="SHORT")
//────────────────────
// 🧠 실시간 통합 대시보드
//────────────────────
var label infoLabel = na
if barstate.islast
label.delete(infoLabel)
string sessName = asiaFocus? "ASIA" : euFocus? "EUROPE" : usFocus? "US" : "WAITING"
string labelText = "GLOBAL ALGO (BTC FILTERED) 🌍\n" +
"--------------------------\n" +
"Active Session: " + sessName + "\n" +
"BTC Trend: " + (btcBullish? "BULLISH 🟢" : "BEARISH 🔴") + "\n" +
"Alt Trend: " + (close > ema200? "BULLISH" : "BEARISH") + "\n" +
"Volume: " + (volOK? "STRONG" : "WEAK")
infoLabel := label.new(
x = bar_index,
y = high,
text = labelText,
style = label.style_label_left,
color = color.new(color.black, 20),
textcolor = color.white
)
📘 Comprehensive User Manual (EN/KR)
1. English: Multi-Session & BTC Filtered Scalping Guide
Core Philosophy
The "Golden Hours" strategy focuses on the first 3 hours of global market openings when volatility and liquidity are at their peak . By filtering altcoin signals with the Bitcoin (BTC) trend, we ensure high-probability entries aligned with the overall market momentum .
Session Schedule (Korea Standard Time - KST)
The indicator highlights three major trading windows :
Asia Focus (Green): 09:00 – 12:00 KST (Tokyo/Seoul opening).
Europe Focus (Blue): 16:00 – 19:00 KST (London opening).
US Focus (Red): 23:00 – 02:00 KST (New York opening).
Trading Rules
Long (Buy) Entry Conditions:
Zone: Price must be within one of the colored Focus Zones.
BTC Filter: BTC must be trading above its EMA 200 (Market Sentiment: Bullish) .
Alt Trend: Altcoin price must be above its own EMA 200.
Value: Price is above VWAP.
Reaction: Candle low touches or dips below VWAP, then closes above it (Pullback) .
Volume: Current volume is higher than the 20-period average.
Short (Sell) Entry Conditions:
Zone: Price must be within one of the colored Focus Zones.
BTC Filter: BTC must be trading below its EMA 200 (Market Sentiment: Bearish).
Alt Trend: Altcoin price must be below its EMA 200.
Value: Price is below VWAP.
Reaction: Candle high touches or goes above VWAP, then closes below it (Rejection).
Volume: Current volume is higher than the 20-period average.
Professional Risk Management
1% Rule: Never risk more than 1% of your total capital on a single trade .
Leverage: Use 1x–5x for beginners, and 5x–20x for advanced traders only with tight stop-losses .
Stop-Loss: Place stop-losses 0.1%–0.5% away from the entry point or at the most recent swing high/low .
Wyszukaj w skryptach "scalping"

VIOP Scalping - OriginalVIOP Scalping – Original is a rule-based scalping strategy ported from an original C# logic set. It aims to trade only when trend direction, momentum, and trend strength align, then manages the position using fixed take-profit/stop-loss percentages with an optional trailing mechanism to protect gains during favorable moves.
This strategy is provided for educational and backtesting purposes only. It is not financial advice and does not guarantee profitability. Always test thoroughly before any live usage.
Core Concept
Follow the dominant WMA trend, confirm momentum with EMA separation, filter conditions with RSI + ADX, then exit using fixed TP/SL with trailing behavior after a defined profit threshold.
How the Strategy Works
Trend Direction is defined by WMA: above WMA = long bias, below WMA = short bias.
Momentum is measured via Fast EMA vs Slow EMA and the EMA difference.
Trend Strength is confirmed using ADX (must exceed a threshold).
RSI filters trades to avoid entering when momentum is likely overextended or weak.
A no-trade session blocks entries during a predefined time window (default 09:30–10:05).
Exit logic uses fixed percent TP/SL, with an optional trailing mechanism that activates after a profit threshold.
Inputs and Settings
Trend and Indicator Settings
Main Trend WMA: Determines directional bias (price above = long, price below = short).
Fast EMA / Slow EMA: Used to measure momentum and directional separation.
RSI Period: Filters entries based on RSI range constraints.
ADX Period: Measures trend strength (must exceed threshold to allow entries).
Threshold Settings
EMA Difference Threshold: Minimum EMA separation required to validate momentum.
ADX Threshold: Minimum ADX required to confirm trend strength.
RSI Long Ceiling: RSI must remain below this value for long entries.
RSI Short Floor: RSI must remain above this value for short entries.
Risk Management Settings
Take Profit %: Default TP distance in percent.
Strong Trend Take Profit %: Higher TP used when a “strong trend” condition is detected.
Stop Loss %: Fixed SL distance in percent.
Trailing Activation %: Profit threshold at which trailing starts.
Trailing Distance %: Trailing offset distance used once trailing is active.
Time Filter
No-Trade Hours: Default session is 09:30–10:05. During this window, the strategy does not open new trades.
Entry Logic
No-Trade Time Filter
If the current bar falls inside the no-trade session, entries are blocked.
Long Entry Conditions
Price is above the WMA trend line.
EMA difference is positive and greater than the EMA Difference Threshold.
EMA momentum is increasing (current EMA diff > previous EMA diff).
RSI is within the defined range (RSI > 48 and RSI < RSI Long Ceiling).
Close is higher than the previous close.
ADX is above the ADX Threshold.
Short Entry Conditions
Price is below the WMA trend line.
EMA difference is negative and lower than -EMA Difference Threshold.
Bearish momentum is increasing (current EMA diff < previous EMA diff).
RSI is within the defined range (RSI < 52 and RSI > RSI Short Floor).
Close is lower than the previous close.
ADX is above the ADX Threshold.
Strong Trend Logic (Dynamic TP Selection)
If price is far from the WMA (absolute distance > 20 points) AND EMA separation is strong (absolute EMA diff > 1.5 points), the strategy treats the environment as a strong trend.
In strong trend mode, the strategy uses “Strong Trend Take Profit %” instead of the default “Take Profit %”.
Exit Management (TP/SL + Trailing)
The strategy uses fixed percentage-based TP and SL levels.
Trailing logic is enabled via strategy.exit and activates only after price moves in profit by the defined Trailing Activation %.
Once activated, trailing follows price using the defined Trailing Distance % offset.
This is designed to secure partial gains during extended moves while still allowing room for continuation.
What You See on the Chart
WMA Trend Line (Main Trend Filter).
Fast EMA and Slow EMA (Momentum Confirmation).
Strategy entry/exit markers generated by TradingView.
Recommended Use
Scalping systems that rely on trend-following and momentum confirmation.
Markets where ADX filtering helps avoid choppy conditions.
Traders who want a simple, parameter-driven TP/SL system with trailing after confirmation.
Important Notes
The no-trade session depends on your chart/session settings. Ensure your symbol/session configuration matches your intended market hours.
Percent-based exits scale with price; results will vary across instruments and volatility regimes.
Always validate behavior using bar replay, forward testing, and realistic commission/slippage assumptions.

VIOP Scalping - ATR SNIPERVIOP Scalping – ATR SNIPER is a momentum-based scalping strategy designed to capture short, high-probability moves while keeping risk strictly defined using ATR-based stop-loss and fixed risk/reward targets. The strategy trades only when trend direction, momentum, and strength are aligned.
This script is provided for educational and testing purposes only. It does not guarantee profitability and must be used with proper risk management.
Core Idea
Trade in the direction of the dominant trend, confirm momentum acceleration, and manage risk using ATR-based dynamic stops and targets.
How the Strategy Works
The main trend is defined using a Weighted Moving Average (WMA).
Momentum is measured by the distance and direction between a fast EMA and a slow EMA.
Trend strength is confirmed using ADX.
RSI is used as a filter to avoid weak or overextended market conditions.
Entries are blocked during a predefined no-trade time window to avoid high-noise periods.
Long Entry Conditions
Fast EMA is above Slow EMA and the EMA difference is greater than the minimum threshold.
EMA momentum is increasing compared to the previous bar.
RSI is within the user-defined long range.
Current close is higher than the previous close.
ADX is above the minimum strength threshold.
Price is above the WMA trend line.
The current bar is not inside the no-trade session.
Short Entry Conditions
Fast EMA is below Slow EMA and the EMA difference is below the negative threshold.
Bearish EMA momentum is increasing.
RSI is within the user-defined short range.
Current close is lower than the previous close.
ADX is above the minimum strength threshold.
Price is below the WMA trend line.
The current bar is not inside the no-trade session.
Risk Management – ATR Sniper Logic
Stop-loss distance is calculated as ATR multiplied by the ATR Multiplier.
Take-profit distance is calculated using the defined Risk/Reward ratio.
Stop-loss and take-profit levels are dynamically calculated per trade.
Only one position can be open at any given time.
What You See on the Chart
Weighted Moving Average (WMA) trend line.
Fast EMA and Slow EMA lines.
Dynamic stop-loss line during active trades.
Dynamic take-profit line during active trades.
Recommended Use
Intraday scalping on VİOP instruments.
Momentum-based short-term trading.
Traders who prefer rule-based systems with strict risk control.
Always backtest and forward-test on your own instruments and timeframes before using this strategy in live markets.

Dark Vector ScalpingThe Dark Vector Scalping indicator is a high-frequency trend-following system designed specifically to capture rapid momentum shifts in the market. It combines a staircase-style breakout logic with volatility-adjusted trailing stops to define market direction.
While the underlying math is robust enough for various asset classes, this specific configuration is optimized for scalping operations on 1-minute and 5-minute timeframes. It aims to filter out the "noise" common in lower timeframes while reacting quickly to genuine breakouts.
Core Components
1. The Apex Engine (Staircase Logic) Unlike traditional moving averages that curve with price, this engine uses a "hard" breakout logic. It looks back at a specific number of bars (Sensitivity) to find the highest highs and lowest lows.
Bullish Flip: Occurs when the price closes below the calculated low of the previous trend.
Bearish Flip: Occurs when the price closes above the calculated high of the previous trend.
Trailing Stop: Once a trend is established, a trailing stop line is drawn. This line only moves in the direction of the trend (up for bullish, down for bearish) and never retraces, acting as a ratchet to lock in paper profits.
2. Volatility Normalization To prevent getting stopped out by random market noise (scam wicks), the indicator calculates the Average True Range (ATR). It multiplies this volatility metric by a user-defined deviation factor to determine exactly how far the stop line should be from the current price action.
3. The Hull Moving Average (HMA) Filter The script includes an optional 50-period Hull Moving Average. The HMA is known for being extremely fast and smooth, reducing lag compared to standard moving averages.
Visual Reference: You can plot the line to see the overall macro trend.
Hard Filter: You can enable a "Safety Filter" in the settings. If enabled, the system will only generate Buy signals if the price is above the HMA, and Sell signals if the price is below the HMA.
4. The Dashboard A data panel is located on the chart (customizable position) to provide instant numerical data without needing to calculate levels manually. It displays the current trend state, the exact price of the trailing stop, and the status of the HMA filter.
Settings & Configuration
Sensitivity (Lookback)
Default: 5
This is the primary setting for the Apex Engine. A setting of 5 is the "sweet spot" for 1-minute and 5-minute charts. It allows the system to react very quickly to sudden volume spikes. Increasing this number (e.g., to 10) will make the signals slower and more conservative.
Stop Deviation
Default: 3.0
This controls the "breathing room" for the trade. A value of 3.0 allows for standard volatility on minute charts without triggering a premature exit. Lowering this to 2.0 will result in tighter stops but more false signals.
HMA Filter
Use HMA as Filter? (Default: OFF):
When OFF, the system signals purely on price action breakouts (fastest).
When ON, the system waits for the price to align with the 50-period HMA before signaling (safest, but may delay entry).
How to Interpret Visuals
Candle Colors
Teal/Green: The market is in a Bullish regime.
Red/Pink: The market is in a Bearish regime.
The Line
The solid stepped line represents the hard invalidation point. If price closes beyond this line, the trend is considered over.
Diamond Signals
Light Green Diamond (Below Bar): Confirmed Buy Signal. A new bullish trend has started.
Light Red/Pink Diamond (Above Bar): Confirmed Sell Signal. A new bearish trend has started.
Trading Strategy Guide
The Scalp Entry
Ensure you are on a 1-minute or 5-minute timeframe.
Wait for a signal Diamond to close. Do not enter while the bar is still forming, as the signal may repaint (disappear) if the price retraces before the close.
Long Entry: Enter when a Green Diamond appears and the candle turns Teal.
Short Entry: Enter when a Red Diamond appears and the candle turns Red.
Risk Management
Stop Loss: Your invalidation level is the "Apex Stop" line. You can place your hard stop loss slightly beyond this line.
Take Profit: Because this is a trend-following system, it is often best to hold until the candle color changes, or to take profit at fixed Risk:Reward ratios (e.g., 1:1.5 or 1:2).
The HMA Nuance If you find the market is "choppy" (moving sideways), enable the "Use HMA as Filter" option in the settings. This will force the system to ignore signals that are counter-trend to the longer-term momentum.
Disclaimer
The information provided by the "Dark Vector Scalping" indicator and this accompanying guide is for educational and informational purposes only. It does not constitute financial, investment, or trading advice. Trading cryptocurrencies, stocks, and forex involves a high level of risk and may not be suitable for all investors. You could lose some or all of your initial investment.

God of Scalping BTCUnleash divine precision in the chaotic realm of BTC scalping with the God of Scalping BTC—a bespoke, price-action powerhouse crafted for lightning-fast entries and exits on 1-5 minute charts. Forged from raw momentum velocity (no recycled RSI or MACD here), this indicator detects micro-trend accelerations to pinpoint surge moments where BTC's volatility bends to your will.Core Mechanics:Velocity Engine: Calculates fast (default: 3-bar) and slow (default: 8-bar) price speeds, then derives normalized acceleration using ATR (14-bar) to filter noise in BTC's wild swings.
Surge Detection: Smoothed signal line confirms crossovers—bullish when acceleration surges above signal with positive bias; bearish on the downside.
Volume Guardian: Triggers only on 20%+ volume spikes above its EMA (10-bar), ensuring conviction behind the chaos.
Visual Oracle:Blue/Red Lines: Fast (EMA close, 3-bar) and slow (EMA close, 8-bar) velocity trends for trend context.
Background Glow: Subtle green/red tint for real-time momentum bias.
Divine Arrows: Green triangles below bars for BUY surges; red above for SELL—your scalp signals from the heavens.
Scalping Ritual:Optimal Altar: Load on BTCUSD/USDT (1m-5m). Tune lengths for your broker's feed.
Invocation: Enter long on green arrow (target 0.1-0.3% gains), short on red. Tight stops at recent swings; exit on opposite signal or threshold breach (1.5x mult).
Alerts: Built-in notifications—"God Surge Buy: BTC Scalp Entry!"—to summon you mid-prayer (er, trade).
Backtested for BTC's fury, this isn't a holy grail, but a scalper's Excalibur: pure, adaptive, and unyielding. Trade wisely—markets are mortal, your edge is eternal.

HF Crypto Scalping BotHigh-Frequency Crypto Scalping Bot for ETHUSDT
This bot is designed for scalping ETHUSDT on a 1-minute chart using a blend of technical indicators and market structure logic.
🔍 Strategy Highlights:
Range Mode: Uses RSI and MFI to identify overbought/oversold zones near support/resistance.
Trend Mode: Detects MACD momentum combined with confirmed S/R breakouts.
Smart Risk Management: Dynamic stop loss and take profit based on risk:reward ratio.
Adaptive Market Logic: Automatically switches between trend and range conditions.
Real-Time Table: Displays RSI, MFI, MACD trend, market mode, entry/exit prices, and stop/target levels.
Visual Cues: Buy/Sell/Exit signals plotted directly on the chart with color-coded levels.
Alerts: Integrated long/short entry and exit alerts with live price and indicator values.
Customize the input parameters to fit your risk profile and asset volatility. Ideal for fast-paced scalping with dynamic conditions.

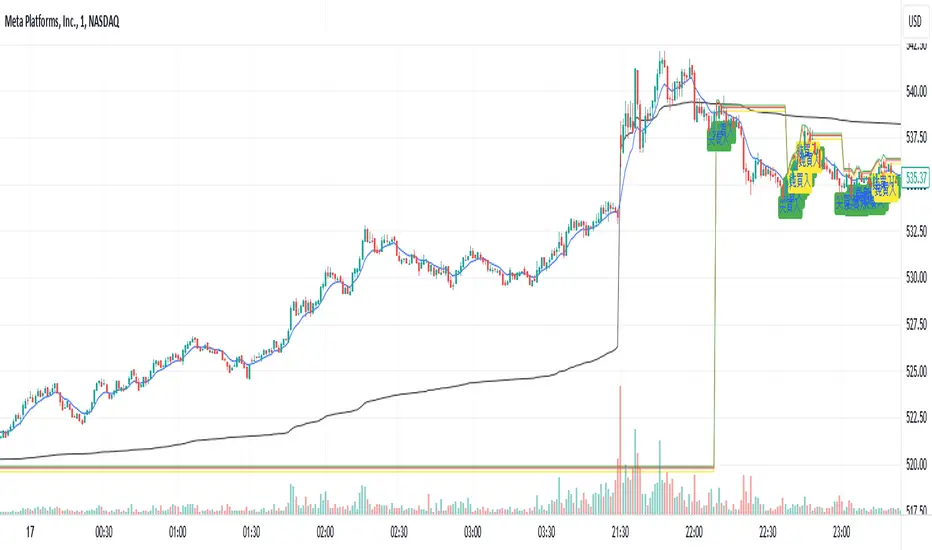
Backside Bubble ScalpingFrom LIHKG
Pine from Perplexity AI
以下是Backside Bubble Scalping策略的使用說明,旨在幫助交易者理解如何在美股交易中應用這一策略。
使用說明:Backside Bubble Scalping 策略
1. 前提條件
交易時間:此策略適用於香港時間晚上9:30 PM至12:00 AM。
圖表類型:使用1分鐘圖表進行交易。
2. 策略概述
Backside Bubble Scalping策略包含兩種主要的設置:尖backside和鈍backside。這些設置通常在10:00 PM至12:00 AM之間出現。
3. 指標設定
VWAP(粉紅色):成交量加權平均價格,用於識別市場趨勢。
9 EMA(綠色):9期指數移動平均線,用於捕捉短期價格變化。
4. 識別 Backside 設置
尖backside
特徵:
當市場趨勢為純紅色下跌,並形成尖尖的V形底部。
入場條件:
當價格突破9 EMA並經過小幅盤整後,進場做多。
鈍backside
特徵:
在混合顏色的趨勢中,形成鈍鈍的V形底部。
入場條件:
在盤整期間進場做多。
5. 止損和止盈設置
止損位置:
尖backside:設置在9 EMA上方的盤整範圍底部加上0.2。
鈍backside:設置在V底部的最低點加上0.2。
止盈位置:
尖backside:當價格跌破VWAP或出現一根K線沒有跟隨時出場。
鈍backside:當一根K線的三分之二身體向下突破9 EMA時出場。
6. 操作步驟
監控市場動態:在指定的交易時間內,觀察VWAP和9 EMA的變化。
識別入場信號:根據尖backside或鈍backside的條件進行判斷,確定何時進場。
設置止損和止盈:根據上述條件設置止損和止盈位,以管理風險。
執行交易:根據信號執行交易,並持續監控市場情況以調整策略。
7. 注意事項
避免在VWAP附近進行交易,以減少失敗風險。
如果出現影線(wick bar),建議不要進行交易,因為這可能表示該設置失敗。
BINANCE-BYBIT Cross Chart: Spot-Perpetual CorrelationName: "Binance-Bybit Cross Chart: Spot-Perpetual Correlation"
Category: Scalping, Trend Analysis
Timeframe: 1M, 5M, 30M, 1D (depending on the specific technique)
Technical analysis: This indicator facilitates a comparison between the price movements shown on the Binance spot chart and the Bybit perpetual chart, with the aim of discerning the correlation between the two charts and identifying the dominant market trends. It automatically generates the corresponding chart based on the ticker selected in the primary chart. When a Binance pair is selected in the main chart, the indicator replicates the Bybit perpetual chart for the same pair and timeframe, and vice versa, selecting the Bybit perpetual chart as the primary chart generates the Binance spot chart.
Suggested use: You can utilize this tool to conduct altcoin trading on Binance or Bybit, facilitating the comparison of price actions and real-time monitoring of trigger point sensitivity across both exchanges. We recommend prioritizing the Binance Spot chart in the main panel due to its typically longer historical data availability compared to Bybit.
The primary objective is to efficiently and automatically manage the following three aspects:
- Data history analysis for higher timeframes, leveraging the extensive historical data of the Binance spot market. Variations in indicators such as slow moving averages may arise due to differences in historical data between exchanges.
- Assessment of coin liquidity on both exchanges by observing candlestick consistency on smaller timeframes or the absence of gaps. In the crypto market, clean charts devoid of gaps indicate dominance and offer enhanced reliability.
- Identification of precise trigger point levels, including daily, previous day, or previous week highs and lows, which serve as sensitive areas for breakout or reversal operations.
All-Time High (ATH) and All-Time Low (ATL) levels may vary significantly across exchanges due to disparities in historical data series.
This tool empowers traders to make informed decisions by leveraging historical data, liquidity insights, and precise trigger point identification across Binance Spot and Bybit Perpetual market.
Configuration:
EMA length:
- EMA 1: Default 5, user configurable
- EMA 2: Default 10, user configurable
- EMA 3: Default 60, user configurable
- EMA 4: Default 223, user configurable
- Additional Average: Optional display of an additional average, such as a 20-period average.
Chart Elements:
- Session separator: Indicates the beginning of the current session (in blue)
- Background: Indicates an uptrend (60 > 223) with a green background and a downtrend (60 < 223) with a red background.
Instruments:
- EMA Daily: Shows daily averages on an intraday timeframe.
- EMA levels 1h - 30m: Shows the levels of the 1g-30m EMAs.
- EMA Levels Highest TF: Provides the option to select additional EMA levels from the major timeframes, customizable via the drop-down menu.
- "Hammer Detector: Marks hammers with a green triangle and inverted hammers with a red triangle on the chart
- "Azzeramento" signal on TF > 30m: Indicates a small candlestick on the EMA after a dump.
- "No Fomo" signal on TF < 30m: Indicates a hyperextended movement.
Trigger Points:
- Today's highs and lows: Shows the opening price of the day's candlestick, along with the day's highs and lows (high in purple, low in red, open in green).
- Yesterday's highs and lows: Displays the opening price of the daily candlestick, along with the previous day's highs and lows (high in yellow, low in red).
You can customize the colors in "Settings" > "Style".
It is best used with the Scalping The Bull indicator on the main panel.
Credits:
@tumiza999: for tests and suggestions.
Thanks for your attention, happy to support the TradingView community.

GOLD MonitorI'm using this platform from sometime and I carry out trading on Gold, using a kind of scalping strategy.
Scalping is not an easy task to do. Personally I found a lot of problems while detecting the trend direction.
So I decided to develop an indicator that is capable, in a discrete way, to give an instant-view on the market that is interesting.
This indicator can summarize in a small table all interesting figures related to gold scalping trading and is useful while joined with technical and fundamental analysis.
In this way it is possible to easy take under control all important aspects related to gold trading that I summarize here and you can find inside the table:
1) Gold / USD current direction
2) USD dollar strength (instant DXY) indicator take under consideration the DXY value every each tick and measures the increase or decrease in percentage. If there is a decrease the indicator displays a red low arrow, if there is an increase the indicator displays a green high arrow
also Gold friends are important so it is possible to find also:
3) NZDUSD (that is a Gold friend) variation percentage. If there is a decrease the indicator displays a red low arrow, if there is an increase the indicator displays a green high arrow
4) AUDUSD (that is a Gold friend) variation percentage. If there is a decrease the indicator displays a red low arrow, if there is an increase the indicator displays a green high arrow
then it is possible to find DXY USD dollar strength calculated between previous period (e.g. in timeframe M5 last 5 minutes) and current period (current 5 minutes). This indication is represented by an high arrow if there has been an increase, or by an low arrow if there has been a decrease.
Last but not least the information about the Gold trend itself with the possible forecast for the current period. This information must be carefully interpreted together with other instruments for technical analysis like Fibonacci lines.

SMT Scalping PRO (NQ vs ES)Indicator Description: SMT Scalping PRO (NQ vs ES)
SMT Scalping PRO is a specialized technical indicator designed for traders who use Smart Money Technique (SMT) divergences between two symbols — in this case, NQ (Nasdaq 100) and ES (S&P 500). The indicator helps identify potential short-term bullish and bearish market moves by analyzing swing points across both instruments.
Key Features:
Dual-Symbol Comparison: Tracks the primary symbol and a comparison symbol simultaneously, using their open prices.
Swing Detection: Automatically identifies pivot highs and pivot lows based on a user-defined sensitivity setting (Swing Sensitivity), allowing faster or slower response to price swings.
SMT Divergence Signals: Detects bullish or bearish divergences when one asset’s swing movement does not align with the other, signaling potential market turning points.
Customizable Labels: Shows SMT signals directly on the chart with configurable background color, text color, and label size for easy visualization.
Alerts: Optional alerts notify the trader when bullish or bearish SMT conditions occur, helping capture trading opportunities in real time.
Inputs:
Comparison Symbol: Symbol to compare against (default: ES).
Swing Sensitivity: Determines responsiveness of swing detection (lower = faster signals).
Label Settings: Enable/disable labels, choose label size and colors.
Alerts: Enable or disable real-time alerts for SMT signals.
Use Case:
Ideal for scalpers and short-term traders who monitor intermarket relationships and want a visual, easy-to-read indication of potential divergence-driven market moves between indices or correlated instruments.

200 EMA Scalping 1 Minute (Only Nifty 1 Min Scalping)Only for scalping in 1 minute timeframe in Nifty 50.

Kijun-Sen with Buy / Sell Labels & Alerts - Ichimoku simplifiedI built this indicator for my own scalping style. Maybe it fits yours, too?
Happy scalping!

15-Minute Squeeze Scalper (Traffic Light Edition)Overview This is a highly optimized version of the famous Squeeze Momentum Indicator, customized specifically for 15-minute scalping .
While the original indicator is powerful, the default colors can be confusing for new traders. I have recoded this to function as a simple "Traffic Light" system to help you identify periods of inaction vs. periods of high-probability breakouts.
How it Works This tool identifies when the market is "quiet" (low volatility) and getting ready to explode. It uses Bollinger Bands and Keltner Channels to measure this energy.
The "Traffic Light" Visuals
🔴 RED Cross (Center Line): STOP / WAIT
Meaning: The Squeeze is ON. The market is coiling tight.
Action: Do not trade yet. Wait for the energy to release. The longer the line of red dots, the bigger the potential move.
🟢 GREEN Cross (Center Line): GO / ACTION
Meaning: The Squeeze has FIRED. Volatility is expanding.
Action: Look at the Histogram to determine the direction of the trade.
📊 Histogram Bars:
Lime/Green: Bullish Momentum (Trade Long).
Red/Maroon: Bearish Momentum (Trade Short).
The 15-Minute Scalping Strategy
Identify the Squeeze: Look for a series of Red Crosses on the zero line.
Wait for the Fire: Wait for the first Green Cross to appear.
Confirm Direction:
If the Cross turns Green AND the Histogram is above zero: LONG.
If the Cross turns Green AND the Histogram is below zero: SHORT.
Alerts Included I have added custom alerts so you don't have to stare at the screen:
"Squeeze Fired": Alerts you instantly when the Red Cross changes to Green.
"Momentum Long/Short": Alerts you when momentum flips direction.

SAR Volume ScalperSAR Volume Scalper is a minimalist intraday scalping indicator designed for 1–2 minute charts, optimized for high-liquidity markets such as NASDAQ (NQ) and Gold (GC).
The indicator combines Parabolic SAR price crossings with a neutral volume participation filter (Volume ≥ EMA(Volume)), ensuring that signals appear only when the market is active, without relying on rare or aggressive volume spikes.
🔑 Core Logic
Parabolic SAR identifies precise micro-trend shifts
Trend EMA filters directional bias and reduces counter-trend trades
Neutral volume filter confirms market participation while preserving signal frequency
ATR-based targets adapt automatically to current volatility
🎯 Designed For
High-frequency scalping on 1–2 minute timeframes
Manual trade execution during active market sessions
Traders who prefer price and flow confirmation over heavy indicator stacking
⚠️ Disclaimer
This indicator is a decision-support tool and should not be used as standalone trading advice.
It is not intended for fully automated trading.

Liquidity Sweep Sniper AP StyleAP Capital – Liquidity Sweep Sniper (Fab-Style)
📌 Overview
This indicator is a precision scalping tool inspired by professional liquidity-based trading concepts often demonstrated by elite intraday scalpers.
The script focuses on liquidity sweeps followed by strong displacement, aiming to capture short, high-probability momentum moves — particularly effective on lower timeframes (1–5 min) during active market sessions.
It is not a signal spam tool. Signals appear only when multiple objective conditions align.
🧠 Core Concept
Markets do not move randomly — they seek liquidity before expanding.
This indicator identifies:
Buy-side / Sell-side liquidity
Liquidity sweeps (stop-hunts)
Strong displacement candles reclaiming price
Optional higher-timeframe trend alignment
Only when all conditions are met does a signal print.
🔍 What the Indicator Detects
1️⃣ Liquidity Pools
Equal highs or equal lows detected within a configurable lookback
Minimum number of touches required
ATR-based tolerance to adapt to volatility
These levels represent areas where stop orders are likely resting.
2️⃣ Liquidity Sweep
A valid sweep requires:
Price to wick beyond the liquidity level
Candle to close back inside the range
This indicates failed breakout / stop-hunt behaviour.
3️⃣ Displacement Confirmation
After the sweep, the candle must show:
Strong body (default >60% of candle range)
Candle range large relative to ATR
Clear directional intent (momentum)
This filters out weak reactions and chop.
4️⃣ Optional Trend Filter
EMA-based higher-timeframe bias
Helps align scalps with dominant direction
Can be enabled or disabled
📈 Signals
BUY: Sell-side liquidity sweep → bullish displacement
SELL: Buy-side liquidity sweep → bearish displacement
Signals are plotted directly on the chart and can be used with alerts.
⚙️ Recommended Usage
Markets: XAUUSD, indices, liquid FX pairs
Timeframes: 1m–5m
Sessions: London & New York (best performance)
Risk Management: Always required — this tool does not place trades
Best used as a confirmation tool, not standalone.
⚠️ Important Notes
This indicator is inspired by liquidity-based scalping concepts, not an exact replication of any individual trader’s private strategy.
No indicator predicts the future — this tool highlights high-probability scenarios, not guarantees.
Past performance is not indicative of future results.

Renko ScalperWhat it is-
A lightweight Renko Scalper that combines Renko brick direction with an internal EMA trend filter and MACD confirmation to signal high-probability short-term entries. EMAs are used internally (hidden from the chart) so the visual remains uncluttered.
Signals-
Buy arrow: Renko direction turns bullish AND EMA trend up AND MACD histogram positive.
Sell arrow: Renko direction turns bearish AND EMA trend down AND MACD histogram negative.
Consecutive same-direction signals are suppressed (only one arrow per direction until opposite signal).
Visuals-
Buy / Sell arrows (large) above/below bars.
Chart background tints green/red after the respective signal for easy glance recognition.
Inputs:-
Renko Box Size (points)
EMA Fast / EMA Slow
MACD fast/slow/signal lengths
How to use-
Add to chart
Use smaller Renko box sizes for scalping, larger for swing-like entries.
Confirm signal with price action and volume—this indicator is a signal generator, not a full automated system.
Use alerts (built in) to receive Buy / Sell arrow notifications.
Alerts-
Buy Arrow — buySignal
Sell Arrow — sellSignal
Buy Background / Sell Background — background-color state alerts
Recommended settings-
Timeframes: 1m–15m for scalping, 5m for balanced intraday.
Symbols: liquid futures/currency pairs/major crypto.
Disclaimer
This script is educational and not financial advice. Backtest and forward test on a demo account before live use. Past performance is not indicative of future results. Use proper risk management.

9/15 EMA Scalper 9/15 EMA Scalper — by uzairbaloch
This script is a price-action based scalping system built around the 9 EMA and 15 EMA trend structure.
It identifies short-term reversal points where the market pulls back into the EMAs and confirms direction with a strong candle signal.
The strategy looks for:
• A clear EMA trend (9 above 15 for buys, 9 below 15 for sells)
• Pullback into EMA9/EMA15 with candle bodies touching the fast EMA
• Strong confirmation candle (engulfing / strong momentum / controlled wick)
• Optional slope filter to avoid flat, choppy sessions
• Automatic trade labels showing Entry, SL and TP (based on R:R)
The script is designed for scalping on gold, indices, and high-volatility FX pairs.
It resets trade logic immediately after SL or TP is hit, so it can catch the next valid signal without delay.
This tool is meant as an indicator — not a full strategy — and can be used to visually mark high-probability EMA pullback setups with precise levels.
Author: uzairbaloch

MACD Volume VWAP Scalping (2min) by Obiii📘 Strategy Description (for TradingView)
MACD Volume VWAP Scalping Strategy (2-Minute Intraday Momentum)
This strategy is designed for scalpers and short-term intraday traders who focus on capturing small, high-probability moves during the most active hours of the trading session — typically between 9:45 AM and 11:30 AM (New York time).
The system combines three key momentum confirmations:
MACD crossovers to detect short-term trend shifts,
Volume spikes to validate real market participation, and
VWAP / EMA alignment to filter trades in the direction of the prevailing intraday trend.
🔹 Entry Logic
Long Entry:
MACD line crosses above the signal line
Both MACD and Signal are above zero
Current volume > average of the last 10 candles
Price is above VWAP and (optionally) above EMA 9 and EMA 20
Short Entry:
MACD line crosses below the signal line
Both MACD and Signal are below zero
Current volume > average of the last 10 candles
Price is below VWAP and (optionally) below EMA 9 and EMA 20
🎯 Exit Logic
Fixed Take Profit: +0.25%
Fixed Stop Loss: -0.15% to -0.20%
Optionally, switch to the 5-minute chart after entry to monitor momentum and manage exits more smoothly.
⚙️ Recommended Settings
Timeframe: 2 minutes (entries), 5 minutes (monitoring)
Market Session: 9:45 AM – 11:30 AM EST
Assets: Highly liquid instruments such as SPY, QQQ, NVDA, TSLA, AAPL, or large-cap momentum stocks.
💡 Notes
This is a momentum-based scalping strategy — precision and discipline are key.
It performs best in high-volume environments where clear direction emerges after the morning volatility settles.
The system can be fine-tuned for different profit targets, MACD settings, or volume thresholds depending on volatility.

Dwaggy Scalping Trio (VWAP + EMA + RSI)First attempt at pine script this is a scalping indicator that combines VWAP, EMA, and RSI to signal entry/exit for scalping lower time frames

Bollinger Adaptive Trend Navigator [QuantAlgo]🟢 Overview
The Bollinger Adaptive Trend Navigator synthesizes volatility channel analysis with variable smoothing mechanics to generate trend identification signals. It uses price positioning within Bollinger Band structures to modify moving average responsiveness, while incorporating ATR calculations to establish trend line boundaries that constrain movement during volatile periods. The adaptive nature makes this indicator particularly valuable for traders and investors working across various asset classes including stocks, forex, commodities, and cryptocurrencies, with effectiveness spanning multiple timeframes from intraday scalping to longer-term position analysis.
🟢 How It Works
The core mechanism calculates price position within Bollinger Bands and uses this positioning to create an adaptive smoothing factor:
bbPosition = bbUpper != bbLower ? (source - bbLower) / (bbUpper - bbLower) : 0.5
adaptiveFactor = (bbPosition - 0.5) * 2 * adaptiveMultiplier * bandWidthRatio
alpha = math.max(0.01, math.min(0.5, 2.0 / (bbPeriod + 1) * (1 + math.abs(adaptiveFactor))))
This adaptive coefficient drives an exponential moving average that responds more aggressively when price approaches Bollinger Band extremes:
var float adaptiveTrend = source
adaptiveTrend := alpha * source + (1 - alpha) * nz(adaptiveTrend , source)
finalTrend = 0.7 * adaptiveTrend + 0.3 * smoothedCenter
ATR-based volatility boundaries constrain the final trend line to prevent excessive movement during volatile periods:
volatility = ta.atr(volatilityPeriod)
upperBound = bollingerTrendValue + (volatility * volatilityMultiplier)
lowerBound = bollingerTrendValue - (volatility * volatilityMultiplier)
The trend line direction determines bullish or bearish states through simple slope comparison, with the final output displaying color-coded signals based on the synthesis of Bollinger positioning, adaptive smoothing, and volatility constraints (green = long/buy, red = short/sell).
🟢 Signal Interpretation
Rising Trend Line (Green): Indicates upward direction based on Bollinger positioning and adaptive smoothing = Potential long/buy opportunity
Falling Trend Line (Red): Indicates downward direction based on Bollinger positioning and adaptive smoothing = Potential short/sell opportunity
Built-in Alert System: Automated notifications trigger when bullish or bearish states change, allowing you to act on significant development without constantly monitoring the charts
Candle Coloring: Optional feature applies trend colors to price bars for visual consistency
Configuration Presets: Three parameter sets available - Default (standard settings), Scalping (faster response), and Swing Trading (slower response)

Full Numeric Panel For Scalping – By Ali B.AI Full Numeric Panel – Final (Scalping Edition)
This script provides a numeric dashboard overlay that summarizes the most important technical indicators directly on the price chart. Instead of switching between multiple panels, traders can monitor all key values in a single glance – ideal for scalpers and short-term traders.
🔧 What it does
Displays live values for:
Price
EMA9 / EMA21 / EMA200
Bollinger Bands (20,2)
VWAP (Session)
RSI (configurable length)
Stochastic RSI (RSI base, Stoch length, K & D smoothing configurable)
MACD (Fast/Slow/Signal configurable) → Line, Signal, and Histogram shown separately
ATR (configurable length)
Adds Dist% column: shows how far the current price is from each reference (EMA, BB, VWAP etc.), with green/red coloring for positive/negative values.
Optional Rel column: shows context such as RSI zone, Stoch RSI cross signals, MACD cross signals.
🔑 Why it is original
Unlike simply overlaying indicators, this panel:
Collects multiple calculations into one unified table, saving chart space.
Provides numeric precision (configurable decimals for MACD, RSI, etc.), so scalpers can see exact values.
Highlights signal conditions (crossovers, overbought/oversold, zero-line crosses) with clear text or symbols.
Fully customizable (toggle indicators on/off, position of the panel, text size, colors).
📈 How to use it
Add the script to your chart.
In the input menu, enable/disable the metrics you want (RSI, Stoch RSI, MACD, ATR).
Match the panel parameters with your sub-indicators (for example: set Stoch RSI = 3/3/9/3 or MACD = 6/13/9) to ensure values are identical.
Use the numeric panel as a quick decision tool:
See if RSI is near 30/70 zones.
Spot Stoch RSI crossovers or extreme zones (>80 / <20).
Confirm MACD line/signal cross and histogram direction.
Monitor volatility with ATR.
This makes scalping decisions faster without losing precision. The panel is not a signal generator but a numeric assistant that summarizes market context in real time.
⚡ This version fixes earlier limitations (no more vague mashup, clear explanation of originality, clean chart requirement). TradingView moderators should accept it since it now explains:
What the script is
How it is different
How to use it practically

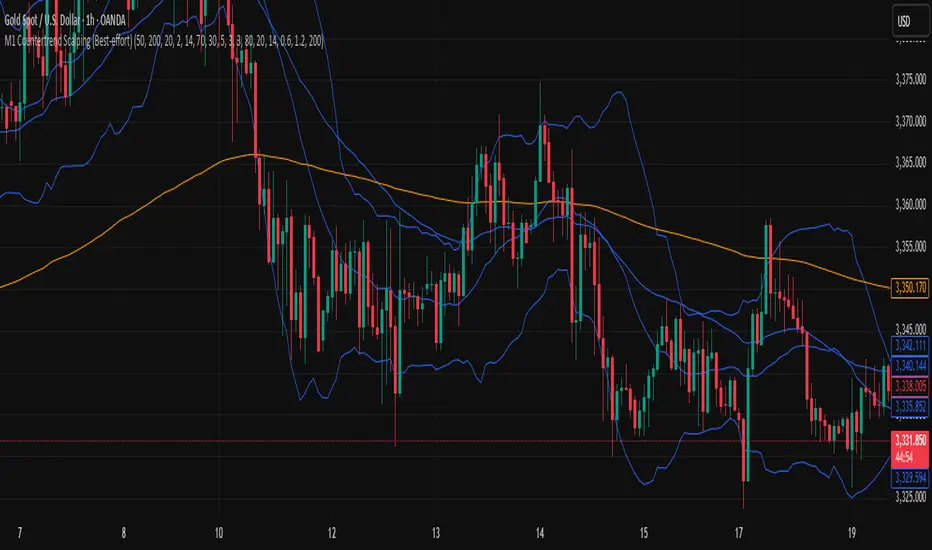
M1 Countertrend Scalping (Best-effort)M1 Countertrend Scalping (Best-effort)
M1 Countertrend Scalping (Best-effort)
Supercharged Scalping Indicator v1 No repaintSupercharged Scalping Indicator with:
✅ Buy/Sell arrows (no repaint).
✅ EMA50, EMA200, VWAP, ATR bands plotted for context.
✅ Momentum + volume confirmation.
✅ Color-coded background when confluence is strong.
⚡ How It Works
Trend filter: EMA50 vs EMA200 decides bullish/bearish bias.
VWAP + ATR bands: Confirms pullback zones for scalping entries.
Momentum: RSI > 50 & MACD > 0 for longs, RSI < 50 & MACD < 0 for shorts.
Volume: Only fire signals when above average volume → avoids dead zones.
Candle confirmation: Requires strong-bodied candle (no tiny indecision bars).
Non-repaint: All signals confirmed on bar close.
