Stoch RSI, Div, Zone S3 by Gammaprod>> How to use this indicator :
1. Set your teadingview theme to dark theme.
2. My indicator is valid for forex, stock and but more valid for crypto.
3. Use three timeframe for more validation (choose between those, that fit to your trading style) :
- Timeframe 1m, 5m, and 15m for Scalping
- Timeframe 30m, 1h and 4h for Intraday
- Timeframe 4h, 1D and 1W for Swing Trading
4 . Always use THREE INDICATORS FROM GAMMAPROD, those three indicators is back to back each other, by the way, I only made those three indicators only (for now) :
- Trendlines Boll Ichi Crypto by Gammaprod
- Stoch RSI Divs Zone Crypto by Gammaprod
- MACD Volume Crypto by Gammaprod
>> How to setting :
1. Trendlines Boll Ichi Crypto by Gammaprod
A. Support and Resistence
- Well if you familiar with this indicator you can add it, but recommended for Timeframe 30m or more
B. Trendlines Primary or Trendlines Secondary
- Timeframe 1m you DON'T NEED Trendlines Primary or Trendlines Secondary
- Timeframe 5m you DON'T NEED Trendlines Secondary, but you CAN ADD Trendlines Primary if you fell it helpful (for me, it is helpful to find where the candles start or the end trend or a consolidation or where the candles will surpass a resistance or a support).
- Timeframe 15m you DON'T NEED Trendlines Secondary, DEFENITELY add Trendlines Primary it will help to find where the candles stop or a consolidation or where the candles will surpass a resistance or a support).
- Timeframe 30m or more, DEFENITELY NEED BOTH Trendlines Primary and Secondary Trendlines, it will help to find where the candle stop or consolidation or where the candle will surpass a resistance or support).
C. Bolinger, Ichimoku Cloud and Lagging Span
- Please DON'T CHANGE IT at all, it's really helpful to know when and where to make an entry decesion or a trend or a consolidation, if you don't understand how to read it, you better to learn it first (on "how to read" section and "How to OPEN position" the section below)
2. Stoch RSI Divs Zone Crypto by Gammaprod (DON'T CHANGE IT)
3. MACD Volume Crypto by Gammaprod (DON'T CHANGE IT)
>> How to read :
1. Sell or Buy Priority :
A. Buy Priority
- Color background on macd and stoch rsi is pink or purple sell is the priority, (if you're not sure to buy, just wait until the best moment to sell)
B. Buy Priority
- Color background on macd and stoch rsi Teal or light green buy is the priority, (if you're not sure to sell, just wait until the best moment to buy)
C. Indecision / Golden Moment
- Color background on stoch rsi yellow is indecision / golden moment of reversal pattern (wait until it formed background only on Stoch RSI), please becareful at this moment.
2. Trend / Consolidation :
A. BULLISH trend
- When Stoch RSI and MACD have teal or light green background that's means BULLISH trend, better to confirm by the candle is above green cloud and lagging span (red line) is also above the candle.
B. BEARISH trend
- When Stoch RSI and MACD have the Pink or purple background that's means BEARISH trend, better to confirm by the candle is above purple cloud and lagging span (red line) is also below the candle.
C. CONSOLIDATION
- When Stoch RSI have the mix background that's means CONSOLIDATION, better to confirm by the candle is in or near to green / purple cloud and lagging span (red line) is also on the candle.
3. Special Mark
A. Ideal Bullish :
- Near line 20 and green / teal background = When Stoch RSI have the char R / H on lime color label, that's means divergence or hidden divergence for buy position, if you not see this label that's means just a standard confirmation for buy
B. Not an Ideal Bullish :
- Near line 80 and green / teal background = if this happens make sure you know what happen, it could be a false signal or bullish continual pattern
C. Ideal Bearish :
- Near line 80 and pink / purple background = When Stoch RSI have the char R / H on lime color label, that's means divergence or hidden divergence for buy position, if you not see this label that's means just a standard confirmation for sell position.
D. Not an Ideal Bearish:
- Near line 20 and pink / purple background = if this happens make sure you know what happen, it could be a false signal or bearish continual pattern
E. The Beginning of Reversal (from BEARISH to BULLISH) :
- When Stoch RSI line shaping GREEN position is near 20.
- MACD lines still PINK, position lines is UNDER the HISTOGRAM, but the HISTOGRAM start to SHAPE FALL PINK (light pink) and the BACKGROUND still PINK / PURPLE.
- Position CANDLES NEAR BLUE line, NEAR PURPLE CLOUD, and lagging span (red line) STILL ON the area candle. (it used to be confirmed with the golden moment).
F. The Beginning of Reversal (from BULLISH to BEARISH) :
- When Stoch RSI line shaping PINK position is near 80.
- MACD lines still GREEN, position lines is ABOVE the HISTOGRAM, but the HISTOGRAM start to SHAPE FALL GREEN (light green) and the BACKGROUND still TEAL / GREEN.
- Position CANDLES NEAR WHITE line, NEAR TEAL CLOUD, and lagging span (red line) STILL ON the area candle. (it used to be confirmed with the golden moment).
G. False Signals, or It could be a Golden Moment (better to see it on TF 15 or bigger):
- Near line 20 or 80 and yellow background = When Stoch RSI have the char R / H on color label, that's means divergence or hidden divergence for buy / sell position, if you not see this label that's means just a standard confirmation for buy / sell depends on where the Stoch RSI line if near 20 that's means buy, near 80 means sell
>> How to OPEN position:
A. Bullish
1. Trendlines Boll Ichi Crypto by Gammaprod
- The candles above the green cloud.
- Lagging span (red line) above the candles.
- then open buy near yellow line (the first option) / blue line (the second option) (always confirm the position with two other indicators below).
2. Stoch RSI Divs Zone Crypto by Gammaprod
- Teal or Green background.
- The lines is shaping green.
- Better if on the bottom (at a range 20).
3. MACD Volume Crypto by Gammaprod
- Teal or Green background.
- The lines is shaped or shaping green.
- Better if at the green histogram.
B. Bearish
1. Trendlines Boll Ichi Crypto by Gammaprod
- The candles below the purple cloud.
- Lagging span (red line) below the candles.
- then open buy near yellow line (the first option) / white line (the second option) (always confirm the position with two other indicators below).
2. Stoch RSI Divs Zone Crypto by Gammaprod
- Pink or purple background.
- The lines are shaping pink.
- Better if the line on the top (at a range 80).
3. MACD Volume Crypto by Gammaprod
- Pink or purple background.
- The lines are shaped or shaping green.
- Better if at the pink histogram.
C. Consolidation
1. Trendlines Boll Ichi Crypto by Gammaprod
- The candles on the cloud (green or purple).
- Lagging span (red line) on the candles.
- then open buy near the white or blue line (always confirm the position with two other indicators below).
2. Stoch RSI Divs Zone Crypto by Gammaprod
- Mix background specially on a timeframe 15m or more.
- The line move fast up and down.
- Better if on the bottom or the top of the lines (at a range 20 or 80).
3. MACD Volume Crypto by Gammaprod
- Changing the background.
- The line is near the middle line.
- Have small Histogram.
>> The secret ingridient is comparing the timeframe :
The example scalping (Timeframe 1m, 5m and 15m)
- TF 1m is for making an open position.
- TF 5m is for making a judgement of the trend market.
- TF 15m is to confirm that judgement from TF 5m, be careful if it not similar then it used to be a consolidation or the beginning of the reversal.
There's a lot a way to open the position than above information that i gave it to you, but consider there are a limit char on this column, I hope it will help your trading and make a more profit on it.
Wyszukaj w skryptach "scalping"

Bogdan Ciocoiu - Code runnerDescription
The Code Runner is a hybrid indicator that leverages other pre-configured, integrated open-source algorithms to help traders spot regular and continuation divergences.
The Code Runner specialises in integrating some of the most popular oscillators well known for their accuracy when scalping using divergence strategies.
Uniqueness
The Code Runner stands out as a one-stop-shop pack of oscillator algorithms that traders can further customise to spot divergences.
The indicator's uniqueness stands from its capability to recast each algorithm to apply to the same scale. This feature is achieved by manually adjusting the outputs of each algorithm to fit on a scale between +100 and -100.
Another benefit of the Code Runner comes from its standardisation of outputs, mainly consisting of lines. Showing lines enables traders to draw potential regular and continuation divergences quickly.
The indicator has been pre-configured to support scalping at 1-5 minutes.
Open-source
The Code Runner uses the following open-source scripts and algorithms:
www.tradingview.com
www.tradingview.com
www.tradingview.com
www.tradingview.com
www.tradingview.com
www.tradingview.com
www.tradingview.com
www.tradingview.com
These algorithms are available in the public domain either in TradingView space or outside (given their popularity in the financial markets industry).

Crypto EMA Trend Reversal StrategyThis is an EMA crossover strategy which involves 5 EMAs to trigger trades. The strategy has two take profit settings and uses a stop loss.
TP1 and SL are based on ATR and TP2 is an EMA crossover.
The strategy goes both long and short and the default settings work particularly well as a scalping strategy for ETHUSDT on the 5M time frame.
I have also created another version with tweaked settings for scalping LINKUSDT on the 5M with very similar results.
There is an option to add a volume condition parameter within the script on lines 26-28 which can be added to the end of lines 34-35 in the following format: and vol_cond
I personally don't currently use the volume condition parameter.

EBB & Flow: a multi-EMA-based BB cloudIntro
This is an idea evolved out of the market maker method and EMA convergence, divergence, and mean reversion.
The market maker method informs us that the 5, 13, 50 and 200 EMAs are important to regulating price. Those EMA lengths are multiples of the 50 and 200 on lower major timeframes -- the 1 minute, 5, 15, 1H, 4H, 1D. I include the 21 because it is also a multiple and in crypto very often respected.
When market makers are testing price, they set their range and spike in the direction they test for liquidity. This can get chaotic. For instance, in a shorter time frame consolidation inside a bigger timeframe uptrend, it can be too easy to forget where you are in the many trends playing out.
When the EMAs are dragged over each other during normal price movement, you get these crisscrossing tracks of price, and the individual breaks can be hard to trace.
The range is what matters, ultimately, and the range is dynamic. In that case, the Bollinger Band is a great tool for detecting outliers in this case.
The Answer
So the answer this indicator seeks to give, is to look for outliers. This gives you a scalping strategy built on Traders Reality thinking and best put together with the PVSRA indicator, which I may include in this indicator just for the sake of concision, but they can work alongside each other or separately.
The key thing is the different EMA clouds, which are bollinger bands. Tight bands mean imminent breaks, favouring the trend. Vector candles out of a zone, pins to the low/high, etc. are all very relevant alongside this indicator.
You can also use it on its own and scalp the breaks of a cloud.
How it works
Each cloud is a standard deviation from their respective EMA, all in the same colour. The deviation multiple is 1.618 by default. Yes, fibonacci sequences are usually nonsense, but it works better with the BB than 2, 2.5 or 3.
Using just the clouds, you can see where each EMA is headed and how it behaves within the deviation of the others.
But that on its own isn't enough.
The indicator will also print snowflakes above and below the candle for notable outliers. It will be in the colour of the cloud it breaks, but only if that break is also breaking the smaller EMA clouds too.
The most snowflakes will be yellow because that's the 13 EMA. That one is dependent on nothing else and every break will print a snowflake. The 21 will be dependent on the 13. The 50 dependent on the 13 and 21 breaks. The 200 the most important.
For example, if the 200 EMA-BB or EBB is broken at the upper band, deviating by more than 162% of price over a 200 period EMA, and that break is not above the 50 EMA cloud, there will be no snowflake. However, if it exceeds the 13, 21, 50, and 200 clouds, then a purple snowflake will appear above the bar.
Any snowflake is an extreme in price. The purple is an especially good point of entry. That doesn't mean it is a perfect entry. You can build position from it, though, and be relatively certain of a price correction in the near future, because not only was this major EMA cloud violated, but all of the smaller ones too.
Reminder
You still need your PVSRA and candlesticks. This indicator on its own may have a nice hit rate for scalping and building position, as an alternative to the TDI or alongside it, but it is not enough on its own, just like the TDI.
Enjoy!

L1 Mid-Term Swing Oscillator v1Level: 1
Background
Oscillators are widely used set of technical analysis indicators. They are popular primarily for their ability to alert of a possible trend change before that change manifests itself in price and volume . They should work best in times of sideways markets.
Function
L1 Short-Mid-Long-Term Swing Oscillator puts three terms of oscillators to cover short-term, middle-term and long-term oscillators at the same time. By resonating all these three oscillators, short-term scalping signal and middle term swing signal are disclosed. You can see both short and mid term signal under one indicator which give you more confidence to follow the trend.
Key Signal
I didn't handle the key signals well. I piled up all the useful signals I found, and it is really difficult to classify them one by one. I feel tired when I think about this problem. Therefore, the code of the overall signal is rather confusing, sorry.
Pros and Cons
Pros:
1. Three oscillators are used to cover short, mid, long term oscillations.
2. Short-Mid term resonance can be observed to have higher confidence level.
3. Use single indicator for scalping and swing trading is possible.
Cons:
1. No deep dive into very accurate long and short entries.
2. A trade off between sensitivity and stability may be needed by traders' subjective judge.
Remarks
I enjoyed the fun of put three different oscillator together to cover short, mid, long terms. But how to use them perfectly is really more brainstorming.
Readme
In real life, I am a prolific inventor. I have successfully applied for more than 60 international and regional patents in the past 12 years. But in the past two years or so, I have tried to transfer my creativity to the development of trading strategies. Tradingview is the ideal platform for me. I am selecting and contributing some of the hundreds of scripts to publish in Tradingview community. Welcome everyone to interact with me to discuss these interesting pine scripts.
The scripts posted are categorized into 5 levels according to my efforts or manhours put into these works.
Level 1 : interesting script snippets or distinctive improvement from classic indicators or strategy. Level 1 scripts can usually appear in more complex indicators as a function module or element.
Level 2 : composite indicator/strategy. By selecting or combining several independent or dependent functions or sub indicators in proper way, the composite script exhibits a resonance phenomenon which can filter out noise or fake trading signal to enhance trading confidence level.
Level 3 : comprehensive indicator/strategy. They are simple trading systems based on my strategies. They are commonly containing several or all of entry signal, close signal, stop loss, take profit, re-entry, risk management, and position sizing techniques. Even some interesting fundamental and mass psychological aspects are incorporated.
Level 4 : script snippets or functions that do not disclose source code. Interesting element that can reveal market laws and work as raw material for indicators and strategies. If you find Level 1~2 scripts are helpful, Level 4 is a private version that took me far more efforts to develop.
Level 5 : indicator/strategy that do not disclose source code. private version of Level 3 script with my accumulated script processing skills or a large number of custom functions. I had a private function library built in past two years. Level 5 scripts use many of them to achieve private trading strategy.

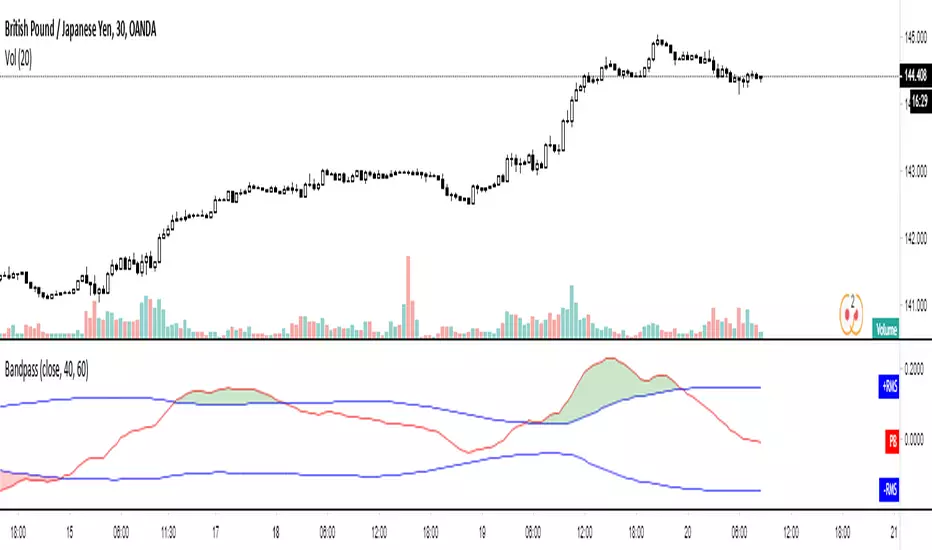
Bandpass Cycle Indicator [Ehlers]This indicator is NOT used for entry and exit conditions when trading. Instead, it's purpose is to tell you what the state of the market is: trending or cyclical.
>WHO IS THIS FOR?
This is especially useful for strategies that use scalping or martingale betting to turn a profit. You don't want to be caught in a bullish trend with several open short orders. Algo traders welcome.
>HOW DOES IT WORK?
I'm glad you asked. It's based on Ehlers' work regarding signal filtering. Essentially, it uses a bandpass filter to reduce noise that is inherent in the market and display the underlying frequency.
First, we get rid of the high-frequency noise - think jitters, long wicks, etc... price action that usually effects EMAs and other MAs. We don't want any of that.
Next, we get rid of low-frequency noise - this is a little more difficult to picture, but we're essentially ignoring cycles (Elliot waves) from other longer time frames. We don't care if the Daily bars are just about to reverse if it doesn't affect our scalping strategy.
Finally, we find the root mean square (RMS) of the high and low points of our newly created signal (red) and plot them (black). These will act as triggers to tell us if a market is in cycle or trending.
>HOW DO YOU READ IT?
Background colors:
-Blue is cycle - you're safe.
-Red is trending down
-Green is trending up
Crossovers:
-Red above Upper Black: Uptrend
-Red below Lower Black: Downtrend
-Red in the middle: Cycle
>IS IT PREDICTIVE?
Momentum tends to pick up quickly and decline quickly, so if you'll often see a small Red or Green strip before a large price movement.
After long periods of cyclic movement (or consolidation), there isn't much momentum in the system, so any small price action will be considered a trend -> these small movements are picked up by other human traders and bots. Trading volume increases more and more until you have a swing in one direction.
So yes, it can be predictive due to the nature of signals and oscillation. Maybe not necessarily predictive of which direction price will go, but when volatility is about to increase.
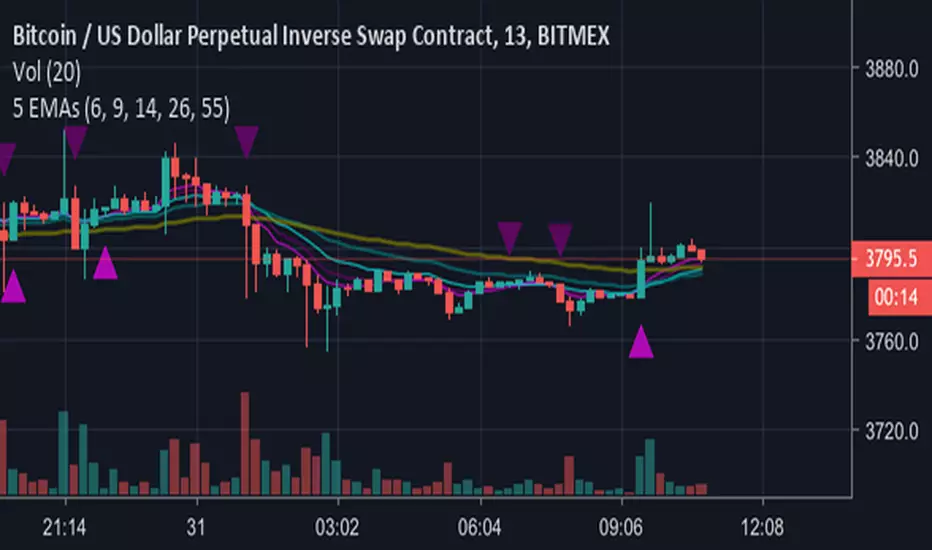
5 EMAs plus Crossing AlertsHi all,
This is a simple indicator that plots 5 EMA lines of your choice to the screen.
Can be used to trigger scalping Bots (stoploss around 0.5% recommended, take profit 1% or higher, please backtest!)
Also can be used for manual scalping, 1 or 2 candles at a time.
Features:
1) Alerts are triggered when EMAs 1 (Signal line) and 2 (Baseline) cross - a Long signal is called if the cross is above EMA 3 (Trendline), a short if the cross is below EMA3
2) Signals are represented visually as a triangle on the chart, below the candles is a long, above is a short
3) TradingView Alerts can be easily set as I have labelled the signals clearly as many other Indicators like this aren’t easy to work out if trying to create alerts to trigger a 3commas bot, for example!
Each EMA is fully customisable and if you wish to take advantage of the alerts, only a few simple rules need to be followed:
EMA1 needs to be less than EMA2.
EMA2 needs to be the same or greater than EMA3
That’s it, happy trading!
Big shout out to B and the gang over at Crypto Trading Group!
BB+AO STRATto be used with AO indicator, based on forex strat --
www.forexstrategiesresources.com
works on 1/3/5/15/30 candles, buy signals are best when the black 3 fast ema crosses up through the red mid band

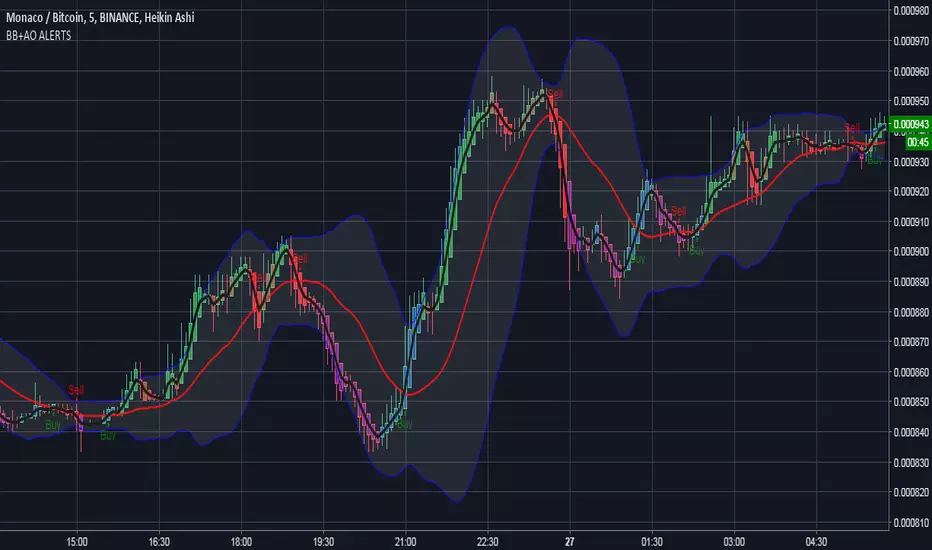
BB+AO ALERTSto be used with AO indicator, based on forex strat --
www.forexstrategiesresources.com
works on 1/3/5/15/30 candles, buy signals are best when the black 3 fast ema crosses up through the red mid band
BB+AO STRATto be used with AO, based on forex strat --
www.forexstrategiesresources.com
works on 1/3/5/15/30 candles

Ultimate Trend Dashboard [Multi-Timeframe]This is a Universal Market Scanner designed for Crypto, Forex, and Metals (Gold/Silver). Instead of checking multiple charts one by one, this dashboard monitors 4 different timeframes instantly from a single screen.
### 🧠 How It Works ( The Logic) The system uses a "Double Confirmation" strategy to determine the true trend direction: 1. Supertrend: Checks if the momentum is Bullish or Bearish. 2. EMA 200 Filter: Checks if the price is above or below the 200-period Exponential Moving Average (The most important long-term trend line).
A signal is only generated if BOTH indicators agree.
### 📊 Dashboard Overview The panel on the screen scans the following timeframes (Adjustable in settings): * 15 Minutes (Scalping Trend) * 1 Hour (Intraday Trend) * 4 Hours (Swing Trend) * Daily (Major Trend)
### 🚦 How to Use (Step-by-Step)
1. Look at the "TOTAL" Row: The script calculates a score based on all timeframes.
2. STRONG BUY 🚀 (All Green): * Meaning: All timeframes (Short & Long term) are Bullish. * Action: Look for Long entries. Do not Short.
3. STRONG SELL 🔻 (All Red): * Meaning: All timeframes are Bearish. * Action: Look for Short entries. Do not Buy.
4. NEUTRAL ⚠️ (Mixed Colors): * Meaning: The market is confused (e.g., Daily is Bullish but 15min is Bearish). * Action: Wait. Do not force a trade until the trend aligns.
### ⚙️ Customization * You can change the Timeframes (e.g., set them to 5m, 15m, 1h, 4h) in the settings. * You can move the table position (Right, Left, Center) to fit your screen. * Works on ANY asset class (BTC, ETH, XAUUSD, EURUSD, Stocks).

TXG Wick DetectorOverview The TradeX Guru Wick Detector is a price action utility designed to automatically identify potential "Liquidity Grabs" and "Stop Hunts." It highlights candles where the market has aggressively rejected lower prices, signaling that Smart Money may be absorbing sell orders (the "Samosa Crust Break").
How It Works This script calculates the ratio of the lower wick relative to the total candle range.
If the lower wick represents more than 50% of the total candle size (customizable), a Teal Diamond (💎) is plotted below the bar.
This visual cue alerts you to a strong rejection of lower prices, often found at the end of a correction or during a "Stop Hunt" at key support levels.
Features
Automated Detection: Instantly spots high-rejection candles across any timeframe.
Customizable Sensitivity: Adjust the "Wick %" threshold in the settings to filter for stronger or weaker signals.
Visual Clarity: Non-intrusive diamond markers that do not clutter your chart.
Watermark: Includes the TradeX Guru brand mark for easy sharing.
🚀 How to Use This Tool for Analysis
Do not trade every diamond blindly. Use this 3-Step "Pro" Protocol to filter for high-probability setups:
1. Location (Context is King) Only consider signals that appear at Key Areas of Value:
Support Zones: Is price testing a historical support line?
Round Numbers: Is the signal near a psychological level (e.g., Nifty 25,000, BankNifty 50,000)?
High Volume Nodes (VPVR): Is price rejecting a high-volume cluster?
Rule: If a diamond appears in the middle of a random trend ("No Man's Land"), ignore it.
2. The Trap (The Hunt)
Watch for price to dip below your key level first.
The appearance of the Teal Diamond confirms that this dip was rejected. This suggests that "Stop Loss Liquidity" was hunted and absorbed by institutional buyers.
3. The Trigger (Entry & Risk)
Entry: Wait for the diamond candle to close. Enter on the next candle if bullish momentum continues.
Stop Loss: Place your SL strictly below the Low of the diamond candle.
Logic: If price breaks below the wick, the rejection has failed, and the setup is invalid.
Settings Guide
Wick Size % (Default 0.50): The wick must be 50% of the candle.
Increase to 0.60 for fewer, higher-quality signals.
Decrease to 0.40 for more frequent signals (scalping).
Disclaimer This tool is for educational purposes only. Price action patterns do not guarantee future performance. Always manage your risk.

Koko's Capital Flow Channel Koko’s Capital Flow Channel is a structured EMA channel system designed to reduce over-trading and eliminate chase entries. It separates Early Direction signals (clearing bars) from Smart Entries (inside-channel confirmations), helping traders execute with patience and clarity.
Koko’s Capital Flow Channel™ provides a clean, psychology-friendly framework for traders transitioning from fast scalping to higher timeframes.
What it does
This indicator uses an EMA-based channel to define structure and trend flow, then delivers two tiers of signals:
Early Direction Signals (Early BUY / Early SELL)
Trigger on a clearing bar (break/close condition depending on your setting)
Used for directional awareness and early positioning
Smart Entry Signals (BUY-S / SELL-S)
Trigger only when price returns inside the channel and prints a qualifying candle
Designed to reduce impulsive entries and improve execution quality
Why it’s different
Many tools fire signals everywhere. This channel is built to create clarity and restraint:
Less noise
Fewer, higher-quality signals
Built-in structure + intent filters
Optional ATR filtering to avoid low-quality breaks
Best use cases
Daily / swing trading
Trend continuation and pullback entries
Traders learning discipline and consistency
Burned-out scalpers who want calmer, higher-quality setups
Recommended settings
Timeframe: Daily (works on others but Daily is the intended home)
Start with:
Clearing Bar Mode: Cross (or Over/Under “event” logic if enabled)
Candle Body: Body Only
Intent: Bullish/Bearish Candle
ATR Filter: Clearing Bar Strength, ATR(14), Multiplier 1.0
Signal Key
BUY-E / SELL-E = Early Direction signal (clearing bar)
BUY-S / SELL-S = Smart Entry signal (inside-channel confirmation)
5) How to Use It (simple instructions section)
Workflow
Wait for Early BUY-E / SELL-E to confirm flow direction
Only take Smart Entries (BUY-S / SELL-S) when price returns inside the channel
Use the channel boundaries for structure (helps avoid chasing)
Alerts
You can create alerts for:
Early BUY / Early SELL
Smart BUY / Smart SELL
Risk Disclaimer (safe + standard)
Disclaimer: This indicator is for educational and informational purposes only and is not financial advice. Markets involve risk. Always manage risk appropriately and test settings before live use.

Adaptive Trend Flow (ATF)Adaptive Trend Flow (ATF) is a custom trend-following indicator designed to work reliably across all markets and all timeframes.
It uses an adaptive moving average that automatically adjusts to market conditions, combined with trend slope analysis and a volatility filter to reduce noise during ranging periods.
Unlike traditional fixed moving averages, ATF reacts faster during strong trends and slows down during consolidation, helping traders stay aligned with meaningful price movements.
🔍 How It Works
Uses an adaptive smoothing algorithm to track price efficiently
Confirms trend direction using trend slope
Filters out low-volatility and choppy conditions using ATR-based logic
Does not repaint — signals are based only on confirmed data
📊 Visual Interpretation
🟢 Green line / background → Bullish trend
🔴 Red line / background → Bearish trend
⚪ Gray → No clear trend (range / low volatility)
⚙️ Features
Works on Crypto, Forex, Stocks, Futures
Compatible with all timeframes
Optional trend-change signals
Optional background highlighting
Fully customizable inputs
Alert-ready
🎯 Best Use Cases
Trend filter for entries and exits
Directional bias for scalping, day trading, or swing trading
Strategy backbone when combined with price action or momentum tools
⚠️ Disclaimer
This indicator is for educational and analytical purposes only and does not constitute financial advice. Always manage risk appropriately.

Pivot Levels Real-Time Latest Bar (Skip Current, With Zones)ddPivot Levels Real-Time Indicator with Shaded Zones
Author: Ammar Hasan
Overview
The Pivot Levels Real-Time Indicator is a TradingView Pine Script (v5) indicator that plots classic pivot levels using the most recently confirmed bar while skipping the currently forming bar.
It enhances the chart with shaded zones between pivot levels to help visualize potential support, resistance, and price reaction areas.
Key Features
Uses the latest confirmed bar only (no repainting)
Plots Pivot, S1, S2, S3 and R1, R2, R3
Displays shaded zones between levels
Automatically removes old drawings to keep the chart clean
Lightweight and suitable for lower timeframes
No labels for a clean visual layout
Pivot Level Calculations
Pivot (P) = (High + Low + Close) / 3
Support Levels
S1 = 2 x Pivot - High
S2 = Pivot - (High - Low)
S3 = Low - 2 x (High - Pivot)
Resistance Levels
R1 = 2 x Pivot - Low
R2 = Pivot + (High - Low)
R3 = High + 2 x (Pivot - Low)
All values are calculated using the last confirmed candle to ensure stable, non-repainting levels.
Visual Components
Lines
The pivot line is drawn in yellow and slightly thicker for emphasis.
Support lines are drawn in red.
Resistance lines are drawn in green.
Shaded Zones
Resistance Zones
R3 to R2
R2 to R1
R1 to Pivot
Support Zones
Pivot to S1
S1 to S2
S2 to S3
These zones help visualize supply and demand areas and potential price reaction zones.
Use Cases
Intraday trading
Scalping
Support and resistance analysis
Price action confirmation
Notes and Limitations
Levels update once per confirmed candle
Zones are drawn only for a short forward range by default
This indicator is not intended to be used as a standalone trading system
Conclusion
The Pivot Levels Real-Time Indicator with Shaded Zones provides a clean and reliable visualization of key market levels while avoiding repainting. The shaded zones add depth and context, helping traders better understand price behavior around important levels.
Developed by Ammar Hasan

Lipsius Pure Momentum (1m/5m/15m/1h)Description:
Overview This script provides a complete, mechanical scalping strategy designed for 5m, 10m, and 15m timeframes. It combines trend filtering with momentum confirmation to identify high-probability entries while keeping you out of choppy markets.
It features a Real-Time Dashboard that tells you the current market state at a glance: Bullish, Bearish, or Neutral.
How it Works (The Logic) The strategy is built on three core pillars:
EMA 200 (Trend): Determines the long-term direction.
VWAP (Volume/Value): Acts as the dynamic "fair value" level.
RSI (Momentum): Measures the strength of the move.
Entry Rules
LONG Signal (Green 'L'):
Price must be ABOVE both the EMA 200 and the VWAP.
RSI must be healthy (oversold enough to have room to grow).
Trigger: RSI crosses above the 50-line.
SHORT Signal (Red 'S'):
Price must be BELOW both the EMA 200 and the VWAP.
RSI must be healthy (not already oversold).
Trigger: RSI crosses below the 50-line.
NO TRADE (Neutral):
If the price is trapped between the EMA and VWAP, the dashboard will show NEUTRAL. This is a chop zone—do not trade.
Features
Asset Class Switcher: Select "Crypto" (uses standard Volume VWAP) or "Forex" (uses a fallback calculation if volume data is missing) in the settings.
Live Dashboard: Displays the status of the EMA, VWAP, RSI, and the final Trading Bias (Seek Long / Seek Short).
Timeframe Monitor: The dashboard warns you (Orange color) if you are not on the recommended 5m, 10m, or 15m charts.
Settings
EMA Length: 200 (Default)
RSI Length: 14 (Default)
Asset Class: Toggle between Crypto and Forex.

Crypto MMFCrypto MMF Indicator:
The Crypto Money Flow (MMF) indicator represents an advanced technical analysis tool specifically designed for cryptocurrency markets. This document outlines the logical foundation for its component integration, explains the synergistic mechanisms between its constituent elements, and provides practical implementation guidance without making unrealistic performance claims.
Integration Rationale
Volume-Weighted Momentum Analysis
The primary integration rationale combines price momentum with trading volume—two fundamental market dimensions frequently analyzed in isolation. Traditional momentum oscillators like RSI measure price velocity but ignore transaction volume, potentially misrepresenting conviction behind price movements. By multiplying price changes by corresponding volume, the indicator creates a conviction-weighted momentum measure that distinguishes between high-volume breakouts and low-volume price fluctuations.
The theoretical foundation for this integration stems from market microstructure theory, which posits that volume accompanies informed trading. In cryptocurrency markets—where volatility is pronounced and manipulation attempts occur—volume confirmation provides valuable filtering of meaningful price movements from noise.
Multi-Timeframe Momentum Convergence
The second integration layer incorporates higher timeframe analysis, acknowledging that markets function across temporal hierarchies. While shorter timeframes offer precision for entry and exit timing, longer timeframes establish directional bias and filter out insignificant counter-trend movements. This multi-timeframe approach follows established technical analysis principles that prioritize trend alignment across time horizons.
This integration is particularly relevant for cryptocurrency traders, as these markets exhibit strong momentum characteristics where higher timeframe trends often dominate shorter-term fluctuations. The higher timeframe component serves as both a trend filter and early warning system for momentum divergences.
Component Synergy Mechanism
Core Calculation Components
Price-Volume Integration Engine
The indicator begins by calculating the average of open, high, low, and close prices (OHLC4), providing a balanced price representation less susceptible to intra-period anomalies. This value undergoes differencing to establish direction, then multiplies by volume to create volume-weighted momentum values. This transformation produces two separate data streams: upward volume-weighted momentum and downward volume-weighted momentum.
Exponential Smoothing Application
Both momentum streams undergo exponential smoothing using Wilder's Relative Moving Average methodology. This approach applies greater weight to recent observations while maintaining memory of historical patterns, striking an optimal balance between responsiveness and noise reduction. The smoothed upward and downward momentum values create a ratio representing the relative strength between buying and selling pressure.
Normalization Process
The momentum ratio undergoes mathematical normalization to produce a bounded oscillator ranging from 0 to 100. This normalization enables consistent interpretation across different market conditions, timeframes, and cryptocurrency pairs, establishing standardized overbought and oversold thresholds.
Multi-Timeframe Synchronization System
Hierarchical Timeframe Calculation
The indicator dynamically determines appropriate higher timeframes based on user-defined multipliers and current chart intervals. This automated calculation eliminates manual timeframe selection errors while ensuring logical temporal relationships between analyzed periods.
Cross-Timeframe Data Retrieval
A secure data retrieval mechanism accesses higher timeframe momentum calculations without introducing future bias or repainting. This process maintains data integrity while enabling direct comparison between current and higher timeframe momentum conditions.
Higher Timeframe Smoothing Layer
An additional exponential moving average smooths the higher timeframe data, reducing noise and creating a stable reference signal for divergence analysis. This smoothing parameter is independently adjustable, allowing users to balance sensitivity and stability according to their trading style.
Signal Generation Framework
Threshold-Based Zone Analysis
The indicator establishes three operational zones based on statistical observations of momentum extremes:
Neutral zone (25-75): Represents balanced market conditions
Lower extreme zone (0-25): Indicates potential oversold conditions
Upper extreme zone (75-100): Indicates potential overbought conditions
These threshold levels derive from empirical observations of momentum oscillator behavior in trending and ranging cryptocurrency markets, though optimal values may vary across different market regimes.
Conditional Signal Categorization
The system monitors four distinct momentum conditions:
Initial extreme readings: Momentum enters extreme zones without confirmation
Confirmed extremes: Smoothed momentum follows into extreme zones
Multi-timeframe alignment: Current and higher timeframe momentum move in concert
Multi-timeframe divergence: Current and higher timeframe momentum diverge
Each condition category carries different interpretive implications, with stronger signals emerging when multiple conditions converge.
Practical Implementation Guidelines
Functional Applications
Trend Confirmation Protocol
When price trends directionally with momentum maintaining consistent readings above or below the midpoint (50), and higher timeframe momentum confirms the direction, this suggests sustainable trend conditions. The volume-weighting component further validates whether significant trading activity supports the price movement.
Divergence Detection Methodology
Three divergence types merit monitoring:
Classic divergence: Price reaches new extremes while momentum fails to confirm
Hidden divergence: Price retraces within a trend while momentum suggests trend continuation
Timeframe divergence: Momentum moves opposite directions across timeframes
Divergence analysis proves most reliable when occurring in conjunction with other technical factors such as support/resistance levels or chart patterns.
Zone-Based Risk Assessment
The oscillator's bounded nature facilitates structured risk assessment:
Extreme zone entries: Higher potential reward but require confirmation
Neutral zone movements: Lower signal clarity but potentially favorable risk-reward ratios
Zone transitions: Often precede accelerated price movements
Parameter Configuration Philosophy
Core Parameter Settings
The default parameters balance responsiveness and reliability across diverse cryptocurrency market conditions. The 14-period calculation length aligns with conventional momentum oscillator standards, providing sufficient data for meaningful smoothing while maintaining sensitivity to recent market developments.
Multi-Timeframe Multiplier Selection
The default 3x multiplier creates meaningful temporal separation without introducing excessive lag. This multiplier proves particularly effective for swing trading horizons, though position traders may benefit from larger multipliers while shorter-term traders might reduce this value.
Smoothing Parameter Considerations
Dual smoothing parameters (primary and higher timeframe) allow independent adjustment of sensitivity. More volatile cryptocurrency pairs typically benefit from increased smoothing, while less volatile conditions may permit reduced smoothing for earlier signal generation.
Interpretation Protocol
Step 1: Momentum Context Assessment
Begin analysis by determining the current momentum context:
Absolute level relative to threshold zones
Direction and velocity of recent momentum changes
Relationship to the midpoint (50) level
Step 2: Timeframe Alignment Evaluation
Compare current and higher timeframe momentum:
Confirm directional alignment for trend trading
Identify divergences for potential reversal scenarios
Assess convergence strength for position sizing decisions
Step 3: Volume Confirmation Analysis
Evaluate whether recent volume patterns support momentum readings:
Extreme momentum with declining volume: Caution warranted
Neutral momentum with increasing volume: Potential breakout precursor
Confirmed momentum with expanding volume: Higher conviction signal
Step 4: Market Context Integration
Correlate momentum readings with broader market context:
Correlated cryptocurrency movements
Overall market capitalization trends
Relevant news or fundamental developments
Originality and Differentiation
Innovative Design Elements
Volume-Integrated Momentum Calculation
Unlike conventional momentum oscillators that analyze price in isolation, this indicator integrates volume as a conviction multiplier. This integration follows logical market principles where volume validates price movements, creating a more robust momentum assessment particularly valuable in cryptocurrency markets where volume manipulation attempts occasionally occur.
Dynamic Timeframe Adaptation
The automated timeframe calculation system eliminates manual timeframe selection while ensuring logical temporal relationships. This approach reduces user error and maintains consistency across different charting intervals and trading instruments.
Multi-Layer Confirmation Framework
The indicator employs three analytical layers: raw momentum, smoothed momentum, and higher timeframe momentum. This layered approach provides graduated confirmation levels, allowing traders to distinguish between preliminary signals and confirmed conditions.
Theoretical Foundations
The indicator's design incorporates elements from multiple technical analysis disciplines:
Momentum analysis principles from oscillator theory
Volume-price relationships from market microstructure
Multi-timeframe analysis from hierarchical trend theory
Statistical normalization from quantitative analysis
This interdisciplinary approach creates a comprehensive tool addressing multiple dimensions of market analysis rather than focusing on isolated phenomena.
Risk Management Integration
Signal Quality Assessment
The indicator facilitates signal quality evaluation through multiple confirmation requirements:
Primary momentum extreme reading
Smoothed momentum confirmation
Higher timeframe alignment or constructive divergence
Supporting volume characteristics
Signal strength varies with the number of confirmed elements, enabling proportionate position sizing and risk allocation.
False Signal Mitigation
Several design elements reduce false signal susceptibility:
Volume-weighting filters low-conviction price movements
Exponential smoothing reduces noise-induced fluctuations
Multi-timeframe analysis filters counter-trend movements
Graduated confirmation requirements prevent premature action
These mechanisms collectively improve signal reliability while acknowledging that no technical indicator eliminates false signals entirely.
Implementation Considerations
Cryptocurrency Market Specificity
The indicator incorporates design elements particularly relevant to cryptocurrency markets:
24/7 market operation accommodation
High volatility regime compatibility
Volume data availability considerations
Cross-market correlation awareness
These adaptations enhance effectiveness in cryptocurrency trading environments while maintaining applicability to traditional financial markets.
Customization Guidelines
Users may adjust parameters based on:
Trading timeframe (scalping, day trading, swing trading)
Cryptocurrency pair characteristics (volatility, volume profile)
Risk tolerance and trading style
Market regime (trending, ranging, transitional)
Empirical testing across different parameter sets and market conditions provides the most reliable customization guidance.
Conclusion
The Crypto MMF indicator represents a logically integrated analytical tool combining volume-weighted momentum analysis with multi-timeframe perspective. Its component synergy creates a comprehensive market assessment framework while maintaining practical implementation feasibility. Users should integrate this tool within broader trading methodologies, combining its signals with additional technical, fundamental, and risk management considerations.
The indicator's value derives from its structured approach to market analysis rather than predictive capabilities. By providing organized information about momentum, volume relationships, and timeframe interactions, it supports informed trading decisions within appropriate risk parameters.

Scalp Breakout Predictor Pro - by Herman Sangivera (Papua)Scalp Breakout Predictor Pro by Herman Sangivera ( Papuan Trader )
Overview
The Scalp Breakout Predictor Pro is a high-performance technical indicator designed for scalpers and day traders who thrive on market volatility. This tool specializes in identifying "Squeeze" phases—periods where the market is consolidating sideways—and predicts the likely direction of the upcoming breakout using underlying momentum accumulation.
How It Works
The indicator combines three core mathematical concepts to ensure "Safe but Fast" entries:
Squeeze Detection (BB vs. KC): It monitors the relationship between Bollinger Bands and Keltner Channels. When Bollinger Bands contract inside the Keltner Channels, the market is in a "Squeeze" (represented by the gray background). This indicates that energy is being coiled for a massive move.
Momentum Accumulation (Pre-Signal): While the price is still moving sideways, the script analyzes linear regression momentum.
PRE-BULL: Momentum is building upwards despite price being flat.
PRE-BEAR: Momentum is fading downwards despite price being flat.
Breakout Confirmation: An entry signal is only triggered when the Squeeze "fires" (the price breaks out of the bands), ensuring you don't get stuck in a dead market for too long.
Key Features
Real-time Prediction Labels: Get early warnings (PRE-BULL / PRE-BEAR) to prepare for the trade before it happens.
Dynamic TP/SL Lines: Automatically calculates Take Profit and Stop Loss levels based on the Average True Range (ATR), adapting to the current market's "breath."
On-Screen Dashboard: A sleek table in the top-right corner displays the current market phase (Squeeze vs. Volatile), the predicted next move, and the current ATR value.
Pine Script V6 Optimized: Built using the latest version of TradingView’s coding language for maximum speed and compatibility.
Trading Rules
Preparation: When you see a Gray Background, the market is sideways. Watch the Dashboard for the "Potential" direction.
Anticipation: If a PRE-BULL or PRE-BEAR label appears, get ready to enter.
Execution: Enter the trade when the ENTRY BUY (Lime Triangle) or ENTRY SELL (Red Triangle) signal appears.
Exit: Follow the Green Line for Take Profit and the Red Line for Stop Loss.
Technical Settings
HMA Length: Adjusts the sensitivity of the trend filter (Hull Moving Average).
TP/SL Multipliers: Allows you to customize your Risk:Reward ratio based on ATR volatility.
Squeeze Length: Determines the lookback period for consolidation detection.
Disclaimer: Scalping involves high risk. Always test this indicator on a demo account before using it with live capital.

Multi-Layer Support Resistance & Auto TrendlineMulti-Layer Support Resistance & Auto Trendline (Multi-Timeframe Analysis)
Maximize your chart analysis with this advanced Support and Resistance (S/R) engine. This indicator automatically detects critical horizontal levels and diagonal trendlines across four different lookback periods, giving you a comprehensive view of market structure.
Why this indicator?
Universal Search Appeal: Ideal for traders looking for "Support and Resistance," "Auto Trendline," "Pivot Points," and "Gap Detection."
Multi-Layer Logic: Filters market noise by identifying levels from short-term scalping confirms to ultra-long-term historical walls.
Auto Trendlines: No more manual drawing. It automatically connects valid pivot highs and lows to visualize trend channels and breakouts.
Gap Analysis: Automatically marks "Windows" (Gaps) as high-priority zones, often acting as magnetic levels for future price action.
Cyberpunk Aesthetics: High visibility neon colors with customizable transparency to keep your chart professional yet intuitive.
How to trade: Focus on price action where multiple layers (e.g., a diagonal trendline and a long-term horizontal line) intersect. These "confluence zones" offer higher probability trade setups.
多層型サポート&レジスタンス+自動トレンドライン(マルチ分析エンジン)
「サポート・レジスタンス」「自動トレンドライン」「窓(ギャップ)検知」を一つに統合した、高度な相場分析ツールです。4つの期間(短期・中期・長期・超長期)から価格の壁と流れを自動的に抽出し、精度の高いトレード戦略をサポートします。
本インジケーターの強み:
高い検索親和性: 「サポレジ」「自動トレンドライン」「ピボット」「窓埋め」などの普遍的な要素を全て網羅しています。
4層の多角ロジック: ノイズの多い短期的な節目から、歴史的に意識される超長期の壁までを階層的に表示。
自動トレンドライン: 高値・安値の更新に合わせて斜めのラインを自動描画。トレンドの転換やブレイクアウトを瞬時に判断できます。
ギャップ(窓)検知: 窓が開いた重要価格帯を自動マーク。窓埋めや反発の根拠として利用できます。
洗練されたデザイン: 視認性の高いネオンカラーを採用しつつ、層ごとの透明度や太さを自由に調整可能。チャートの美しさと実用性を両立しました。
活用方法: 複数のライン(例:斜めのトレンドラインと長期水平線)が重なる「コンフルエンス(根拠の重なり)」に注目してください。そこが最も反発やブレイクが期待できる強力なエントリーポイントになります。

ICT Silver Only Toolkit (XAGUSD) No Baby ICTThis indicator is designed exclusively for Silver (XAGUSD) and applies core ICT concepts to help traders identify high-probability smart-money setups. It automatically plots the Asia session range, London and New York killzones, previous day high/low, equal highs and lows (liquidity pools), Asia liquidity sweeps, and ICT fair value gaps (FVGs).
The toolkit also includes “Do Nothing” warning labels to help traders avoid low-quality conditions such as trading outside killzones, extended pre-NY moves, or impulsive candles. Built for precision and patience, this indicator supports traders who wait for liquidity, displacement, and retracement rather than chasing price.
Best used on 1–15 minute charts during London and New York sessions.
No indicators for bias guessing. No scalping gimmicks. Just clean ICT structure for Silver.

Reversal Detection System v3.3═══════════════════════════════════════════════════
REVERSAL DETECTION SYSTEM v3.3
Professional Multi-Feature Market Structure Analysis
═══════════════════════════════════════════════════
Born from 40+ years of trading experience across commodities, stocks, and futures markets. After founding multiple successful companies including Anchor Financial and U.S. Investors Group, I shifted focus entirely to trading, spending 12 years specializing in micro futures scalping (MNQ, MES, MYM, MGC, MCL). This system represents 20+ years of indicator development on ThinkScript, now converted to TradingView to help the trading community.
DEVELOPER: NPR21 - Retired sales executive, professional day trader, second-degree black belt in Tae Kwon Do (discipline shapes trading mindset). Converting my personal ThinkScript library to TradingView to share proven tools with the community.
═══════════════════════════════════════════════════
CORE FEATURES
═══════════════════════════════════════════════════
✓ REVERSAL DETECTION - Adaptive ATR-based with 5 sensitivity presets (Very High to Very Low) plus custom mode. Non-repainting confirmed signals with optional preview.
✓ SMART MONEY CONCEPTS - BOS (Break of Structure) continuation signals and CHoCH (Change of Character) reversal warnings. Fractal-based institutional footprint tracking.
✓ PREMIUM/DISCOUNT ZONES - Three-zone price structure (Premium/Equilibrium/Discount) with volume-based strength analysis. Shows actual buy/sell pressure from last 20 bars with Strong/Weak High/Low labels.
✓ ORDER BLOCKS - Volumetric split visualization showing buy/sell pressure ratios. Automatic mitigation detection with breaker zones (flipped polarity). Shows institutional entry zones.
✓ FAIR VALUE GAPS (FVG) - Three-candle gap detection with 50% Consequent Encroachment lines. Dynamic fill percentage tracking with auto-cleanup when filled.
✓ MOBIUS TREND PIVOTS - Institutional-grade pivot system with True Range-based target zones. Dynamic cloud visualization with real-time long/short entry signals and risk offset lines.
✓ STRONG/WEAK HIGHER HIGHS & LOWER LOWS - Market structure shift detection with strength percentages showing momentum conviction.
✓ SUPPLY/DEMAND ZONES - Rectangular zones at confirmed reversal pivots with adjustable display limits.
═══════════════════════════════════════════════════
WHY THIS WORKS
═══════════════════════════════════════════════════
Each feature captures different institutional behavior:
- Premium/Discount = Where smart money accumulates vs distributes
- Order Blocks = Exact zones where institutions placed large orders
- BOS/CHoCH = Trend structure confirmation and reversal warnings
- FVG = Inefficient price discovery that gets filled
- Mobius = Pivot-based target zones with high hit rates
- Volume Strength = Actual order flow conviction (not price-based guesses)
═══════════════════════════════════════════════════
QUICK START
═══════════════════════════════════════════════════
1. Choose sensitivity: High (1-5m), Medium (15m-1H), Low (4H-Daily)
2. Enable features you want (all ON by default)
3. Set ONE alert: "STRONG Bullish/Bearish Signal" for best setups
4. Paper trade 1-2 months before going live
SCALPERS (1-5m): Use Very High sensitivity, focus on Order Blocks + Mobius signals
DAY TRADERS (15m-1H): Use Medium sensitivity, focus on BOS/CHoCH + Premium/Discount
SWING TRADERS (4H-Daily): Use Low sensitivity, focus on major structure + Strong/Weak HL
═══════════════════════════════════════════════════
CUSTOMIZATION
═══════════════════════════════════════════════════
- Independent text size controls for ALL label types (Tiny/Small/Normal/Large)
- Adjustable swing high/low line width (1-5)
- Customizable zone extensions and lookback periods
- Color customization for all components
- Toggle each feature independently
- Real-time info dashboard showing active features
═══════════════════════════════════════════════════
ALERT SYSTEM
═══════════════════════════════════════════════════
Available alerts:
- Bullish/Bearish Reversals
- BOS and CHoCH (structure breaks)
- Fair Value Gaps
- Mobius pivot crossovers
- Strong confluence signals (reversal + trend aligned)
Recommended: Start with "STRONG Bullish/Bearish Signal" - these require multiple confirmations and have highest win rates.
═══════════════════════════════════════════════════
WORKS ON
═══════════════════════════════════════════════════
✓ All timeframes (1m to Monthly)
✓ All instruments (Stocks, Forex, Futures, Crypto, Indices)
✓ Tested extensively on micro futures (MNQ, MES, MYM, MGC, MCL)
═══════════════════════════════════════════════════
IMPORTANT NOTES
═══════════════════════════════════════════════════
- This indicator provides technical analysis signals - NOT financial advice
- Always use proper risk management (1-2% risk per trade maximum)
- Past performance does not guarantee future results
- Combine with price action and fundamental analysis
- Test thoroughly on paper/demo before live trading
- Best results come from understanding WHY features work, not blindly following signals
═══════════════════════════════════════════════════
COMPREHENSIVE GUIDE
═══════════════════════════════════════════════════
For detailed usage instructions including:
- Step-by-step trade examples for Forex, Futures Scalpers, and Swing Traders
- Multi-timeframe confirmation strategies
- Alert configuration guide
- Troubleshooting and optimization
- Performance tracking methods
Visit: docs.google.com
═══════════════════════════════════════════════════
CREDITS
═══════════════════════════════════════════════════
Inspiration from Michael J. Huddleston & ICT (Inner Circle Trader) for Smart Money Concepts framework. Mobius for trend pivot methodology. The trading community for decades of shared knowledge.
═══════════════════════════════════════════════════
VERSION HISTORY
═══════════════════════════════════════════════════
v3.3 (January 27, 2026) - Added Premium/Discount zones with volume strength, Mobius pivots, Strong/Weak HL detection, enhanced customization
v3.2 (January 2026) - Enhanced order blocks, FVG tracking, info table
v3.1 (January 2026) - Initial TradingView release

Simple Scalper using Pivots from last Higher timeframe candleHTF Pivot Levels – Proper Alignment
Version: 1.0
Pine Script Version: 5
Overlay: Yes
Author: Ammar Hasan
Description
This is very rudimentary beginner friendly indicator to help scalpers scalp level to level using previous higher timeframe pivot points.
This indicator draws pivot levels based on Higher Timeframe (HTF) candles on a lower timeframe chart. It calculates Pivot, Support (S1–S3), and Resistance (R1–R3) levels from the last closed HTF candle and draws them precisely on the lower timeframe bars corresponding to that candle.
Key Features:
Works on any lower timeframe chart (e.g., 1m, 5m) using higher timeframe inputs (e.g., 15m, 1h).
Draws 7 levels per HTF candle: Pivot (yellow), S1–S3 (red), R1–R3 (green).
Only shows the last maxBars HTF candles to keep the chart clean.
Fully aligned with the actual closed HTF candle, avoiding forward shifts.
No labels, repainting, or multi-line statements.
Inputs
Name Type Default Description
Higher Timeframe Timeframe "10" HTF to base pivot calculations on.
Max HTF Bars to Keep Integer (1–50) 7 Number of HTF candles to display at once.
Calculations
Pivot Level:
Pivot = (High + Low + Close) / 3
Support Levels:
S1 = 2 × Pivot − High
S2 = Pivot − (High − Low)
S3 = Low − 2 × (High − Pivot)
Resistance Levels:
R1 = 2 × Pivot − Low
R2 = Pivot + (High − Low)
R3 = High + 2 × (Pivot − Low)
Where High, Low, Close are from the last closed HTF candle.
Drawing Logic
Lower TF bars per HTF candle is calculated as:
LowerBarsPerHTF = HTF_seconds / LowerTF_seconds
Lines are drawn from x1 to x2:
x1 = (htf_count − 2) × LowerBarsPerHTF
x2 = x1 + LowerBarsPerHTF − 1
This ensures lines are aligned exactly with the lower TF bars corresponding to the HTF candle.
Lines are deleted once maxBars is exceeded to keep the chart clean.
Colors
Level Color
Pivot Yellow
S1–S3 Red
R1–R3 Green
Notes
Repainting: The indicator only uses closed HTF candles (lookahead=barmerge.lookahead_off) to prevent repainting.
Chart Compatibility: Works on any lower timeframe chart; HTF input can be any valid TradingView timeframe.
Scalping Use: Useful for seeing higher timeframe support/resistance levels on intraday charts.

Institutional Top-Bottom by Herman Sangivera (Papua)Institutional Top-Bottom + Volume Profile by Herman Sangivera ( Papua )
📈 Component Description
Orange Line (POC - Point of Control): This represents the "Fair Value." Institutions view prices far above this line as "Expensive" (Premium) and prices below as "Cheap" (Discount).
Green/Red Boxes (Order Blocks): These are footprints left by big banks. A Green Box is a demand zone where institutional buying occurred, and a Red Box is a supply zone where institutional selling happened.
Institutional Labels: These appear when the RSI Divergence confirms that price momentum is fading, signaling a high-probability reversal (Top or Bottom).
🚀 Trading Strategy Guide
1. The High-Probability Buy Setup (Bottom)
Look for a "Confluence" of these three factors:
Location: Price is trading below the Orange POC line (Discount zone).
The Zone: Price enters or touches a Green Order Block.
The Signal: The "INSTITUTIONAL BUY" label appears.
Entry: Enter Buy at the close of the candle with the label.
Stop Loss: Place it just below the Green Order Block.
Take Profit: Target the Orange POC line or the nearest Red Order Block.
2. The High-Probability Sell Setup (Top)
Look for a "Confluence" of these three factors:
Location: Price is trading above the Orange POC line (Premium zone).
The Zone: Price enters or touches a Red Order Block.
The Signal: The "INSTITUTIONAL SELL" label appears.
Entry: Enter Sell at the close of the candle with the label.
Stop Loss: Place it just above the Red Order Block.
Take Profit: Target the Orange POC line or the nearest Green Order Block.
💡 Pro Tips for Accuracy
Timeframes: For the best results, use 15m for Scalping, and 1H or 4H for Day/Swing Trading.
Wait for the Candle Close: Labels are based on Pivot points. Always wait for the current candle to close to ensure the signal is locked and won't "repaint."
Avoid Flat Markets: This indicator works best when there is volatility. Avoid using it during "choppy" or sideways markets with very low volume.
