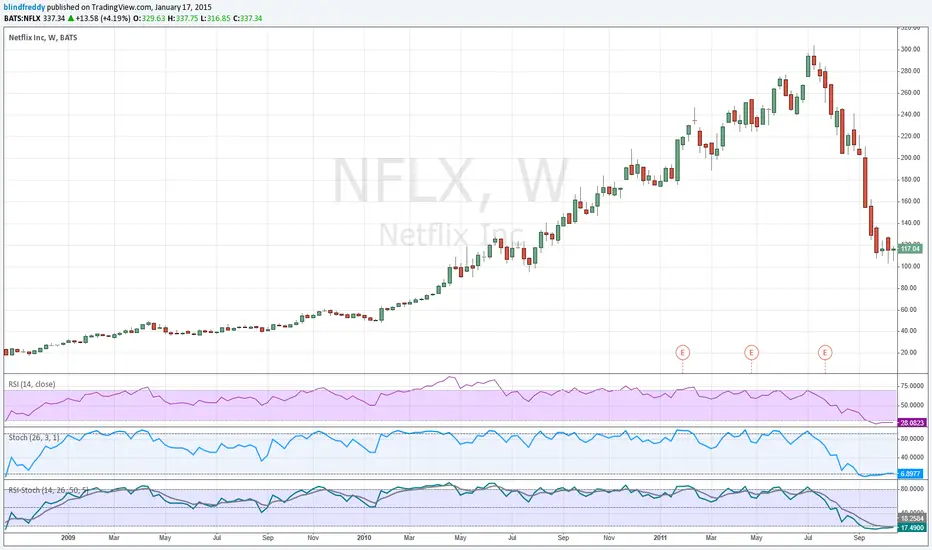
RSI-Stochastic HybridThis is a very simple idea - an average of RSI and the Stochastic Oscillator. However it offers plenty of flexibility for tuning to your requirements. You can change the lengths of either indicator and the weighting of each. By default it's set to 50/50 (just change the percent RSI to adjust). There is also an optional EMA which can be used as a signal line.
This idea comes from Greg Morris who likes to use it for trend following. I would buy when the indicator hits the overbought line and sell when it goes below 50.
Wyszukaj w skryptach "rsi"
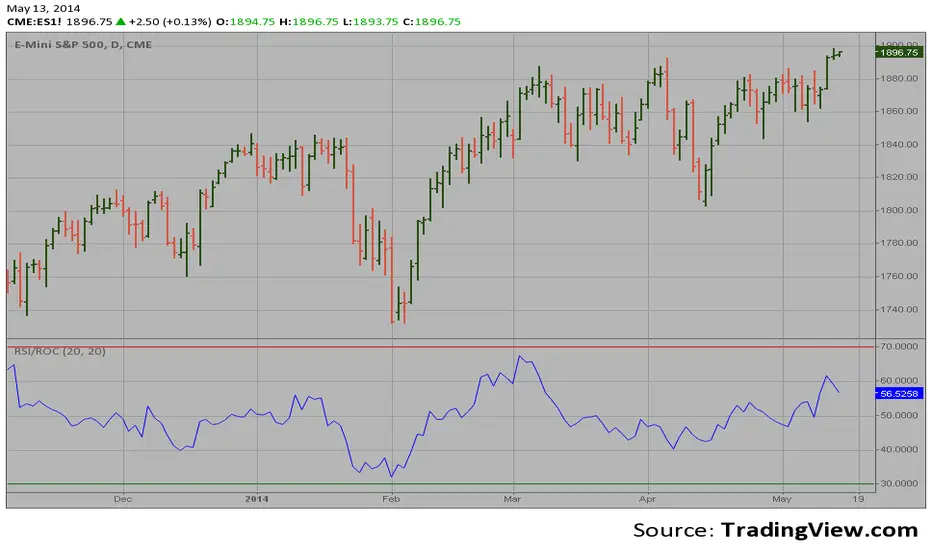
RSI based on ROC This is the new-age indicator which is version of RSI calculated upon
the Rate-of-change indicator.
The name "Relative Strength Index" is slightly misleading as the RSI
does not compare the relative strength of two securities, but rather
the internal strength of a single security. A more appropriate name
might be "Internal Strength Index." Relative strength charts that compare
two market indices, which are often referred to as Comparative Relative Strength.
And in its turn, the Rate-of-Change ("ROC") indicator displays the difference
between the current price and the price x-time periods ago. The difference can
be displayed in either points or as a percentage. The Momentum indicator displays
the same information, but expresses it as a ratio.
Minty RSIRSI in the color of spearminty.com
Notice the nice green colors. The glow, the vibes. Plus moving averages! wow, many wows

TSM RSI + Supertrend + High Volume Combo (TSM 2018)RSI + Supertrend + High Volume Combo
This TradingView indicator combines trend direction, momentum, and participation strength into a single confirmation-based trading system.


RSI + BOAA combination of RSI and Stochastic
BOA is Stochastic with the parameter 5 3 3, which is more sensitive to capture potential pivots.


RSI Divergence Indicator (Multi-Time Frame Confirmation)This custom-built RSI indicator blends traditional divergence detection with multi-timeframe trend confirmation, offering traders a smarter way to spot meaningful momentum shifts.

RSI + martingaleТорговая стратегия основанная на совмещении торговой системы Мартингейл и индекса относительной сила RSI.
Скрипт входит в сделку после пересечения заданных уровней перекупленности и перепроданности RSI. Набирает позицию, по умолчанию умнажая размер каждой докупки x2. Закрывается по тейк-профиту.
A trading strategy based on combining the Martingale trading system and the Relative Strength Index (RSI).
The script enters the trade after crossing the set overbought and oversold levels of the RSI. It takes a position, by default multiplying the size of each additional purchase by x2. It closes with a take profit.

RSI adaptive zones with divergencesThis script is modified version of Adaptive RSI,
Thanks to creator of the script, modification is made by cloude code.

RSI con EMA JP MENTOR TRADINGspot DCA BINANCE.. indicador RSI 36 y EMA 200 BASE para trading spot automatizado en binance

RSI Bull bear thresholds region highlight on priceBullish & bearish relative strength thresholds
Default 61 & 39 RSI

RSI by ErdincALGoTradeBased on the RSI logic, it only gives strong buy/sell signals when buy/sell orders occur simultaneously in 3-5-15 intervals. I'm sharing my own software to achieve 99% success for 25-30 USD movements in gold charts.


RSI Cross Below 30 – Red Background StripShows red bars on chart in instances where RSI drops below 30

RSI + 55 EMA + Volume (SL Marked, No Engulfing)This is to help entering in trades by considering 50 EMA and RSI indicators, Volume is used for confirmations

Multi-Timeframe RSI (4x) z Podświetlaniem - PawełRSI z podświetleniem z różnych tfów z ustawianiem intensywnosci i kolorów.

RSI BREAKOUT SIGNALSThis BB + RSI Breakout indicator is designed to help traders identify potential buy and sell opportunities based on price movements relative to the Donchian channel (or Bollinger-type channel) and momentum conditions. It calculates the highest high and lowest low over a user-defined length to form a dynamic channel, and then it checks whether the current price breaks above the upper band (for a buy signal) or below the lower band (for a sell signal). To avoid repeated signals in a row, the indicator uses a state system: after a buy signal occurs, it will not generate another buy until a sell occurs, and vice versa. When a buy signal is triggered, it automatically calculates a take-profit price a certain percentage above the buy candle and displays this price below the candle as a “TP” label. Sell signals are displayed above the candle, and any previous TP label is cleared. The indicator updates in real time, so the signals move with the chart, giving a clear and lag-free visualization of entry points and potential profit targets.


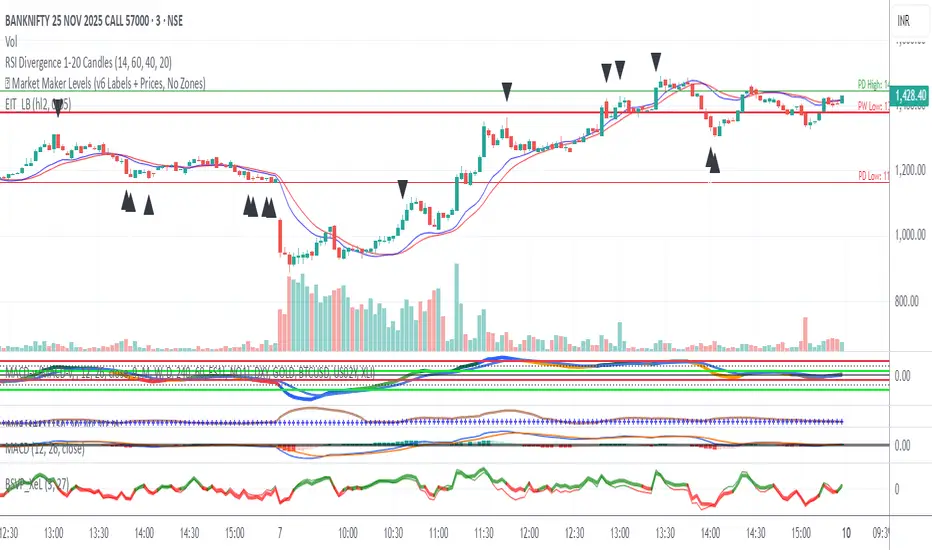
RSI Divergence 1-20 Candlesthis is a rsi divergence indicator used to mark divergence on the candle for knowing the trend
RSI Heatmap (≤35 Highlight)Highlights when RSI is less than or equal to 35 which can signal a potential reversal soon.
