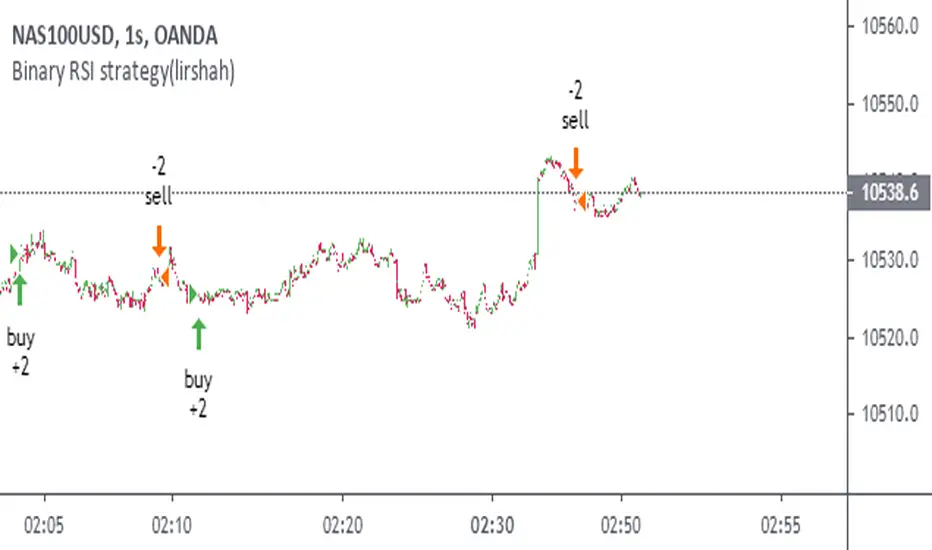
Binary RSI strategy(lirshah)Binary Rsi is one of the greatest strategies published by lirshah programming team.
it has a good operation on H2 ,H1, and M15 charts.
its better to say that this strategy can act such a money machine and
has a good result on almost all crypto currency pair:
LTCUSD – ETHUSD –BTCUSD- XBTUSD - ZECUSD –ETHBTC and …
Wyszukaj w skryptach "rsi"

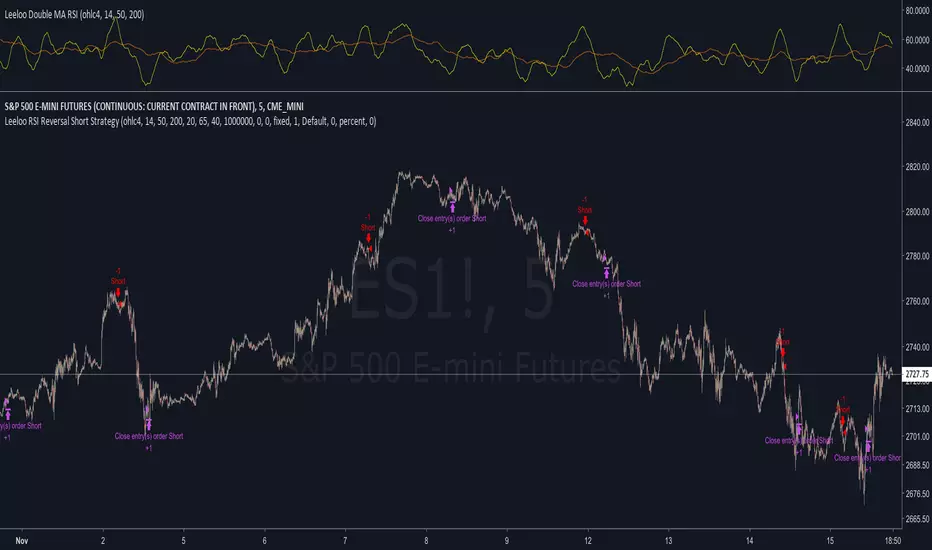
Leeloo RSI Reversal Short StrategyThis strategy is based on applying two moving averages to RSI and then opening a short position when the short-length average is above the slow-length average, has recently changed direction within the last n bars, and is in overbought territory.
Default settings work best on short intervals (5min)
Don't be afraid to use extended hours
Everything is based on last complete bar; once something shows up it is good to go
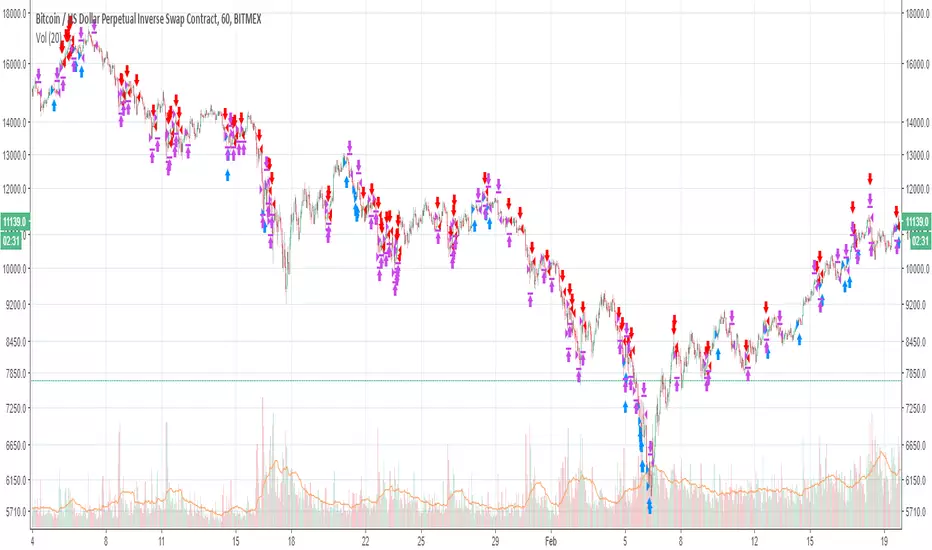
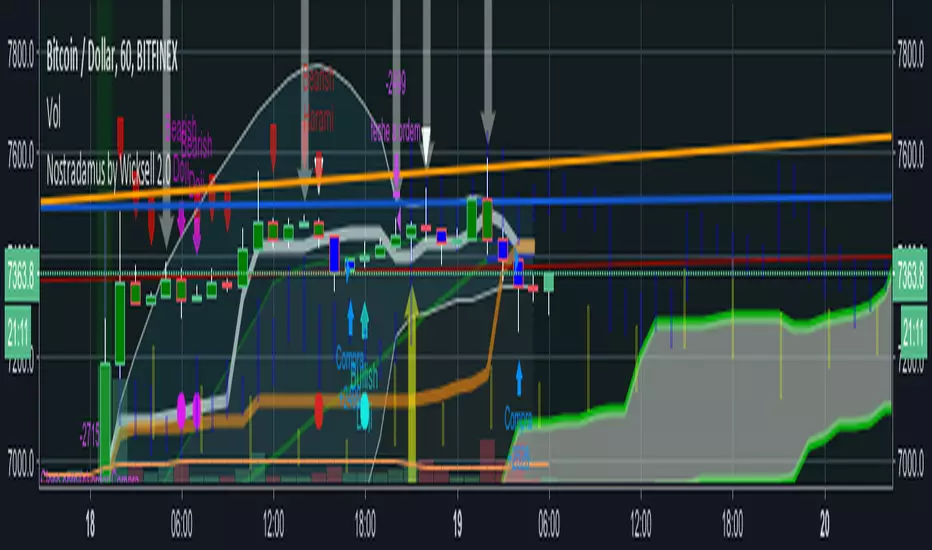
CDC RSI Divergence Strategy for Bitcoin ( by inwCoin )This strategy is based on CDC RSI Divergence indicator ( www.chaloke.com )
Also some code from CTC R-Breaker strategy ( ctc.in.th )
For best result, using 1 H timeframe.
I tried backtest at Bitmex ( XBTUSD ) Bitfinex ( BTCUSD ), OKex ( BTCUSD3M ) and it result is ok.


DPD+RSI+BB Combination of DPD ,STOCHRSI and RSI indicators. Be careful for percantage selection to fit your candle size.


BTCUSD - 4H - Cyatophilum Golden X - RSI [BACKTEST]This indicator is a custom combo of Ema crosses, RSI divergences and Support/resistance , engineered to make the most profit possible.
ABOUT THE STRATEGY
The Net Profit (Gross profit - Gross loss) is calculated with a commission of 0.05% on each order.
Each trade is made with 1 BTC : The backtest buys 1 BTC and sells 1 BTC.
If you decided to Short or Long, profits can be higher, but trade at your own risk.
To use this strategy on a ALT/BTC market (for trading altcoins), change the default Order Size from 1 Contract to 100% of Equity.
There are two kind of buy signals : Green and Blue triangles, that are two great Buy/Long entries.
There are also two kind of sell signals: Red and Orange triangles, that are two great Sell/Short entries.
The indicator comes with automatic Alerts that trigger on Green and Blue triangles for a Buy Alert, or that trigger on Red and Orange triangles for a Sell Alert.
If you are interested in purchasing the indicator and want to try it, then please leave a comment.
An alert setup indicator version is available on my profile.
-----------------------------------------------------------------------------------------
I am also available for PineScript Development and Reverse Engineering.
Join my discord:
discord.gg

Gidra's RSI or MFI Strategy v 0.1Strategy based on Gregg_s indicator RSI or MFI (ru.tradingview.com)
When crossing above 0 - close short, open long
When crossing below 1 - close long, open short
For crypto/fiat and any timeframe

Ehlers-Smoothed Stochastic RSI StrategyI have been asked by several people for a Strategy based on the ES Stoch RSI Alert so here it is. The strategy has an adjustable backtest date range so that you can adjust the test time period to whatever you like. This strategy is based on a script by fskrypt.

Noro's Levels+RSI Strategy v1.0- Fast RSI Strategy
- Levels Strategy
- 2 in 1
For:
- "crypto/fiat"
- D1 timeframe

VWMA + SMA BBollinger + RSI Strategy (ChartArt) mod by BiO618This is a script I remade from the original ChartArt's "CA_RSI_Bolling_Strat".
I added a VWMA following the SMA basis curve.
BBand was made with the SMA curve, +2DS.
The point of adding VWMA to the script is to get a fast correlation between price change and volume change.
How to interpret it:
Since 3-Intervals-VWMA = (P1*V1 + P2*V2 + P3*V3) / (V1+V2+V3)
As the volume grows, VWMA get smaller.
If the price goes to the upper band, and the VWMA follows it, Price grew more than Volume, and a correction would happen soon.
If the price goes to the lower band, and the VWMA follows it, Price dipped with a lot of Volume, and a continuation of trend would be expected.
If the price goes to the upper band, and the VWMA stays close to SMA, Price grew with a correspondient Volume, and the continuation of trend would be expected.
If the price goes to the lower band, and the VWMA stays close to SMA, Price dipped with low Volume, a correction would happen soon.
Remember that NO INDICATOR is flawless, support your interpretation with other indicators like RSI and MACD.
Hope you enjoy it!
φ!

Tryhard bitmex strategy - SMA+RSI, no repaint, no trailing stopBacktest for 2017-2018, with x1 leverage.
3MA for trend detection, fast RSI for counter-trend elements.
The strategy contains many parameters that are not optimal now, the results can be much better

Channel + Rsi + TrendSimpleCombination with rsi + price channel + trend. Good approach to robot trading. The best time frame 1H leverage up to 5. I use the script for trading with own robot development. Only for bitmex XBT/USD and rebate will be as bonus 0.025)

MACD + RSI + EMA + SMA + Ichimoku + overbought + buy, sell +Doji// MACD + EMA 200 *** buy and sell strategy (RSI, EMA, SMA) *** Doji Harami *** overbought and oversold *** trend direction *** divergence *** Ichimoku
Use this script in time 1h
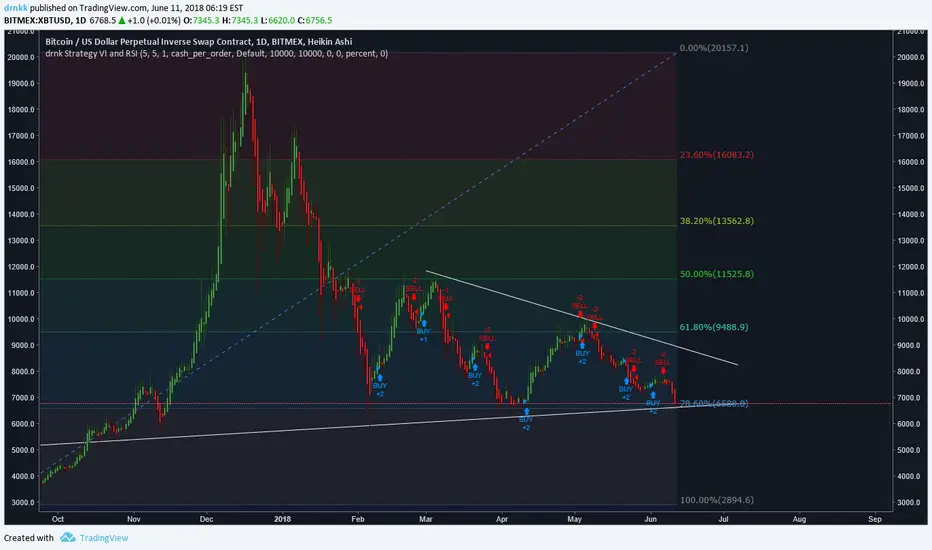
drnk Strategy VI and RSIStrategy based on a modified RSI and VI indicators. Best Results with heikin ashi representation.