Alt Trading: FuturesOne
The FuturesOne Indicator + Strategy will be continuously enhanced to ensure our users receive the most effective and profit-focused trading system at the best possible value. Version 0 (V0) of the FuturesOne Strategy is built on a refined Opening Range Breakout (ORB) framework, augmented with a quantitative regime-detection and filtering layer. This design allows users to tailor their approach: they may opt for consistent daily ORB opportunities or select a mode that applies quantitative filters to surface fewer, but higher-probability, trade setups.
Wyszukaj w skryptach "range"

Oracle Protocol — Arch Public (Testing Clone) Oracle Protocol — Arch Public Series (testing clone)
This model implements the Arch Public Oracle structure: a systematic accumulation-and-distribution engine built around a dynamic Accumulation Cost Base (ACB), strict profit-gate exit logic, and a capital-bounded flywheel reinvestment system.
It is designed for transparent execution, deterministic behaviour, and rule-based position management.
Core Function Set
1. Accumulation Framework (ACB-Driven)
The accumulation engine evaluates market movement against defined entry conditions, including:
Percentage-based entry-drop triggers
Optional buy-below-ACB mode
Capital-gated entries tied to available ledger balance
Fixed-dollar and min-dollar entry rules (as seen in Arch public materials)
Automated sizing through flywheel capital
Range-bounded ledger for controlled backtesting input
Each qualifying buy updates the live ACB, maintains the internal ledger, and forms the next reference point for exit evaluation.
No forecasting mechanisms are included.
2. Profit-Gate Exit System
Exits are governed by the standard Arch public approach:
A sealed ACB reference for threshold evaluation
Optional live-ACB visibility
Profit-gate triggers defined per asset class
Candle-confirmation integration (“ProfitGate + Candle” mode)
Distribution only when the smallest active threshold is met
This provides a consistent cadence with published Arch diagrams and PDFs.
3. Once-Per-Rally Governance
After a distribution, the algorithm locks until price retraces below the most recent accumulation base.
Only after re-arming can the next profit gate activate.
This prevents over-frequency selling and aligns with the public-domain Oracle behaviour.
4. Quiet-Bars & Threshold Cluster Control
A volatility-stabilisation layer prevents multiple exits from micro-fluctuations or transient spikes.
This ensures clean execution during fast markets and high volatility.
5. Flywheel Reinvestment
Distribution proceeds automatically return to the capital pool where permitted, creating a closed system of:
Entry sizing
Exit proceeds
Ledger-managed capital state
All sizing respects capital boundaries and does not breach dollar floors or overrides.
6. Automation Hooks and Integration
The script exposes:
3Commas-compatible JSON sizing
Entry/exit signalling via alertcondition()
Deterministic event reporting suitable for external automation
This allows consistent deployment across automated execution environments.
7. Visual Tooling
Optional displays include:
Live ACB line
Exit-guide markers
Capital, state, and ledger panels
Realized/unrealized outcome tracking based on internal logic only
Visual components do not influence execution rules.
Operating Notes
This model is rule-based, deterministic, and non-predictive.
It executes only according to the explicit thresholds, capital limits, and state transitions defined within the script.
No discretionary or forward-looking logic is included.

Safe Supertrend Strategy (No Repaint)Overview
The Safe Supertrend is a repaint-free version of the popular Supertrend trend-following indicator.
Most Supertrend indicators appear perfect on historical charts because they flip intrabar and then repaint after the candle closes.
This version fixes that by using close-of-bar confirmation only, making every trend flip 100% stable, safe, and non-repainting.
Why This Supertrend Doesn’t Repaint
Most Supertrend indicators calculate their trend direction using the current bar’s data.
But during a live candle:
ATR expands and contracts
The upper/lower bands move
Price moves above/below the band temporarily
A false flip appears → then disappears when the candle closes
That is classic repainting.
This indicator avoids all of that by using:
close > upper
close < lower
This means:
Trend direction flips only based on the previous candle,
No intrabar calculations,
No flickering signals,
No “perfect but fake” historical performance.
Every signal you see on the chart is exactly what was available in real-time.
How It Works
Calculates ATR (Average True Range) and SMA centerline
Builds upper and lower volatility bands
Confirms trend flips only after the previous bar closes
Plots clear bull and bear reversal signals
Works on all markets (crypto, stocks, forex, indices)
No repainting, no recalc, no misleading flips.
Bullish Signal (Trend Up)
A bullish trend begins only when:
The previous candle closes above the upper ATR band,
And this flip is fully confirmed.
A green triangle marks the start of a new uptrend.
Bearish Signal (Trend Down)
A bearish trend begins only when:
The previous candle closes below the lower ATR band,
And the downtrend is confirmed.
A red triangle signals the start of a new downtrend.
Inputs
ATR Length - default 10
ATR Multiplier - default 3.0
Works on all timeframes and market
Simple, but powerful.
Why Use This Version Instead of a Regular Supertrend?
Most Supertrends:
Look great historically
But repaint continuously on live charts
Give false trend flips intrabar
Cannot be reliably used in strategies
This version:
Uses strict previous-bar logic
Never repaints trend direction
Works perfectly in live trading
Backtests accurately
Is ideal for algorithmic strategies
Ideal For:
Trend-following strategies
Breakout trading
Algo trading systems
Reversal detection
Filtering market noise
Swing trading & scalping
Final Note
This is a safer, more reliable Supertrend designed for real-world use — not perfect-looking repaint illusions.
If you use Supertrend in your trading system, this no-repaint version ensures your signals are trustworthy and consistent.

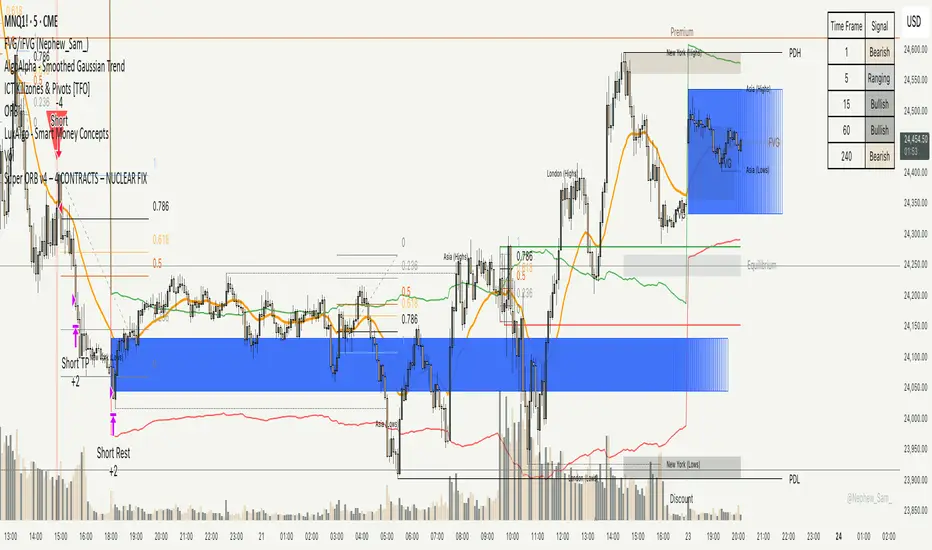
Super ORB v4 – 4 CONTRACTS – NUCLEAR FIXORB hands off printer, this is to gauge how few trades can happen off the ORB while not trading after hours either. Should be in the 5% a month range 4 contracts, no more than 5 trades a month.
MTF Scalper - alemicihanMulti-Timeframe Scalper Strategy: Aligning the Big Picture for Quick Gains
This article presents a robust futures trading strategy designed for high-frequency scalping in the crypto market. It’s built on the principle of minimizing risk by ensuring that short-term entries are always aligned with the dominant, higher-timeframe trend.
The Core Concept: Alignment is Key
A Balanced Trend Follower approach, now refined for rapid scalping, uses a Multi-Timeframe (MTF) confirmation system to filter out market noise and increase the probability of a successful trade.
The strategy operates on a Low Timeframe (LTF) chart (e.g., 3m, 5m, or 15m) but only executes trades if the direction is validated by three Higher Timeframes (HTF).
ComponentPurposeFunctionHTF (D, 4h, 1h) EMA => Trend Confirmation =>Checks if the current price is above/below all three Exponential Moving Averages (EMA 20). This provides a strong directional bias.
LTF (5m) Stochastic RSI => Momentum Entry => Generates the actual buy/sell signal by spotting a swift crossover, indicating fresh momentum in the direction of the confirmed HTF trend.
How The Signal Is Generated
Trend Alignment: The system first confirms the trend. If the price is trading above the Daily, 4-Hour, and 1-Hour EMAs, the market is deemed to be in a Strong LONG Trend. Only LONG signals are permitted.
Momentum Trigger: Once the trend is confirmed, a Long Signal is generated only when the Stochastic K-Line crosses above the D-Line, indicating a momentum shift (a pullback ending) towards the main trend direction.
Short Signal: The inverse logic applies to the Short Trend confirmation and entry signal.
Mandatory Risk Management: ATR-Based Exit
Given the high leverage nature of futures and scalping, static Stop-Loss (SL) and Take-Profit (TP) levels are inefficient. This strategy uses the Average True Range (ATR) indicator to dynamically set profit and loss targets based on current market volatility.
Stop Loss (SL): Set dynamically at 1.5 x ATR below (for long) or above (for short) the entry price. This gives the trade enough room to breathe without risking excessive capital.
Take Profit (TP): Set dynamically at 3.0 x ATR, establishing a robust Risk-to-Reward Ratio of 1:2.
Final Thoughts on Testing
This sophisticated approach combines the reliability of MTF analysis with the speed of momentum indicators. However, data analysis is key. Backtesting these parameters (EMA, ATR Multipliers, RSI/Stochastic lengths) on your chosen asset (like BTC/USDT or ETH/USDT) and timeframe is crucial to achieving optimal performance.

V15.0 Adaptive Chameleon [Pro]
# **V15.0 Adaptive Chameleon – Strategy Description**
**Adaptive Chameleon** is a fully automated TradingView strategy powered by a signal engine based on multi-timeframe trend analysis, adaptive moving averages, and a volatility filter. The goal is to trade in the direction of a strong and confirmed trend, avoid opening trades in weak or manipulative price zones, and establish positions with a clearly defined risk/reward ratio.
---
## **1. General Logic and Philosophy**
The strategy divides tasks between two timeframes:
* **4-Hour Chart → Trend Manager (Boss)**
Determines the direction and strength of the trend.
* **4-Minute Chart → Entry Trigger (Operating Unit)**
Generates the ideal entry signal in the direction of the trend.
Thanks to this structure, the strategy both follows the long-term main direction and finds clear entries with low lag on smaller timeframes.
---
## **2. Trend Detection (4H)**
The strategy uses **KAMA (Kaufman Adaptive Moving Average)** and **ADX** to identify trends on the higher timeframe.
### **KAMA – Adaptive Trend Line**
* The KAMA is much more "smart" than traditional moving averages.
* It accelerates during price movements and decelerates during sideways movements.
* This allows for much clearer detection of trend direction.
### **ADX – Trend Strength Meter**
The strategy only opens trades when **trend strength** is rising (above the ADX average).
This prevents unnecessary trades when the trend is weak.
### **Trend Rules**
* Price above the KAMA → **Uptrend**
* Price below the KAMA → **Downtrend**
* ADX widening → **Trend strong**
The entry trigger is activated when these three conditions are met together.
---
## **3. Entry Engine (45m)**
On the 45-minute timeframe, the system uses the following components:
### **AlphaTrend (MFI + ATR-Based Adaptive Line)**
* Measures market flow direction with MFI (Money Flow Index),
* Measures price level breakouts with ATR (Volatility).
AlphaTrend detects whether the price is likely to reverse upwards or downwards.
### **Entry Signal**
* **Buy signal:** If the AlphaTrend has reversed upwards based on recent bars
* **Sell signal:** If the AlphaTrend has broken downwards
### **Pivot Points (For Stop)**
* The **pivotLow** and **pivotHigh** levels of the last 10 bars are calculated.
* These are used to determine the most logical stop distance.
---
## **4. Protection Shields**
The strategy uses two main filters to protect against the most dangerous conditions in the crypto market:
### **1. Pump/Dump Filter**
* A candlestick length greater than 4% is considered a "pump bar."
* Never open a trade on these bars.
The goal: to avoid sudden manipulation candlesticks.
### **2. RSI Filter**
* Long trades: RSI > 45 (open long on weak momentum)
* Short trades: RSI < 55 (open short on extremely strong momentum)
These filters provide more balanced entries.
---
## **5. Final Entry Conditions**
### **All conditions are required simultaneously for long:**
1. 4H trend up
2. ADX trend strength increasing
3. 45m AlphaTrend issued a "buy" signal
4. RSI > 45
5. No candlestick pump
6. Date range is suitable
### **All conditions apply in the opposite direction for short.**
---
## **6. Exit Mechanism (Stop, TP, Trailing)**
The strategy uses a three-layer structure on the exit side:
### **1. Pivot-Based Stop**
* Stop distance = Entry price − Pivot Low (for long)
* Minimum stop distance = **1% of the price**
Provides both structural and mathematical security.
### **2. Fixed R:R (Default 1:2)**
* TP = Entry + Stop Distance × R:R
The default 2R target is ideal for trend systems.
### **3. Optional Trailing Stop**
* Dynamic trailing stop that follows the price by a certain percentage.
* Allows trend trades to yield greater profits.
---
## **7. Chart Displays**
* Purple line:** 4H WEDGE (main trend line)
* Yellow background:** Pump protection is active (trades will not be opened on that bar)
---
## **8. Practical Effect of the Strategy**
This system has an adaptive structure based on trend variations.
**Strengths:**
* Very high accuracy (76–80% in SOL and ETH tests)
* Low drawdown (approximately 6–7%)
* Safe entries thanks to pump/dump and extreme momentum filters
* Clearly defined stop and target structure
* Low noise thanks to multi-timeframe compatibility
**Weaknesses:**
* Performance may decrease in sideways markets without trends
* Overtrading may occur if the ADX filter is closed
* Very small stops can sometimes cause unnecessary triggers
---
## **9. Conclusion**
**Adaptive Chameleon** is a trend-based and highly stable strategy with well-established risk management, manipulation filtering, and entry into lower timeframes with clear trend direction detection and low-latency signals.
SOL and ETH demonstrated strong and balanced performance in backtests with metrics such as:
* **600+ trades**
* **30–37% profit**
* **76–80% win rate**
* **Low max drawdown**

Dami's HMA Strategy"Dami's HMA Strategy: Dynamic Crossover with Momentum Filter"
Key Points to Include:
Foundation: The strategy is based on the Hull Moving Average (HMA), noted for its speed and reduced lag, making it ideal for identifying trend inflection points early.
Enhanced Logic: Unlike a simple moving average crossover, this strategy incorporates a momentum filter. A signal is only triggered if the HMA crossover coincides with a candle moving in the direction of the new trend (bullish candle for Long, bearish candle for Short). This aims to confirm the impulse and avoid false entries during consolidation periods or 'weak' crossovers.
100% Market Coverage System: It is a continuous reversal system. Every new signal (Long or Short) closes the opposite position, ensuring the trader is always positioned in the direction indicated by the HMA.
Complementary Visualization: It includes the 8-Period High/Low Bands (Dami's Bands) to provide visual context of the recent price range, although they do not affect trading orders.
Adjustment and Optimization: The HMA length (hma_len=9 by default) is the key parameter to optimize based on the specific pair and timeframe. Higher values will generate fewer signals and be slower, while lower values (like the current 9) make it more sensitive.

Mir Khans QQQThis strategy is built around how I actually trade QQQ intraday: Opening-Range continuation, VWAP trend reads, OI magnets, and a simple but strict risk framework. It’s designed to keep you on the right side of the session theme (trend vs fade), then only take trades when multiple pieces of confluence line up.
The strategy is tuned for QQQ on intraday timeframes, but the logic is generic enough to experiment with other liquid index products. It’s not financial advice—use it as a structured framework for reading OR, VWAP, and trend strength, and then layer your own execution rules and risk management on top.
Hash Momentum Strategy# Hash Momentum Strategy
## 📊 Overview
The **Hash Momentum Strategy** is a professional-grade momentum trading system designed to capture strong directional price movements with precision timing and intelligent risk management. Unlike traditional EMA crossover strategies, this system uses momentum acceleration as its primary signal, resulting in earlier entries and better risk-to-reward ratios.
---
## ⚡ What Makes This Strategy Unique
### 1. Momentum-Based Entry System
Most strategies rely on lagging indicators like moving average crossovers. This strategy captures momentum *acceleration* - entering when price movement is gaining strength, not after the move has already happened.
### 2. Programmable Risk-to-Reward
Set your exact R:R ratio (1:2, 1:2.5, 1:3, etc.) and the strategy automatically calculates stop loss and take profit levels. No more guessing or manual calculations.
### 3. Smart Partial Profit Taking
Lock in profits at multiple stages:
- **First TP**: Take 50% off at 2R
- **Second TP**: Take 40% off at 2.5R
- **Final TP**: Let 10% ride to maximum target
This approach locks in gains while letting winners run.
### 4. Dynamic Momentum Threshold
Uses ATR (Average True Range) multiplied by your threshold setting to adapt to market volatility. Volatile markets = higher threshold. Quiet markets = lower threshold.
### 5. Trade Cooldown System
Prevents overtrading and revenge trading by enforcing a cooldown period between trades. Configurable from 1-24 bars.
### 6. Optional Session & Weekend Filters
Filter trades by Tokyo, London, and New York sessions. Optional weekend-off toggle to avoid low-liquidity periods.
---
## 🎯 How It Works
### Signal Generation
**STEP 1: Calculate Momentum**
- Momentum = Current Price - Price
- Check if Momentum > ATR × Threshold Multiplier
- Momentum must be accelerating (positive change in momentum)
**STEP 2: Confirm with EMA Trend Filter**
- Long: Price must be above EMA
- Short: Price must be below EMA
**STEP 3: Check Filters**
- Not in cooldown period
- Valid session (if enabled)
- Not weekend (if enabled)
**STEP 4: ENTRY SIGNAL TRIGGERED**
### Risk Management Example
**Example Long Trade:**
- Entry: $100
- Stop Loss: $97.80 (2.2% risk)
- Risk Amount: $2.20
**Take Profit Levels:**
- TP1: $104.40 (2R = $4.40) → Close 50%
- TP2: $105.50 (2.5R = $5.50) → Close 40%
- Final: $105.50 (2.5R) → Close remaining 10%
---
## ⚙️ Settings Guide
### Core Strategy
**Momentum Length** (Default: 13)
Number of bars for momentum calculation. Higher = stronger but fewer signals.
**Momentum Threshold** (Default: 2.25)
ATR multiplier. Higher = only trade biggest moves.
**Use EMA Trend Filter** (Default: ON)
Only long above EMA, short below EMA.
**EMA Length** (Default: 28)
Period for trend-confirming EMA.
### Filters
**Use Trading Session Filter** (Default: OFF)
Restrict trading to specific sessions.
**Tokyo Session** (Default: OFF)
Trade during Asian hours (00:00-09:00 JST).
**London Session** (Default: OFF)
Trade during European hours (08:00-17:00 GMT).
**New York Session** (Default: OFF)
Trade during US hours (08:00-17:00 EST).
**Weekend Off** (Default: OFF)
Disable trading on Saturdays and Sundays.
### Risk Management
**Stop Loss %** (Default: 2.2)
Fixed percentage stop loss from entry.
**Risk:Reward Ratio** (Default: 2.5)
Your target reward as multiple of risk.
**Use Partial Profit Taking** (Default: ON)
Take profits in stages.
**First TP R:R** (Default: 2.0)
First target as multiple of risk.
**First TP Size %** (Default: 50)
Percentage of position to close at TP1.
**Second TP R:R** (Default: 2.5)
Second target as multiple of risk.
**Second TP Size %** (Default: 40)
Percentage of position to close at TP2.
### Trade Management
**Use Trade Cooldown** (Default: ON)
Prevent overtrading.
**Cooldown Bars** (Default: 6)
Bars to wait after closing a trade.
---
## 🎨 Visual Elements
### Chart Indicators
🟢 **Green Dot** (below bar) = Long entry signal
🔴 **Red Dot** (above bar) = Short entry signal
🔵 **Blue X** (above bar) = Long position closed
🟠 **Orange X** (below bar) = Short position closed
**EMA Line** = Trend direction (green when bullish, red when bearish)
**White Line** = Entry price
**Red Line** = Stop loss level
**Green Lines** = Take profit levels (TP1, TP2, Final)
### Dashboard
When not in real-time mode, a dashboard displays:
- Current position (LONG/SHORT/FLAT)
- Entry price
- Stop loss price
- Take profit price
- R:R ratio
- Current momentum strength
- Total trades
- Win rate
- Net profit %
---
## 📈 Recommended Settings by Timeframe
### 1-Hour Timeframe (Default)
- Momentum Length: 13
- Momentum Threshold: 2.25
- EMA Length: 28
- Stop Loss: 2.2%
- R:R Ratio: 2.5
- Cooldown: 6 bars
### 4-Hour Timeframe
- Momentum Length: 24-36
- Momentum Threshold: 2.5
- EMA Length: 50
- Stop Loss: 3-4%
- R:R Ratio: 2.0-2.5
- Cooldown: 6-8 bars
### 15-Minute Timeframe
- Momentum Length: 8-10
- Momentum Threshold: 2.0
- EMA Length: 20
- Stop Loss: 1.5-2%
- R:R Ratio: 2.0
- Cooldown: 4-6 bars
---
## 🔧 Optimization Tips
### Want More Trades?
- Decrease Momentum Threshold (2.0 instead of 2.25)
- Decrease Momentum Length (10 instead of 13)
- Decrease Cooldown Bars (4 instead of 6)
### Want Higher Quality Trades?
- Increase Momentum Threshold (2.5-3.0)
- Increase Momentum Length (18-24)
- Increase Cooldown Bars (8-10)
### Want Lower Drawdown?
- Increase Cooldown Bars
- Use tighter stop loss
- Enable session filters (trade only high-liquidity sessions)
- Enable Weekend Off
### Want Higher Win Rate?
- Increase R:R Ratio (may reduce total profit)
- Increase Momentum Threshold (fewer but stronger signals)
- Use longer EMA for trend confirmation
---
## 📊 Performance Expectations
Based on typical backtesting results:
- **Win Rate**: 35-45%
- **Profit Factor**: 1.5-2.0
- **Risk:Reward**: 1:2.5 (configurable)
- **Max Drawdown**: 10-20%
- **Trades/Month**: 8-15 (1H timeframe)
**Note:** Win rate may appear low, but with 2.5:1 R:R, you only need ~29% win rate to break even. The strategy aims for quality over quantity.
---
## 🎓 Strategy Logic Explained
### Why Momentum > EMA Crossover?
**EMA Crossover Problems:**
- Signals lag behind price
- Late entries = poor R:R
- Many false signals in ranging markets
**Momentum Advantages:**
- Catches moves as they start accelerating
- Earlier entries = better R:R
- Adapts to volatility via ATR
### Why Partial Profit Taking?
**Without Partial TPs:**
- All-or-nothing approach
- Winners often turn to losers
- High stress watching open positions
**With Partial TPs:**
- Lock in 50% at first target
- Reduce risk to breakeven
- Let remainder ride for bigger gains
- Lower psychological pressure
### Why Trade Cooldown?
**Without Cooldown:**
- Revenge trading after losses
- Overtrading in choppy markets
- Emotional decision-making
**With Cooldown:**
- Forces discipline
- Waits for new setup to develop
- Reduces transaction costs
- Better signal quality
---
## ⚠️ Important Notes
1. **This is a momentum strategy, not an EMA strategy**
The EMA only confirms trend direction. Momentum generates the actual signals.
2. **Backtest thoroughly before live trading**
Past performance ≠ future results. Test on your specific asset and timeframe.
3. **Use proper position sizing**
Risk 1-2% of account per trade maximum. The strategy uses 100% equity by default (adjust in Properties).
4. **Dashboard auto-hides in real-time**
Clean chart for live trading. Visible during backtesting.
5. **Customize for your trading style**
All settings are fully adjustable. No single "best" configuration.
---
## 🚀 Quick Start Guide
1. **Add to Chart**: Apply to your preferred asset and timeframe
2. **Keep Defaults**: Start with default settings
3. **Backtest**: Review historical performance
4. **Paper Trade**: Test with simulated money first
5. **Go Live**: Start small and scale up
---
## 💡 Pro Tips
**Tip 1: Combine Timeframes**
Use higher timeframe (4H) for trend direction, lower timeframe (1H) for entries.
**Tip 2: Avoid News Events**
Major news can cause whipsaws. Consider manual intervention during high-impact events.
**Tip 3: Monitor Momentum Strength**
Dashboard shows momentum in sigma (σ). Values >1.0σ indicate very strong momentum.
**Tip 4: Adjust for Volatility**
In high-volatility markets, increase threshold and stop loss. In quiet markets, decrease them.
**Tip 5: Review Losing Trades**
Check if losses are hitting stop loss or reversing. Adjust stop accordingly.
---
## 📝 Changelog
**v1.0** - Initial Release
- Momentum-based signal generation
- EMA trend filter
- Programmable R:R ratio
- Partial profit taking (3 stages)
- Trade cooldown system
- Session filters (Tokyo/London/New York)
- Weekend off toggle
- Smart dashboard (auto-hides in real-time)
- Clean visual design
---
## 🙏 Credits
Developed by **Hash Capital Research**
If you find this strategy useful, please give it a like and share with others!
---
## ⚖️ Disclaimer
This strategy is for educational purposes only. Trading involves substantial risk of loss and is not suitable for all investors. Past performance is not indicative of future results. Always do your own research and consult with a qualified financial advisor before trading.
---
## 📬 Feedback
Have suggestions or found a bug? Leave a comment below! I'm continuously improving this strategy based on community feedback.
---
**Happy Trading! 🚀📈**

ILM & IFVG StrategyPlease feel free to adjust in any way possible. Let me know if you can create something better from this initial coding.
//═══════════════════════════════════════════════════════════════════════
// Inverted Liquidity Model (ILM) – Strategy
//═══════════════════════════════════════════════════════════════════════
//
// The **Inverted Liquidity Model (ILM)** is a liquidity-based algorithm
// built to capture high-probability reversals after:
//
// • A liquidity sweep (SSL/BSL taken)
// • Rejection back inside the range
// • A Fair Value Gap (FVG) forms
// • That FVG becomes invalidated → becomes an IFVG entry zone
//
// ILM combines:
// • LTF BOS / CHOCH structure confirmation
// • HTF structure (expansion) filtering
// • Premium / Discount filter (17:00 CST session midline)
// • Optional ATR volatility filter
// • Optional trading session restrictions
// • Optional partial profit-taking + runners
//
// When all conditions align, the strategy enters:
// ✔ Long after sweep of SSL + valid long IFVG + trend confirmation
// ✔ Short after sweep of BSL + valid short IFVG + trend confirmation
//
// Stops are placed at the sweep wick.
// Full target is set at the next structural high/low.
// Optional partial TP sends a runner to full target.
//
// Visual tools (labels, sweep lines, IFVG boxes, midline) assist
// with review and forward testing.
//
//───────────────────────────────────────────────────────────────────────
// USER CONFIGURABLE FEATURES
//───────────────────────────────────────────────────────────────────────
//
// • **Liquidity & Structure**
// - pivotLen → swing length for pivots / liquidity
// - htfOn → toggle higher-timeframe pivots
// - htfTF → timeframe for HTF structure/liquidity
// - useStructureFilter → enforce LTF BOS/CHOCH trend
// - useHtfExpansionFilter → enforce HTF trend
// - showStructureLabels → show BOS/CHOCH labels
// - showHtfStructureLabels → show HTF BOS/CHOCH labels
//
// • **Premium / Discount Midline**
// - usePremiumDiscountFilter → only long in discount / short in premium
// - pdSession → session used for midline (default 17:00 CST)
// - showPdMidLine → show 50% midline
//
// • **FVG / IFVG Detection**
// - useBodyGapFVG → FVG uses candle bodies instead of wicks
// - useDisplacementFVG → require displacement bar
// - dispAtrMult → minimum ATR threshold for displacement
// - showIFVG → draw IFVG boxes
//
// • **ATR / Volatility / Sessions**
// - useRangeFilter → require minimum ATR%
// - atrLen → ATR period
// - minAtrPerc → minimum ATR% of price
// - useSessionFilter → restrict trading hours
// - sessionTimes → allowed trading session
//
// • **Sweep Visualization**
// - showSweepLines → draw sweep lines at SSL/BSL sweeps
// - sweepLineWidth → thickness of sweep lines
//
// • **Exits: Partial Targets & Runners**
// - usePartialTargets → enable partial TP logic
// - tp1QtyPercent → percent closed at TP1
// - tp1FractionOfPath → TP1 relative to path to full target
//
// • **Formatting / Visibility**
// - labelFontSizeInput → tiny / small / normal / large / huge
// - showEntries → entry markers
// - showTargets → target lines
//
//═══════════════════════════════════════════════════════════════════════
// END OF STRATEGY DESCRIPTION
//═══════════════════════════════════════════════════════════════════════

Alpha VWAP Regime🔥 Alpha VWAP Regime — Institutional VWAP Strategy (Closed Source)
Alpha VWAP Regime is a multi-layered VWAP trading system that identifies the active market regime and adapts its signals based on institutional liquidity behavior.
This strategy is closed-source because it uses a proprietary combination of VWAP structures, anchored pivot logic, band deviations, and regime detection filters that are not publicly available.
🧠 How the Strategy Works (Conceptual Explanation)
This strategy does not rely on a single VWAP line.
Instead, it builds a VWAP matrix consisting of:
1) Session VWAP
Defines fair value for the current session.
Used to detect intraday directional bias.
2) Anchored VWAP (AVWAP)
Automatically anchored to swing highs and lows (pivot-based).
Tracks where large players accumulated or distributed positions.
3) VWAP Bands (±1σ and ±2σ)
Used as dynamic volatility envelopes:
±1σ = fair-value zone / no-trade area
±2σ = mean-reversion extremes
4) Market Regime Classification (ADX-based)
The strategy determines which environment the market is in:
Trending Regime: ADX above threshold
Ranging Regime: ADX below threshold
Breakout Regime: Volume-based breakout of AVWAP
Each regime activates a different entry model.
📌 Entry Logic (High-Level Overview)
Trend Mode
Triggered only when ADX confirms a trend.
Entries occur near VWAP or −1σ using price-action confirmation.
Mean Reversion Mode
Activated when the market is ranging.
Entries target the ±2σ deviation bands.
Breakout Mode
Triggered by price crossing AVWAP with above-average volume.
Used to catch institutional continuation moves.
ALL Mode
Combines the three models for a full adaptive system.
📉 Exits & Risk Management
All stops and targets use ATR-based volatility sizing
Trend trades aim for larger targets
Mean-reversion trades aim for smaller snapback moves
Breakouts use wider stops but high R:R
🔍 How to Use the Strategy
Load the script on a clean chart
Choose your preferred regime mode (Trend / MR / Breakout / ALL)
Optionally hide VWAP indicators and display signals only
Use realistic position sizing and commissions
Evaluate performance across multiple assets and timeframes
🔒 Why It Is Closed-Source
The code uses:
A custom anchoring engine
Multi-layered regime filters
Dynamic VWAP matrix
Prop logic for bias scoring
These components were built from scratch and form a unique decision model, so the source is protected.
🇸🇦 الشرح العربي لاستراتيجية Alpha VWAP Regime
Alpha VWAP Regime هي استراتيجية تداول مؤسسية متقدمة تعتمد على تحليل السيولة، وتحديد حالة السوق (Market Regime)، ودمج عدة طبقات من VWAP داخل نموذج واحد متكيف.
الهدف من الاستراتيجية هو التداول في المناطق التي يتواجد فيها المال الذكي، وتجنب التداول في المناطق العشوائية أو منخفضة الجودة.
________________________________________
🧠 كيف تعمل الاستراتيجية؟
الاستراتيجية لا تعتمد على VWAP واحد، بل تستخدم “مصفوفة VWAP” كاملة تتكوّن من:
1) VWAP اليومي (Session VWAP)
يُستخدم لتحديد القيمة العادلة خلال الجلسة، وتحديد الاتجاه اللحظي (Intraday Bias).
________________________________________
2) VWAP المثبّت (Anchored VWAP)
يتم تثبيته تلقائيًا على:
• القمم المهمة (Swing Highs)
• القيعان المهمة (Swing Lows)
ويساعد في تحديد مناطق تمركز المؤسسات، ومناطق الانعكاس أو الاختراقات الحقيقية.
________________________________________
3) نطاقات VWAP (±1σ و ±2σ)
تُستخدم كأغلفة ديناميكية للسيولة والتقلب:
• ±1σ = منطقة القيمة العادلة (Fair-Value Zone)
→ غالبًا منطقة غير مناسبة للتداول (No-Trade Zone)
• ±2σ = مناطق التشبّع الحركي (Extremes)
→ مناسبة لاستراتيجيات الانعكاس (Mean Reversion)
________________________________________
4) تصنيف حالة السوق Market Regimes
الاستراتيجية تستخدم مؤشر ADX لتحديد حالة السوق الحالية:
حالة السوق الوصف
Trending اتجاه واضح وقوي
Ranging تذبذب بدون اتجاه
Breakout اختراق مدعوم بحجم تداول
كل Regime يفعّل نموذج دخول مختلف داخل الاستراتيجية.
________________________________________
🎯 نماذج الدخول داخل الاستراتيجية
1) نموذج الاتجاه (Trend Mode)
يعمل فقط عندما يكون السوق في اتجاه حقيقي.
يعتمد على دخول Pullbacks قرب VWAP أو نطاق −1σ مع تأكيد شموعي.
________________________________________
2) نموذج الانعكاس (Mean Reversion Mode)
يعمل فقط عندما يكون السوق متذبذبًا (Range).
الدخول عند لمس ±2σ بهدف العودة نحو VWAP.
________________________________________
3) نموذج الاختراق (Breakout Mode)
يستخدم اختراقات Anchored VWAP
ولكن بشرط وجود حجم تداول أعلى من المتوسط (Volume Confirmation).
________________________________________
4) وضع الدمج (ALL Mode)
يجمع بين النماذج الثلاثة ويجعل الاستراتيجية متكيفة تلقائيًا مع كل حالات السوق.
________________________________________
📉 الخروج وإدارة المخاطر
تستخدم الاستراتيجية نظامًا ديناميكيًا لإدارة المخاطر:
• وقف الخسارة مبني على ATR
• الأهداف مبنية على طبيعة النموذج
• الصفقات الاتجاهية تستهدف R:R أعلى
• صفقات MR أقصر وأسرع
• صفقات Breakout أوسع ولكن مدعومة بزخم قوي
________________________________________
🧩 كيفية استخدام الاستراتيجية
1. ضع الاستراتيجية على رسم بياني نظيف بدون مؤشرات إضافية
2. اختر نموذج الدخول المناسب من الإعدادات
3. فعّل أو أخفِ خطوط VWAP حسب الحاجة
4. استخدم إعدادات مخاطرة واقعية
5. اختبر الاستراتيجية على عدة أسواق وفريمات
________________________________________
🔒 سبب إغلاق الكود
تم إغلاق الكود لأنها تعتمد على:
• محرك تثبيت AVWAP خاص
• نظام Regime Detection متقدم
• مصفوفة VWAP متعددة الطبقات
• منطق دخول/خروج خاص تم تطويره بالكامل
كل ذلك يتطلب حماية الملكية الفكرية، لذا تم نشرها Closed-Source.
RubberBand Scalp NQ Strategy (V6 - High PF Focus)
================================================================================
RUBBERBAND SCALP NQ (V6 - HIGH PF FOCUS)
================================================================================
// STRATEGY OVERVIEW
// -----------------
// Instrument: NQ (Nasdaq 100 E-mini Futures)
// Style: Intraday mean-reversion scalping
// Core Idea: Price "stretches" away from VWAP, then "snaps back" → enter on strong reversal
// Session: 9:00 AM – 2:30 PM CST (America/Chicago)
// Timeframe: 1–5 min (ideal: 2–3 min)
// Position: 2 contracts, pyramiding = 0
// Commission: $2.00 per contract
// Goal: High Profit Factor via asymmetric exits (1R fixed + unlimited runner)
// KEY FILTERS
// -----------
// • Only trade when ATR(15) > 5.0 points (~$100 range) → avoids chop
// • Must be in session → forces flat at 2:30 PM
// • VWAP proximity: price must touch within 0.5 × ATR of VWAP
// ENTRY LOGIC (LONG)
// -----------------
// 1. In session & no position
// 2. Close > Open (bullish bar)
// 3. Close > highest high of last 4 bars → momentum confirmation
// 4. Close > VWAP
// 5. Low < VWAP + (0.5 × ATR) → pullback reached VWAP zone
// 6. ATR > 5.0
// 7. Bar confirmed
// → Plot green triangle below bar
// ENTRY LOGIC (SHORT) – Symmetric
// -----------------
// 1. Close < Open
// 2. Close < lowest low of last 4 bars
// 3. Close < VWAP
// 4. High > VWAP - (0.5 × ATR)
// 5. ATR > 5.0
// → Plot red triangle above bar
// STOP LOSS – DUAL SYSTEM (Widest Stop Wins)
// -----------------------------------------
// VWAP Stop (Long): VWAP - 0.20
// ATR Stop (Long): Close - min(ATR × 1.0, 15.0)
// Final Stop: MAX(VWAP Stop, ATR Stop) → then CAP at Close - 0.20
// Short: MIN of both → FLOOR at Close + 0.20
// → Max buffer: 0.20 pts = $20 (4 ticks)
// → Risk = |Entry – Final Stop|
// PROFIT TAKING – 2 CONTRACTS
// ---------------------------
// Contract #1: Fixed 1R → limit = entry + risk (long) / entry - risk (short)
// Contract #2: Trailing stop only → trail_points = risk, trail_offset = 0
// NO FIXED TAKE PROFIT ON RUNNER → lets 3R, 5R, 10R+ winners run
// BUG: Short runner uses trail_offset = 1.5 → CHANGE TO 0
// V6 IMPROVEMENTS
// ---------------
// 1. ATR_STOP_MULTIPLIER reduced from 1.5 → 1.0 → tighter average loss
// 2. Removed fixed 2R cap on runner → unlimited upside
// 3. Widest-stop logic → prevents premature stop-outs
// TRADE EXAMPLE (LONG)
// -------------------
// Entry: 18,125 (2 contracts)
// Stop: 18,110 → Risk = $300/contract
// 1R: 18,155 → Contract #1 exits (+$600)
// Runner trails by $300 → exits at 18,425 (+$6,000)
// Total P&L: +$6,600
// PERFORMANCE EXPECTATIONS
// ------------------------
// Win Rate: 40–50%
// Avg Winner: >3× avg loser
// Profit Factor: 2.0–3.5+
// Max Drawdown: <5% (with risk controls)
// DAILY CHECKLIST
// ---------------
// 2–3 min NQ chart
// Timezone: America/Chicago
// ATR > 5.0
// Price touched VWAP zone
// 4-bar breakout confirmed
// trail_offset = 0 (both sides)
// Alerts on
// Log R-multiple
// FINAL NOTES
// -----------
// This is a PROFIT FACTOR system — not a high win-rate system.
// Success = discipline + volatility + clean execution.
================================================================================

MSB Trend Breakout Strategy V7**MSB Trend Breakout Strategy V7**
This is the full, high-precision automated strategy designed for disciplined traders who understand directional price action. The script functions as a robust **entry and trade management tool** following two proprietary concepts:
**1. Trend Confirmation:** A customized Moving Average filter is utilized to ensure entries strictly align with the dominant market flow.
**2. Momentum Confirmation:** The system uses a specific short-term **multi-bar breakout range** to pinpoint high-probability entries at the start of a momentum shift, avoiding choppy market conditions.
**Key Features:**
* **Automated Risk Management:** Includes complete dynamic Stop Loss (SL) and Take Profit (TP) order management to ensure capital preservation.
* **Time Filter:** Optimizes performance by filtering signals to the most liquid Forex trading hours (01:00 to 19:00, broker time).
**PREREQUISITE FOR ACCESS:**
This is an advanced tool. To utilize the strategy effectively, the user should have a foundational understanding of directional bias and trade management principles.
---
**Important Note & Risk Disclosure:**
This strategy is published under **Invite-only** protection. The script does not provide financial advice or guarantee profits. Past performance is not indicative of future results.

Fractional Candlestick Long Only Experimental V4 Another example of use an idea of Fractional Candlestick , based on mathematical rules of Fractional Calculus , typical kernel Caputo-Fabrizio ( CF ) and Atangana-Baleanu is used, alfa factor ( esential for calculation ) is in range 0,1-0.9.
Let's fun with this script .

Quasimodo Pattern Strategy Back Test [TradingFinder] QM Trading🔵 Introduction
The QM pattern, also known as the Quasimodo pattern, is one of the popular patterns in price action, and it is often used by technical analysts. The QM pattern is used to identify trend reversals and provides a very good risk-to-reward ratio. One of the advantages of the QM pattern is its high frequency and visibility in charts.
Additionally, due to its strength, it is highly profitable, and as mentioned, its risk-to-reward ratio is very good. The QM pattern is highly popular among traders in supply and demand, and traders also use this pattern.
The Price Action QM pattern, like other Price Action patterns, has two types: Bullish QM and Bearish QM patterns. To identify this pattern, you need to be familiar with its types to recognize it.
🔵 Identifying the QM Pattern
🟣 Bullish QM
In the bullish QM pattern, as you can see in the image below, an LL and HH are formed. As you can see, the neckline is marked as a dashed line. When the price reaches this range, it will start its upward movement.
🟣 Bearish QM
The Price Action QM pattern also has a bearish pattern. As you can see in the image below, initially, an HH and LL are formed. The neckline in this image is the dashed line, and when the LL is formed, the price reaches this neckline. However, it cannot pass it, and the downward trend resumes.
🔵 How to Use
The Quasimodo pattern is one of the clearest structures used to identify market reversals. It is built around the concept of a structural break followed by a pullback into an area of trapped liquidity. Instead of relying on lagging indicators, this pattern focuses purely on price action and how the market reacts after exhausting one side of liquidity. When understood correctly, it provides traders with precise entry points at the transition between trend phases.
🟣 Bullish Quasimodo
A bullish Quasimodo forms after a clear downtrend when sellers start losing control. The market continues to make lower lows until a sudden higher high appears, signaling that buyers are entering with strength. Price then pulls back to retest the previous low, creating what is known as the Quasimodo low.
This area often becomes the final trap for sellers before the market shifts upward. A visible rejection or displacement from this zone confirms bullish momentum. Traders usually place entries near this level, stops below the low, and targets at previous highs or the next resistance zone. Combining the setup with demand zones or Fair Value Gaps increases its accuracy.
🟣 Bearish Quasimodo
A bearish Quasimodo forms near the top of an uptrend when buyers begin to lose strength. The market continues to make higher highs until a sudden lower low breaks the bullish structure, showing that selling pressure is entering the market. Price then retraces upward to retest the previous high, forming the Quasimodo high, where breakout buyers are often trapped.
Once rejection appears at this level, it indicates a likely reversal. Traders can enter short near this area, with stop-losses placed above the high and targets near the next support or previous lows. The setup gains more reliability when aligned with supply zones, SMT divergence, or bearish Fair Value Gaps.
🔵 Setting
Pivot Period : You can use this parameter to use your desired period to identify the QM pattern. By default, this parameter is set to the number 5.
Take Profit Mode : You can choose your desired Take Profit in three ways. Based on the logic of the QM strategy, you can select two Take Profit levels, TP1 and TP2. You can also choose your take profit based on the Reward to Risk ratio. You must enter your desired R/R in the Reward to Risk Ratio parameter.
Stop Loss Refine : The loss limit of the QM strategy is based on its logic on the Head pattern. You can refine it using the ATR Refine option to prevent Stop Hunt. You can enter your desired coefficient in the Stop Loss ATR Adjustment Coefficient parameter.
Reward to Risk Ratio : If you set Take Profit Mode to R/R, you must enter your desired R/R here. For example, if your loss limit is 10 pips and you set R/R to 2, your take profit will be reached when the price is 20 pips away from your entry point.
Stop Loss ATR Adjustment Coefficient : If you set Stop Loss Refine to ATR Refine, you must adjust your loss limit coefficient here. For example, if your buy position's loss limit is at the price of 1000, and your ATR is 10, if you set Stop Loss ATR Adjustment Coefficient to 2, your loss limit will be at the price of 980.
Entry Level Validity : Determines how long the Entry level remains valid. The higher the level, the longer the entry level will remain valid. By default it is 2 and it can be set between 2 and 15.
🔵 Results
The following examples show the backtest results of the Quasimodo (QM) strategy in action. Each image is based on specific settings for the symbol, timeframe, and input parameters, illustrating how the QM logic can generate signals under different market conditions. The detailed configuration for each backtest is also displayed on the image.
⚠ Important Note : Even with identical settings and the same symbol, results may vary slightly across different brokers due to data feed variations and pricing differences.
Default Properties of Backtests :
OANDA:XAUUSD | TimeFrame: 5min | Duration: 1 Year :
BINANCE:BTCUSD | TimeFrame: 5min | Duration: 1 Year :
CAPITALCOM:US30 | TimeFrame: 5min | Duration: 1 Year :
NASDAQ:QQQ | TimeFrame: 5min | Duration: 5 Year :
OANDA:EURUSD | TimeFrame: 5min | Duration: 5 Year :
PEPPERSTONE:US500 | TimeFrame: 5min | Duration: 5 Year :

The Butterfly Elephant EffectStrategy Overview: The Butterfly Elephant Effect
Concept & Philosophy:
Welcome to "The Butterfly Elephant Effect," a sophisticated multi-indicator strategy that operates on the principle that small, precise technical signals (the Butterfly) can trigger significant market moves (the Elephant Effect). This strategy is designed to identify high-probability reversal points by combining three powerful analytical systems into one cohesive framework. It seeks to catch major trend reversals at key support and resistance levels, using a confluence of volume, momentum, and overbought/oversold oscillators.
Core Components:
The strategy intelligently synthesizes three distinct systems:
Lucky Balls System (Volume & Trend):
Utilizes the Negative Volume Index (NVI) and Positive Volume Index (PVI) to understand smart money activity and trend strength.
Plots these indices on the price chart, scaled to the recent price range for actionable signals.
Generates signals when price interacts with a moving average envelope, identifying potential exhaustion points.
Momentum Confirmation System:
Combines RSI, CCI, and PPO momentum oscillators into a single, refined line.
This "Momentum Composite" line is used to confirm the strength of a reversal signal as it crosses the dynamic envelope bands.
Lucky Table System (Market Breadth & Confluence):
This is the heart of the strategy's filtering mechanism. It runs 36 different oscillator readings across 6 different timeframes for Stochastic, Williams %R, RSI, and MACD.
It counts the number of these oscillators that are in extreme overbought or oversold territory.
A "Lucky Table" signal is generated when the number of matching oscillators exceeds your customizable threshold (e.g., 30 out of 36), indicating a massive, multi-timeframe consensus on market exhaustion.
The Ultimate Signals:
The strategy's most powerful entries are the specially named signals that require a perfect storm of conditions:
🐘 Elephant Long Signal: Triggers when the Momentum System gives a buy, the Lucky Table shows extreme oversold consensus, AND the price is at or below the adjusted lower envelope band. This represents a potential major bullish reversal from a support zone.
🦋 Butterfly Short Signal: Triggers when the Momentum System gives a sell, the Lucky Table shows extreme overbought consensus, AND the price is at or above the adjusted upper envelope band. This represents a potential major bearish reversal from a resistance zone.
Key Features:
Visual Clarity: A rich set of plotshapes (🪜, 🐍, 🐸, ✈️, ⚽) makes it easy to identify the contributing signals from each subsystem on the chart.
Comprehensive Dashboard: A real-time table displays all 36 oscillator values from the Lucky Table, color-coded for quick assessment of market conditions.
Flexible Risk Management: Includes optional Profit Target and Stop Loss based on a percentage of entry price.
Highly Customizable: Every parameter—from lookback lengths and scale factors to the crucial match threshold—can be adjusted to fit your trading style and instrument.
How to Use:
Add the strategy to your chart.
Look for the primary Elephant (🐘) or Butterfly (🦋) signals near the envelope boundaries.
Use the Lucky Table on the top-right to confirm the strength of the oversold/overbought conditions.
Manage your trade using the built-in PT/SL or your own discretion.
Ideal For: Swing traders and position traders looking for high-conviction entries at potential market turning points.
Disclaimer: This is a complex strategy designed for educational and research purposes. Always test and forward-test any strategy in a simulated environment before committing real capital. Past performance is not indicative of future results.
PS Look out for the Frog :-)

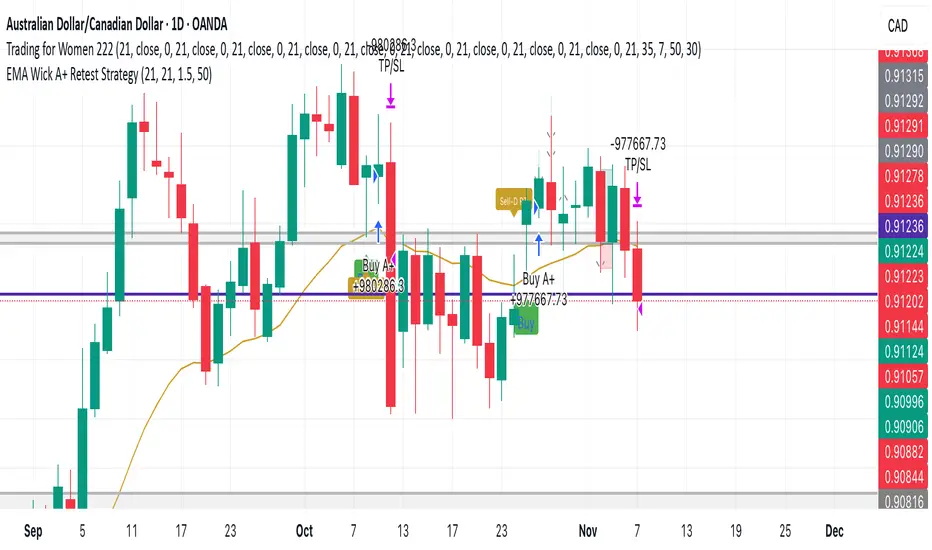
EMA Wick A+ Retest StrategyThe EMA Wick A+ Retest Strategy is a precision pullback system built for high-probability trend entries. It uses a combination of:
EMA 21 dynamic trend filtering
ATR-based stop-loss and reward targeting (1:1.5 RR)
Wick retest logic, where the lower wick must touch the EMA and represent at least 50% of the candle's range
Optional filter: RSI > 50 for bullish momentum confirmation
This strategy is designed to capture institutional-style entries after a clean pullback in an uptrend.
✅ Clean signals
✅ High risk-to-reward setups
✅ Built for swing trading or intraday with strong trend bias
Ideal for Forex, Crypto, and Indices.
Use responsibly. Backtest before live trading.
Blackflag FTS Strategy – Based on Extremum (Fractional CF/AB)Example of usage concepts of Fractional calculus Math rules, script use two type of kernel (Caputo-Fabrizio and Atangana-Baleanu), basic parametr alpha ( independently for each kernel) could be change in range 0.1-0.9.

NEXT GEN INSPIRED BY OLIVER VELEZDYOR NFA
1. Initial Setup & Application
Load the Strategy to your desired chart (e.g., EURUSD M5, as suggested by the script's backtest).
Overlay: Ensure the script is set to overlay=true (which it is) so the signals and Moving Averages plot directly on the price chart.
Equity Management: Review the initial strategy settings for capital and position sizing:
Initial Capital: Defaults to 10,000.
Default Qty Type: Set to strategy.percent_of_equity (22%), meaning 22% of your available equity is used per trade. Adjust this percentage based on your personal risk tolerance.
2. Reviewing Key Indicator Inputs
The script uses default values that are optimized, but you can adjust them in the settings panel:
Fast EMA: Defaults to 9 (e.g., a 9-period Exponential Moving Average).
Slow EMA: Defaults to 21 (e.g., a 21-period Exponential Moving Average). These EMAs define the short-term trend.
ATR: Defaults to 14 (Average True Range). Used to dynamically calculate volatility for SL/TP distances.
Final R:R: Defaults to 4.5 (minimum R:R required for a signal). This is the core of the strategy's high reward goal.
3. Interpreting Entry Signals
A trade signal is generated only when all conditions—EMA trend, "Elephant Logic" momentum, and non-ranging market—are met.
Long Signal: Appears as a green triangle (▲) below the bar, labeled "COMBO".
Short Signal: Appears as a red triangle (▼) above the bar, labeled "COMBO".
Live Plan: Upon signal, a detailed label is immediately plotted on the chart showing the FULL BATTLE PLAN:
SL: Calculated Stop Loss price.
TP: Calculated Take Profit price (based on the Final R:R).
Risk/Reward Pips: The calculated pips for the trade's risk and reward.
R:R = 1:4.5: The exact Risk-to-Reward ratio.
4. Understanding Market Conditions & Visuals
The script provides visuals to help you understand the current market state:
Trend EMAs: The 9 EMA (green) and 21 EMA (purple/magenta) are plotted to show the underlying trend.
Long trades only fire when Price > 9 EMA > 21 EMA.
Short trades only fire when Price < 9 EMA < 21 EMA.
Ranging Market (Rejection): Bars turn a light gray/silver when the proprietary "Reject Ranging" logic is active, indicating a low-volatility period. No new trades will be taken during these bars.
Momentum Bar: Bars turn a gold/yellow color when the "Elephant Logic" (high-momentum, large-body candles over 2-3 periods) is detected, highlighting powerful price movement.
5. Execution and Exit Logic
The strategy handles entry, scaling, and exit automatically:
Entry: A market order is placed (strategy.entry) immediately upon the bar where the longSetup or shortSetup condition is met.
Scaling Out (+1R): If the trade moves favorably by an amount equal to the initial risk (1R), the script closes a portion of the position (strategy.close with comment "+1R"). This partial exit locks in profit equivalent to the initial risk.
Re-entry (Pyramiding): After the +1R exit, the strategy attempts a re-entry (LONG RE/SHORT RE diamond plot) if the price meets certain criteria near the 9 EMA, trying to capitalize on further trend continuation.
Final Exits:
Take Profit: A limit order is set at the calculated TP level (stopDist * minRR).
Stop Loss: A stop order is set at the calculated SL level (stopDist * 1.3), slightly wider than the initial SL distance, likely to account for spread/slippage, ensuring the maximum loss is defined.
Trailing Stop: A trailing stop is applied to the re-entry positions (LONG RE/SHORT RE) to protect profits as the market moves further in the direction of the trade.

TitanEdge Algo Suite — 4H BTC & ETH (Delta Exchange Ready)TitanEdge Algo Suite — 4H BTC & ETH (Delta Exchange Ready)
TitanEdge Algo Suite is a next-generation trading system that fuses volatility-adaptive logic, order-block structure, SuperTrend direction filtering, and ATR-based exits into a single modular framework.
It’s engineered for 4-hour BTC and ETH swing trading, delivering institutional-grade entries, dynamic risk control, and precise exits.
⚙️ Core Features
1. Volatility Oscillator (0–100)
• Filters trades by volatility intensity.
• Uses ATR, Range, or Bollinger Band Width normalization.
• Trades trigger only when market volatility is high — filtering out sideways or weak trends.
• Ensures trades occur during real momentum expansions.
2. Breakout + Order Block Engine
• Detects pivot highs/lows to confirm authentic breakout levels.
• Identifies “smart money” gaps — institutional imbalance zones often leading to strong reversals or continuations.
• Captures both breakout continuations and order-block reversals.
• Works as a hybrid structure detector combining price action and volatility alignment.
3. SuperTrend Directional Filter
• Optional filter that only allows trades in the direction of the SuperTrend.
• Can automatically close trades when a SuperTrend flip occurs.
• Provides strong trend-following bias and helps avoid countertrend traps.
4. ATR-Based Stop & Trailing System
• Adaptive stop-loss and trailing logic that expands or tightens based on volatility.
• Supports three modes: StopOnly, TrailOnly, and StopAndTrail.
• Works in both ATR-based distance or percentage-based configuration.
• Keeps losing trades small and lets winning trades extend dynamically.
5. Volume-Based Exit Logic
• Detects low-volume exhaustion to identify momentum loss.
• Detects opposite-volume spikes as early reversal signals.
• Optional hybrid “Both” mode combines both detection methods for stronger reliability.
• Ideal for markets where volume surges indicate smart money exits or trap formations.
6. Session Filter & Anti-Churn Control
• Restrict trading hours (optional; not required for crypto).
• Prevents repeated signals and noise-based entries through minimum bars between trades.
• Cooldown logic ensures disciplined trading and avoids strategy overlap.
• Prevents multiple entries in a single bar and filters unconfirmed breakouts.
7. SmartMoney Preset Mode
• Institutional-grade configuration automatically adjusting volatility, ATR, and structural logic.
• Mimics smart money behavior by prioritizing clean structure and high liquidity volatility zones.
• Great for traders who want simplified institutional logic without manual tuning.
Optimized for 4H BTC & ETH
TitanEdge performs best on BTCUSDT and ETHUSDT pairs in the 4-hour timeframe.
The 4H chart captures high-volatility institutional swings, eliminates intraday noise, and provides clear order-block setups.
This timeframe aligns with BTC/ETH volatility cycles, providing consistent signals and cleaner trend confirmation.
Recommended settings for 4H charts:
• Levels Period: 25
• Volatility Filter: 20
• volatility oscillator Auto: disable ( it depend upon your plan test with Disable/enable)
• Volatility Method: BBWidth
• ATR Multiplier: 1.8
• ATR Stop %: 5
• SuperTrend ATR Length: 10
• SuperTrend Factor: 3
• ATR Mode: StopAndTrail
• Hold Bars: 1
• Volume Exit: Disable (Both)
• Session Filter: Off (Crypto runs 24/7)
Entry Logic
• Long Entry: Price breaks above resistance (pivot high), volatility above threshold, and optional SuperTrend confirmation.
• Short Entry: Price breaks below support (pivot low), volatility above threshold, and optional bearish SuperTrend confirmation.
• Additional Entry: Triggered by order-block gaps (smart money imbalances) in volatility expansion phases.
• Trades only when both direction and volatility align to ensure precision entries.
Exit Logic
• ATR Stop and Trail dynamically manage open trades.
• SuperTrend Flip forces exit on trend reversal.
• Volume Exit triggers when volume momentum drops or opposite spike occurs.
• Optional session close exit to flatten trades outside hours.
• Logic prevents premature exits with “Hold Bars” delay after entry.
Why You Need TitanEdge Algo Suite
• Trades only during high-volatility, strong-momentum phases — no false breakouts or choppy trades.
• ATR risk control automatically adjusts to each market’s volatility conditions.
• Identifies institutional order-blocks and clean breakouts for precise entries.
• SuperTrend filter adds directional bias, boosting win-rate consistency.
• Volume exit logic ensures profits are protected when market momentum fades.
• Works 24/7 across all major crypto pairs — fully automated and customizable.
• Built for 4H swing trades — fewer but higher-quality setups.
• Fully compatible with TradingView alerts and bot integration for hands-free execution.
How TitanEdge Makes Profit
• TitanEdge only trades during volatility expansion, when breakout continuation probability is statistically high.
• ATR dynamic stops prevent large losses by scaling protection according to real volatility.
• Trend filtering keeps positions aligned with major market flows.
• Order-block detection ensures entries are based on price structure rather than random signals.
• Volume-based exits secure profits early when momentum weakens.
• SmartMoney Preset provides optimal balance between trade frequency, accuracy, and drawdown control.
• The system compounds edge by maintaining trade discipline — fewer but stronger trades over time.
Delta Exchange Integration (TradingView Bot Ready)
TitanEdge is fully compatible with TradingView alert webhooks and can connect to Delta Exchange or any bot-supported broker.
Alert JSON message format:
{"symbol":"{{ticker}}","side":"{{strategy.order.action}}","qty":1,"trigger_time":"{{timenow}}","strategy_id":"code"}
qty 1 represent 1 lot so if you want to take trade with 5 lots or 0.05eth and write
{"symbol":"{{ticker}}","side":"{{strategy.order.action}}","qty":5,"trigger_time":"{{timenow}}","strategy_id":"code"}
Steps to automate:
Create an alert on TradingView using “Once Per Bar Close”.
Paste your bot or automation webhook URL.
Paste the JSON above as the message.
Configure your bot or API bridge (like PineConnector, AutoView, or WunderTrading) to route signals to Delta Exchange.
On Delta, use BTCUSD or ETHUSD Perpetual pairs with moderate leverage (3x–5x).
Enable Cross Margin for smooth drawdown handling.
Test first on Delta Testnet for safety.
Why 4H BTC & ETH Works Best
• 4H candles capture true volatility swings and filter lower-timeframe noise.
• Aligns with institutional liquidity cycles in BTC and ETH.
• ATR and volume-based stops perform optimally on larger bars.
• Smoother equity curve and less drawdown compared to intraday trading.
• Ideal for traders seeking structured, medium-term trades with high reward-to-risk.
Unique Edge
• Combines breakout, order-block, and volatility principles into one adaptive model.
• Incorporates volatility normalization (ATR/BBWidth) for multi-market adaptability.
• Dynamic ATR stops and trailing protect capital during unstable phases.
• Volume and trend exits create layered protection systems.
• 4H optimization eliminates noise and provides clear institutional alignment.
• SmartMoney preset auto-configures settings to mimic large-player behavior.
• Fully automated via webhooks — no manual execution required.
• Modular design lets you customize each component for different trading styles.
TradingView Bot Integration
TitanEdge is fully plug-and-play with all TradingView-compatible bots.
Each alert sends structured JSON data containing direction, symbol, and quantity, ready for execution on your connected broker.
You can route the data to:
• PineConnector (MT4/MT5 bridge)
• WunderTrading
• AutoView
• Custom Node/REST API handler
This makes TitanEdge a professional-grade strategy suitable for semi-automatic or fully automated crypto trading setups.
Professional Recommendations
• Timeframe: 4H
• Instruments: BTCUSDT, ETHUSDT
• Exchange: Delta Exchange (Perpetual Futures)
• Leverage: 3x–5x
• Session Filter: Off (crypto 24/7)
• Risk per trade: 0.5%–1% of total equity
• Alert Type: Once Per Bar Close
• Volatility Filter: 25–35 depending on market activity
• Always use realistic slippage and fees for backtests.
Summary
TitanEdge Algo Suite is a complete trading framework built to deliver institutional-quality precision with full automation support.
It captures powerful volatility expansions on 4H BTC and ETH charts using clean structure, adaptive stops, and directional trend filters.
Every feature — from entry logic to exits — is designed to protect capital and amplify performance through disciplined, volatility-aware execution.
TitanEdge is not just another script — it’s a professional-grade algorithm that combines volatility intelligence, structural precision, and adaptive risk control.
TitanEdge Algo Suite = Smart Logic × Trend Discipline × Adaptive Risk Control
Optimized for BTC & ETH on 4H charts. Built for traders who demand precision, control, and consistency.

nOI + Funding + CVD • strategynOI + Funding + CVD Strategy
Overview
This strategy is designed for cryptocurrency trading on platforms like TradingView, focusing on perpetual futures markets. It combines three key indicators—Normalized Open Interest (nOI), Funding Rate, and Cumulative Volume Delta (CVD)—to generate buy and sell signals for long and short positions. The strategy aims to capitalize on market imbalances, such as overextended open interest, funding rate extremes, and volume deltas, which often signal potential reversals or continuations in trending markets.
The script supports pyramiding (up to 10 positions), uses percentage-based position sizing (default 10% of equity per trade), and allows customization of trade directions (longs and shorts can be enabled/disabled independently). It includes multiple signal systems for entries, various exit mechanisms (including stop-loss, take-profit, time-based exits, and conditional closes based on indicators), a Martingale add-on system for averaging positions during drawdowns, and handling of opposite signals (ignore, close, or reverse).
This strategy is not financial advice; backtest thoroughly and use at your own risk. It requires data sources for Open Interest (OI) and Funding Rates, which are fetched via TradingView's security functions (e.g., from Binance for funding premiums).
Key Indicators
1. Normalized Open Interest (nOI)
Group: Open Interest
Purpose: Measures the relative level of open interest over a lookback window to identify overbought (high OI) or oversold (low OI) conditions, which can indicate potential exhaustion in trends.
Calculation:
Fetches OI data (close) from the symbol's standard ticker (e.g., "{symbol}_OI").
Normalizes OI within a user-defined window (default: 500 bars) using min-max scaling: (OI - min_OI) / (max_OI - min_OI) * 100.
Upper threshold (default: 70%): Signals potential short opportunities when crossed from above.
Lower threshold (default: 30%): Signals potential long opportunities when crossed from below.
Visualization: Plotted as a line (teal above upper, red below lower, gray in between). Horizontal lines at upper, mid (50%), lower, and a separator at 102%.
Notes: Handles non-crypto symbols by adjusting timeframe to daily if intraday. Errors if no OI data available.
2. Funding Rate
Group: Funding Rate
Purpose: Tracks the average funding rate (premium index) to detect market sentiment extremes. Positive funding suggests bull bias (longs pay shorts), negative suggests bear bias.
Calculation:
Fetches premium index data from Binance (e.g., "binance:{base}usdt_premium").
Supports lower timeframe aggregation (default: enabled, using 1-min TF) for smoother data.
Averages open and close premiums, clamps values, and scales/shifts for plotting (base: 150, scale: 1000x).
Upper threshold (default: 1.0%): Overheat for shorts.
Lower threshold (default: 1.0%): Overcool for longs.
Ultra level (default: 1.8%): Extreme for additional short signals.
Smoothing: Uses inverse weighted moving average (IWMA) or lower-TF aggregation to reduce noise.
Visualization: Shifted plot (green positive, red negative) with filled areas. Horizontal lines for overheat, overcool, base (0%), and ultra.
Notes: Custom ticker option for non-standard symbols.
3. Cumulative Volume Delta (CVD)
Group: CVD (Cumulative Volume Delta)
Purpose: Measures net buying/selling pressure via volume delta, normalized to identify divergences or confirmations with price.
Calculation:
Delta: +volume if close > open, -volume if close < open.
Cumulative: Rolling cumsum over a window (default: 500 bars), smoothed with EMA (default: 20).
Normalized: Scaled by absolute max in window (-1 to 1 range).
Scaled/shifted for plotting (base: 300 or 0 if anchored, scale: 120x).
Upper threshold (default: 1.0%): Over for shorts.
Lower threshold (default: 1.0%): Under for longs.
Visualization: Shifted plot (aqua positive, purple negative) with filled areas. Horizontal lines for over, under, and separator (default: 252).
Filter Options (for Signal A):
Enable filter (default: false).
Require sign match (Long ≥0, Short ≤0).
Require extreme zones.
Require momentum (rising/falling over N bars, default: 3).
Signal Logics for Entries
Entries are triggered by buy/sell signals from multiple systems (A, B, C, D), filtered by direction toggles and entry conditions.
Signal System A: OI + Funding (with optional CVD filter)
Enabled: Default true.
Sell (Short): nOI > upper threshold, falling over N bars (default: 3), delta ≥ threshold (default: 3%), funding > overheat, and CVD filter OK.
Buy (Long): nOI < lower threshold, rising over N bars (default: 3), delta ≥ threshold (default: 3%), funding < overcool, and CVD filter OK.
Signal System B: Short - Funding Crossunder + Filters
Enabled: Default true.
Sell (Short): Funding crosses under overheat level, optional: CVD > over, nOI < upper.
Signal System C: Short - Ultra Funding
Enabled: Default false.
Sell (Short): Funding crosses ultra level (up or down, both default true).
Signal System D: Long - Funding Crossover + Filters
Enabled: Default true.
Buy (Long): Funding crosses over overcool level, optional: CVD < under, nOI > lower.
Combined: Sell if A/B/C active; Buy if A/D active.
Entry Filters
Cooldown: Optional pause between entries (default: false, 3 bars).
Max Entries: Limit pyramiding (default: true, 6 max).
Entries only if both filters pass and direction allowed.
Opposite Signal Handling
Mode: Ignore (default), Reverse (close and enter opposite), or Close (exit only).
Processed before regular entries.
Position Management
Martingale (3 Steps):
Enabled per step (default: all true).
Triggers add-ons at loss levels (defaults: 5%, 8%, 11%) by adding % to position (default: 100% each).
Resets on position close.
Break Even:
Enabled (default: true).
Activates at profit threshold (default: 5%), sets SL better by offset (default: 0.1%).
Exit Systems
Multiple exits checked in sequence.
Exit 1: SL/TP
Enabled: Separate for long/short (default: true).
SL: % from avg price (defaults: 1% long/short).
TP: % from avg price (defaults: 2% long/short).
Exit 2: Funding
Enabled: Separate for long (up) / short (down) (default: true).
Long Exit: Funding > upper exit threshold (default: 0.8%).
Short Exit: Funding < lower exit threshold (default: 0.8%).
Exit 3: nOI
Enabled: Separate for long (up) / short (down) (default: true).
Long Exit: nOI > upper exit (default: 85%).
Short Exit: nOI < lower exit (default: 15%).
Exit 4: Global SL
Enabled: Default true.
Exit: If position loss ≥ % (default: 7%).
Exit 5: Break Even (integrated in position block)
Exit 6: Time Limit
Enabled: Separate for long/short (default: true).
Exit: After N bars in trade (defaults: 30 each).
Timer updates on add-ons if enabled (default: true).
Visual Elements
Buy/Sell Labels: Small labels ("BUY"/"SELL") on bars with signals, limited to last 30.
All indicators plotted on a separate pane (overlay=false).
Usage Notes
Backtesting: Adjust parameters based on asset/timeframe. Test on historical data.
Data Requirements: Works best on crypto perps with OI and funding data.
Risk Management: Incorporates SL/TP and global SL; monitor drawdowns with Martingale.
Customization: All thresholds, enables, and scales are inputs for fine-tuning.
Version: Pine Script v6.
For questions or improvements, contact the author. Happy trading!

Dynamic Momentum Scalper | Gold & Volatility Strategy V1.0This is a high-frequency trading strategy optimized for volatile instruments, specifically XAUUSD (Gold). It utilizes a proprietary blend of momentum, volume, and volatility metrics to identify minor market reversal points and trend exhaustion.
The system employs a sophisticated, dynamic stop-loss mechanism based on Average True Range (ATR) to adjust risk automatically to current market conditions. It manages trades via a two-tiered Take-Profit system to secure partial profits quickly and let the remaining position run to a secondary target, effectively locking in gains and achieving an optimal risk-reward balance.
Best suited for the 1-Minute (M1) timeframe.
Visibility: Invite-Only Script.
