MY_SCALP strategyThe MY_SCALP strategy is designed to work with any instrument (cryptocurrency, stocks, forex).
The working timeframe for scalping is small from 1 to 15 minutes, and for trend trading from 30 minutes.
Signals are generated based on the price range (channel) within which the price of the instrument moves.
When the price of the channel breaks up, we expect an upward movement, and when it breaks down, we expect a downward movement.
To avoid manipulations in the market, the algorithm monitors the level of the price relative to the global trend and thus filters out a large part of the false signals.
In addition, in the settings it is possible to show additional inputs - these are the moments of rebound from the edge of the channel inwards, also with filtering applied.
-------------------------------------
💹 SETUP SETUP:
-------------------------------------
To adjust, you should change the value of the CHANNEL multiplier - this depends on the sensitivity and flexibility of the range.
For TF 5m it will be about 8-9, and for TF 1H about 4-5. That is, the higher the TF, the lower the value of the CHANNEL multiplier.
-------------------------------------
🟢 TAKE SETUP:
-------------------------------------
The strategy has 2 takes
You can choose the type of take - FIX or CHANNEL
FIX - fixed targets in %.
CHANNEL - channel takes (The width of the channel at the moment the signal appears is multiplied by the specified multiplier and thus the size of the take is calculated.).
Important: the 1st take cannot be more than the 2nd!
-------------------------------------
⛔️ STOP SETUP:
-------------------------------------
Stop type is also selectable:
FIX - fixed stop in %.
CHANNEL - channel stop (set % of the price for the offset from the opposite side of the trading channel. For additional entries, the stop uses the value of half the channel width + the specified offset from the position entry price).
You have the opportunity to activate the stop line tightening when the 1st tp1 take breakeven is reached.
-------------------------------------
💡 OTHER USEFUL FEATURES
-------------------------------------
✅ In the strategy, you can enable / disable the display of takes and stop lines.
✅ In the strategy, you can enable / disable the display of points of probable price rebounds.
✅ You can choose the direction of trading: long, short or any.
✅ You can choose the percentage of the position to close on the 1st take.
✅ It is possible to enable background highlighting of the current trend. This background does not stretch to the entire screen, but is limited to the calculated extremes, within which the asset price moves.
✅ The screen has a compact display of a table with the current strategy settings and the current state (position, takes, stop).
For the convenience of saving your settings, use the standard PrintScreen function.
✅ You can sign the strategy in the Notes field - this is convenient if you place several versions of the MY_SCALP strategy on the chart with different settings (for different pairs or for different timeframes).
✅ 👉 In the strategy settings, each field has hints , to do this, hover over the ⓘ sign
-------------------------------------
MY_SCALP strategy is closed! You can get test access to it for 48 hours.
👉 In order to gain access or ask questions, write to me in private messages or at the contacts indicated in my signature.
-------------------------------------
========================================================================================================
Стратегия MY_SCALP предназначена для работы с любым инструментом (криптовалюта, акции, форекс).
Рабочий таймфрейм для скальпинга - малый от 1 до 15 минут, а для трендовой торговли от 30 минут.
В основе формирования сигналов лежит ценовой рейндж (канал), внутри которого движется цена инструмента.
При пробитии ценой канала вверх, мы ожидаем восходящее движение, а при пробитии вниз - нисходящее.
Чтобы избежать манипуляций на рынке, алгоритм отслеживает уровень нахождения цены относительно глобального тренда и тем самым фильтрует немалую часть ложных сигналов.
Кроме этого в настройках есть возможность показать дополнительные входы - это моменты отскока от края канала внутрь, также с применением фильтрации.
-------------------------------------
💹 НАСТРОЙКА СЕТАПА:
-------------------------------------
Для настройки следует ищменять значение множителя канала CHANNEL - это этого зависит чувствительность и гибкость рейнджа.
Для ТФ 5м это будет примерно 8-9, а для ТФ 1Ч примерно 4-5. То есть, чем выше ТФ, тем ниже значение множителя CHANNEL.
-------------------------------------
🟢 НАСТРОЙКА ТЕЙКОВ:
-------------------------------------
Стратегия имеет 2 тейка
Тип тейка можно выбрать - FIX или CHANNEL
FIX - фиксированные тейки в %.
CHANNEL - канальные тейки (Ширина канала в момент появления сигнала умножается на заданный множитель и таким образом высчитывается размер тейка.).
Важно: 1-й тейк не может быть больше 2-го!
-------------------------------------
⛔️ НАСТРОЙКА СТОПА:
-------------------------------------
Тип стопа также выбирается:
FIX - фиксированный стоп в %.
CHANNEL - канальный стоп (задаётся % цены для отступа от противоположной стороны торгового канала. Для дополнительных входов стоп использует значение половины ширины канала + заданный отступ от цены входа в позицию).
У Вас есть возможность активировать подтяжку стоп-линии при достижении 1-го тейка tp1 в безубыток.
-------------------------------------
💡 ПРОЧИЕ ПОЛЕЗНЫЕ ФУНКЦИИ
-------------------------------------
✅ В стратегии можно включить/отключить отображение тейков и стоп-линии.
✅ В стратегии можно включить/отключить отображение точек вероятных отскоков цены.
✅ Можно выбрать направление торговли: лонг, шорт или любое.
✅ Можно выбрать процент позиции для закрытия на 1-м тейке.
✅ Есть возможность включения фоновой подкраски текущего тренда. Данный фон не растягивается на весь экран, а ограничивается расчётными экстремумами, в рамках которых двигается цена актива.
✅ На экране есть компактное отображение таблицы с текущими настройками стратегии и текущим состоянием (позиция, тейки, стоп).
Для удобства сохранения своих настроек - воспользуйтесь стандартной функцией PrintScreen.
✅ Вы можете подписать стратегию в поле Notes - это удобно, если Вы размещаете на графике несколько версий стратегии MY_SCALP с разными настройками (для разных пар или для разных ТФ).
✅ 👉 В настройках стратегии у каждого поля есть подсказки , для этого наведите курсор на знак ⓘ
-------------------------------------
Стратегия MY_SCALP является закрытой! Вы можете получить к ней тестовый доступ на 48 часов.
👉 Для того, чтобы получить доступ или задать вопросы пишите мне в личные сообщения или по контактам, указанным в моей подписи.
-------------------------------------
Wyszukaj w skryptach "range"

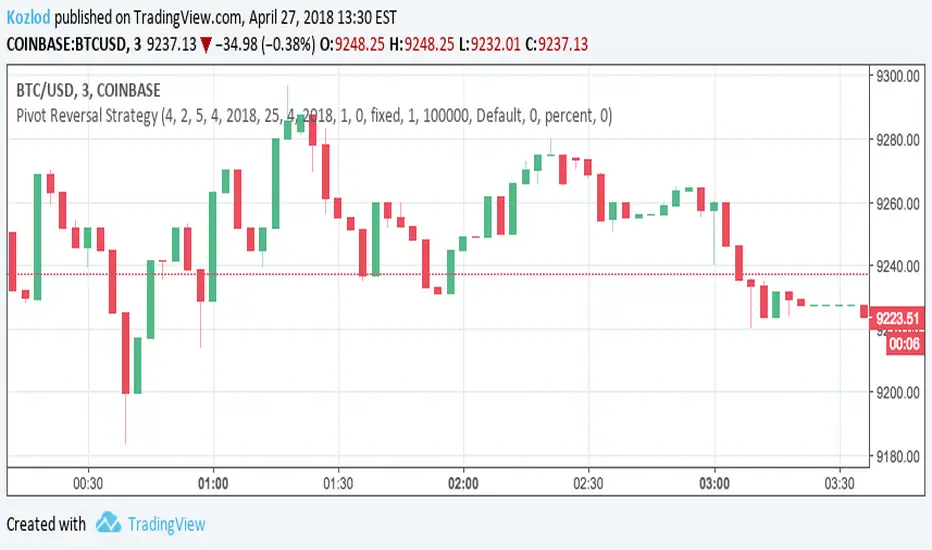
Pivot Reversal Strategy with backtest date rangeThis is standard Pivot Reversal Strategy with backtest date range added.
In parameters you can select from/to date for backtesting range.
Breakout Scalper (Session)This is a twist on my on my Breakout Scalper strategy that limits trading to a user-configurable session
Find the original "Continuous" version of the scalper here:
The breakout scalper is based on "slow" and "fast" donchian periods. In this version, the "slow" donchian is in fact the Day's high/low. This important difference means that we will always be entering our trades at the day's high or low, so you are exposed to the price making new highs/lows but not to oscillations within the day's range.
Furthermore, the scalper is modified to only enter trades after the start of the user-configured session. Any open trades are closed at the end of the user-configured session. The default session is set to 10:00 AM to 3:30 PM because that's when I like to trade.

Opening Range Breakout & Targets [Strategy] (Fixed + Alerts)This strategy backtests a classic Opening Range Breakout approach using a configurable opening range window (time-based OR or custom session). Once the opening range is completed, the strategy waits for price to break above ORH (Opening Range High) or below ORL (Opening Range Low) and enters in the direction of the breakout.
Targets are derived directly from the opening range width:
OR Width = ORH − ORL
Target Step = OR Width × Target %
Take-profit is placed at the selected Target # (T1, T2, etc.)
An optional Daily Bias filter can be enabled to reduce false breakouts by comparing today’s opening range midpoint (ORM) to the previous session’s ORM. When bias is active, breakouts against the bias can require a stronger confirmation (break beyond the first target step).
Risk management is configurable via multiple stop options:
Stop at Opposite OR
Stop at OR Midpoint
Stop at 1× Target Step
Or disable stops for custom management
Includes support for:
Long/Short/Both modes
One trade per session option
Optional exit on opposite breakout
Separate alert conditions (when used with the companion indicator)
Note: This is a backtesting tool. Always validate results across symbols/timeframes and account for slippage/commissions before live use.

Three-Step 9:30 Range Scalping# Three-Step 9:30 Range Scalping Strategy Rules
## Step 1: Mark the Levels (9:30 AM)
- Wait for the **first 5-minute candle** starting at 9:30 AM EST to close
- Mark the **HIGH** and **LOW** of this candle
- Switch to **1-minute chart** for trading
## Step 2: Find Your Entry (Trade for 1 hour only: 9:30-10:30 AM)
### BREAK Entry
- Need: **Fair Value Gap (FVG)** + **ANY** of the 3 FVG candles closes outside the range
- FVG = Gap between candle wicks (3-candle pattern)
### TRAP Entry
- Need: Break outside range → Retest back inside → Close back outside again
### REVERSAL Entry
- Need: Failed break in one direction → Opposite FVG back into the range
## Step 3: Trade Management
### Stop Loss:
- **Break/Trap**: Low/High of first candle that closed outside the range
- **Reversal**: Low/High of first candle in the FVG pattern
### Take Profit:
- **Always 2:1 risk-to-reward ratio**
- If you risk $100, you make $200
## Key Rules:
- ✅ **Body close** outside range (not just wicks)
- ✅ Trade on **1-minute chart** only
- ✅ Only trade **first hour** (9:30-10:30 AM EST)
- ✅ **Fixed 2:1** take profit every time
- ✅ One strategy, stay consistent
**That's it. No complicated indicators, no higher timeframe bias, no guesswork.**

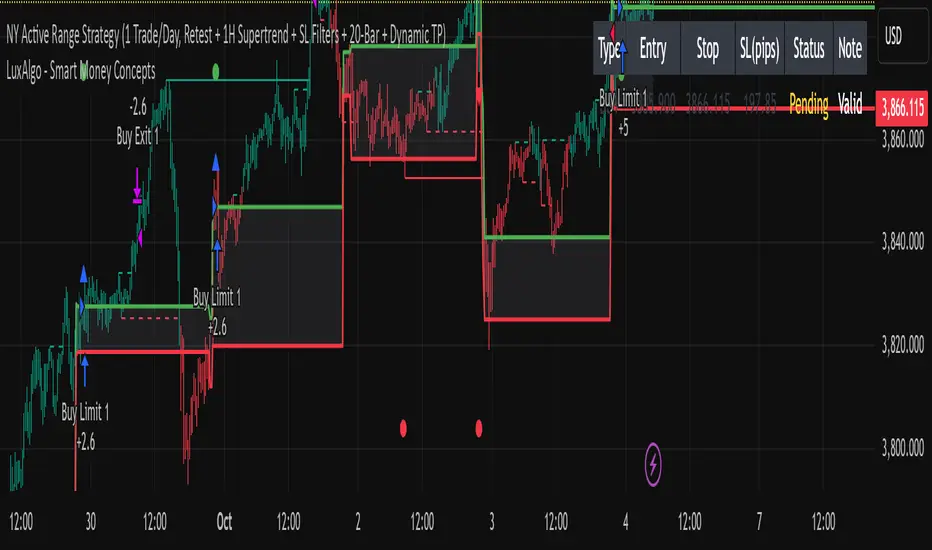
NY Opening Range Breakout - MA StopCore Concept
This strategy trades breakouts from the New York opening range (9:30-9:45 AM NY time) on intraday timeframes, designed for scalping and day trading.
Setup Requirements
Timeframe: Works on any timeframe under 15 minutes (1m, 2m, 3m, 5m, 10m)
Session: New York market hours
Range Period: 9:30-9:45 AM NY time (15-minute opening range)
Entry Rules
Long Entries:
Wait for a candle to close above the opening range high
Enter long on the next candle (before 12:00 PM NY time)
Must be above moving average if using MA-based take profit
Short Entries:
Wait for a candle to close below the opening range low
Enter short on the next candle (before 12:00 PM NY time)
Must be below moving average if using MA-based take profit
Risk Management
Stop Loss:
Long trades: Opening range low
Short trades: Opening range high
Take Profit Options:
Fixed Risk Reward: 1.5x the range size (customizable ratio)
Moving Average: Exit when price crosses back through MA
Both: Whichever comes first
Key Features
Trade Direction Options:
Long Only
Short Only
Both directions
Moving Average Filter:
Prevents entries that would immediately hit stop loss
Uses EMA/SMA/WMA/VWMA with customizable length
Acts as dynamic support/resistance
Time Restrictions:
No entries after 12:00 PM NY time (customizable cutoff)
One trade per direction per day
Daily reset of all variables
Visual Elements
Red/green lines showing opening range
Purple line for moving average
Entry and breakout signals with shapes
Take profit and stop loss levels plotted
Information table with current status
Strategy Logic Flow
Morning: Capture 9:30-9:45 range high/low
Wait: Monitor for breakout (previous candle close outside range)
Filter: Check MA condition if using MA-based exits
Enter: Trade on next candle after breakout
Manage: Exit at fixed TP, MA cross, or stop loss
Reset: Start fresh next trading day
This is a momentum-based breakout strategy that capitalizes on early market volatility while using the opening range as natural support/resistance levels.

Enhanced Range Filter Strategy with ATR TP/SLBuilt by Omotola
## **Enhanced Range Filter Strategy: A Comprehensive Overview**
### **1. Introduction**
The **Enhanced Range Filter Strategy** is a powerful technical trading system designed to identify high-probability trading opportunities while filtering out market noise. It utilizes **range-based trend filtering**, **momentum confirmation**, and **volatility-based risk management** to generate precise entry and exit signals. This strategy is particularly useful for traders who aim to capitalize on trend-following setups while avoiding choppy, ranging market conditions.
---
### **2. Key Components of the Strategy**
#### **A. Range Filter (Trend Determination)**
- The **Range Filter** smooths price fluctuations and helps identify clear trends.
- It calculates an **adjusted price range** based on a **sampling period** and a **multiplier**, ensuring a dynamic trend-following approach.
- **Uptrends:** When the current price is above the range filter and the trend is strengthening.
- **Downtrends:** When the price falls below the range filter and momentum confirms the move.
#### **B. RSI (Relative Strength Index) as Momentum Confirmation**
- RSI is used to **filter out weak trades** and prevent entries during overbought/oversold conditions.
- **Buy Signals:** RSI is above a certain threshold (e.g., 50) in an uptrend.
- **Sell Signals:** RSI is below a certain threshold (e.g., 50) in a downtrend.
#### **C. ADX (Average Directional Index) for Trend Strength Confirmation**
- ADX ensures that trades are only taken when the trend has **sufficient strength**.
- Avoids trading in low-volatility, ranging markets.
- **Threshold (e.g., 25):** Only trade when ADX is above this value, indicating a strong trend.
#### **D. ATR (Average True Range) for Risk Management**
- **Stop Loss (SL):** Placed **one ATR below** (for long trades) or **one ATR above** (for short trades).
- **Take Profit (TP):** Set at a **3:1 reward-to-risk ratio**, using ATR to determine realistic price targets.
- Ensures volatility-adjusted risk management.
---
### **3. Entry and Exit Conditions**
#### **📈 Buy (Long) Entry Conditions:**
1. **Price is above the Range Filter** → Indicates an uptrend.
2. **Upward trend strength is positive** (confirmed via trend counter).
3. **RSI is above the buy threshold** (e.g., 50, to confirm momentum).
4. **ADX confirms trend strength** (e.g., above 25).
5. **Volatility is supportive** (using ATR analysis).
#### **📉 Sell (Short) Entry Conditions:**
1. **Price is below the Range Filter** → Indicates a downtrend.
2. **Downward trend strength is positive** (confirmed via trend counter).
3. **RSI is below the sell threshold** (e.g., 50, to confirm momentum).
4. **ADX confirms trend strength** (e.g., above 25).
5. **Volatility is supportive** (using ATR analysis).
#### **🚪 Exit Conditions:**
- **Stop Loss (SL):**
- **Long Trades:** 1 ATR below entry price.
- **Short Trades:** 1 ATR above entry price.
- **Take Profit (TP):**
- Set at **3x the risk distance** to achieve a favorable risk-reward ratio.
- **Ranging Market Exit:**
- If ADX falls below the threshold, indicating a weakening trend.
---
### **4. Visualization & Alerts**
- **Colored range filter line** changes based on trend direction.
- **Buy and Sell signals** appear as labels on the chart.
- **Stop Loss and Take Profit levels** are plotted as dashed lines.
- **Gray background highlights ranging markets** where trading is avoided.
- **Alerts trigger on Buy, Sell, and Ranging Market conditions** for automation.
---
### **5. Advantages of the Enhanced Range Filter Strategy**
✅ **Trend-Following with Noise Reduction** → Helps avoid false signals by filtering out weak trends.
✅ **Momentum Confirmation with RSI & ADX** → Ensures that only strong, valid trades are executed.
✅ **Volatility-Based Risk Management** → ATR ensures adaptive stop loss and take profit placements.
✅ **Works on Multiple Timeframes** → Effective for day trading, swing trading, and scalping.
✅ **Visually Intuitive** → Clearly displays trade signals, SL/TP levels, and trend conditions.
---
### **6. Who Should Use This Strategy?**
✔ **Trend Traders** who want to enter trades with momentum confirmation.
✔ **Swing Traders** looking for medium-term opportunities with a solid risk-reward ratio.
✔ **Scalpers** who need precise entries and exits to minimize false signals.
✔ **Algorithmic Traders** using alerts for automated execution.
---
### **7. Conclusion**
The **Enhanced Range Filter Strategy** is a powerful trading tool that combines **trend-following techniques, momentum indicators, and risk management** into a structured, rule-based system. By leveraging **Range Filters, RSI, ADX, and ATR**, traders can improve trade accuracy, manage risk effectively, and filter out unfavorable market conditions.
This strategy is **ideal for traders looking for a systematic, disciplined approach** to capturing trends while **avoiding market noise and false breakouts**. 🚀

IU Opening range Breakout StrategyIU Opening Range Breakout Strategy
This Pine Script strategy is designed to capitalize on the breakout of the opening range, which is a popular trading approach. The strategy identifies the high and low prices of the opening session and takes trades based on price crossing these levels, with built-in risk management and trade limits for intraday trading.
Key Features:
1. Risk Management:
- Risk-to-Reward Ratio (RTR):
Set a customizable risk-to-reward ratio to calculate target prices based on stop-loss levels.
Default: 2:1
- Max Trades in a Day:
Specify the maximum number of trades allowed per day to avoid overtrading.
Default: 2 trades in a day.
- End-of-Day Close:
Automatically closes all open positions at a user-defined session end time to ensure no overnight exposure.
Default: 3:15 PM
2. Opening Range Identification
- Opening Range High and Low:
The script detects the high and low of the first trading session using Pine Script's session functions.
These levels are plotted as visual guides on the chart:
- High: Lime-colored circles.
- Low: Red-colored circles.
3. Trade Entry Logic
- Long Entry:
A long trade is triggered when the price closes above the opening range high.
- Entry condition: Crossover of the price above the opening range high.
-Short Entry:
A short trade is triggered when the price closes below the opening range low.
- Entry condition: Crossunder of the price below the opening range low.
Both entries are conditional on the absence of an existing position.
4. Stop Loss and Take Profit
- Long Position:
- Stop Loss: Previous candle's low.
- Take Profit: Calculated based on the RTR.
- **Short Position:**
- **Stop Loss:** Previous candle's high.
- **Take Profit:** Calculated based on the RTR.
The strategy plots these levels for visual reference:
- Stop Loss: Red dashed lines.
- Take Profit: Green dashed lines.
5. Visual Enhancements
-Trade Level Highlighting:
The script dynamically shades the areas between the entry price and SL/TP levels:
- Red shading for the stop-loss region.
- Green shading for the take-profit region.
- Entry Price Line:
A silver-colored line marks the average entry price for active trades.
How to Use:
1.Input Configuration:
Adjust the Risk-to-Reward ratio, max trades per day, and session end time to suit your trading preferences.
2.Visual Cues:
Use the opening range high/low lines and shading to identify potential breakout opportunities.
3.Execution:
The strategy will automatically enter and exit trades based on the conditions. Review the plotted SL and TP levels to monitor the risk-reward setup.
Important Notes:
- This strategy is designed for intraday trading and works best in markets with high volatility during the opening session.
- Backtest the strategy on your preferred market and timeframe to ensure compatibility.
- Proper risk management and position sizing are essential when using this strategy in live markets.

Ruckard TradingLatinoThis strategy tries to mimic TradingLatino strategy.
The current implementation is beta.
Si hablas castellano o espanyol por favor consulta MENSAJE EN CASTELLANO más abajo.
It's aimed at BTCUSDT pair and 4h timeframe.
STRATEGY DEFAULT SETTINGS EXPLANATION
max_bars_back=5000 : This is a random number of bars so that the strategy test lasts for one or two years
calc_on_order_fills=false : To wait for the 4h closing is too much. Try to check if it's worth entering a position after closing one. I finally decided not to recheck if it's worth entering after an order is closed. So it is false.
calc_on_every_tick=false
pyramiding=0 : We only want one entry allowed in the same direction. And we don't want the order to scale by error.
initial_capital=1000 : These are 1000 USDT. By using 1% maximum loss per trade and 7% as a default stop loss by using 1000 USDT at 12000 USDT per BTC price you would entry with around 142 USDT which are converted into: 0.010 BTC . The maximum number of decimal for contracts on this BTCUSDT market is 3 decimals. E.g. the minimum might be: 0.001 BTC . So, this minimal 1000 amount ensures us not to entry with less than 0.001 entries which might have happened when using 100 USDT as an initial capital.
slippage=1 : Binance BTCUSDT mintick is: 0.01. Binance slippage: 0.1 % (Let's assume). TV has an integer slippage. It does not have a percentage based slippage. If we assume a 1000 initial capital, the recommended equity is 142 which at 11996 USDT per BTC price means: 0.011 BTC. The 0.1% slippage of: 0.011 BTC would be: 0.000011 . This is way smaller than the mintick. So our slippage is going to be 1. E.g. 1 (slippage) * 0.01 (mintick)
commission_type=strategy.commission.percent and commission_value=0.1 : According to: binance . com / en / fee / schedule in VIP 0 level both maker and taker fees are: 0.1 %.
BACKGROUND
Jaime Merino is a well known Youtuber focused on crypto trading
His channel TradingLatino
features monday to friday videos where he explains his strategy.
JAIME MERINO STANCE ON BOTS
Jaime Merino stance on bots (taken from memory out of a 2020 June video from him):
'~
You know. They can program you a bot and it might work.
But, there are some special situations that the bot would not be able to handle.
And, I, as a human, I would handle it. And the bot wouldn't do it.
~'
My long term target with this strategy script is add as many
special situations as I can to the script
so that it can match Jaime Merino behaviour even in non normal circumstances.
My alternate target is learn Pine script
and enjoy programming with it.
WARNING
This script might be bigger than other TradingView scripts.
However, please, do not be confused because the current status is beta.
This script has not been tested with real money.
This is NOT an official strategy from Jaime Merino.
This is NOT an official strategy from TradingLatino . net .
HOW IT WORKS
It basically uses ADX slope and LazyBear's Squeeze Momentum Indicator
to make its buy and sell decisions.
Fast paced EMA being bigger than slow paced EMA
(on higher timeframe) advices going long.
Fast paced EMA being smaller than slow paced EMA
(on higher timeframe) advices going short.
It finally add many substrats that TradingLatino uses.
SETTINGS
__ SETTINGS - Basics
____ SETTINGS - Basics - ADX
(ADX) Smoothing {14}
(ADX) DI Length {14}
(ADX) key level {23}
____ SETTINGS - Basics - LazyBear Squeeze Momentum
(SQZMOM) BB Length {20}
(SQZMOM) BB MultFactor {2.0}
(SQZMOM) KC Length {20}
(SQZMOM) KC MultFactor {1.5}
(SQZMOM) Use TrueRange (KC) {True}
____ SETTINGS - Basics - EMAs
(EMAS) EMA10 - Length {10}
(EMAS) EMA10 - Source {close}
(EMAS) EMA55 - Length {55}
(EMAS) EMA55 - Source {close}
____ SETTINGS - Volume Profile
Lowest and highest VPoC from last three days
is used to know if an entry has a support
VPVR of last 100 4h bars
is also taken into account
(VP) Use number of bars (not VP timeframe): Uses 'Number of bars {100}' setting instead of 'Volume Profile timeframe' setting for calculating session VPoC
(VP) Show tick difference from current price {False}: BETA . Might be useful for actions some day.
(VP) Number of bars {100}: If 'Use number of bars (not VP timeframe)' is turned on this setting is used to calculate session VPoC.
(VP) Volume Profile timeframe {1 day}: If 'Use number of bars (not VP timeframe)' is turned off this setting is used to calculate session VPoC.
(VP) Row width multiplier {0.6}: Adjust how the extra Volume Profile bars are shown in the chart.
(VP) Resistances prices number of decimal digits : Round Volume Profile bars label numbers so that they don't have so many decimals.
(VP) Number of bars for bottom VPOC {18}: 18 bars equals 3 days in suggested timeframe of 4 hours. It's used to calculate lowest session VPoC from previous three days. It's also used as a top VPOC for sells.
(VP) Ignore VPOC bottom advice on long {False}: If turned on it ignores bottom VPOC (or top VPOC on sells) when evaluating if a buy entry is worth it.
(VP) Number of bars for VPVR VPOC {100}: Number of bars to calculate the VPVR VPoC. We use 100 as Jaime once used. When the price bounces back to the EMA55 it might just bounce to this VPVR VPoC if its price it's lower than the EMA55 (Sells have inverse algorithm).
____ SETTINGS - ADX Slope
ADX Slope
help us to understand if ADX
has a positive slope, negative slope
or it is rather still.
(ADXSLOPE) ADX cut {23}: If ADX value is greater than this cut (23) then ADX has strength
(ADXSLOPE) ADX minimum steepness entry {45}: ADX slope needs to be 45 degrees to be considered as a positive one.
(ADXSLOPE) ADX minimum steepness exit {45}: ADX slope needs to be -45 degrees to be considered as a negative one.
(ADXSLOPE) ADX steepness periods {3}: In order to avoid false detection the slope is calculated along 3 periods.
____ SETTINGS - Next to EMA55
(NEXTEMA55) EMA10 to EMA55 bounce back percentage {80}: EMA10 might bounce back to EMA55 or maybe to 80% of its complete way to EMA55
(NEXTEMA55) Next to EMA55 percentage {15}: How much next to the EMA55 you need to be to consider it's going to bounce back upwards again.
____ SETTINGS - Stop Loss and Take Profit
You can set a default stop loss or a default take profit.
(STOPTAKE) Stop Loss % {7.0}
(STOPTAKE) Take Profit % {2.0}
____ SETTINGS - Trailing Take Profit
You can customize the default trailing take profit values
(TRAILING) Trailing Take Profit (%) {1.0}: Trailing take profit offset in percentage
(TRAILING) Trailing Take Profit Trigger (%) {2.0}: When 2.0% of benefit is reached then activate the trailing take profit.
____ SETTINGS - MAIN TURN ON/OFF OPTIONS
(EMAS) Ignore advice based on emas {false}.
(EMAS) Ignore advice based on emas (On closing long signal) {False}: Ignore advice based on emas but only when deciding to close a buy entry.
(SQZMOM) Ignore advice based on SQZMOM {false}: Ignores advice based on SQZMOM indicator.
(ADXSLOPE) Ignore advice based on ADX positive slope {false}
(ADXSLOPE) Ignore advice based on ADX cut (23) {true}
(STOPTAKE) Take Profit? {false}: Enables simple Take Profit.
(STOPTAKE) Stop Loss? {True}: Enables simple Stop Loss.
(TRAILING) Enable Trailing Take Profit (%) {True}: Enables Trailing Take Profit.
____ SETTINGS - Strategy mode
(STRAT) Type Strategy: 'Long and Short', 'Long Only' or 'Short Only'. Default: 'Long and Short'.
____ SETTINGS - Risk Management
(RISKM) Risk Management Type: 'Safe', 'Somewhat safe compound' or 'Unsafe compound'. ' Safe ': Calculations are always done with the initial capital (1000) in mind. The maximum losses per trade/day/week/month are taken into account. ' Somewhat safe compound ': Calculations are done with initial capital (1000) or a higher capital if it increases. The maximum losses per trade/day/week/month are taken into account. ' Unsafe compound ': In each order all the current capital is gambled and only the default stop loss per order is taken into account. That means that the maximum losses per trade/day/week/month are not taken into account. Default : 'Somewhat safe compound'.
(RISKM) Maximum loss per trade % {1.0}.
(RISKM) Maximum loss per day % {6.0}.
(RISKM) Maximum loss per week % {8.0}.
(RISKM) Maximum loss per month % {10.0}.
____ SETTINGS - Decimals
(DECIMAL) Maximum number of decimal for contracts {3}: How small (3 decimals means 0.001) an entry position might be in your exchange.
EXTRA 1 - PRICE IS IN RANGE indicator
(PRANGE) Print price is in range {False}: Enable a bottom label that indicates if the price is in range or not.
(PRANGE) Price range periods {5}: How many previous periods are used to calculate the medians
(PRANGE) Price range maximum desviation (%) {0.6} ( > 0 ): Maximum positive desviation for range detection
(PRANGE) Price range minimum desviation (%) {0.6} ( > 0 ): Mininum negative desviation for range detection
EXTRA 2 - SQUEEZE MOMENTUM Desviation indicator
(SQZDIVER) Show degrees {False}: Show degrees of each Squeeze Momentum Divergence lines to the x-axis.
(SQZDIVER) Show desviation labels {False}: Whether to show or not desviation labels for the Squeeze Momentum Divergences.
(SQZDIVER) Show desviation lines {False}: Whether to show or not desviation lines for the Squeeze Momentum Divergences.
EXTRA 3 - VOLUME PROFILE indicator
WARNING: This indicator works not on current bar but on previous bar. So in the worst case it might be VP from 4 hours ago. Don't worry, inside the strategy calculus the correct values are used. It's just that I cannot show the most recent one in the chart.
(VP) Print recent profile {False}: Show Volume Profile indicator
(VP) Avoid label price overlaps {False}: Avoid label prices to overlap on the chart.
EXTRA 4 - ZIGNALY SUPPORT
(ZIG) Zignaly Alert Type {Email}: 'Email', 'Webhook'. ' Email ': Prepare alert_message variable content to be compatible with zignaly expected email content format. ' Webhook ': Prepare alert_message variable content to be compatible with zignaly expected json content format.
EXTRA 5 - DEBUG
(DEBUG) Enable debug on order comments {False}: If set to true it prepares the order message to match the alert_message variable. It makes easier to debug what would have been sent by email or webhook on each of the times an order is triggered.
HOW TO USE THIS STRATEGY
BOT MODE: This is the default setting.
PROPER VOLUME PROFILE VIEWING: Click on this strategy settings. Properties tab. Make sure Recalculate 'each time the order was run' is turned off.
NEWBIE USER: (Check PROPER VOLUME PROFILE VIEWING above!) You might want to turn on the 'Print recent profile {False}' setting. Alternatively you can use my alternate realtime study: 'Resistances and supports based on simplified Volume Profile' but, be aware, it might consume one indicator.
ADVANCED USER 1: Turn on the 'Print price is in range {False}' setting and help us to debug this subindicator. Also help us to figure out how to include this value in the strategy.
ADVANCED USER 2: Turn on the all the (SQZDIVER) settings and help us to figure out how to include this value in the strategy.
ADVANCED USER 3: (Check PROPER VOLUME PROFILE VIEWING above!) Turn on the 'Print recent profile {False}' setting and report any problem with it.
JAIME MERINO: Just use the indicator as it comes by default. It should only show BUY signals, SELL signals and their associated closing signals. From time to time you might want to check 'ADVANCED USER 2' instructions to check that there's actually a divergence. Check also 'ADVANCED USER 1' instructions for your amusement.
EXTRA ADVICE
It's advised that you use this strategy in addition to these two other indicators:
* Squeeze Momentum Indicator
* ADX
so that your chart matches as close as possible to TradingLatino chart.
ZIGNALY INTEGRATION
This strategy supports Zignaly email integration by default. It also supports Zignaly Webhook integration.
ZIGNALY INTEGRATION - Email integration example
What you would write in your alert message:
||{{strategy.order.alert_message}}||key=MYSECRETKEY||
ZIGNALY INTEGRATION - Webhook integration example
What you would write in your alert message:
{ {{strategy.order.alert_message}} , "key" : "MYSECRETKEY" }
CREDITS
I have reused and adapted some code from
'Directional Movement Index + ADX & Keylevel Support' study
which it's from TradingView console user.
I have reused and adapted some code from
'3ema' study
which it's from TradingView hunganhnguyen1193 user.
I have reused and adapted some code from
'Squeeze Momentum Indicator ' study
which it's from TradingView LazyBear user.
I have reused and adapted some code from
'Strategy Tester EMA-SMA-RSI-MACD' study
which it's from TradingView fikira user.
I have reused and adapted some code from
'Support Resistance MTF' study
which it's from TradingView LonesomeTheBlue user.
I have reused and adapted some code from
'TF Segmented Linear Regression' study
which it's from TradingView alexgrover user.
I have reused and adapted some code from
"Poor man's volume profile" study
which it's from TradingView IldarAkhmetgaleev user.
FEEDBACK
Please check the strategy source code for more detailed information
where, among others, I explain all of the substrats
and if they are implemented or not.
Q1. Did I understand wrong any of the Jaime substrats (which I have implemented)?
Q2. The strategy yields quite profit when we should long (EMA10 from 1d timeframe is higher than EMA55 from 1d timeframe.
Why the strategy yields much less profit when we should short (EMA10 from 1d timeframe is lower than EMA55 from 1d timeframe)?
Any idea if you need to do something else rather than just reverse what Jaime does when longing?
FREQUENTLY ASKED QUESTIONS
FAQ1. Why are you giving this strategy for free?
TradingLatino and his fellow enthusiasts taught me this strategy. Now I'm giving back to them.
FAQ2. Seriously! Why are you giving this strategy for free?
I'm confident his strategy might be improved a lot. By keeping it to myself I would avoid other people contributions to improve it.
Now that everyone can contribute this is a win-win.
FAQ3. How can I connect this strategy to my Exchange account?
It seems that you can attach alerts to strategies.
You might want to combine it with a paying account which enable Webhook URLs to work.
I don't know how all of this works right now so I cannot give you advice on it.
You will have to do your own research on this subject. But, be careful. Automating trades, if not done properly,
might end on you automating losses.
FAQ4. I have just found that this strategy by default gives more than 3.97% of 'maximum series of losses'. That's unacceptable according to my risk management policy.
You might want to reduce default stop loss setting from 7% to something like 5% till you are ok with the 'maximum series of losses'.
FAQ5. Where can I learn more about your work on this strategy?
Check the source code. You might find unused strategies. Either because there's not a substantial increases on earnings. Or maybe because they have not been implemented yet.
FAQ6. How much leverage is applied in this strategy?
No leverage.
FAQ7. Any difference with original Jaime Merino strategy?
Most of the times Jaime defines an stop loss at the price entry. That's not the case here. The default stop loss is 7% (but, don't be confused it only means losing 1% of your investment thanks to risk management). There's also a trailing take profit that triggers at 2% profit with a 1% trailing.
FAQ8. Why this strategy return is so small?
The strategy should be improved a lot. And, well, backtesting in this platform is not guaranteed to return theoric results comparable to real-life returns. That's why I'm personally forward testing this strategy to verify it.
MENSAJE EN CASTELLANO
En primer lugar se agradece feedback para mejorar la estrategia.
Si eres un usuario avanzado y quieres colaborar en mejorar el script no dudes en comentar abajo.
Ten en cuenta que aunque toda esta descripción tenga que estar en inglés no es obligatorio que el comentario esté en inglés.
CHISTE - CASTELLANO
¡Pero Jaime!
¡400.000!
¡Tu da mun!

9:30 Range Break Entry SystemThis strategy identifies the opening range from 9:30-9:35 AM and enters a trade when price breaks above or below that range with confirmation (bullish/bearish candle, engulfing pattern, or no confirmation). You can choose "On Break" mode to enter immediately on the breakout, or "On Pullback" mode to wait for price to pullback into the range and then re-break for a better entry. The strategy takes only one trade per direction per day and provides visual markers showing when the range breaks and when entry conditions are met.

[iQ]PRO Quant GANN FOURIER VZO RANGE+🔮 PRO Quant GANN FOURIER VZO RANGE+
A Highly Adaptive and Proprietary Quantitative Strategy for Precision Market Analysis
This is the official description for the PRO Quant GANN FOURIER VZO RANGE+ strategy, a sophisticated, closed-source system engineered for high-level market engagement. This tool integrates multiple independent quantitative models into a single, cohesive Ensemble Signal, providing an edge through robust, multi-dimensional analysis.
🔬 Core Quantitative Architecture
The strategy is built on the convergence of several powerful, state-of-the-art analytical components, each designed to capture a distinct facet of market dynamics:
Proprietary Gann Swing Models: We utilize a dual-approach to Gann analysis.
Array–Based Gann Swing: A proprietary implementation leveraging advanced Pine Script array structures for dynamic tracking of significant price pivots and structure shifts. This component continuously monitors market momentum and potential areas of interest, including proprietary "ChoCh" (Change of Character) detection—a highly sensitive mechanism for identifying early trend inflection points. This core mechanism provides a high-frequency structural view of the market.
Composite Multi-Timeframe Gann Swing: This model synthesizes traditional swing analysis across two distinct timeframes to filter noise and confirm structural trends, ensuring the system operates with conviction against the backdrop of a higher-level market perspective.
VZO/VSA (Volume Zone Oscillator/Volume Spread Analysis) Hybrid: This module is engineered to analyze the crucial relationship between price momentum and volume flow, specifically using a Volume Zone Oscillator (VZO) approach integrated with Volume Spread Analysis (VSA) principles. It is designed to identify underlying accumulation and distribution activity with a unique dual-timeframe composite for enhanced signal quality.
Trend and Statistical Component: A dedicated module assesses the statistical bias and slope of the aggregated market movement, providing a crucial check against overextension and ensuring alignment with the underlying price regression trajectory.
⚖️ The Ensemble Signal and Trade Logic
All independent signals—Gann Array, Composite Gann, VZO/VSA, and Trend—are processed through a Weighted Ensemble Logic.
Weighted Voting: Each component's signal is assigned a customizable weight (input parameters wGannComp, wVZO, etc.) to reflect its relative importance in the current market environment.
Threshold-Based Decision: The weighted average of all signals results in an Ensemble Signal. Only when this signal decisively exceeds a customizable Signal Threshold does the system generate a Final Signal for trade execution. This rigor is key to filtering lower-conviction setups.
The strategy's execution logic is designed to open and close positions dynamically based on the Final Signal, maintaining maximum control with a default position size of 15% of equity per trade. A dedicated toggle allows for aggressive position management to "stay in" trades longer under specific conditions identified by the proprietary swing models.
⚙️ Strategic Advantages and Exclusivity
This strategy is marked by its extreme adaptability, incorporating features such as:
Higher Timeframe Synthesis: Crucial components utilize multi-timeframe confirmation to validate signals.
Price Smoothing: An optional, light-touch EMA smoothing is applied to the input price data to enhance signal clarity and reduce spurious whipsaws.
Due to the proprietary nature and complexity of the underlying swing detection algorithms and array management, the source code is kept strictly closed-source. This ensures the continued analytical edge and integrity of the model for our exclusive community.
OG INDICATOR TO MESS AROUND WITH, USE RIGHT, AND ENJOY. PRO STRATS COMING TOO
NFA.
MKNiQ

15min ACTIVE Rangeevery 9:30 am New York Time, Gold prints a high Volume 15 min Candle: "ACTIVE RANGE"
Every time gold prints a candle in which it has a higher candle than the current "ACTIVE RANGE" there would be a new "ACTIVE RANGE"
Breakout and retest the ACTIVE Range
Tristan's Box: Pre-Market Range Breakout + RetestMarket Context:
This is designed for U.S. stocks, focusing on pre-market price action (4:00–9:30 AM ET) to identify key support/resistance levels before the regular session opens.
Built for 1 min and 5 min timelines, and is intended for day trading / scalping.
Core Idea:
Pre-market range (high/low) often acts as a magnet for price during regular hours.
The first breakout outside this range signals potential strong momentum in that direction.
Retest of the breakout level confirms whether the breakout is valid, avoiding false moves.
Step-by-Step Logic:
Pre-Market Range Identification:
Track high and low from 4:00–9:30 AM ET.
Draw a box spanning this range for visual reference and calculation.
Breakout Detection:
When the first candle closes above the pre-market high → long breakout.
When the first candle closes below the pre-market low → short breakout.
The first breakout candle is highlighted with a “YOLO” label for visual confirmation.
Retest Confirmation:
Identify the first candle whose wick touches the pre-market box (high touches top for short, low touches bottom for long).
Wait for the next candle: if it closes outside the box, it confirms the breakout.
Entry Execution:
Long entry: on the confirming candle after a wick-touch above the pre-market high.
Short entry: on the confirming candle after a wick-touch below the pre-market low.
Only the first valid entry per direction per day is taken.
Visuals & Alerts:
Box represents pre-market high/low.
Top/bottom box border lines show the pre-market high / low levels cleanly.
BUY/SELL markers are pinned to the confirming candle.
Added a "YOLO" marker on breakout candle.
Alert conditions trigger when a breakout is confirmed by the retest.
Strategy Type:
Momentum breakout strategy with confirmation retest.
Combines pre-market structure and risk-managed entries.
Designed to filter false breakouts by requiring confirmation on the candle after the wick-touch.
In short, it’s a pre-market breakout momentum strategy: it uses the pre-market high/low as reference, waits for a breakout, and then enters only after a confirmation retest, reducing the chance of entering on a false spike.
Always use good risk management.

ORB FVG Strategy with telegram V6.1Summary
Intraday NY-session strategy with Opening-Range bias (09:30–10:00 NY), FVG entries (incl. optional HTF FVGs), momentum filters (LinReg slope & Williams %R), limit entries inside the zone, SL from FVG anchors, and TP via risk-reward. Includes session/trade caps, pending-order handling, auto-cancel at NY time, and optional Telegram webhook alerts.
Feature Overview
Opening Range & Bias: OR high/low built until 10:00 NY, then frozen. Bias from confirmed 5-minute candles (modes: Body Close, Complete Candle, Wick Only).
FVG Scanner: Bull/bear FVGs (choose wick or body gaps), min size, auto-extend, mitigation cleanup (touch or 50%).
HTF FVG (10 min): Optional – displayed after ≥ 2 consecutive FVGs; cleans up on touch/50%.
Entry/SL/TP: Entry at X% fill (+extra %) within the FVG; SL from FVG candle / FVG-1 / FVG-2 (smart) + buffer; TP via risk-reward.
Momentum Filters: LinReg slope (MLL) + Williams %R with threshold/slope filters (individually switchable).
Intrabar Mode (optional): Immediate Open/intrabar entry on touch (calc_on_every_tick=true) or classic bar-close confirmation (toggle).
Trade Management: Max trades/day, pending cap, auto-cancel at defined NY time, pause after first winner (optional).
Telegram: Programmatic alerts via alert() with Telegram-ready JSON payload.
Parameters (compact)
Group Parameter Purpose
Sessions Trading session, Opening range Trading/OR window (internal NY TZ)
Bias Body Close / Complete Candle / Wick Only Bias confirmation relative to OR
Liquidity LQ session, lookback days, cleanup points, show lines Intraday liquidity marks & cleanup
FVG Min size, wick/body, colors, extend, cleanup Detection/visualization & validity
HTF FVG (10 m) Toggle/Display/Colors Conservative HTF filter/POI
Entry Fill %, extra %, max pending, validity (bars), cancel time, intrabar switch Execution timing, order caps, auto-cancel
Stop Loss Source: Candle / -1 / -2 (smart), buffer (points) SL anchor from FVG history + safety offset
Take Profit Risk-Reward (R:R) Target calculation
Momentum LinReg length/min slope, W%R length/min slope, HUD Trend/momentum filters
Trade Mgmt Max trades/day, pause after win Daily cap / risk cooldown
Telegram Enabled, tester, interval, channel id Webhook output & test signals
Debug & Info Debug panel, rejection reasons On-chart status/diagnostics
Alerts / Telegram Webhook (Quick Setup)
Create an alert with Condition: “Any alert() function call”.
Webhook URL: api.telegram.org
Message: leave empty (the strategy provides JSON via alert() – includes chat_id, parse_mode, text).
Ensure your bot can post to the channel and the chat_id is valid.
Repainting & Backtesting
HTF series via lookahead_off on closed higher-TF candles; FVG detection on confirmed bars (barstate.isconfirmed).
Intrabar/Open entries allow earlier fills but typically cause differences between backtest and live (tick granularity/slippage, limit touch on bar OHLC).
For reproducibility, trade without intrabar (bar-close only).
Limitations
No full tick simulation; limit fills rely on bar OHLC.
Liquidity “cleanup” is rule-based (not an orderbook).
Telegram depends on correct webhook configuration.
Tips
Timeframes: M5 (intrabar)
Start with modest R:R (e.g., 1.5–2.0) and tune filters carefully.
Disclaimer
No financial advice. Past results do not guarantee future performance. Use responsibly and follow Public Library rules.
License / Credits
© 2025 Lean Trading (Lennart Pomreinke). License: MPL-2.0.
Changelog
V06.1: Intrabar switch (Open/intrabar vs bar-close), Telegram sanitizer & tester, HTF-FVG cleanup, refined pending/cancel logic, debug panel (status & rejections).

CP Strat ORBnew york opening range breakout and retest allows you to enter a trade with a better clarity if the price comes back and retest the range

Modular Range-Trading Strategy (V9.2)# 模块化震荡行情策略 (V9.2)
# Modular Range-Trading Strategy (V9.2)
## 策略简介 | Strategy Overview
该策略基于布林带 (Bollinger Bands)、RSI、MACD、ADX 等经典指标的组合,通过多逻辑模块化结构识别震荡区间的价格反转机会,支持多空双向操作,并在相同逻辑下允许智能加仓,适用于震荡市场的回测和研究。
This strategy combines classic indicators such as Bollinger Bands, RSI, MACD, and ADX to identify price reversal opportunities within ranging markets. It features a modular multi-logic structure, allowing both long and short trades with intelligent pyramiding under the same logic. It is designed for backtesting and research in range-bound conditions.
---
## 功能特点 | Key Features
- **多逻辑结构**:支持多套震荡逻辑(动能确认均值回归、布林带极限反转等)。
- **加仓与仓位互斥**:同逻辑下可智能加仓,不同逻辑间自动互斥,避免冲突。
- **回测可调时间范围**:可自定义回测起止时间,精准评估策略表现。
- **指标可视化**:布林带、RSI、MACD 及动态 ATR 止损线实时绘图。
- **K线收盘确认信号**:通过 `barstate.isconfirmed` 控制信号,避免未收盘的虚假信号。
- **Multi-logic structure**: Supports multiple range-trading logics (e.g., momentum-based mean reversion, Bollinger Band reversals).
- **Pyramiding with mutual exclusion**: Allows intelligent pyramiding within the same logic while preventing conflicts between different logics.
- **Adjustable backtesting range**: Customizable start and end dates for accurate performance evaluation.
- **Visual indicators**: Real-time plotting of Bollinger Bands, RSI, MACD, and dynamic ATR stop lines.
- **Close-bar confirmation**: Uses `barstate.isconfirmed` to avoid false signals before bar close.
---
## 使用说明 | Usage
1. 将该脚本添加到 TradingView 图表。
2. 在参数中设置回测时间段和指标参数。
3. 仅用于学习与策略研究,请勿直接用于实盘交易。
1. Add this script to your TradingView chart.
2. Configure backtesting dates and indicator parameters as needed.
3. For educational and research purposes only. **Not for live trading.**
---
## ⚠️ 免责声明 | Disclaimer
本策略仅供学习和研究使用,不构成任何形式的投资建议。
作者不参与任何实盘交易、资金管理或收益分成,也不保证策略盈利能力。
严禁将本脚本用于任何非法集资、私募募资或与虚拟货币相关的金融违法活动。
使用本策略即表示您自行承担所有风险与法律责任。
This strategy is for educational and research purposes only and does not constitute investment advice.
The author does not participate in live trading, asset management, or profit sharing, nor guarantee profitability.
The use of this script in illegal fundraising, private placements, or cryptocurrency-related financial activities is strictly prohibited.
By using this strategy, you accept all risks and legal responsibilities.
---

Wyckoff Range StrategyThe Wyckoff Range Strategy is a trading strategy that aims to identify potential accumulation and distribution phases in the market using the principles of Wyckoff analysis. It also incorporates the detection of spring and upthrust patterns.
Here's a step-by-step explanation of how to use this strategy:
Understanding Accumulation and Distribution Phases:
Accumulation Phase: This is a period where smart money (large institutional traders) accumulates a particular asset at lower prices. It is characterized by a sideways or consolidating price action.
Distribution Phase: This is a period where smart money distributes or sells a particular asset at higher prices. It is also characterized by a sideways or consolidating price action.
Input Variables:
crossOverLength: This variable determines the length of the moving average crossover used to identify accumulation and distribution phases. You can adjust this value based on the market you are trading and the time frame you are analyzing.
stopPercentage: This variable determines the percentage used to calculate the stop loss level. It helps you define a predefined level at which you would exit a trade if the price moves against your position.
Strategy Conditions:
Enter Long: The strategy looks for a crossover of the close price above the SMA of the close price with a length of crossOverLength and a crossover of the low price above the SMA of the low price with a length of 20. This combination suggests the start of an accumulation phase and a potential buying opportunity.
Exit Long: The strategy looks for a crossunder of the close price below the SMA of the close price with a length of crossOverLength or a crossunder of the high price below the SMA of the high price with a length of 20. This combination suggests the end of an accumulation phase and a potential exit signal for long positions.
Enter Short: The strategy looks for a crossunder of the close price below the SMA of the close price with a length of crossOverLength and a crossunder of the high price below the SMA of the high price with a length of 20. This combination suggests the start of a distribution phase and a potential selling opportunity.
Exit Short: The strategy looks for a crossover of the close price above the SMA of the close price with a length of crossOverLength or a crossover of the low price above the SMA of the low price with a length of 20. This combination suggests the end of a distribution phase and a potential exit signal for short positions.
Stop Loss:
The strategy sets a stop loss level for both long and short positions. The stop loss level is calculated based on the stopPercentage variable, which represents the percentage of the current close price. If the price reaches the stop loss level, the strategy will automatically exit the position.
Plotting Wyckoff Schematics:
The strategy plots different shapes on the chart to indicate the identified phases and patterns. Green and red labels indicate the accumulation and distribution phases, respectively. Blue triangles indicate spring patterns, and orange triangles indicate upthrust patterns.
To use this strategy, you can follow these steps:
Jim Forte — Anatomy of a Trading Range
robertbrain.com/Bull...+a+Trading+Range.pdf

B.Bands | Augmented | Intra-range | Long-OnlyHere you have the essential trading engine based on Bollinger Bands .
The idea behind is to trade the intra-range of the bands.
How is going to work?
Define which Bollinger Bands we want to use. Classic Bollinger Bands or Augmented Bollinger Bands . Without selecting, the algorithm doesn't show a strategy.
Define the length of the Moving Average and the Standard Deviation by default the classic 20-2.
Define the Bollinger Bands Spread Max Range (Upper-Lower) to be able to determine wheter or not you're in a price range or potential breakout.
Define data source to trigger exit and entry points.
Define profit based on Middle Band or Opposite Band.
Define Stop Loss % and activate Trailing Stop if desired with the percentage required.
Determine if you want to sell only on profit after triggering the entry signal. * Note Stop Loss remains activated.
Choose a date range if you want to study a specific period.
Bear in mind, this is the essential trading engine, open for you to test, try and improve under your requirements. You can determinate when is the ideal market to implement it based on many other indicators. Maybe you wish to change the stop loss settings for ATR, previous low, etc. Totally up to you.
Note the script comes with initial capital, fee % and slippage by deault. This may change for your assets. Make sure you define it in advance.
NOTE: If you trade assets such BTC, you must update the initial capital. By default 5000 (USD) The script doesn't support fraction trading such 0.01BTC.
Will be updated on next version.
Feel free to get in touch if you've got any question.

Date Range DemonstrationThis is a simple strategy that demonstrates how to easily incorporate a date range into a strategy. This allows you to limit your backtesting to a specific range of dates, which is vital if you want to compare different time frames.
To use:
Copy the code block between the '////' lines into your strategy.
Add the variable 'inDateRange' to your entry and/or exit strategy conditions.

Average True Range StrategyAverage True Range Strategy by Elec
Average True Range Trailing Stops Strategy
Average True Range Strategy
Typically, the Average True Range (ATR) is based on 14 periods and can be calculated on an intraday, daily, weekly or monthly basis. For this example, the ATR will be based on daily data. Because there must be a beginning, the first TR value is simply the High minus the Low, and the first 14-day ATR is the average of the daily TR values for the last 14 days. After that, Wilder sought to smooth the data by incorporating the previous period's ATR value.
Current ATR = / 14
- Multiply the previous 14-day ATR by 13.
- Add the most recent day's TR value.
- Divide the total by 14

Narrow Range + Inside Day, Short Only Strategy (by ChartArt)This short only strategy determines when there is both a NR7 (narrow range 7, a trading day in which the range is narrower than any of the previous six days), plus a inside day (high of the current day is lower than the high of the previous day and the low of the current day is higher than the low of the previous day) both on the same trading day and enters a short trade when the close is lower than the open and the slope of the simple moving average is downwards, too.
The strategy closes the short trade next time the daily close is lower than the open in any of the next trading days. In addition the NR7ID can be colored (the color is red when the close is lower that day than the open, else the color is green) and the SMA can be drawn with a color based on the direction of the SMA slope. To fine-tune the strategy it is highly recommended to change the period length of the SMA, which determines if the measured SMA slope is downwards or not. In this version 1.1 I made a small change to long only version. By default only the bearish NR7ID days are colored.
Inspiration:
How to trade NR7 and Inside Day Pattern
paststat.com
Code credit:
NR7 indicator script from Tradingview user Lazybear:
pastebin.com
P.S. You can find the 'long only' version of this trading strategy here:

ZH1/5-Min Opening Range Breakout Strategy with Market Biasx.com
"ZH1/5-Min Opening Range Breakout Strategy with Market Bias"

Monthly First-Day Range Breakout (Long-Only)Monthly First-Day Range Breakout (Long-Only)
When the Close is above the first candle of the month - Long
Wait for the First Day Close
