The Only EURUSD Trading Strategy You Need - KaspricciThe Only EURUSD Trading Strategy You Need
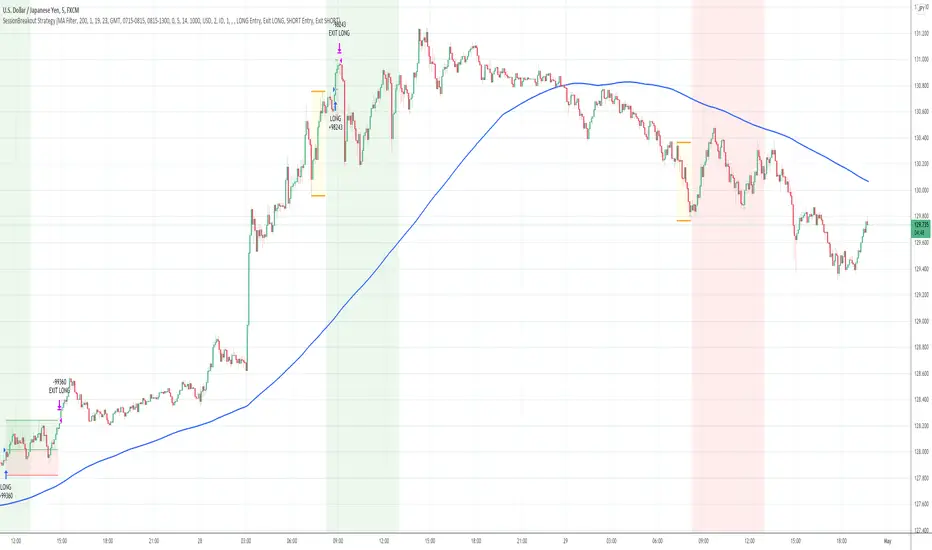
I got the idea to this strategy from a youtube video uploaded by Trade Beta. It is designed to capture the early market move of major forex pair EURUSD at beginning of New York Stock Exchange (13:30 GMT). Trade Beta tested his strategy on the 5 minute chart. I have set all parameters to same values as shown in the video.
The strategy creates two pending orders at the recent swing high and low. Once the first pending order entered, the remaining one is cancelled. Latest at the end of market session all pending orders are cancelled and all open trade are closed as well.
In rare case that price at session opening is above swing high, only a pending sell stop order is created at swing high price. And in case price is below swing low, a pending buy stop order is created.
Settings
Trading Time - default: New York Stock Exchange opening hours. Pending orders are created at the close of the first candle within the session.
Swing High Source / Bars - default: High / 5 bars. Used to find the latest swing high within a range of 5 bars left and right. Price is used for buy stop order.
Swing Low Source / Bars - default: Low / 5 bars. Used to find the latest swing low within a range of 5 bars left and right. Price is used for sell stop order.
Stop Loss Type - default: ATR. You can switch between stop loss calculation based on Average True Range value or fixed value.
ATR Length / Factor / TP Ratio - default: 14 / 2.0 / 2.0. Used to calculate the Stop Loss as ATR * Factor and Take Profit as Stop Loss * TP Ratio.
FIX Stop Loss / Take Profit - default: 10 pips / 20 pips. In case you select Stop Loss Type = FIX, these value swill be used.
This strategy is for educational purposes only! It is not meant to be a financial advice.
Wyszukaj w skryptach "range"

Rob Booker - ADX Breakout updated to pinescript V5Rob Booker - ADX Breakout. The strategy remains unchanged but the code has been updated to pinescript V5. This enables compatibility with all new Tradingview features. Additonally, indicators have been made more easily visible, default cash settings as well as input descriptions have been added.
Rob Booker - ADX Breakout: (Directly taken from the official Tradingview V1 version of the script)
Definition
Rob Booker’s Average Directional Index (ADX) Breakout is a trend strength indicator that affirms the belief that trading in the direction of a trend and continuing to follow its pull is more profitable for traders, while simultaneously reducing risk.
History
ADX was traditionally used and developed to determine a price’s trend strength. It is commonly known as a tool from the arsenal of Rob Booker, experienced entrepreneur and currency trader.
Calculations
Calculations for the ADX Breakout indicator are based on a moving average of price range expansion over a specific period of time. By default, the setting rests at 14 bars, this however is not mandatory, as other periods are routinely used for analysis as well.
Takeaways
The ADX line is used to measure and determine the strength of a trend, and so the direction of this line and its interpretation are crucial in a trader’s analysis. As the ADX line rises, a trend increases in strength and price moves in the trend’s direction. Similarly, if the ADX line is falling, a trend decreases in strength and price then enters a period of consolidation, or retracement.
Traditionally, the ADX is plotted on the chart as a single line that consists of values that range from 0-100. The line is non-directional, meaning that it always measures trend strength regardless of the position of a price’s trend (up or down). Essentially, ADX quantifies trend strength by presenting in both uptrends and downtrends of the line.
What to look for
The values associated with the ADX line help traders determine the most profitable trades and where risk lies in the current trend. It is important to know how to quantify trend strength and distinguish between the varying values in order to understand the differences in trending vs. non-trending conditions. Let’s take a look at ADX values and what they mean for trend strength.
ADX Value:
0-25: Signifies an absent of weak trend
25-50: Signifies a strong trend
50-75: Signifies a very strong trend
75-100: Signifies an extremely strong trend
To delve into this a bit further, let’s assess the meaning of ADX if it is valued below 25. If the ADX line remains below 25 for more than 30 or so bars, price then enters range conditions, making price patterns more distinguishable and visible to traders. Price will move up and down between resistance and support in order to determine selling and buying interest and may then eventually break out into a trend or pattern.
The way in which ADX peaks, ebs, and flows is also a signifier of its overall pattern and trend momentum. The line can clearly indicate to the trader when trend strength is strong versus when it is weak. When ADX peaks are pictured as higher, it points towards an increase in trend momentum. If ADX peaks are pictured as lower - you guessed it - it points towards a decrease in trend momentum. A trend of lower ADX peaks could be a warning for traders to watch prices and manage and assess risk before a trade gets out of hand. Similarly, whenever there is a sudden move that seems out of place or a change in trend character that goes against what you’ve seen before, this should be a clear sign to watch prices and assess risk.
Summary
The ADX Breakout indicator is a trend strength indicator that analyzes price movements relative to trend strength to signal a user when is best for a trade and when is best to manage risk and assess patterns. As long as a trader recognizes strong trends and assesses the risk of each trade properly, they should have no problem using this indicator and utilizing it to work in their favor. In addition, the ADX helps identify trending conditions, but while doing so, also aids traders in finding strong trends to trade. The indicator can even alert traders to specific changes in trend momentum, allowing them to be primed for risk management.

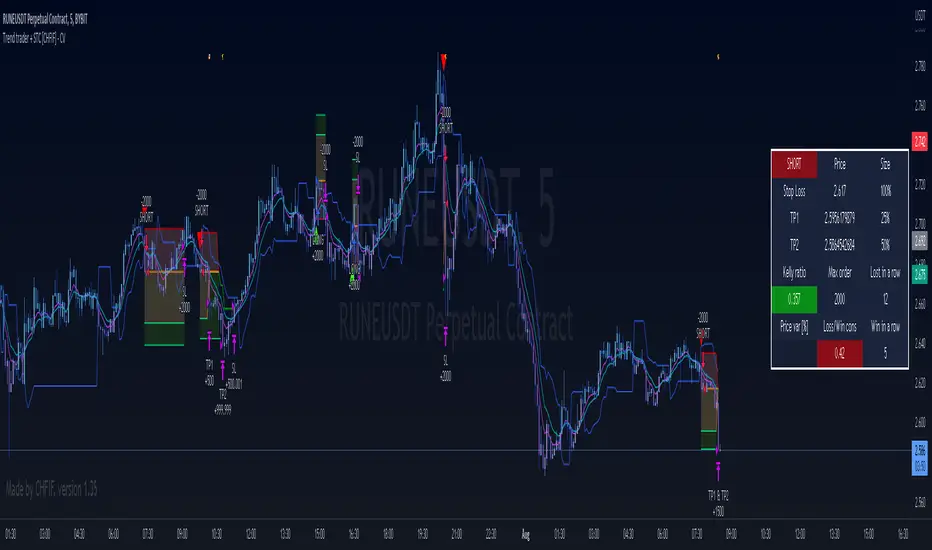
Trend trader + STC [CHFIF] - CV This script is my first strategy script coupling the Trend trader (indicator developed by Andrew Abraham in the Trading the Trend article of TASC September 1998.) and Schaff Trend Cycle . The STC indicator is widely used to identify trends and their directions. It is sometimes used by traders to predict trend reversals as well. Based on the movement of the Schaff Trend Cycle , buy or sell signals are generated, which are then used by traders to initiate either long or short positions.
Around I built a user interface to help you in creating a customized strategy to your need.
My idea behind doing this was to make customizable parameters and back testing easier than manually with a lot of flexibility and options. More possibility we have, more solutions we find right? So I started this script few weeks ago to be my first script (second in reality, but first to be published.)
Strategy it self is made out of 2 simple step:
1→ STC gives a Buy/Sell signal.
2→Price is closing above the TT (Buy) or below (Sell) and the signal is the same as given by the STC .
To complete your strategy in order to reach the best result, I added few options:
→ Money management: Define the type of risk you want to take (entry risk will always risk the same percentage of your portfolio disregarding the size of the SL, Fix amount of money, fix amount of the capital (portfolio). NOTE: Margin is not coded yet, target is to show liquidation price. Please keep an eye on the releases to know when it is released.
→ Stop loss and Take profit management: Define the type of target you want to use (ATR, fixed percentage, pivots points) and even customise different take profit level or activate the trailing. Each type of target is customizable via the menu
→ Moving average: You can also complete the strategy using different moving average. To draw it tick the box on the left, to use it in the calculation of the result, tick the box "Price>MA" in front of the needed EMA . You can select different type of MA ( SMA , EMA , DEMA , TEMA , RMA, HMA , WMA , VWAP , VWMA , etc...)
→ RSI: 4 possible approach to use the RSI to complement the strategy:
• OB/OS => short position will be taken only if RSI goes under the lower limit. Long if the RSI goes above the limit. Ticking confirmation will wait to cross back the limit to validate the condition
• Rev OB/OS => Short will be taken if RSI is below lower limit and stays below. Long will be taken if RSI is above upper limit and stays above.
• MA dominance => RSI has to be above MA for long, below for short. Confirmation box ticked requires 2 bars with the RSI on a side to validate signal.
• MA Dominance + limit => It is a combination of the requirement of the provious option and also Rev. OB/OS
→ Volume confirmation => This will consider the volume MA for entry confirmation. The volume will have to be above the MA define by the value entered in the field.
→ Waddah Attar explosion indicator can also be used as a filter for entries in this way:
• Explosion line > dead zone to validate entries
• Trend > dead zone to validate entry
• Both > dead zone is a compound of both rules above to get entry confirmation
→ ADX can also be used as a filter. I added 2 Threshold in order to have a minimum level of acceptance for valid entry but also a maximum level.
When your strategy is setup, you can setup alerts and I would recommend to setup the date range before doing the alerts. Why? Simply because the script do not cover pyramiding and will give a signal only if a trade is not ongoing.
In setting up the sessions at which you would want to trade, no signal within those range can be missed. You can setup 2 sessions, the days and also the global range of backtesting.
Session Breakout Strategy [Kintsugi Trading]What is Session Breakout Strategy?
This premium indicator was inspired by my desire to find and place high probability forex trades in any market, direction, or time of day.
Why Forex?
The Forex markets operate 24 hours, 5.5 days a week
Access to meaningful leverage
Ability to easily trade long or short
High liquidity
How to use it!
----- First, start by choosing a Range Session and Trade Session. -----
- Range Session = Period of time you believe will be predictive of future price action. I like to overlay 'FX Market Sessions' by boitoki to target timeframes in which forex market sessions overlap. This period is indicative of buyers and sellers battling it out in an effort to choose a direction.
- Trade Session = Period of time you believe the price will act on the information gathered from the range session.
----- Next, we filter the Range Session by information that will help further predict price movement in the Trade Session. -----
Our tools are:
Moving Average Filter
Average RSI Filter
RSI Decision Level
None
Each parameter is customizable.
----- Next, we set our risk. -----
Enter the "stop pip size' you desire.
Enter the 'target profit pip size' you desire.
We can set out ($) dollar risk-per-trade in the inputs. The script does not know your actual account balance, so if you want to risk $100/trade you would enter '$10,000' in the account balance section and '1' in the Risk Per Trade% section.
For example, an '8' stop and an '8' tp would indicate a 1:1 risk-reward. *Note - although you may generate a higher win percent with a less favorable RR, it is rarely worth it.
----- Finally, we backtest our ideas. -----
After using the 'Strategy Tester' tab to thoroughly backtest your predictions you are ready to take it to the next level - Automated Trading!
This was my whole reason for creating the script. If you work a full-time job, live in a time zone that is hard to trade, or just don't have the patience, this will be a game-changer for you as it was for me.
Auto-Trading
When it comes to auto-trading this strategy I have included two options in the script that utilize the alert messages generated by TradingView.
*Note: Please trade on a demo account until you feel comfortable enough to use real money, and then please stick to 1%-2% of your total account value in risk per trade.*
AutoView
PineConnector
Good luck with your trading!
Follow The Ranging HullThis is a scalping strategy, trying to make quick points based on momentum and trend trading.
Entry Points are when either the range filter or the the following line changes colour. And the Hull is in that same direction.
--The Strategy Only enters on range filter entry point for now.
This Strategy has been tested on the NASDAQ 1 min, And works best with low timeframes.
Set the IsStrategy on the settings to true, to activate the strategy.
Make sure the Dates are correct .
Credits:
Hull Suite by InSilico www.tradingview.com
Range Filter Buy and Sell 5 min www.tradingview.com
Follow Line Indicator by Dreadblitz www.tradingview.com

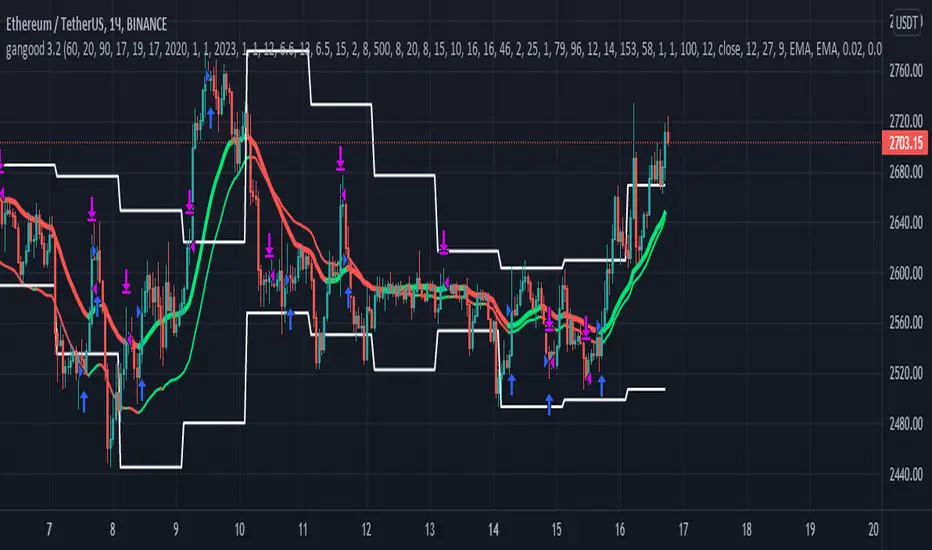
gangood bot for FinandyGangood is a mean reversion algorithm currently optimized for trading the ETH/USDT pair on the 1 hour chart time frame. All indicator inputs use the closing price of the period, and all trades are executed at the open of the period following the period in which the trading signal was generated.
To take into account slippage, the commission costs 0.15%.
Backtest result from 2020.
Result since 2019 2,500,000%, maximum drawdown 18%
This bot uses 11 indicators:
1) ADX
2) RANGE FILTER
3) SAR
4) RSI
5) TWAP
6) JMA
7) MACD
8) VOLUME DELTA
9) VOLUME WEIGHT
10) MA
11) TSI
Pattern 1:
There are 3 main components that make up Gangood: I. Trend Filter. The algorithm uses a version of the ADX indicator as a trend filter to only trade during certain time periods when price is most likely to be range-bound (i.e., average retracement). This indicator consists of a fast ADX and a slow ADX both using the same lookback period.
The ADX is smoothed with a 6-period EMA and the slow ADX is smoothed with a 12-period EMA. When the fast ADX is above the slow ADX , the algorithm does not trade because it indicates that the price is most likely trending, which is bad for a mean reversion system. Conversely, when the fast ADX is below the slow ADX, the price is likely to be in a range, so this is the only time the algorithm is allowed to trade. II. Bollinger Bands When the trend filter allows trading, the algorithm uses Bollinger Bands.
Indicator for opening long and short positions. The Bolliger Bands indicator has a 20 lookback period and a 1.5 standard deviation for both the upper and lower bands. When the price crosses the lower band, a buy signal is generated and a long position is opened. When the price crosses the upper band, a sell signal is generated and a short position is opened.
Pattern 2:
Based on RSI which is commonly used as a trend reversal indicator. However, here it is used as a trend-setting indicator, often with great success. This pattern only takes long trades, which is quite successful in a bull market.
Pattern 3:
Long or short trades are determined by the intersection of the fast EMA with the slow EMA for long positions and vice versa for short positions. Trades should only occur close to intersections. We then use the MACD for the long position. an indicator with a 10-minute time frame where we look for high peaks in negative values for longs and vice versa for shorts. They should be significantly higher than the other peaks.
Capital Management:
The maximum leverage in this strategy, I would recommend 2x, in order to trade without unnecessary risks and keep your nerves in order.
Bot setup:
I use the Finandy terminal, in which you can easily trade with this strategy.
1. We go to binance and turn on the hedging mode, this is necessary so that if tradingview sends a webhook for buying later than for selling.
2. Adding a new signal to Finandy
2.1. Open tab
2.1.1. "Order side" Strategy
2.1.2. "Amount" Balance% x Leverage
2.1.3. We set the percentage of the order two times less than the one you want
2.1.4. "Shoulder" is twice as large as the one you want
2.2.Close tab
2.2.1. "Enebaled" tick
2.2.2. "Reverse / Close" Disable
3. Set a notification for this strategy.
4. Copy "Signal URL" and paste it into webhook on tradingview
5. Copy "Signal Message" and paste it into the message on tradingview
Kitti-Playbook Simple Grid Simulation Long Only 25 ======== Basic Grid Trade =====================================
A) Objective : To visualization the Simulation of Simple Grade trading system (Long only)
: to study Entry and Exit ( Price and Time )
: to study portfolio optimization
: Dashboard to monitoring
Open Trade Close Trade : Grid by Grid
Number of Positions : Grid By Grid
Cash Flow
b)Specification.
:Long Only:
Open Long when Price Cross "Grid Line_N" Down in Range
Close Long when Price Cross Over "Grid Line_N + 1 Interval " in Range
:Interval : (Top - Bottom) / Grid Number
:Range : Top - Bottom X Finish time - Start Time
:Limit Grid Number = 3 - 25 intervals ( Limit by Time Processing )
c) Program Flow Chart
1) Initial Strategy Setting
2) Initial Input Setting
3) Create Trading Zone
4) Crate Long - Close Signal
5) Run Strategy Entry and Exit
6) DashBoard

VCP pivot buyIt will buy the breakout of the pivot in a bullish trend which is defined by the Mark Minervini stage 2 template
Set the stop loss% and Target% in your favor ( recommend the stoploss% as the low percentile atrp )
It helps indicate the contraction point so that we can have a low-risk entry of a buy point.
It followed the strategy of Mark Minervini.
changing the lookback period input to change the percentile
changing the Pivot Length to decide how many bars you would consider as a pivot
changing the Close range to decide in how much percentage does the close range you would consider as a pivot
The percentile rank is represented in the colour of the background, you can alter how low you want to set to indicate lowering volatility.
The blue line shows the percentage range in ( pivot length) days/bars
The coloured background shows the signal of pivot point forming

3xATR + EMA 260 + TP SL By NussaraStrategy backtest for 3X ATR + EMA 260
Exponential Moving Average
Moving averages smooth the price data to form a trend following indicator. They do not predict price direction, but rather define the current direction, though they lag due to being based on past prices. Despite this, moving averages help smooth price action and filter out the noise.
EMA=Price(t)×k+EMA(y)×(1−k)
where:
t=today
y=yesterday
N=number of days in EMA
k=2÷(N+1)
Average True Range
Average True Range ("ATR") was introduced by J. Welles Wilder in his 1978 book New Concepts In Technical Trading Systems. ATR is a measure of volatility for a stock or index
Calculation
ATR = (Previous ATR * (n - 1) + TR) / n
Where:
ATR = Average True Range
n = number of periods or bars
TR = True Range
The True Range for today is the greatest of the following:
Today's high minus today's low
The absolute value of today's high minus yesterday's close
The absolute value of today's low minus yesterday's close
3X ATR + EMA 260 Formula
1. ATR it indicates the market has a fluctuation. An indicator will check bar (High-Low) > 3 x ATR
2. EMA 260 identify the market uptrend or downtrend
- if condition (1) is true and the price closed above the EMA260 it’s an uptrend. An indicator will enter a long position.
- if condition (1) is true and the price closed below the EMA260 it’s a downtrend. An indicator will enter a short position.
Risk to Reward Ratio = 1:1.5
Stop loss = open price of entry position
This indicator is just a tool for technical analysis . It shouldn't be used as the only indication of trade because it causes you to lose your money. You should use other indicators to analyze together.

Ichimoku & SupertrendThis indicator is a combination of Ichimoku and Super trend, while to have a clearer chart, it does not plot on the price chart. Buy and Sell signals are derived from Ichimoku: price closes above the Conversion line, and both are above Komo cloud, there will be a Buy signal. Sell signal appears where the exact opposite has occurred. Since there are more volatility and sharper movements in the cryptocurrency market, it is recommended to use the indicator on Crypto pairs rather than Forex pairs or the Stock market. For this purpose, I tried to optimize the inputs of Ichimoku and assign new inputs as the default values of the indicator. I came up with "8" as the input of the Conversion Line and "53" as the input of the Lagging Span. Although, since the indicator takes advantage of a flexible setting, you may change the values according to the timeframe and market you wish to trade.
There is also a Super trend indicator to give a better insight into the market condition and assist you in executing more profitable trades. The super trend is derived from several simple calculations consisting of the Average True Range and a multiplier (all of which are adjustable). The super trend says the direction of the current market and whether the market is Bullish or Bearish. Where leveling in the slope of the Super trend shows that the market is in a range state.
It is worth mentioning if you entered a position, you should not be waiting for the next signal to appear to close your current position. As my own experiences in Crypto pairs suggest, a Risk-reward ratio of 1.3 would be the best for your positions. For example: If the indicator has shown a "Buy" and you have just entered a long position, it is better to set your Stop-loss just below the previous low (pivot point) and your Take-profit in a way that your Risk-reward be equal to 1.3.
Please do not use this indicator in the "Range" market conditions.
Bottom line, It would be best to consider that this indicator assists you in your trades. It would help if you had made sufficient analysis and managed your risk before you execute any trade.

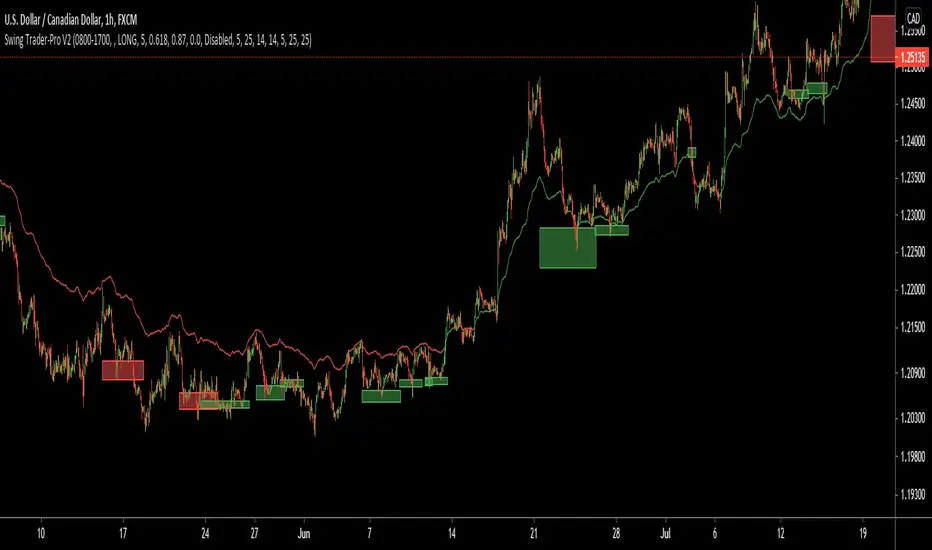
Swing Trader-Pro V2The strategy- what is it?
This indicator is designed from a theory created by myself in order to distinguish a correction from an impulse. This comes down to the ability to compare "x" range of candles to "y" range of candles and highlight key differences to then correctly portray that the most recent move in price will be (or is) a correction.
Following this theory, we all understand that corrections don't go with the trend right? So this means at some point, there is a high probability of a rejection somewhere in this most recent move, that will ultimately push price higher or lower as it continues back with the trend. Therefore, through extensive quantitative research and back-testing, we are able to highlight areas of high-probability rejections within these supposed corrections.
How does it work?
Firstly, we need to establish a high and low point (using pivots ) that help us decide what the state is of the recent move between the high and low (we call this "point A" and "point B"). So we can only consider whether the recent move in price was an impulse or a correction until the move from "point B" to "point C" is made. But before that, once we have identified "Point A" and "point B", we use 2 (supposedly) strong levels which help integrate a box onscreen and thus, indicate this area of high liquidity. This box will continue to adjust according to the change of pivots (if price keeps creating HH's & HL's or LH's & LL's depending on market trend). But if we establish a strong high and low and price stays within this range, then the box will remain in place.
The default color of the box is red; the only time the color of the box will change is when:
- Price retraces from the high/low back to the box (price has to touch the box)
AND
-If any of our confirmations indicate a successful correction based on our theory.
So the box color varies:
- Red = very weak (or) no entry = no confirmations were made
- Yellow = weak entry = some but not all confirmations were made
- Green = strong entry = all confirmations have indicated that the move from "point B" to "point C" (remember that "point C" is where the box is) is a correction when compared with the move from "point A" to "point B"
These confirmations are all validated on the same candle during live candle activity (not when the candle has closed on the box). As this happens, the confirmations will determine the state of entry quality as soon as price touches the box.
In this time, we will see a new orange label highlighting what indicators have confirmed a successful correction and what haven't.
The label shows the different confirmation indicators in which we have provided different names (as this is the secret we intend to keep). So we have:
- "CC"
- "B1/B2"
- "B3"
Usually, we will see either an "OK" or "NOT OK" next to each confirmation indicator. This just tells us whether they have confirmed or not. Please note that this "point C" label does not stay permanently, regardless of the state of entry quality. The label will in fact stay on the screen until the next box has been generated, which is usually a few candles after the entry has been triggered.
Entries, SL's and TP's
This indicator shows the user an area of high-probability rejection. So in terms of specifying a precise entry, you're completely free to enter on the following:
- the moment price touches the box (depending on what color it is of course)
- the other end of the box (if you would like to catch a "sniper entry")
- or if price pierces the entire box and is still green, you can wait to see if price comes back through the box (which indicates a false breakout).
As for Stop-losses, i would recommend:
- Long entries: set your SL at the recent low (this should be "point A")
- Short entries: set your SL to the recent high (this should be "point A" as well, because if you're switching from the "long entry" setting to the "short entry" setting, the indicator labels flip around and are the opposite of what they are for long entries).
For Take profits, this is entirely up to the user. Because some entries will allow you to have great RR ratios depending on how you manage the active trades. Some recommendations below:
- Set TP to "point B" pivot
- Use trailing stop function or something similar if available
- Add other indicators such as the RSI and close when price reaches key levels
- When price shows signs of exhaustion or early stages of reversal then just close
Additional information and recommendations
- This works on any time frame and on any financial market, whether you prefer Forex, stocks, crypto, commodities , etc.
- In regards to trade direction, you can change in the settings to look for either long or short positions in the market. I would recommend using it in favor of the overall trend of the markets because you will find a lot better entries. Although, this does work against the trend at times as well. Additionally, this tool also works in consolidating markets which is beneficial.
- After becoming used to the script, i would say to apply it twice to your screen and have one looking for Long entries and the other looking for Short entries.
- As the user, you have the ability to remove the labels in the parameter settings (because it does look quite messy onscreen, especially if you have both long and short entries on at the same time). I would only personally show the labels when price hits the current box to see what confirmations have been identified.
- I will also provide the best parameters to use. You will only need one set of parameters for each long and short setting, as these parameters are universal for any time frame and any financial market.
FIRST UPDATE
After extensive back testing using our first version, we found that in fact, there are some great opportunities being wasted as the entry box stays red. This is due to some series of market structure that don't always fit our theory of continuations within the market. We found that although our theory is accurate, the amount of times the market fits this is more rare than times when price follows sequences. When we look for sequences in the market instead of specifying differences between impulses and corrections, we actually see areas of serious repetitiveness, thanks to how our indicator initially generates. Not how it confirms. So, understanding this new theory through one component of our previous indicator, we are still able to keep boxes at the same area yet accurately confirm more profitable entries external to our full previous strategy.
Moving towards the practical side of things:
-Make sure "add extra confirmation" parameter is selected, as this will allow the indicator to search for more valid entries rather than just our normal confirmations. (this is a tick box).
- Default parameters are already set for both C1 and C2
In a simple sense, this update is added to find more confirmations to turn more red boxes into green boxes based on other theories outside of our original one. How we do this exactly is part of the mystery.
SECOND UPDATE
- Fibonacci based moving average: using elements of the Fibonacci sequence and its relevance to being a hot-spot in price activity, we have integrated this into a moving average which is stronger than your usual MA. Here, you will notice it showing stronger signs of rejecting price, especially when trending. Hence, this is extremely useful to implement into your strategy as part of the trend identification. When price is consolidating, depending on how volatile or close-in the waves are during these periods, the FMA is similar to your typical MA, so therefore not so good. But the overall intention of this is to enhance your conclusion to whether price is trending and whether price is bullish or bearish.
- This is now a strategy, not just an indicator: So now we can choose from a huge variety of parameters in accordance to what ones work best with what pair, or time frame. The typical parameters to change would be the entry points, stop losses and take profits. We have also added in a "SL to entry" option. ALL PARAMETERS ARE FIBONACCI LEVELS AS THIS MAKES IT UNIVERSAL TO ANY PAIR/ TIME FRAME.
- Move the entry boxes : So this is very useful for certain pairs and mainly to help the user understand key sequences on a quantitative level. Sometimes we can notice that pairs spike higher than the typical entry (0.618) so we have allowed flexibility to the point where you can alter the box appearance to either the 0.618 level (default), 0.786 and the 0.9 level.
- Back-testing: Now the user can back-test the strategy and see the performance within any financial market you add this to! Please note that according to the strategy, once a trade is placed, it wont enter any more trades when the current one is still active. I have requested to change this, but it is out of our development team's reach. However, this doesn't discredit what the system can help you achieve, as you will still be able to find profitable parameters within the financial markets.
Strategy default properties
Backtest start: this date is when you would like to start the backtest, however, the indicator will go as far as the data can be read
Backtest end: choose your date to end the back test.
Trade session: choose the trading session you want this strategy to work on.
Filter by session: you can filter the backtested results depending on whether you want the strategy to take trades within the chosen trading session.
Filter by Fibonacci moving average: select this if you would like for the back tested results to consider whether the valid trade setups are in accordance to what the FMA displays (Bullish or Bearish). This is deselected.
Fibonacci Moving Average Timeframe: here you can select what timeframe you would like the FMA to work on, default is the “same as chart” button/ option.
TraderDirection: choose whether you would like LONG or SHORT entries for the indicator to find.
Max risk per trade: choose the risk setting per trade, i would suggest lowering this to 1% ((MODERATOR) This is the default setting!)
EntryFib: choose between the options as to where you would like the strategy to enter positions, the default is the 0.618 zone which is the closest side of the box to price. You will also see that when you choose to change this, the boxes on your screen will move accordingly. A very helpful function!
StopFib: choose your Stop Loss based on the same Fibonacci level as what you choose for your entry, remember that the higher the fib level, the higher (or safer) your Stop Loss is from price spiking. It all comes down to preference.
TakeProfitFib: choose your Take Profit based on the same Fibonacci level as what you choose for your entry, remember that the lower the fib level, the higher your Take Profit is again, It all comes down to preference.
BreakevenFib: the default setting is on “disabled” however when you select a certain Fibonacci level, once price reaches there during the active trade, your Stop Loss will be set to entry, this function is designed to stop volatile price fluctuations rendering your in-profit trade result to hitting your Stop Loss and losing when it closes out.
Combo Backtest 123 Reversal & MASS Index This is combo strategies for get a cumulative signal.
First strategy
This System was created from the Book "How I Tripled My Money In The
Futures Market" by Ulf Jensen, Page 183. This is reverse type of strategies.
The strategy buys at market, if close price is higher than the previous close
during 2 days and the meaning of 9-days Stochastic Slow Oscillator is lower than 50.
The strategy sells at market, if close price is lower than the previous close price
during 2 days and the meaning of 9-days Stochastic Fast Oscillator is higher than 50.
Second strategy
The Mass Index was designed to identify trend reversals by measuring
the narrowing and widening of the range between the high and low prices.
As this range widens, the Mass Index increases; as the range narrows
the Mass Index decreases.
The Mass Index was developed by Donald Dorsey.
WARNING:
- For purpose educate only
- This script to change bars colors.

ATH Oscillator StrategyThis idea stems from the belief that people want to reverse the trend when an all time high or low is hit. This strategy incorporates that by using ath and atl values based on the lookback period and the signal gets smoothed by the input smoothing type and length. I found that the best time to use this was on the 3m chart. But I am certain that higher time frames can be used if the settings are tweaked.
Settings:
Strategy -
simple(long,short,switch) - This strategy just uses the directional change of the signal using just longs, just short, or switching between the two.
range - This strategy uses the hlines on the chart to determine when to buy and sell. These can be adjusted using the Range Top / Bot values
div - This strategy uses a simple divergence of the signal line to time entries
Lookback - How many bars back to check the ath and atl
Smoothing - How smooth you want the signal
Smoothing Type - Different ways to smooth the signal
Range Top/Bot - Changes the height of the hlines for the range strategies
On Buy/Sell Signal # - Change when you enter. Increasing this number will move the signals to the left if there are consecutive signals. Useful to find bottoms and tops.
Chart: ETHUSD Perp Bybit
Strategy Properties: 100 base order, 100% equity
Notes: Use on 3-5m time frame for best results. Change settings if you want to try other coins like BTC or higher time frames

POW EdgeHello fellow Trading View member,
Eventually our rebranded update with some extra features for our exclusive 'Edge' Strategy Script.
In this description I will run through;
The strategy itself, what is it?
What does it do?
How does it work?
How can it help you?
How good is it?
What is it.....
The Edge Strategy itself is based upon 5 indicators lining up in total confluence to enter a position in line with a trending move. Adding them together adds more confluence and probability to each individual trade outcome over the longer term. The individual strategies used are based on Trend strategies all used in combination.
The uniqueness to this is how they are combined. Indicators can work to a point individually of course, but combining them together and only trading when all are in a line was our concept, whilst reviewing how each individual indicator can be optimised to work with the others.
Also the motivation was to be the right side of the market in a trending move and capitalising on as much as that move as possible.
The first part is to ensure the candle close is above or below our moving average, we can then check the state and validity of each of the other 4 indicators. Once this confluence is in alignment a trade is valid for entry - this has to be valid at the same time - but not all valid on the same candle - they will come into alignment in different stages. But once they are, our trade is valid.
I will not reveal the other individual 3 indicators but the other is also an ADX function to add a threshold into the strategy to identify a trend - usually above 20/25. This has upsides and downsides as any user can visualise and see in the testing.
We also add to the script to look for a Buy then Sell, Sell then Buy - we found this had more profitable results overall and next phase was to review the money management; where and how we placed our SL and when and why we exited the trade.
Example - for a BUY trade to be valid, all 5 indictors must meet their own criteria before a BUY is printed on the chart. Absolutely no technical analysis is needed to trade this strategy and the data we have is based on using the strategy in isolation - how you wish to use this either independently or supporting your own trading is of course, up to you.
The SL and TP's are based on ATR Multipliers thus ensuring we are factoring in market volatility at that time. We also have a FT (Follow Trend) option, which is a worthy addition for capitalising on big trending moves.
This strategy will work on all markets and timeframes.
We understand and accept that all pairs and markets are different thus we have optimised certain pairs and timeframes with different parameters to provide increased returns, these are hard coded (H1 Timeframe) and also provided for your review.
Profitability is easily viewable in the ‘Strategy Tester’ - this is a great tool. This is where you can see historic / live data for the strategy.
Data like;
The Net Profit
Number of trades
Win Percentage
Every trade taken
Average Win
Average Loss
Maximal DD , etc.
We have individually optimised each pair to ensure this is the case and hard coded these parameters into the strategy. All you need to do is flick between the pairs - the strategy will then identify the pair you are on and change the parameters to suit in the background.
Whilst a trade is open, the strategy will convert all candles to the relevant colour - Green for an uptrend and Red for a downtrend (all customisable).
We find this is helpful for traders psychology - not getting 'spooked' by other candle colours, affecting your decision making.
When a new signal is valid, 'POW BUY' or 'POW SELL' will be displayed on the first candle open for entry. As well as this, you will also have the trade label print which will display the following;
- EP – Entry price
- SL – Stop loss
- TP – Take Profit
- Lot size
The trade information printed will also tell you the pip values of your stop loss and take profit based on how far away they are from the trade entry price.
The lot size printed is customisable and unique to your account- within the strategy settings you can simply input your account balance, currency and risk approach which includes a fixed risk amount, fixed lot size or a fixed percentage.
This removes the need for 3rd party apps or websites to quickly calculate your specific risk on your trade. Thus saving you time and making sure you aren't 'guessing' with your lot size.
No one likes losing more than they thought.
The progress and initial challenges....
To start, our first version simply showed the buy and sell arrows when a trade was valid. However, this caused subjectivity with where we would place our stop loss and how we would manage the exit of the trade once we were in it. So, we identified a solid strategy for this was incorporating the Average True Range (ATR) for SL and TP options.
I was especially keen to add the SL and exit management so I could obtain solid back testing data to support my thoughts that 'this works'. Every trader requires confidence and belief in their strategy, without it you simply won't succeed or be disciplined in your execution.
The other challenge we all face is calculating the lot sizes of our trades right? So, it was important that we incorporated a lot size calculator - its all about making it easy when a trade is valid to enter without trying to calculate this accurately.
Lastly, when pairs are stuck in a range - this can be a testing period of 'chop' for a trend strategy, so we also incorporated the ADX function to enable us to set a threshold level to identify when the instrument is more likely to be trending.
What does it do?
Ultimately, tells you when to buy and sell - where to place your SL and when to exit. Whilst also ensuring your risk management is on point, by displaying your trading lot size. Also providing you with live back tested data at your finger tips thank you to the strategy tester.
How does it work?
This will be visible on your trading view charts once you get access. And will work across all your devices, the trading view website or the app on your phone for example.
You can also use Trading View alerts, so you won't miss a trade and can go about your day as normal without watching the screen. This will work on the Free version of TV, however, in order to benefit from more alerts and templates it makes sense to upgrade to a higher package.
How can it help you?
This will help give you a mechanical approach to your trading. This means, less decision making on your part, with the instant benefit of seeing the data you have at your fingertips thanks to the 'Strategy Tester' TV Function.
It will save you time, you don't need to be in front of your screen or completing any subjective analysis.
Integrated lot size calculator can ensure you are always accurate with your risk - either in percentage or a fixed amount of risk - whichever you prefer.
Understand Probability - this is the key one for me. Losing runs happen in any trading strategy. The great benefit here, is you can see them. How long were the losing runs? How can I prepare and plan my risk management around them are all fundamental keys to managing your emotions and being detached from your trades. No one wants to feel stressed or anxious when trading.
Customisable exit strategies - A specific TP for a 1:1 RR or 1:10 RR for example can be adjusted and you can see instantly how this affects the profitability.
The exit strategy options are shown below;
TP 1/2/3
FT - Follow Trend (no stop loss and follow's from Buys to Sells, Sell to Buy, etc.
SL + FT - SL present, but trade is held until a reverse signal is presented.
How good is it?
We have some really positive back testing data across a range of pairs and markets - equities and indices too.
Drop me a DM to see these and I'll be happy to share.
Below let me show you a screen shot of how this can work for you.
How do you access this?
Please visit our website for signup / purchase information in the first instance (the link is on our trading view signature) or send us a private message on here - its impossible to keep track of comments on our posts so to ensure we don't miss you, a private DM will be great please.
The Back test shown on this example is based on the Trading View mid price and also a realistic starting Capital of £10,000. This test result is also based on a 0.1% risk per trade, with a 5 tick spread and a commission of
Regards
Darren
Disclaimer alert.
Please remember past performance is exactly that - how our strategy performed over those dates tested, it is not obviously a guarantee of future performance. Most of our H1 data is valid from Jan 2017 to now - so 4+ years and data on 650+ trades per pair.

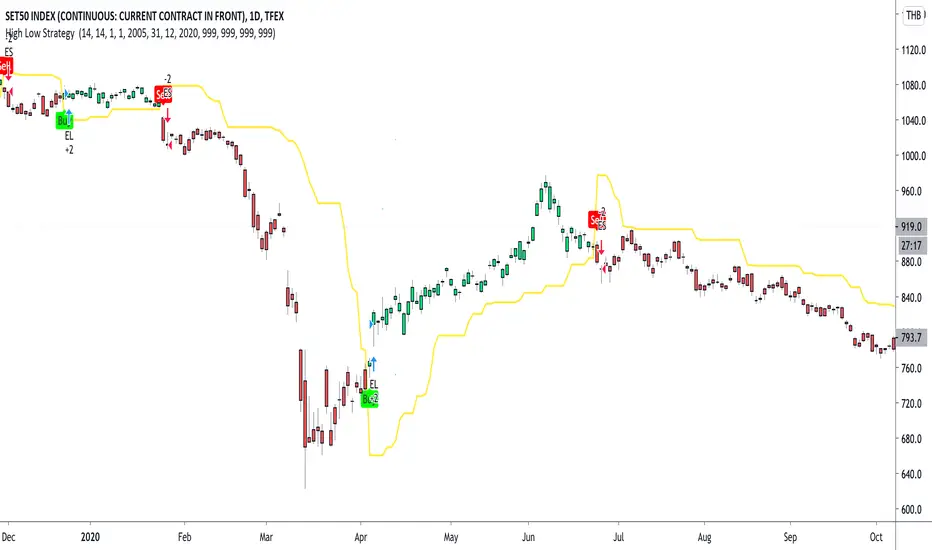
High Low Strategy with signal lineTFEX:S501!
Create Signal-line from Highest and lowest price of previous bar in defined range .
Buy signal : IF high of current bar is cross over highest High of bar in range you choose
Sell signal : IF low of current bar is cross under lowest low of bar in range you choose
after entry the position, the model will hold the position until there're opposite trend direction signals occurred. Its can easily seen by the barcolor "Buy the first green hold until its red"
backtest date and also Tp, Stoploss can be set (credit : kodify.net)
(beware of bias ...... optimum period for each asset and timeframe is different ..... you have to find your own period in put )
DMT 369 DRAGRONFLY STRATSuccessful traders trade with a fixed plan and without emotion, but this a lot harder than many new traders think. Many never master this skill and suffer continual drawdowns on their accounts as they overtrade high leverage positions in volatile markets.
ĐΜŦ Autobot resolves this issue by taking the human element out of the equation, allowing full automation of trades using TradingView alerts to trigger your favourite trading bot, such as Alertatron or 3Commas.
Being a Trend Reversal Indicator based on Volatility & Average True Range, ĐΜŦ Autobot is designed to identify spots in the market that offer suitable scalp and swing trade opportunities.
Due to popular demand we have expanded our ĐΜŦ Autobot product line to include the new ĐΜŦ Autobot Dragonfly 3-6-9 Edition which combines DMT with 3-6-9 Vortex mathematics, our Titan indicator and a multi-ladder scalping strategy to ensure you maintain a preferable average entry when price action moves against your position.
Indicator View
It its default state the DMT Autobot Dragonfly indicator displays key signal information, such as:
• Support & resistance range lines
• Titan Body Small & Large Time Frame lines
• Long & Short entry positions
• Long & Short position ladders
• Profit targets
Dragonfly displays a range between resistance (upper line) and support (lower line) on the chart.
Once the price is granted support in the range the lower line will turn green. As price action develops it will make repeated attempts to test support. If support holds price will attempt to test the resistance line (red).
When resistance is broken and the price is above the upper line, the line will turn blue confirming the bullish momentum and provide a potential buy opportunity.
Price action will make attempts to test the upper line as support and will keep rising while support is granted.
Once support is lost the upper line will become red once more. As price action develops it will make repeated attempts to test resistance. If resistance holds, the price will attempt to test the support line (green).
When support is broken and the price goes below the lower line, the line will turn red confirming the bearish momentum and provide a potential selling opportunity.
Price action will make attempts to test the lower line as resistance and will keep dropping while resistance is granted.
Titan Body
The Titan Body Small & Large time frame options in the indicator add additional trendlines to the chart to provide further clarity and confirmation to the Support & Resistance range indication.
Once price is granted support by the Small Time Frame trend line the line will turn green. As price action develops it will make repeated attempts to test the Small Time Frame support. Once the price is below the Small Time Frame trend line, the line will turn red and can act as resistance in a trend reversal.
When price is granted support by the Large Time Frame trend line the line will turn cyan. As price action develops it will make repeated attempts to test the Large Time Frame support. Once the price is below the Large Time Frame trend line, the line will turn orange and can act as resistance in a trend reversal.
The Titan Body enabled and customized in the indicator’s style settings,
Alert indicators
DMT Autobot Dragonfly Edition generates signals that can be used to scalp trade a volatile asset.
Signals are enabled and customized in the indicator’s input settings Additional options can be found in the options, but it is recommended that these are left at the default, as shown below. The indicator generates many
Entry and Profit levels can be disabled or customized in the indicator’s style settings,
Tradingview Alerts
Using Tradingview alerts, DMT Autobot Dragonfly signals can be used to trigger a trading bot.
To trigger a long or short position, set the Tradingview Alert Condition to DMT 369 Dragonfly and select the long or short option.
It is recommended that long or short positions are configured to trigger Once Per Bar Close
Ladders can also be triggered using alerts. To trigger a ladder order, set the Tradingview Alert Condition to DMT 369 Dragonfly and select the appropriate Long or Short ADD option that is to be triggered by the relevant values defined in the indicator’s configuration.
It is recommended that ladder orders are configured to trigger Once Per Bar,
To trigger a take profit order, set the Tradingview Alert Condition to DMT 369 Dragonfly and select the Long or Short TP option that is to be triggered by the relevant values defined in the indicator’s configuration.
Take profit orders can be configured as Once Per Bar Close or Once Per Minute.
If you wish to trigger a take profit signal immediately when the indicator’s defined take profit value is achieved, then use the Once Per Bar option.
Selecting Once Per Bar Close to generate a take profit signal is a gamble as the candle may close far away from the defined profit target – positive or negative.
While stops can be used, they are not applicable to the recommended ladder strategy.
Ladder Strategy
The DMT Autobot Dragonfly indicator always turns an underwater position into a win by utilizing a ladder strategy.
By using the recommended defaults, the indicator will trigger ladder orders at 3%, 6% & 9% using increasing order sizes,
Order sizes increase exponentially to ensure a good average price is maintained. If you are not using DMT Autobot Dragonfly signals to trigger ladder or take profit orders, please ensure your trading bot is configured to recalculate the new ladder entry and profit target based on the new average position entry price as each ladder is filled.
If you are using DMT Autobot Dragonfly on a leveraged asset, please ensure the leverage position is configured suitably so that your position is not liquidated if the price rapidly moves against you.
If u are looking for more information or access to the script please private msg me in trading view chat thx for support

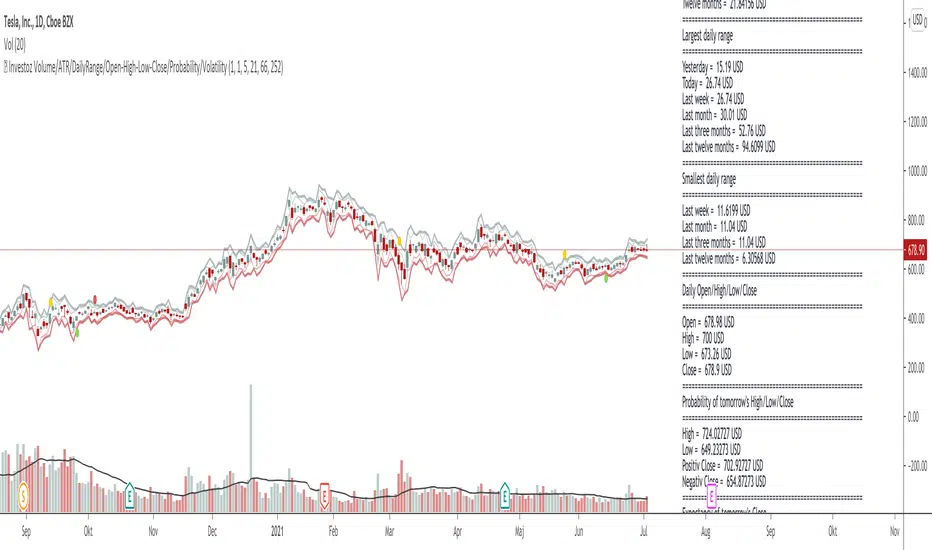
© Investoz Volume/ATR/DailyRange/OHLC/Probability/VolatilityThe relationship between returns, volatility and trading volume has interested financial economists and analysts for a long time.
Is there any dynamic relationship between trading volume, returns and volatility in the financial markets?
In recent financial studies, the linkage between return, volatility and trading volume is a central issue as it provides insights into the microstructure of financial markets. The price-volume relationship is seen as it is related to the role of information in price formation. Trading volume is defined as the number of shares traded each day and is an important indicator in technical analysis as it is used to measure the worth of stock price movement
either up or down.
Investors' motive to trade is solely dependent on their trading activity; it may be to speculate on market information or portfolios diversification for risk sharing, or else the need for liquidity. These different motives to trade are a result of processing different available information. In consequence, trading volume may originate from any of the investors who may have different information sets. As various studies reported, the information flow into the market is linked to the trading volume and volatility. Thus, since the stock price changes when new information arrives, there exists a relation between prices, volatility and trading volumes.
Significant efforts have been made, empirically and theoretically, on the phenomenon of stock price and volume relationship. Although the majority of those findings have confirmed the existence of positive contemporaneous relationship between trading volume and returns, the study of different stock markets have given mixed results about the causal return-volume relationship.
So, if you think that price and volume is important, maybe this indicator full of information around this topic may help you or make it easier in many ways.
Let me briefly guide you through.
To the right you have all the information within a label directly on the chart. Inside the label you will see following information:
-Number of bars
-Volume
-Average true range
-Daily range
-OHLC
-Probability for tomorrow´s daily range
-Warning of increased volatility
In the chart, you will also see where the expected daily range is likely to be within, with high and low levels.
Finally, I like to say this:
I have put a lot of work into this script and let me know if you use the indicator and what you think of it. Also if it is of some help or maybe you who use it, have found something wrong that needs to be reviewed and changed or information that would be important to add?
Enjoy!
T3-CCI Strategy [SystemAlpha]This is a strategy based on FX Sniper's T3-CCI indicator. Instead of using just the normal buy and sell signal, we added an option to use trend filters, trailing stop loss and take profit targets.
In this strategy you have a choice of:
Trend Filters:
- Average Directional Index ( ADX ) – buy when price is trend is up and sell when trend is down.
- Moving Average (MA) – buy when price close above the defined moving average and sell when price close below moving average
- Parabolic SAR – buy when SAR is above price is above price and sell when SAR is below price.
- All - Use ADX , MA and SAR as filters
For MA Filter , you can use the “TF MA Type” and "TF MA Period" parameter to select Simple or Exponential Moving Average and length.
Stop Loss:
- Average True Range (ATR) – ATR % stop as trailing stop loss.
- Parabolic SAR ( SAR ) – Parabolic SAR adapted as trailing stop loss.
For ATR , you can use the “ATR Trailing Stop Multiplier” parameter to set an initial offset for trailing stop loss.
Take Profit Target:
- Average True Range (ATR) – ATR % stop as trailing stop loss.
- Standard % – Percent as target profit
For ATR , you can use the “ATR Take Profit Multiplier” parameter to set an initial offset for trailing stop loss.
Additional feature include:
- Show Bar Colors
STRATEGY ONLY:
- Set back test date range
- Set trade direction - Long, Short or Both
- Use timed exit - Select method and bars
- Method 1: Exit after specified number of bars.
- Method 2: Exit after specified number of bars, ONLY if position is currently profitable.
- Method 3: Exit after specified number of bars, ONLY if position is currently losing.
TradingView Links:
Alerts:
T3-CCI Indicator:
Advance ADX:
How to use:
1. Apply the script by browsing through Indicators --> Invite-Only scripts and select the indicator
2. Once loaded, click the gear (settings) button to select/adjust the parameters based on your preference.
3. Wait for the next BUY or SELL signal to enter the trade!
Disclaimer:
The indicator and signals generated do not constitute investment advice; are provided solely for informational purposes and therefore is not an offer to buy or sell a security; are not warranted to be correct, complete or accurate; and are subject to change without notice.

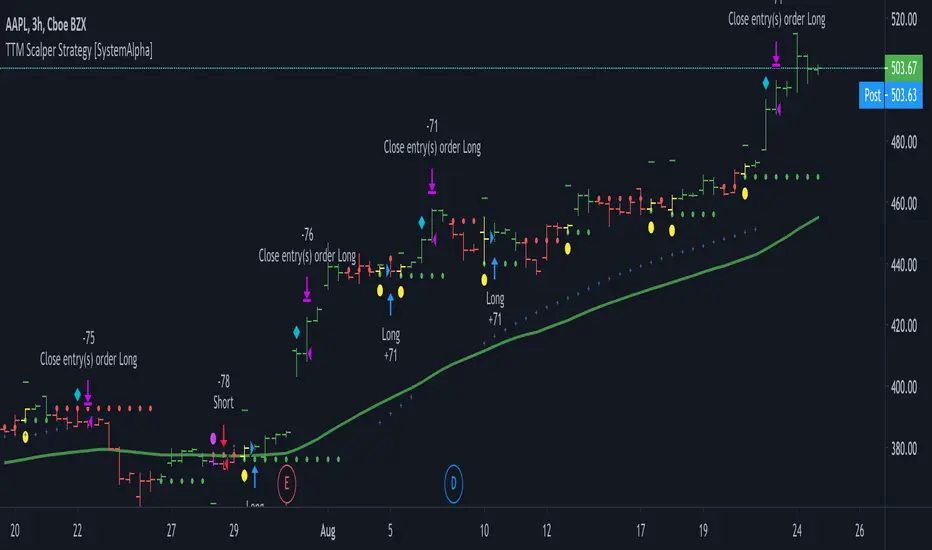
TTM Scalper Strategy [SystemAlpha]This is a strategy based on TTM scalper indicator. Instead of using just the normal buy and sell signal, we added an option to use trend filters, trailing stop loss and take profit targets.
The TTM scalper indicator of John Carter’s Scalper Buys and Sells was originally created by HPotter and is as a close approximation of the one described in his book Mastering the Trade.
In this study you have a choice of:
Trend Filters:
- Average Directional Index ( ADX ) – buy when price is trend is up and sell when trend is down.
- Moving Average (MA) – buy when price close above the defined moving average and sell when price close below moving average
- Parabolic SAR – buy when SAR is above price is above price and sell when SAR is below price.
- All - Use ADX , MA and SAR as filters
For MA Filter , you can use the “TF MA Type” and "TF MA Period" parameter to select Simple or Exponential Moving Average and length.
Stop Loss:
- Average True Range (ATR) – ATR % stop as trailing stop loss.
- Parabolic SAR ( SAR ) – Parabolic SAR adapted as trailing stop loss.
For ATR , you can use the “ATR Trailing Stop Multiplier” parameter to set an initial offset for trailing stop loss.
Take Profit Target:
- Average True Range (ATR) – ATR % stop as trailing stop loss.
- Standard % – Percent as target profit
For ATR , you can use the “ATR Take Profit Multiplier” parameter to set an initial offset for trailing stop loss.
Additional feature include:
- Show Bar Colors
STRATEGY ONLY:
- Set back test date range
- Set trade direction - Long, Short or Both
- Use timed exit - Select method and bars
- Method 1: Exit after specified number of bars.
- Method 2: Exit after specified number of bars, ONLY if position is currently profitable.
- Method 3: Exit after specified number of bars, ONLY if position is currently losing.
TradingView Links:
Alerts:
How to use:
1. Apply the script by browsing through Indicators --> Invite-Only scripts and select the indicator
2. Once loaded, click the gear (settings) button to select/adjust the parameters based on your preference.
3. Wait for the next BUY or SELL signal to enter the trade!
Disclaimer:
The indicator and signals generated do not constitute investment advice; are provided solely for informational purposes and therefore is not an offer to buy or sell a security; are not warranted to be correct, complete or accurate; and are subject to change without notice.
MACD++ Strategy [SystemAlpha]This is a strategy based on MACD Oscillator. Instead of using just the normal crossovers, we use trend filters, trailing stop loss and take profit targets. This strategy was developed for crypto, forex and stocks on daily timeframe but feel free to experiment on 15 minutes or higher using heikin ashi or normal candles
In this strategy you have a choice of:
Trend Filters:
- Average Directional Index ( ADX ) – buy when price is trend is up and sell when trend is down.
- Moving Average (MA) – buy when price close above the defined moving average and sell when price close below moving average
- Parabolic SAR – buy when SAR is above price is above price and sell when SAR is below price.
- All - Use ADX , MA and SAR as filters
For MA Filter , you can use the “TF MA Type” and "TF MA Period" parameter to select Simple or Exponential Moving Average and length.
Stop Loss:
- Average True Range (ATR) – ATR % stop as trailing stop loss.
- Parabolic SAR ( SAR ) – Parabolic SAR adapted as trailing stop loss.
For ATR , you can use the “ATR Trailing Stop Multiplier” parameter to set an initial offset for trailing stop loss.
Take Profit Target:
- Average True Range (ATR) – ATR % stop as trailing stop loss.
- Standard % – Percent as target profit
For ATR , you can use the “ATR Take Profit Multiplier” parameter to set an initial offset for trailing stop loss.
Additional feature include:
- Regular and Hidden Divergence display and alerts
STRATEGY ONLY:
- Set back test date range
- Set trade direction - Long, Short or Both
- Use timed exit - Select method and bars
- Method 1: Exit after specified number of bars.
- Method 2: Exit after specified number of bars, ONLY if position is currently profitable.
- Method 3: Exit after specified number of bars, ONLY if position is currently losing.
TradingView Links:
Alerts:
MACD:
How to use:
1. Apply the script by browsing through Indicators --> Invite-Only scripts and select the indicator
2. Once loaded, click the gear (settings) button to select/adjust the parameters based on your preference.
3. Wait for the next BUY or SELL signal to enter the trade!
Disclaimer:
The indicator and signals generated do not constitute investment advice; are provided solely for informational purposes and therefore is not an offer to buy or sell a security; are not warranted to be correct, complete or accurate; and are subject to change without notice.

MACD+ Strategy [SystemAlpha]This is a strategy based on MACD Oscillator . Instead of using just the normal crossovers, we use trend filters, trailing stop loss and take profit targets. This strategy was developed for crypto, forex and stocks on daily timeframe but feel free to experiment on 15 minutes or higher using heikin ashi or normal candles
In this strategy you have a choice of:
Trend Filters:
- Average Directional Index ( ADX ) – buy when price is trend is up and sell when trend is down.
- Moving Average (MA) – buy when price close above the defined moving average and sell when price close below moving average
- Parabolic SAR – buy when SAR is above price is above price and sell when SAR is below price.
- All - Use ADX , MA and SAR as filters
For MA Filter , you can use the “TF MA Type” and "TF MA Period" parameter to select Simple or Exponential Moving Average and length.
Stop Loss:
- Average True Range (ATR) – ATR % stop as trailing stop loss.
- Parabolic SAR ( SAR ) – Parabolic SAR adapted as trailing stop loss.
For ATR , you can use the “ATR Trailing Stop Multiplier” parameter to set an initial offset for trailing stop loss.
Take Profit Target:
- Average True Range (ATR) – ATR % stop as trailing stop loss.
- Standard % – Percent as target profit
For ATR , you can use the “ATR Take Profit Multiplier” parameter to set an initial offset for trailing stop loss.
Additional feature include:
- Regular and Hidden Divergence display and alerts
STRATEGY ONLY:
- Set back test date range
- Set trade direction - Long, Short or Both
- Use timed exit - Select method and bars
- Method 1: Exit after specified number of bars.
- Method 2: Exit after specified number of bars, ONLY if position is currently profitable.
- Method 3: Exit after specified number of bars, ONLY if position is currently losing.
TradingView Links:
Alerts:
MACD:
How to use:
1. Apply the script by browsing through Indicators --> Invite-Only scripts and select the indicator
2. Once loaded, click the gear (settings) button to select/adjust the parameters based on your preference.
3. Wait for the next BUY or SELL signal to enter the trade!
Disclaimer:
The indicator and signals generated do not constitute investment advice; are provided solely for informational purposes and therefore is not an offer to buy or sell a security; are not warranted to be correct, complete or accurate; and are subject to change without notice.

Fibonacci Bollinger Bands Strategy [QuantNomad]This strategy is modified Stanard Bollinger Bands Strategy. Instead of using standard deviation, I use a metric of how big is the range for the last X bars. Also, I’m using Fibonacci levels as multipliers for BB.
In this strategy you have a choice of 3 different Trailing Stop Loss types:
Standard % – standard percent based TSL
Fibonacci Level – close your position on another Fibonacci level or basis line of BB.
Parabolic SAR – Parabolic SAR adapted as trailing stop loss.
For Standard % and Parabolic SAR, you can use the “TSL Offset” parameter to set an initial offset for trailing stop loss.
Parameters
BB Length – Bolinger Bands Length
Fib Entry Level – Entry BB Multiplier level. Can be one of Fibonacci levels: 0.236, 0.382, 0.5, 0.618, 0.786, 1.000
Trailing SL Type – Type of Trailing Stop Loss used to close positions. Can be one of 3 types: “Standard %”, “Fibonacci Level”, “Parabolic SAR”
TSL Offset (%) – Initial offset for TSL. Applicable to “Standard %” and “Parabolic SAR”
TSL Fib Level – Fibonacci level used for “Fibonacci level” type of TSL
TSL PSAR Start / Increment / Maximum – parameters for PSAR type of TSL.
Strategy side – you can choose the side of the strategy. You can require strategy to go only Long, Short to Both sides.
From/To Day/Month/Year – you can use these parameters to set backtesting range to check the performance of your strategy on a specific range
It's a pro indicator, you can have access to it for a small fee. Link to my PRO indicators you can find in my signature.
Disclaimer
Please remember that past performance may not be indicative of future results.
Due to various factors, including changing market conditions, the strategy may no longer perform as good as in historical backtesting.
This post and the script don’t provide any financial advice.

Sandy_ATPMAfter 2 PM Breakout or Breakdown Intraday
This takes high and low of the session up to 2 PM IST and decides the Long or Short.
#Let the index/stock trade for the first 285 minutes and then use the high and low of this "285-minute range" as support and resistance levels.
#A buy signal is given when price exceeds the high of the 285-minute range after an up gap.
#A sell signal is given when price moves below the low of the 285-minute range after a down gap.
#It's a simple technique that works like a charm in many cases with proper risk management
>If you use this technique, though, a few caveats are in order to avoid whipsaws and other market traps.
>You will be Completely out from morning noise
>A breakout that extends only a tick or two can be easily reversed and trap you in a sudden loss.
>So let others take the bait at these levels, while you find pullbacks and narrow range bars for trade execution.
