Trend analysis - Take Profit (Expo)Trend analysis - Take Profit (Expo)
DESCRIPTION
Trend analysis - Take Profit (Expo) indicator is developed to visualize ‘Lock In Profits -points' in trends. It’s a necessity for a professional trader to continuously ‘Lock In Profit’ in order to grow their balance and to reduce their risk. In fact, research shows that exits have more impact on the results than any other factor (Tharp, 2006). So when the indicator shows a ‘TP’ - point, start to lock in some of your profit and continuously do so on every TP - point and exit the trade when a circle is shown.
The indicator does also visualizes the current trend by the color of the cloud. Green color = positive trend. Red color = negative trend.
The professional trader will have the possibility to adjust the sensitivity of the TP - point as well as the length of the trend calculation.
HOW TO USE
1. Use this indicator to identify when to Lock In Profits in trends.
2. Use the indicator to identify trends.
3. Use the indicator to identify a trend shift.
INDICATOR IN ACTION
BTCUSD
BTCUSD
EURUSD
BRENT
EURGBP
The indicator works with RENKO, HEIKIN ASHI and with KAGI charts as well.
I hope you find this indicator useful, and please comment or contact me if you like the script or have any questions/suggestions for future improvements. Thanks!
I will continue to work on this indicator, so please share your experience and feedback with me so that I can continuously improve it. Thanks to everyone that have contacted me regarding my scripts. Your feedback is valuable for future developments!
ACCESS THE INDICATOR
• Contact me on TradingView or use the links below
-----------------
Disclaimer
Copyright by Zeiierman.
The information contained in my scripts/indicators/ideas does not constitute financial advice or a solicitation to buy or sell any securities of any type. I will not accept liability for any loss or damage, including without limitation any loss of profit, which may arise directly or indirectly from use of or reliance on such information.
All investments involve risk, and the past performance of a security, industry, sector, market, financial product, trading strategy, or individual’s trading does not guarantee future results or returns. Investors are fully responsible for any investment decisions they make. Such decisions should be based solely on an evaluation of their financial circumstances, investment objectives, risk tolerance, and liquidity needs.
My scripts/indicators/ideas are only for educational purposes!
Wyszukaj w skryptach "profit"

Custom Profitable Moving Average CrossoverA custom version of Profitable Moving Average Crossover that shows the last estimations on profit for each crossover type and allows to set date range for analysis.

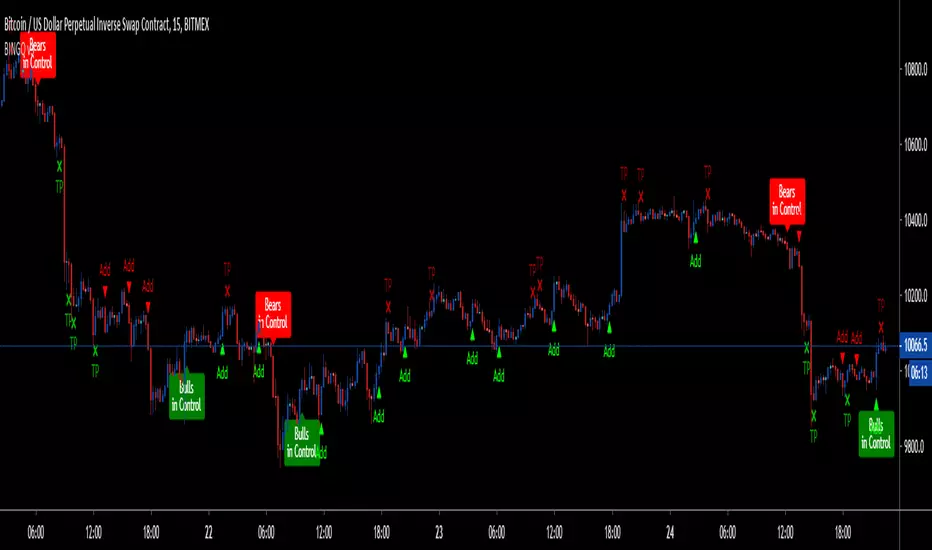
BINGO - LTF Bitmex Scalper for ETHThis is my first script which is exclusively made for ETH/USD for bitmex on 5-10min timeframe(Note: This is not for higher timeframe script, it was not designed to sustain all timeframes, but it might show some good results and you have to test it on your own). It might work for other coins, but i don't recommend it.
Its based on few parameters which I have been using to scalp ETH.
Currently its skipping few trades and exits which i will fix in sometime(getting to learn pine script), nevertheless it is by far most profitable of all my strategies.
LEGENDS:
1. Green Arrow up - Long
2. Red Arrow down - Short
3. Green TP - Take Profit for short position
4. Red TP - Take Profit for long position
If in Long postion, put STOP at low of 2nd last candle until TP1 hits. At TP1, take some profit and move stop to little above entry. Same for Short, put STOP and high of 2nd last candle until TP1 hits.
Also, it does not have alert function, so all of the trades have be manually executed. Trades are shown in chop zones as well, which will result in losses, so better use a chop indicator to avoid those trades.
Next update will have
1. FIxed missing Trades and Exits
2. Alerts
3. Improved Algo( Removal of signals in chop zone, options to have safe and risky entries, Stop placements)
4. Misc features such as, bar color change, multiple Buy/Sell(currently its alternative - Multiple means, if its a BUY and another BUY comes then it will show that too so you can add to the current trade) etc..
Just to clear my intentions, this script will be "paid only access" after next update(2-3 weeks). If you can, please tag your friends so they can benefit too. Please feel free leave a comment with all the suggestions and test results.
If you have made some money with this script, leave some tip:
BTC: 15sbDhh8t4itiFLuSTmznF87SMspvHBrDh
ETH: 0x8be1be65e9d6a167b8a4d10fda152d1d29e8e4cb
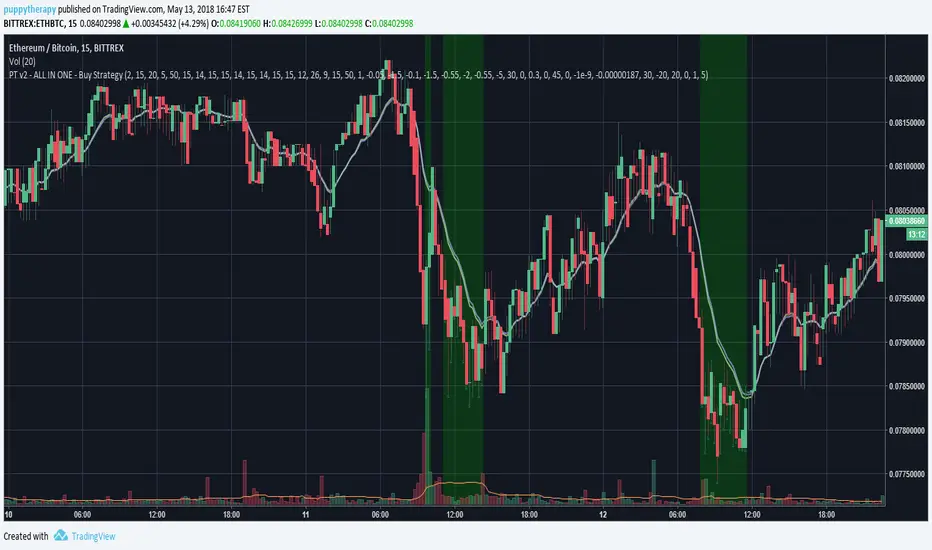
PT v2 - ALL IN ONE - Buy StrategiesBacktesting script for Profit Trailer.
It will mark with green color the area when all the strategies you select are gonna be true.
Strategy Description:
wiki.profittrailer.com
In Progress:
- OBV is still missing
- better visualisation
Bottoms Up w/ Buy and Sell AlertsBITMEX:XBTUSD
This indicator is best used on 4hr candles. It produces a buy/long and sell/short alert with pre-coded syntax for Autoview. There are four alerts total, 2 for BitMEX testnet and 2 for BitMEX (each has a buy/sell alert). The alerts are pre-coded for BitMEX
****be sure to edit the message script to your desired contract amount and leverage****
This script will also work on Profit Trailer, but you will need to change the alert message syntax to match your exchange. You will also want to adjust your bot's selling strategy to hold the coin longer. This is not a quick scalp of a coin, this is intended to buy a coin and ride its trend longer. This is more of an automated swing trader rather than a scalping opportunity like most bots use.

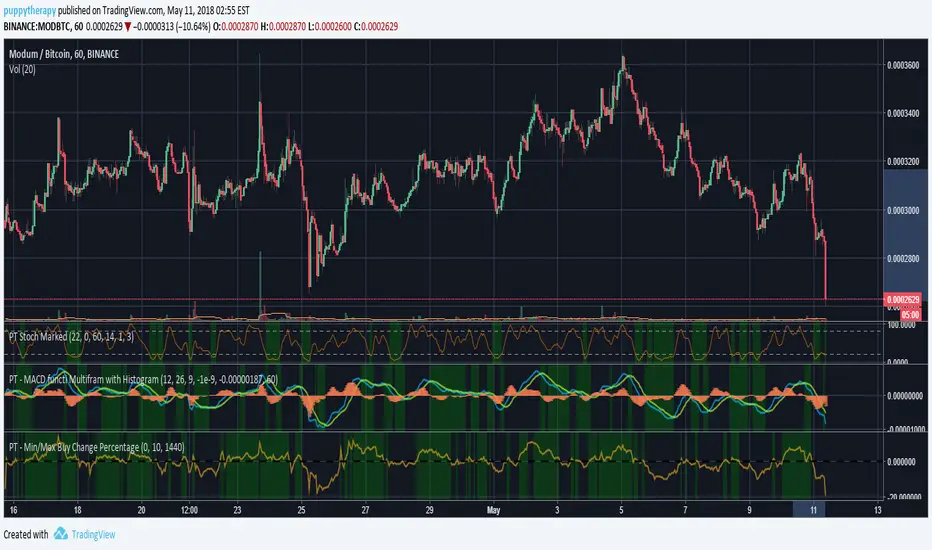
PT - Min/Max Buy Change PercentageDEFAULT_buy_min_change_percentage
Only purchase a coin if the 24 hour percentage change is above the set value.
Example:
DEFAULT_buy_min_change_percentage = 3.5 –> Only buy a coin if the 24 hour change is above 3.5%
DEFAULT_buy_min_change_percentage = -2 –> Only buy a coin if the 24 hour change is above -2%
DEFAULT_buy_max_change_percentage
Only purchase a coin if the 24 hour percentage change is below the set value.
Example:
DEFAULT_buy_max_change_percentage = 8 –> Only buy a coin if the 24 hour change is below 8%
DEFAULT_buy_max_change_percentage = -1 –> Only buy a coin if the 24 hour change is below -1%
Source Profit Trailer Wiki ( wiki.profittrailer.com )
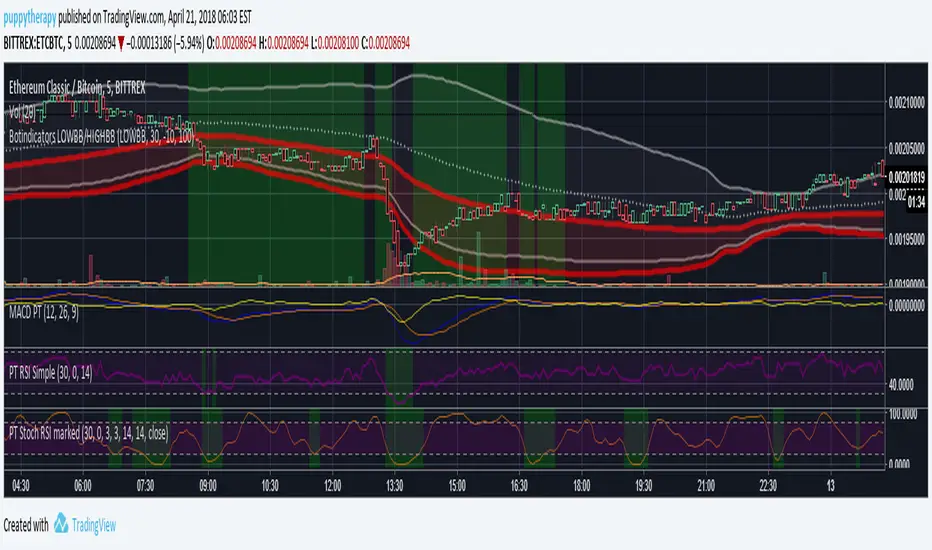
PT2_Stochastic RSI / MACDThis indicator is designed for use with Profit Trailer version 2 and plots the values of RSI, Stochastic, StochasticRSI and MACD.
Due to the decimal values that they all produce, There are some important things to understand before using this indicator.
In PT2, RSI and Stochastic require values between 0 and 100, but StochasticRSI requires values between 0.00 and 1.00. Because of this the following needs to be understood.
RSI:
----
The buy and sell values and limits are inputted as values between 0 and 100, but they get divided by 100 so to map alongside StochasticRSI on the indicator scale.
In other words an RSI buy value inputted as 30 will display as 0.3, but in your PT2 settings you would still input 30.
Stochastic:
-------------
Stochastic and StochasticRSI share common buy and sell value input fields for this indicator (so you can't use BOTH Stochastic and StochasticRSI at the same time, in the same indicator).
The buy and sell values and limits, need to be written as decimal values between 0.00 and 1.00 even though within the PT2 settings, Stochastic is inputted as values between 0 and 100.
So when translating values from this indicator to your PT2 settings, a Stochastic Buy Value of 0.3 in this indicator will be written in your PT2 settings as 30. Just like RSI.
StochasticRSI:
-----------------
PT2 uses StochasticRSI values between 0.00 and 1.00 (as mentioned above). It is because of this, to enable RSI and Stochastic to display together, everything is displayed using the decimal notation of between 0.00 and 1.00.
MACD:
--------
The MACD is completely different and produces a decimal value down to 9 decimal places as used in PT2, making it not compatible with the RSI and Stochastic values.
So at the top of the settings of this indicator, you need to choose which indicator you wish to view at a time (Stochastic-RSI or MACD, not both).
Also, Trading view doesn't handle negative decimals down to 9 places very well, so the Buy/Sell Value/Limit numbers you enter here will be divided by 100,000,000.
This means that if you enter a MACD Sell Value of -250 in this indicator, it gets translated to -0.000000250. This would be the decimal value you would put in your PT2 settings.
======================================================================================================================================================
I hope this indicator helps you all out, feel free to show any appreciation you have in what ever way you feel you can.
// Created 2018 - by @Squiggles#8806
// LTC Tip Jar: LX4bUBdjiRPsagUbZoAczSGgDC4YqTJL7w
======================================================================================================================================================

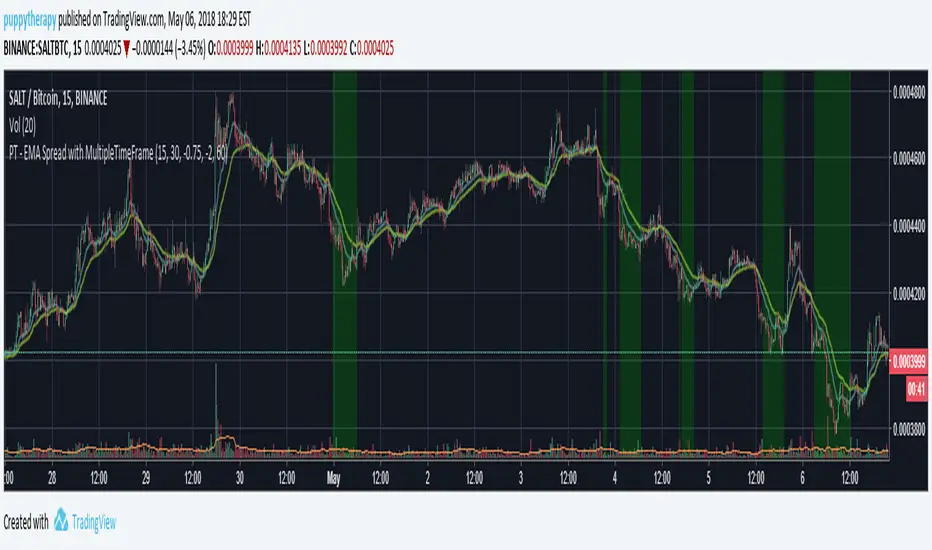
PT - EMA/SMA Spread AND Combination with MultipleTimeFrameYou can now combine multiple timeframe EMA/SMA as in profit trailer and see which areas will be then used for PT if you for example use a 15 minute EMASpread and 60 minute Spread.
- From what i can see the lowes the timeframe the faster it reacts but a lot of times you will get stuck with a bag due to a coin having 2 drops. Thiw might help you find a sweetspot so that you can picky only the high reward low risk trades.

PT - SMA Spread with MultipleTimeFrameSMA Spread for profit Trailer with multiple time frame support.

PT - EMA Spread with MultipleTimeFrameEMA Spread for profit Trailer with multiple time frame support.
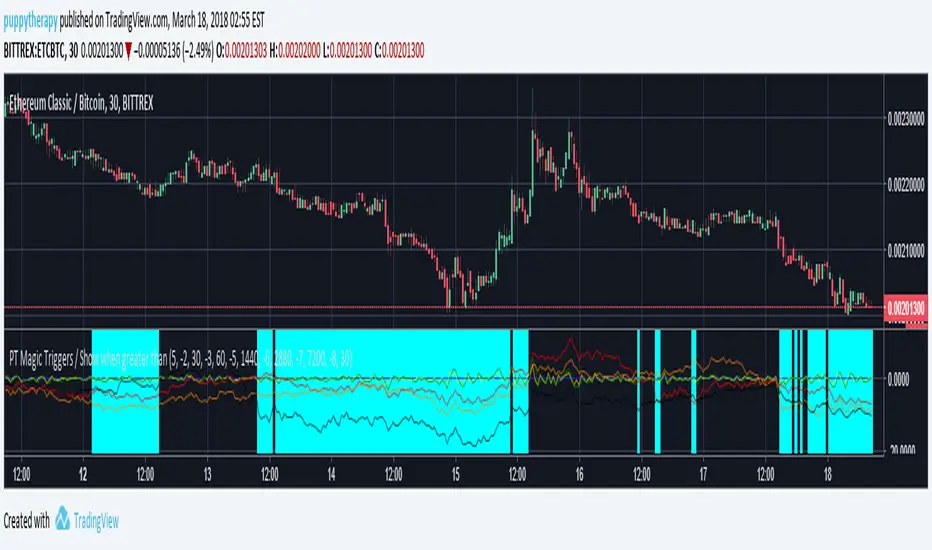
PTM Triggers AND/OR with OffTriggers 2.0This script is for Profit trailer addon PT Magic . If you are familiar it will help you.
So i decided to consolidate it a bit and made one script for all possible conditions that there are.
You have to add the script and set the trigger as you want them you then have a selection of AND / OR condition between the triggers and a number fo Triggers you want to apply. Casue you still can use 8 triggers but you dont have to 8 is the maximum i will not be adding more since that would be overoptimizing the strategy.
YOU will the get a nice indicator on the bottom showing the price change momentu for each trigger you defined. If you added the Minchange / Maxchange percentages right the are the trigger will apply on will be marked aqua. if you are using just one of those MinChange / Maxchange please add a masive number so that all will be taken into considerations. The basic rule is script always expects a number.
After that i added the the possibility of Offtriggers. It is very useful in scenarios as you have a coin in a long term downtrend but the moment you see the coin finding a bottom you will use the offtrigger. You have option to turn it OFF as defaul or again AND / OR conditions with the number of triggers you are using again max 8.
- do not foget the candlesize when changing the timeframe
- not all conditions you can create make sense think about them a before saying it does not work
- if you are happy follow / comment


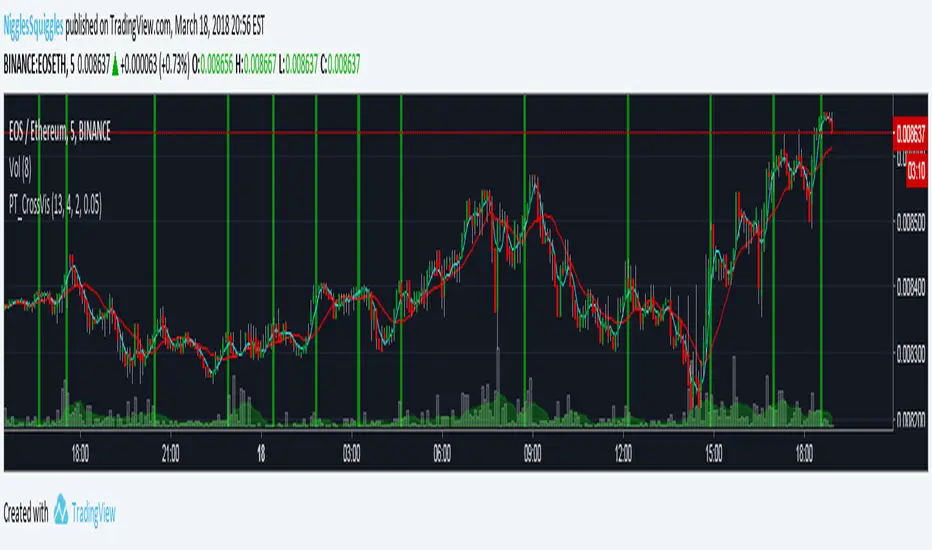
PT_MA Cross VisualiserThis indicator is designed for use with Profit Trailer's CROSS strategies.
The user can select either EMA or SMA averages and input their own buy value settings.
PT_MA_GAIN_VisualiserThis indicator is designed for use with Profit Trailer's GAIN strategies.
The user can select either EMA or SMA averages and input their own buy value settings.
It incorporates trailing values, either manual trailing values or automatically calculated values based on volatility.

PT_maSpreadThis indicator is designed for use with Profit Trailer's SPREAD strategies.
The user can select either EMA or SMA averages and input their own buy value settings.
It incorporates trailing values, either manual trailing values or automatically calculated values based on volatility.

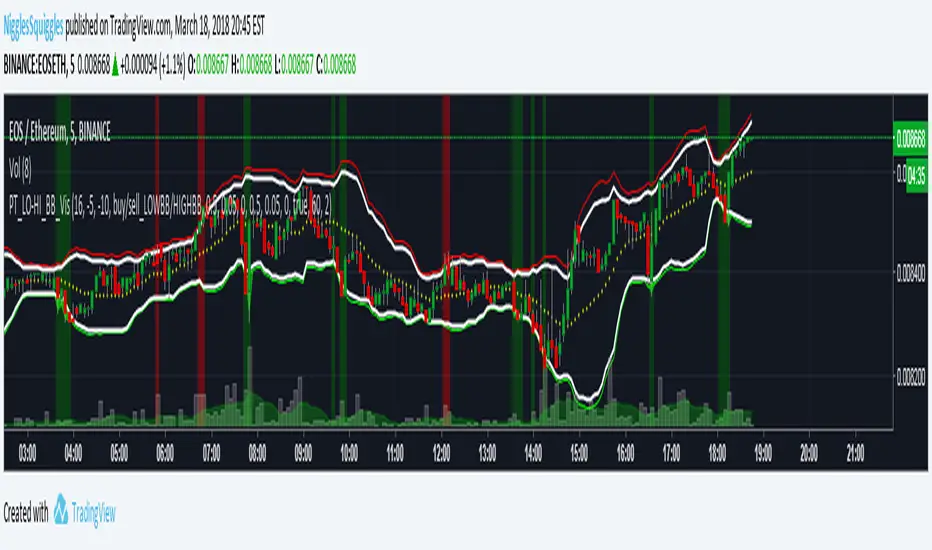
PT_LOW-HIGH BB VisualiserThis Bollinger Band indicator is customised for use with Profit Trailer.
It incorporates the various strategies (High BB, Low BB) and allows you to plot out your buy and sell values to see where your targets relate to price.
It incorporates trailing values, either manual trailing values or automatically calculated values based on volatility.
PT Magic Triggers - When smaller than Trend Value ( SOM )PTM Script for Profit trailer if you dont know what it is dont read :)
I just wanted to roll this out ASAP there will be no detailed description.
If the value is smaller then your defined Trend value it will make the background aqua.( Basically you want to be defensive in those areas ) Multiple logical conditions OR /AND combined are beeing worked on.
If questions i will try to answer them here in hour build factory discord.
discord.gg
TrendShikari NTS - StudyTrendShikari NTS is a Nifty Index, Swing trading system with great profitability. This is the STUDY file for you to generate E-mail / SMS signal alerts (based on your TV plan) and to see crisp and clear graphical Daily trade level plotting. For seeing backtest results and next day trading levels in advance use the STRATEGY file from indicator library. Access to this system will be limited. See my profile status field to see how you can gain access.
Salient Features
1. Daily Bar System. System analyzes a Daily chart of NIFTY to give signals with average holding period of 5 days.
2. Automatic Long and Short signal generation. No need to draw waves / lines and other fancy stuff on your charts to analyze NIFTY any more.
3. Backtester Results Available - Thanks to TradingView, backtest results for previous years (from 1990) are available right in the charting platform for NIFTY.
Having a good trading system is one thing and trading it to make money is a whole different ball game. One thing you must always do if you want to mimic the backtest results in live trading is to follow the rules mentioned below as if your life depends on it.
Trading Rules
1. Each day the system gives you a Long and Short trading level. You go Long on NIFTY when the Daily Long level is breached and you go Short on NIFTY when the Daily Short Level is breached.
2. Trade using Nifty Options, In the Money calls, one strike below the nearest strike price for going Long using Call Option or one strike above the nearest strike price for going Short using Put Option.
3. Preset exit and entry orders of appropriate option contracts every day at market open. To set the levels see the difference in Nifty spot price and the trading levels given by system and then multiply it with 0.8 to give an approximate order trigger price in both directions for the corresponding option contracts.
4. Book profit when Nifty moves significantly along signal direction. Every time NIFTY moves 100 points in your direction you exit the current option contract and enter a trade in the next strike price in the same direction.
5. Rollover before expiry. Its important that you rollover (ideally one day before the expiry day) your Option contact positions by exiting the current month contract and take a new position in the next month contract of the same type and strike price of the current month contract.
6. Trade only Nifty using this system. Also Daily chart has to be used for trading. System parameters have been tested and optimized for Nifty Index Daily patterns only and hence is likely to give stated results with Nifty Daily chart only.
7. Trade all signals. Don't pick and choose or add your own or someone else's analysis to filter the signals. Take confidence from the objective backtest results and not any subjective interpretations.
8. Trade with only that amount of money you can afford to loose. Initial capital that you need to have to trade one lot of NIFTY Option using this system should be at least INR 150000. You need only INR 7500 - 15000 to open a position and the rest is the margin of safety you need to have in your trading account to account for drawdowns in trading. You can add the capital in a staggered need to basis to your trading account. But make sure you have the initial capital mentioned above at your disposal, if need be.
As always your thoughts and inputs are welcome. Happy Trading !!!

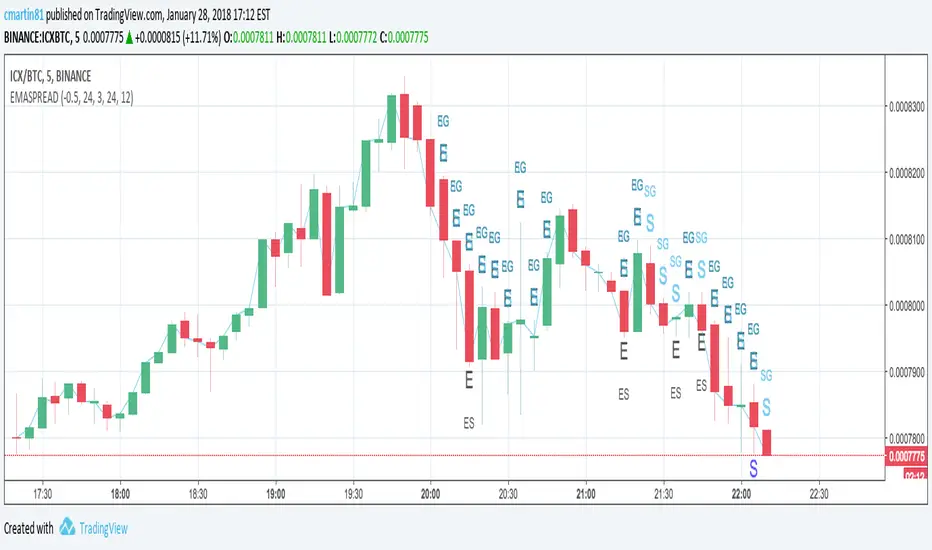
EMASPREAD - SMASPREAD - EMAGAIN - SMAGAIN for profit trailerYou can turn on and off EMASPREAD - SMASPREAD - EMAGAIN - SMAGAIN
Play with the different indicators and see how it will affect the buy trigger.
Trailing is not implemented!
This is still a work in progress. Please leave a comment if you are liking what you see :)
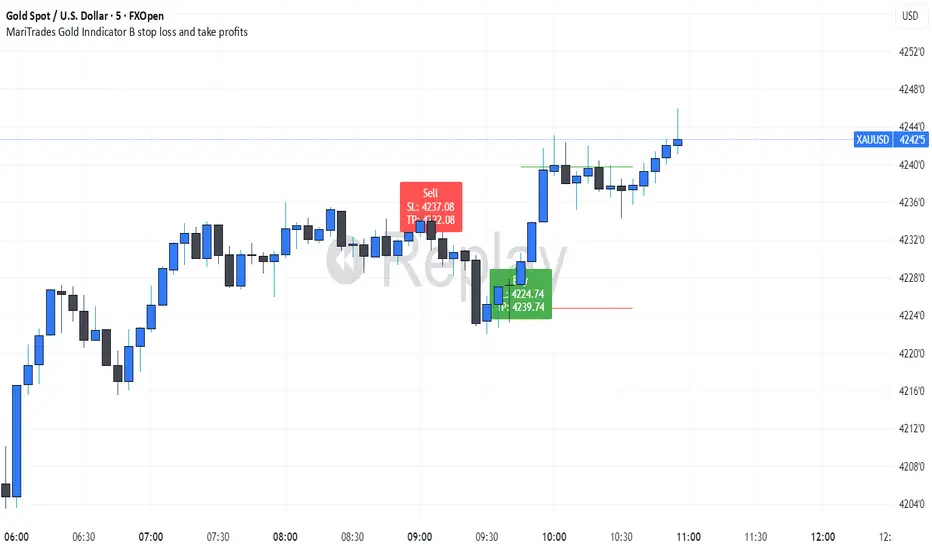
MariTrades Gold Indicator B-Stop loss and Take profitsThe MariTrades Gold Indicator B is an original Trading View script designed to help traders visualize entry points, stop loss (SL), take profit (TP), and key structure levels on gold charts. This publication fully complies with Trading View’s public script rules, including originality, English description, chart clarity, and Pine Script v5 usage.
Key Features:
Break of Structure (BOS) Detection:
Detects trend reversals by identifying when price closes above/below the previous swing high/low.
BOS signals are marked on the chart for both buy and sell opportunities.
Fibonacci Retracement Levels:
Automatically plots retracements from the last swing high to swing low.
(NOT LABELLED)
Entry signals are confirmed when price retraces to these levels after BOS.
Automatic SL and TP Visualization:
Stop loss and take profit levels are drawn directly on the chart.
Default values: SL = 5 pips, TP = 10 pips (customizable via inputs).
Entry Signals:
Buy: Price breaks structure (BOS) and retraces to Fibonacci level → label and lines drawn.
Sell: Price breaks structure (BOS) and retraces to Fibonacci level → label and lines drawn.
Clean, readable chart overlay:
Previous signals are automatically removed to avoid clutter.
SL lines in red, TP lines in green, entry labels clearly displayed.
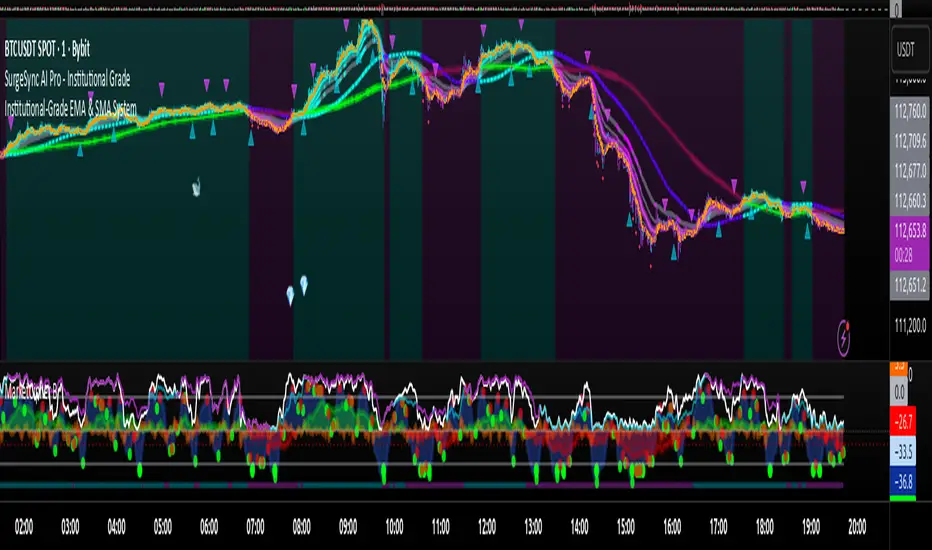
Proteus EMA SystemInstitutional-Grade EMA System
Overview and Originality
The Institutional-Grade EMA System is an advanced, multi-layered Exponential Moving Average (EMA) overlay indicator designed to provide institutional-level trend analysis, market regime identification, and trade signal generation. Unlike standard multi-EMA scripts that simply plot averages and basic crossovers, this indicator introduces a proprietary integration of features tailored for professional traders: customizable presets that dynamically adjust EMA lengths for specific trading styles (e.g., scalping vs. position trading), multiple selectable trend detection algorithms (including a unique multi-bar slope analysis with percentage-based strength thresholding), EMA alignment and confluence detection for spotting high-conviction trends and reversal zones, volume-based signal filtering, and a comprehensive statistics dashboard for real-time market insights.
What makes this script original and worthy of closed-source protection is the bespoke combination of these elements into a cohesive system. For instance, while basic EMA ribbons or trend coloring exist in other indicators, this script's trend detection goes beyond simple comparisons by incorporating a normalized slope percentage calculation (detailed below) to quantify trend strength on a 0-100% scale, integrated with EMA stacking checks and confluence thresholds. This proprietary logic—refined through extensive backtesting on diverse assets—allows for nuanced market regime classification (e.g., "Strong Uptrend" only when alignment, slope strength, and volume align), which isn't replicated in open-source alternatives. The closed-source format protects the exact orchestration of these algorithms, including custom threshold derivations and dashboard computations, preventing direct replication while allowing users full access to the tool's outputs. If published open-source, the unique mathematical formulations (e.g., slope-to-strength mapping) could be easily copied, diminishing its edge in competitive trading environments.
This indicator draws conceptual inspiration from institutional trend-following systems (e.g., those using multiple time-horizon EMAs like in hedge fund models), but enhances them with modern Pine Script capabilities for visual and analytical depth. It's particularly useful for traders seeking to reduce false signals in volatile markets by requiring multi-factor confluence.
What It Does
Core EMA Plotting and Visualization: Plots up to 7 EMAs (5 primary + 2 optional) with dynamic coloring based on detected trend direction and strength (strong bullish: bright green; weak: faded green; neutral: gray; etc.). Includes EMA ribbons (fills between consecutive EMAs) and clouds (broader fills between non-consecutive EMAs) to visualize trend expansion/contraction.
Trend Detection and Strength: Classifies trends as strong/weak bullish/bearish or neutral using user-selectable methods, with optional volume confirmation to filter low-conviction moves.
Advanced Analytics:
Detects EMA alignment (all EMAs stacked in ascending/descending order for bullish/bearish trends).
Identifies EMA confluence zones (tight clustering of EMAs, signaling potential reversals or consolidations).
Draws dynamic support/resistance lines from the nearest EMAs relative to price.
Signals and Alerts: Generates buy/sell signals on customizable EMA crossovers, only if volume thresholds are met. Includes alerts for crossovers, alignments, confluences, and regime shifts.
User Interface Enhancements: Background coloring for quick trend bias (e.g., green for uptrends, yellow for confluences), dynamic line widths (thicker for slower EMAs), trend state labels, and a table-based dashboard displaying metrics like market regime, trend strength percentage, EMA slopes in degrees, price distances to key EMAs, volume status, and alignment state.
Customization Presets: Pre-configured EMA lengths for Scalping (short, reactive: e.g., 5/8/13), Day Trading (balanced: 9/21/50), Swing Trading (medium-term: 20/50/100), Position Trading (long-term: 50/100/150), or fully custom.
The result is a versatile tool that adapts to any timeframe or asset, helping traders identify high-probability setups by combining trend momentum, volume, and EMA dynamics.
How It Works: Underlying Concepts and Calculations
Without revealing the full implementation, here's a transparent overview of the key concepts and methodologies to help users understand the indicator's logic:
EMA Calculation and Presets: EMAs are computed using standard exponential smoothing (weighting recent prices more heavily). Presets optimize lengths based on trading horizon—shorter for scalping to capture quick reversals, longer for position trading to filter noise. For example, Swing preset uses 20/50/100/150/200 to balance short-term pullbacks with long-term trends, derived from Fibonacci-inspired progressions for natural market rhythm alignment.
Trend Detection Methods: Users select from four algorithms for flexibility:
Multi-Bar Slope (Default): Calculates the average slope over a lookback period (e.g., 3 bars) as (current EMA value - EMA value ) / lookback. Normalizes to a percentage relative to the EMA value: slope_percent = (slope / EMA) * 100. Thresholds classify trends (e.g., >0.05% = strong bullish; 0.01-0.05% = weak; symmetric for bearish). This method draws from linear regression concepts but simplifies for real-time use, providing robust trend quantification over simple bar-to-bar changes.
Previous Bar: Compares current EMA to the prior bar's, with percentage change thresholds (e.g., >0.1% = strong) for quick momentum shifts.
EMA vs EMA: Measures the percentage difference between fast and slow EMAs (e.g., >2% = strong bullish), inspired by MACD-like divergence but applied directly to EMAs.
Price Position: Gauges price's percentage distance from the EMA (e.g., >1% above = strong bullish), similar to envelope channels but integrated into trend coloring.
Trend strength is further scored (0-100%) by averaging absolute slopes of key EMAs, scaled for dashboard display.
Volume Confirmation: Uses a simple moving average of volume over a user-defined length (default 20), requiring current volume to exceed it by a multiplier (default 1.2x) for signal validation. This filters out low-volume fakeouts, akin to institutional volume-weighted strategies.
EMA Alignment: Checks if all visible EMAs are in strict order (fastest highest in uptrends, lowest in downtrends) by iterating through active EMAs and verifying sequential relationships. Signals "ALIGNED" shapes when true, indicating stacked trends like in ribbon strategies but with programmatic validation.
EMA Confluence: Computes the average of active EMAs, then measures the maximum percentage deviation of any EMA from this average. If below a threshold (default 0.5%), marks a "CONFLUENCE ZONE" box, conceptually similar to Bollinger Band squeezes but applied to EMA clusters for reversal anticipation.
Market Regime Classification: Combines alignment, trend score (>30% for "strong"), and price position relative to slowest EMA. For example, bullish alignment + high score = "Strong Uptrend"; close clustering = "Consolidation". This heuristic draws from regime-switching models in quantitative finance.
Signals and Visuals: Crossovers between user-selected EMAs (e.g., fast #1 over slow #2) plot "BUY/SELL" shapes only if volume-confirmed. Ribbons use color fills (green/red) based on EMA order; background shades reflect regime; S/R lines extend from max/min EMAs below/above price over a lookback (default 50 bars).
These calculations ensure the indicator provides actionable, multi-confirmed insights rather than generic plots.
How to Use It
Setup: Add to your chart and select a preset (e.g., "Swing Trading" for 1H-4H charts). Customize trend method (start with "Multi-Bar Slope" for accuracy), enable volume filter for reliability, and toggle visuals like ribbons or dashboard.
Trend Following: In a "Strong Uptrend" (green background, upward slopes >30%, bullish alignment), go long above the fastest EMA. Use S/R lines for stops (below nearest support EMA).
Swing Trading Example: On a daily SPX chart with Swing preset:
Wait for "Weak Uptrend" transition to "Strong" (trend score >50%, positive slopes, volume spike).
Enter long on EMA1 (20) crossing EMA2 (50), confirmed by "BUY" signal.
Target next resistance EMA (e.g., 150), exit on bearish crossover or confluence zone (yellow box signaling potential top).
Risk: Stop below EMA3 (100); aim for 2:1 reward:risk on multi-day holds.
Scalp Trading Example: On a 5-min BTCUSD chart with Scalping preset:
Focus on quick "Weak Bullish" shifts (faded green EMAs, slope >0.01%).
Buy on EMA1 (5) crossing EMA3 (13) with high volume (>1.5x avg).
Scalp 0.2-0.5% gains, exit at slope flattening (dashboard shows <30% strength) or nearest resistance.
Avoid confluences (chop); use 1-min for entries, 15-min for bias.
General Tips:
Combine with price action (e.g., candlestick patterns at confluence zones).
Backtest presets on your asset—adjust thresholds for volatility (e.g., tighter confluence for forex).
Use alerts for hands-off monitoring; multi-timeframe analysis enhances accuracy (higher TF for regime, lower for signals).
For ranging markets ("Neutral" regime), fade extremes near S/R zones.
Examples for Swing Trading
Swing trading focuses on capturing medium-term moves (days to weeks) in trending markets. Use the "Swing Trading" preset, which sets EMAs to 20, 50, 100, 150, 200, 75, 125—balancing sensitivity and smoothness.
Bullish Setup Example: On a daily chart of AAPL, wait for a "Strong Uptrend" regime (green background, bullish alignment label, trend strength >50%). Enter long on a valid bullish crossover (green "BUY" circle) between EMA1 (20) and EMA2 (50), confirmed by high volume. Set stop below nearest support EMA (e.g., EMA3 at 100), target 2-3x risk or next resistance. Hold until bearish crossover or alignment breaks.
Bearish Setup Example: On a 4H chart of EURUSD, spot a "Strong Downtrend" (red background, bearish alignment). Short on a bearish crossover (red "SELL") between EMA1 and EMA3, with volume confirmation. Stop above nearest resistance EMA, exit on confluence zone (yellow) signaling potential reversal.
Tip: Focus on alignments for trend confirmation—avoid trading against them. Use confluence zones as profit-taking areas in ranging markets.
Examples for Scalp Trading
Scalping targets quick, short-term trades (minutes to hours) on lower timeframes. Select the "Scalping" preset for shorter EMAs (5, 8, 13, 21, 34, 55, 89) to catch rapid moves.
Bullish Setup Example: On a 1-min chart of BTCUSD, look for "Weak Uptrend" (faded green background, positive slopes). Enter long on a fast crossover (e.g., EMA1 over EMA2) with high volume and no confluence (avoid chop). Scalp for 0.5-1% gain, exit on slope flattening or bearish cross. Use tight stops below the fastest EMA.
Bearish Setup Example: On a 5-min chart of TSLA, identify "Weak Downtrend" (faded red). Short on a crossover between EMA2 and EMA3, confirmed by volume spike. Target small moves (e.g., 10-20 pips), exit at nearest support EMA or if trend strength drops below 30%.
Tip: Prioritize "Multi-Bar Slope" detection for quick trend shifts. Disable background if it's distracting; focus on crossovers and volume for high-frequency entries. Avoid during confluences, as they signal choppy conditions.
This detailed approach ensures traders can replicate setups while appreciating the indicator's original value. Feedback welcome—let's refine trading edges together!