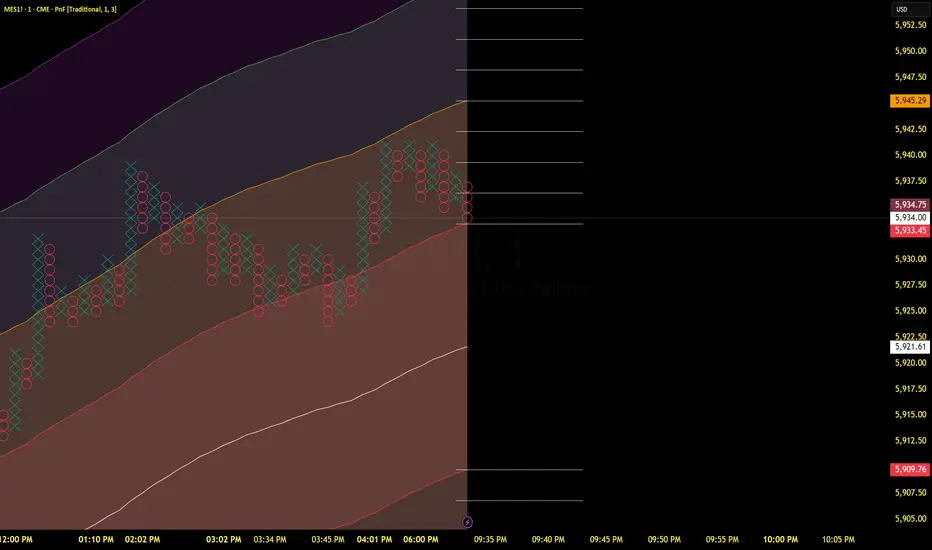
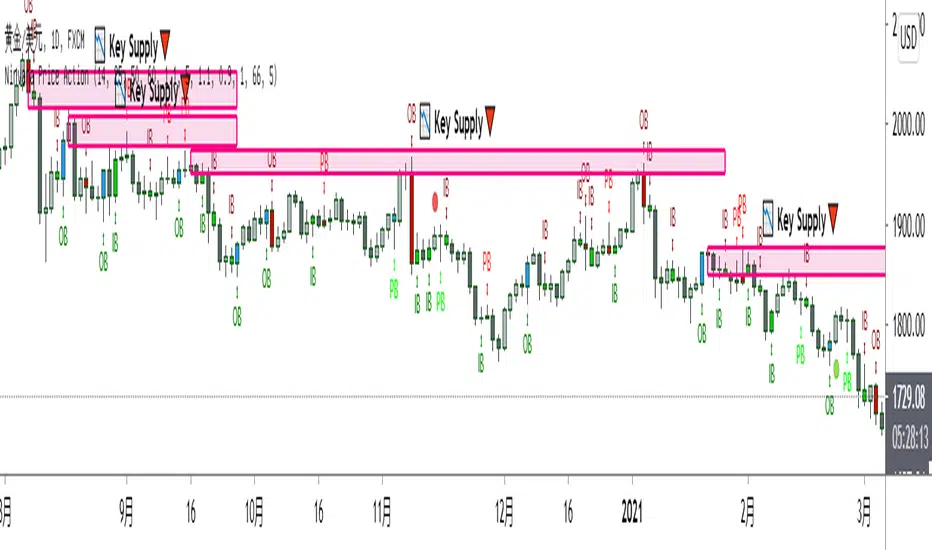
Previous Price Action## Previous Price Action - Market Structure Visualization Tool
**Three time-segmented boxes for enhanced market structure analysis:**
🟢 **240 Candles Box (Green)** - Historical context (candles -240 to -120)
🟡 **120 Candles Box (Yellow)** - Medium-term trend (candles -120 to -10)
🔴 **10 Candles Box (Red)** - Recent price action (last 10 candles)
**Key Features:**
- Non-overlapping time segments for clear trend analysis
- Uniform height based on 240-candle range for easy comparison
- 50% transparency to maintain chart readability
- Ideal for identifying momentum vs mean reversion conditions
**Perfect for:**
- Crypto day trading and scalping
- Market regime identification (trending vs choppy)
- Entry timing and trade management
- Duration of trend analysis
**Settings:** Fully customizable colors, transparency, and individual box toggle switches.
Wyszukaj w skryptach "price action"

TCT - Envelope MatrixTCT - Envelope Matrix
A powerful multi-envelope indicator that creates a comprehensive price channel system with 4 customizable envelopes and multiple intermediate levels for precise price action analysis.
Key Features:
• 4 customizable envelopes with adjustable percentages (0.2%, 0.4%, 0.6%, 0.8% by default)
• Optional EMA or SMA basis calculation
• Color-coded bands for easy visual identification
• Automatic horizontal lines showing current band values
• Midpoint lines between adjacent bands
• Additional 25%, 50%, and 75% levels between each band pair
The indicator provides:
- Clear visual representation of price channels
- Multiple support and resistance levels
- Dynamic price boundaries that adapt to market conditions
- Enhanced precision with intermediate levels between bands
Perfect for:
• Identifying potential support and resistance zones
• Spotting overbought/oversold conditions
• Finding potential reversal points
• Analyzing price volatility and channel width
• Making informed trading decisions based on price position relative to multiple bands
Customization Options:
• Adjustable length for the basis calculation
• Choice between EMA and SMA
• Customizable colors for each envelope
• Flexible percentage settings for each band
• Optional basis line color adjustment
This indicator is particularly useful for traders who want to analyze price action within multiple dynamic channels and identify potential trading opportunities based on price interactions with various support and resistance levels.
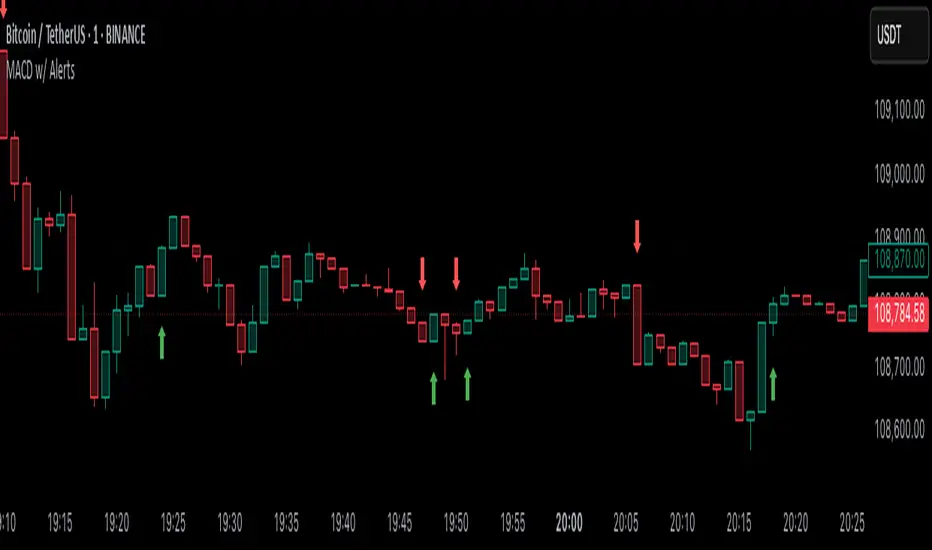
MACD Crossover with Price Action and AlertsThe MACD should use the default parameters (12, 26, 9) for fast EMA, slow EMA, and signal EMA, respectively, applied to the Close price. Instead of simple MACD crossovers, the indicator should analyze price action in relation to the MACD histogram to generate signals. Specifically: 1. BUY signal: Generate a buy signal (an up arrow displayed below the low of the signal bar in green color) when the MACD histogram crosses above zero AND the price action shows a bullish engulfing pattern (the current candle's body completely engulfs the previous candle's body). 2. SELL signal: Generate a sell signal (a down arrow displayed above the high of the signal bar in red color) when the MACD histogram crosses below zero AND the price action shows a bearish engulfing pattern (the current candle's body completely engulfs the previous candle's body). The arrows should be non-repainting, meaning that once an arrow is plotted on a bar, it should not disappear or change position as the chart updates. The indicator should also plot the MACD line, signal line, and histogram using their default calculations. The MACD line should be blue, the signal line should be orange, and the histogram should be displayed using green bars for positive values and red bars for negative values. The indicator should also have customizable inputs for the MACD fast EMA period, slow EMA period, signal EMA period and engulfing pattern check enabled/disabled. If engulfing pattern check disabled, the indicator will generate signals based only on MACD histogram crossing zero.
Velez Price Action Signals (with 20 & 200 SMA)Velez Price Action Signals – With 20 & 200 SMA Overlay
This TradingView Pine Script is a clean and powerful reversal signal tool inspired by Oliver Velez’s price action philosophy, enhanced with trend context via two Simple Moving Averages.
🔍 Signal Logic
Buy Signal:
Current candle sweeps below the previous 5-bar low (liquidity grab).
Candle is bullish (close > open).
The lower wick is significantly larger than the body (e.g. ratio > 1.5).
Sell Signal:
Current candle sweeps above the previous 5-bar high.
Candle is bearish (close < open).
The upper wick is significantly larger than the body.
Signals appear as BUY/SELL labels on the chart (non-repainting).

ULTIMATE Price Action Oscillator with Volume-Based S/R - MehtaULTIMATE Price Action Oscillator with Volume-Based S/R (UPO-PRO-VOL)
Key Features:
Smart Oscillator: Combines price action momentum with customizable smoothing.
Volume-Confirmed S/R: Identifies high-confidence Support/Resistance levels when price crosses above-average volume.
Real-Time Tracking: Displays S/R levels with timestamps (IST) in a clean table.
Visual Alerts: Dashed lines + labels mark key levels for easy spotting.
⚠️ STRONG DISCLAIMER
❌ This indicator is for educational purposes only.
❌ Not financial advice. Trading involves risk—always conduct your own analysis.
❌ No guarantee of accuracy. Past performance ≠ future results.
❌ Adjust settings carefully. Test in a demo account first.
❌ Volume thresholds may vary by asset. Customize Volume Threshold Multiplier as needed.
📝 How to Use:
S/R Signals: Green "S" = Support (oscillator crosses up with high volume). Red "R" = Resistance (oscillator crosses down with high volume).
Table: Tracks latest S/R prices and formation time (IST).
Tweak Settings: Adjust Oscillator Length, Smoothing, and Volume Threshold for your trading style.
Tip: Combine with trend analysis for higher-probability trades!
Script Settings (Default):
Oscillator Length: 5 (Can be adjusted upto a maximum value of 200)
Smoothing: 3
S/R Lookback: 100 bars
Volume Threshold: 1.5x avg volume
Guntavnook Katta - Price Action PROOverview:
This script is designed to provide traders with a structured, multi-layered view of market behavior. It combines three key components - trend direction analysis, oscillator-based pattern recognition, and projected candle visualization - to help identify meaningful setups and anticipate potential price movements. Additionally, it includes an automated system for plotting multi-level support and resistance zones using swing logic, making it valuable for both discretionary traders and those developing rule-based or semi-systematic frameworks.
Purpose:
The primary purpose of this tool is to empower traders with a structured, multi-dimensional analysis tool that combines both quantitative signals and visual interpretation. Rather than relying on fixed indicators or static strategies, this script allows users to understand the evolving nature of price action through a lens of historical behavior, oscillator dynamics, and market trend context.
It is especially useful for traders who value context-driven decision making - those who prefer to look beyond raw signals and study the sequence of conditions that preceded past price moves, enabling them to better anticipate future possibilities.
Core Logic:
The script brings together three independently developed analytical engines, each built on custom logic and refined through real-market application. Unlike traditional tools that rely on fixed indicator crossovers or rigid rules, this script focuses on pattern dynamics, contextual interpretation, and forward-looking structure - giving it a distinct edge in adapting to different market conditions.
Trend Engine (Volatility-Adjusted Slope Framework):
A moving average alone doesn't reveal much - it’s the slope of the moving average compared against a volatility-normalized threshold that gives meaning. This engine calculates the SMA slope across a user-defined window and dynamically adjusts the threshold using ATR-based volatility. The result: a more adaptive classification of trend into Uptrend, Downtrend, or Sideways, designed to reduce noise and align with real momentum shifts.
Pattern Detection Engine (Zone-Based Signature Matching):
Rather than comparing raw oscillator values, this system maps them into discrete behavioral zones, then tracks their sequential patterns. The most recent pattern is then scanned across historical data to detect exact zone signatures - a method that captures rhythm and structure rather than simple threshold breaks. When a match is found, the script projects what happened next by scaling and rendering those historical candles as projected candle visuals on the current chart - offering a clear and proportionate view of possible price behavior.
Support & Resistance Engine (Tiered Swing-Based Projection):
This module detects significant turning points using user-defined swing lengths, and automatically extends multi-level support and resistance zones (1x, 2x, 3x) into the future. These levels are not based on arbitrary highs/lows, but on tiered confirmation across timeframes, making them highly useful for anticipating potential reaction zones in both trending and consolidating phases.
Together, these components work in sync to offer a layered, context-rich view of price behavior - allowing traders to make better-informed decisions, whether they’re seeking confirmation, confluence, or clarity.
This script is not a signal generator - it is a decision-support tool that allows traders to study market structure in a deeper, more structured way.
It helps answer three essential trading questions:
* What is the current market trend?
* Have similar oscillator-based patterns occurred before, and what followed?
* Where are the likely support and resistance zones based on recent swings?
Key Functional Blocks:
1 - Trend Analysis Using SMA Slope Logic
The script calculates a Simple Moving Average (SMA) over a user-defined period. It compares the slope of this SMA over a second window of candles.
The slope is measured as a percentage and compared against a dynamic threshold derived from price volatility (using ATR).
The market is categorized into:
Uptrend
Downtrend
Sideways
This classification appears in a dedicated trend table at the top-right of the chart, along with the selected oscillator and relevant settings.
2 - Oscillator Pattern Matching Engine
You can select from a variety of studies:
RSI
CCI
Stochastic
Ultimate Oscillator
Money Flow Index
Chande Momentum Oscillator
Relative Volatility Index
The selected oscillator values are converted into different zones. The system continuously monitors the recent pattern of these zones and checks if it matches any past sequence.
Once a historical match is detected:
A message appears in the trend table confirming a match.
The script then activates the projected candle visualization, showing how price behaved after that historical pattern.
3 - Projected Candle Visualization Engine
This feature helps you visualize how price moved historically after a matching oscillator pattern.
How it works:
It retrieves the actual candles that followed the matching pattern in history.
These candles are then scaled relative to the current price to maintain proportional movement.
Candles are drawn using box objects to replicate historical price bars with visual clarity.
Candle color logic is based on oscillator zone at that moment in history -
Green: When the selected oscillator was in an overbought zone (e.g., RSI > 70)
Red: When the selected oscillator was in an oversold zone (e.g., RSI < 30)
Gray: When the selected oscillator was in a neutral zone
This lets traders see:
What happened previously after a similar condition
The general path price followed
Where potential turning points or continuation zones may lie
4 - Multi-Level Dynamic Support & Resistance
Support and resistance levels are drawn based on swing highs and lows across three levels:
You enter an initial swing length (e.g., 10 candles)
The system calculates:
Swing 2 = 2x
Swing 3 = 3x
From there, the indicator detects recent high/low turning points and draws horizontal lines that extend into the future:
R1, R2, R3 (if available) for resistance
S1, S2, S3 (if available) for support
This creates a forward-looking price structure, helping you prepare for reaction zones.
Example Use Cases
Intraday Traders (Best suited for lower timeframes):
This script is particularly effective for intraday traders operating on lower timeframes. It identifies repeating oscillator zone patterns that often precede short-term price movements. When a historical match is found, the projected candles display how price moved in similar situations, offering an immediate visual reference for possible price behavior. Combined with dynamically generated support and resistance zones, the tool adds structure to fast-paced decision-making — helping traders define entries, exits, and stop placements more confidently.
While lower timeframes offer the best responsiveness, the script can be applied across other intraday intervals depending on trading style.
Positional Traders (Best suited for higher timeframes):
For positional traders, this script provides a powerful framework to evaluate whether the current setup mirrors past conditions that led to extended moves. The projected candles show how price evolved after similar oscillator patterns in the past, allowing traders to assess potential directional strength. The trend classification engine and swing-based support/resistance zones further assist in planning position entries, managing holding periods, and identifying key structural levels.
Although higher timeframes offer deeper context for positional trading, the tool remains effective across other multi-day or weekly views as well.
Disclaimer
This script is intended for educational and informational purposes only. It does not provide any form of investment advice, trade recommendations, or performance guarantees. All tools and projections included are meant to support learning and market analysis.
The word “PRO” in the script title refers to a professional-grade analytical tool and should not be interpreted as a claim of profitability or advisory capability.
This script has been developed for use within structured educational environments and is not intended to function as a trading signal or advisory service. Please consult a qualified financial advisor or licensed professional before making any investment decisions.

Volume Profile + Price Action Strategy (POC-based)This indicator combines volume dynamics, price action patterns, and a simplified Point of Control (POC) to highlight potential high-probability trade zones.
🔍 Key Features
POC-Based Logic
Plots the POC from the most recent closed 10-minute candle as a horizontal level for intraday structure.
Volume Spike Detection
Highlights unusual activity based on volume compared to the average of the last N candles.
Effort vs. Result Analysis
Based on Wyckoff-inspired logic:
Absorption: Large volume, small body → possible buyer/seller absorption
False Move: Small volume, large body → potential fakeout
Price Action Recognition Detects:
Inside Bars
Pin Bars
Engulfing Candles
Signal Highlights
🔺 Absorption Signals (below bar, teal triangle)
🔻 False Move Signals (above bar, orange triangle)
🔷 POC Line
⚙️ Customizable Inputs
You can control signal sensitivity with these inputs:
Volume Spike Multiplier
Raise to filter only extreme volume spikes
→ Recommended: 2.0 to 3.0 for cleaner setups
Absorption Body Ratio
Lower to detect only very small bodies (tight candles)
→ Try 0.3 to 0.4 for stricter absorption logic
False Move Body Ratio
Raise to catch only large candles on low volume
→ Use 2.0+ to filter weak moves
🧠 How to Use
Use in confluence with:
Support/Resistance
VWAP or moving averages
Session opens/closes
Best on 10-minute charts, but adjustable
✅ Signal Tuning Tips
Want fewer but cleaner signals?
Increase Volume Spike Multiplier: 2.5+
Decrease Absorption Body Ratio: 0.3
Increase False Move Ratio: 2.0+
Want more frequent signals?
Lower Volume Multiplier: 1.2–1.5
Raise Absorption Ratio: 0.6+
Lower False Move Ratio: 1.2–1.4
📊 Recommended Timeframe
Optimized for 10-minute charts
Works intraday, especially around session opens and POC re-tests
⚠️ Disclaimer
This script is for educational and informational purposes only. It does not constitute financial advice or a recommendation to buy or sell any asset. Past performance is not indicative of future results. Always do your own research and consult a licensed financial advisor before making trading decisions.
Use at your own risk.

ICT & RTM Price Action IndicatorICT & RTM Price Action Indicator
Unlock the power of precision trading with this cutting-edge indicator blending ICT (Inner Circle Trader) concepts and RTM (Reversal Trend Momentum) strategies. Designed for traders who demand clarity in chaotic markets, this tool pinpoints high-probability buy and sell signals with surgical accuracy.
What It Offers:
Smart Supply & Demand Zones: Instantly spot key levels where the market is likely to reverse or consolidate, derived from a 50-period high/low analysis.
Filtered Reversal Signals: Say goodbye to fakeouts! Signals are confirmed with volume spikes (1.5x average) and a follow-through candle, ensuring you trade only the strongest moves.
Trend-Aware Logic: Built on a customizable SMA (default 14), it aligns reversals with momentum for trades that stick.
One-Signal Discipline: No clutter—only the first valid signal appears until an opposing setup triggers, keeping your chart clean and your focus sharp.
Combined Power: A unique "TRADE" signal merges ICT zones with RTM reversals for setups with double the conviction.
Why You’ll Love It:
Whether you’re scalping intraday or hunting swing trades, this indicator adapts to your style. It’s not just another tool—it’s your edge in decoding price action like a pro. Test it, tweak it, and watch your trading transform.

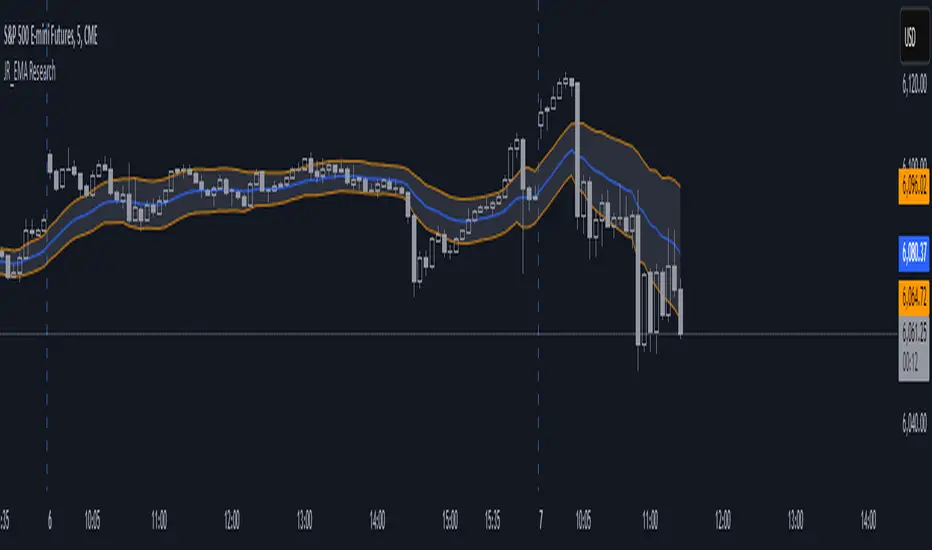
EMA Study Script for Price Action Traders, v2JR_EMA Research Tool Documentation
Version 2 Enhancements
Version 2 of the JR_EMA Research Tool introduces several powerful features that make it particularly valuable for studying price action around Exponential Moving Averages (EMAs). The key improvements focus on tracking and analyzing price-EMA interactions:
1. Cross Detection and Counting
- Implements flags for crossing bars that instantly identify when price crosses above or below the EMA
- Maintains running counts of closes above and below the EMA
- This feature helps students understand the persistence of trends and the frequency of EMA interactions
2. Bar Number Tracking
- Records the specific bar number when EMA crosses occur
- Stores the previous crossing bar number for reference
- Enables precise measurement of time between crosses, helping identify typical trend durations
3. Variable Reset Management
- Implements sophisticated reset logic for all counting variables
- Ensures accuracy when analyzing multiple trading sessions
- Critical for maintaining clean data when studying patterns across different timeframes
4. Cross Direction Tracking
- Monitors the direction of the last EMA cross
- Helps students identify the current trend context
- Essential for understanding trend continuation vs reversal scenarios
Educational Applications
Price-EMA Relationship Studies
The tool provides multiple ways to study how price interacts with EMAs:
1. Visual Analysis
- Customizable EMA bands show typical price deviation ranges
- Color-coded fills help identify "normal" vs "extreme" price movements
- Three different band calculation methods offer varying perspectives on price volatility
2. Quantitative Analysis
- Real-time tracking of closes above/below EMA
- Running totals help identify persistent trends
- Cross counting helps understand typical trend duration
Research Configurations
EMA Configuration
- Adjustable EMA period for studying different trend timeframes
- Customizable EMA color for visual clarity
- Ideal for comparing different EMA periods' effectiveness
Bands Configuration
Three distinct calculation methods:
1. Full Average Bar Range (ABR)
- Uses the entire range of price movement
- Best for studying overall volatility
2. Body Average Bar Range
- Focuses on the body of the candle
- Excellent for studying conviction in price moves
3. Standard Deviation
- Traditional statistical approach
- Useful for comparing to other technical studies
Signal Configuration
- Optional signal plotting for entry/exit studies
- Helps identify potential trading opportunities
- Useful for backtesting strategy ideas
Using the Tool for Study
Basic Analysis Steps
1. Start with the default 20-period EMA
2. Observe how price interacts with the EMA line
3. Monitor the data window for quantitative insights
4. Use band settings to understand normal price behavior
Advanced Analysis
1. Pattern Recognition
- Use the cross counting system to identify typical pattern lengths
- Study the relationship between cross frequency and trend strength
- Compare different timeframes for fractal analysis
2. Volatility Studies
- Compare different band calculation methods
- Identify market regimes through band width changes
- Study the relationship between volatility and trend persistence
3. Trend Analysis
- Use the closing price count system to measure trend strength
- Study the relationship between trend duration and subsequent reversals
- Compare different EMA periods for optimal trend following
Best Practices for Research
1. Systematic Approach
- Start with longer timeframes and work down
- Document observations about price behavior in different market conditions
- Compare results across multiple symbols and timeframes
2. Data Collection
- Use the data window to record significant events
- Track the number of bars between crosses
- Note market conditions when signals appear
3. Optimization Studies
- Test different EMA periods for your market
- Compare band calculation methods for your trading style
- Document which settings work best in different market conditions
Technical Implementation Notes
This tool is particularly valuable for educational purposes because it combines visual and quantitative analysis in a single interface, allowing students to develop both intuitive and analytical understanding of price-EMA relationships.
SCE Price Action SuiteThis is an indicator designed to use past market data to mark key price action levels as well as provide a different kind of insight. There are 8 different features in the script that users can turn on and off. This description will go in depth on all 8 with chart examples.
#1 Absorption Zones
I defined Absorption Zones as follows.
//----------------------------------------------
//---------------Absorption---------------------
//----------------------------------------------
box absorptionBox = na
absorptionBar = ta.highest(bodySize, absorptionLkb)
bsab = ta.barssince(bool(ta.change(absorptionBar)))
if bsab == 0 and upBar and showAbsorption
absorptionBox := box.new(left = bar_index - 1, top = close, right = bar_index + az_strcuture, bottom = open, border_color = color.rgb(0, 80, 75), border_width = boxLineSize, bgcolor = color.rgb(0, 80, 75))
absorptionBox
else if bsab == 0 and downBar and showAbsorption
absorptionBox := box.new(left = bar_index - 1, top = close, right = bar_index + az_strcuture, bottom = open, border_color = color.rgb(105, 15, 15), border_width = boxLineSize, bgcolor = color.rgb(105, 15, 15))
absorptionBox
What this means is that absorption bars are defined as the bars with the largest bodies over a selected lookback period. Those large bodies represent areas where price may react. I was inspired by the concept of a Fair Value Gap for this concept. In that body price may enter to be a point of support or resistance, market participants get “absorbed” in the area so price can continue in whichever direction.
#2 Candle Wick Theory/Strategy
I defined Candle Wick Theory/Strategy as follows.
//----------------------------------------------
//---------------Candle Wick--------------------
//----------------------------------------------
highWick = upBar ? high - close : downBar ? high - open : na
lowWick = upBar ? open - low : downBar ? close - low : na
upWick = upBar ? close + highWick : downBar ? open + highWick : na
downWick = upBar ? open - lowWick : downBar ? close - lowWick : na
downDelivery = upBar and downBar and high > upWick and highWick > lowWick and totalSize > totalSize and barstate.isconfirmed and session.ismarket
upDelivery = downBar and upBar and low < downWick and highWick < lowWick and totalSize > totalSize and barstate.isconfirmed and session.ismarket
line lG = na
line lE = na
line lR = na
bodyMidpoint = math.abs(body) / 2
upWickMidpoint = math.abs(upWickSize) / 2
downWickkMidpoint = math.abs(downWickSize) / 2
if upDelivery and showCdTheory
cpE = chart.point.new(time, bar_index - 1, downWickkMidpoint)
cpE2 = chart.point.new(time, bar_index + bl, downWickkMidpoint)
cpG = chart.point.new(time, bar_index + bl, downWickkMidpoint * (1 + tp))
cpR = chart.point.new(time, bar_index + bl, downWickkMidpoint * (1 - sl))
cpG1 = chart.point.new(time, bar_index - 1, downWickkMidpoint * (1 + tp))
cpR1 = chart.point.new(time, bar_index - 1, downWickkMidpoint * (1 - sl))
lG := line.new(cpG1, cpG, xloc.bar_index, extend.none, color.green, line.style_solid, 1)
lE := line.new(cpE, cpE2, xloc.bar_index, extend.none, color.white, line.style_solid, 1)
lR := line.new(cpR1, cpR, xloc.bar_index, extend.none, color.red, line.style_solid, 1)
lR
else if downDelivery and showCdTheory
cpE = chart.point.new(time, bar_index - 1, upWickMidpoint)
cpE2 = chart.point.new(time, bar_index + bl, upWickMidpoint)
cpG = chart.point.new(time, bar_index + bl, upWickMidpoint * (1 - tp))
cpR = chart.point.new(time, bar_index + bl, upWickMidpoint * (1 + sl))
cpG1 = chart.point.new(time, bar_index - 1, upWickMidpoint * (1 - tp))
cpR1 = chart.point.new(time, bar_index - 1, upWickMidpoint * (1 + sl))
lG := line.new(cpG1, cpG, xloc.bar_index, extend.none, color.green, line.style_solid, 1)
lE := line.new(cpE, cpE2, xloc.bar_index, extend.none, color.white, line.style_solid, 1)
lR := line.new(cpR1, cpR, xloc.bar_index, extend.none, color.red, line.style_solid, 1)
lR
First I get the size of the wicks for the top and bottoms of the candles. This depends on if the bar is red or green. If the bar is green the wick is the high minus the close, if red the high minus the open, and so on. Next, the script defines the upper and lower bounds of the wicks for further comparison. If the candle is green, it's the open price minus the bottom wick. If the candle is red, it's the close price minus the bottom wick, and so on. Next we have the condition for when this strategy is present.
Down delivery:
Occurs when the previous candle is green, the current candle is red, and:
The high of the current candle is above the upper wick of the previous candle.
The size of the current candle's top wick is greater than its bottom wick.
The total size of the previous candle is greater than the total size of the current candle.
The current bar is confirmed (barstate.isconfirmed).
The session is during market hours (session.ismarket).
Up delivery:
Occurs when the previous candle is red, the current candle is green, and:
The low of the current candle is below the lower wick of the previous candle.
The size of the current candle's bottom wick is greater than its top wick.
The total size of the previous candle is greater than the total size of the current candle.
The current bar is confirmed.
The session is during market hours
Then risk is plotted from the percentage that users can input from an ideal entry spot.
#3 Candle Size Theory
I defined Candle Size Theory as follows.
//----------------------------------------------
//---------------Candle displacement------------
//----------------------------------------------
line lECD = na
notableDown = bodySize > bodySize * candle_size_sensitivity and downBar and session.ismarket and barstate.isconfirmed
notableUp = bodySize > bodySize * candle_size_sensitivity and upBar and session.ismarket and barstate.isconfirmed
if notableUp and showCdSizeTheory
cpE = chart.point.new(time, bar_index - 1, close)
cpE2 = chart.point.new(time, bar_index + bl_strcuture, close)
lECD := line.new(cpE, cpE2, xloc.bar_index, extend.none, color.rgb(0, 80, 75), line.style_solid, 3)
lECD
else if notableDown and showCdSizeTheory
cpE = chart.point.new(time, bar_index - 1, close)
cpE2 = chart.point.new(time, bar_index + bl_strcuture, close)
lECD := line.new(cpE, cpE2, xloc.bar_index, extend.none, color.rgb(105, 15, 15), line.style_solid, 3)
lECD
This plots candles that are “notable” or out of the ordinary. Candles that are larger than the last by a value users get to specify. These candles' highs or lows, if they are green or red, act as levels for support or resistance.
#4 Candle Structure Theory
I defined Candle Structure Theory as follows.
//----------------------------------------------
//---------------Structure----------------------
//----------------------------------------------
breakDownStructure = low < low and low < low and high > high and upBar and downBar and upBar and downBar and session.ismarket and barstate.isconfirmed
breakUpStructure = low > low and low > low and high < high and downBar and upBar and downBar and upBar and session.ismarket and barstate.isconfirmed
if breakUpStructure and showStructureTheory
cpE = chart.point.new(time, bar_index - 1, close)
cpE2 = chart.point.new(time, bar_index + bl_strcuture, close)
lE := line.new(cpE, cpE2, xloc.bar_index, extend.none, color.teal, line.style_solid, 3)
lE
else if breakDownStructure and showStructureTheory
cpE = chart.point.new(time, bar_index - 1, open)
cpE2 = chart.point.new(time, bar_index + bl_strcuture, open)
lE := line.new(cpE, cpE2, xloc.bar_index, extend.none, color.red, line.style_solid, 3)
lE
It is a series of candles to create a notable event. 2 lower lows in a row, a lower high, then green bar, red bar, green bar is a structure for a breakdown. 2 higher lows in a row, a higher high, red bar, green bar, red bar for a break up.
#5 Candle Swing Structure Theory
I defined Candle Swing Structure Theory as follows.
//----------------------------------------------
//---------------Swing Structure----------------
//----------------------------------------------
line htb = na
line ltb = na
if totalSize * swing_struct_sense < totalSize and upBar and downBar and high > high and showSwingSturcture and session.ismarket and barstate.isconfirmed
cpS = chart.point.new(time, bar_index - 1, high)
cpE = chart.point.new(time, bar_index + bl_strcuture, high)
htb := line.new(cpS, cpE, xloc.bar_index, color = color.red, style = line.style_dashed)
htb
else if totalSize * swing_struct_sense < totalSize and downBar and upBar and low > low and showSwingSturcture and session.ismarket and barstate.isconfirmed
cpS = chart.point.new(time, bar_index - 1, low)
cpE = chart.point.new(time, bar_index + bl_strcuture, low)
ltb := line.new(cpS, cpE, xloc.bar_index, color = color.teal, style = line.style_dashed)
ltb
A bearish swing structure is defined as the last candle’s total size, times a scalar that the user can input, is less than the current candles. Like a size imbalance. The last bar must be green and this one red. The last high should also be less than this high. For a bullish swing structure the same size imbalance must be present, but we need a red bar then a green bar, and the last low higher than the current low.
#6 Fractal Boxes
I define the Fractal Boxes as follows
//----------------------------------------------
//---------------Fractal Boxes------------------
//----------------------------------------------
box b = na
int indexx = na
if bar_index % (n * 2) == 0 and session.ismarket and showBoxes
b := box.new(left = bar_index, top = topBox, right = bar_index + n, bottom = bottomBox, border_color = color.rgb(105, 15, 15), border_width = boxLineSize, bgcolor = na)
indexx := bar_index + 1
indexx
The idea of this strategy is that the market is fractal. It is considered impossible to be able to tell apart two different time frames from just the chart. So inside the chart there are many many breakouts and breakdowns happening as price bounces around. The boxes are there to give you the view from your timeframe if the market is in a range from a time frame that would be higher than it. Like if we are inside what a larger time frame candle’s range. If we break out or down from this, we might be able to trade it. Users can specify a lookback period and the box is that period’s, as an interval, high and low. I say as an interval because it is plotted every n * 2 bars. So we get a box, price moves, then a new box.
#7 Potential Move Width
I define the Potential Move Width as follows
//----------------------------------------------
//---------------Move width---------------------
//----------------------------------------------
velocity = V(n)
line lC = na
line l = na
line l2 = na
line l3 = na
line l4 = na
line l5 = na
line l6 = na
line l7 = na
line l8 = na
line lGFractal = na
line lRFractal = na
cp2 = chart.point.new(time, bar_index + n, close + velocity)
cp3 = chart.point.new(time, bar_index + n, close - velocity)
cp4 = chart.point.new(time, bar_index + n, close + velocity * 5)
cp5 = chart.point.new(time, bar_index + n, close - velocity * 5)
cp6 = chart.point.new(time, bar_index + n, close + velocity * 10)
cp7 = chart.point.new(time, bar_index + n, close - velocity * 10)
cp8 = chart.point.new(time, bar_index + n, close + velocity * 15)
cp9 = chart.point.new(time, bar_index + n, close - velocity * 15)
cpG = chart.point.new(time, bar_index + n, close + R)
cpR = chart.point.new(time, bar_index + n, close - R)
if ((bar_index + n) * 2 - bar_index) % n == 0 and session.ismarket and barstate.isconfirmed and showPredictionWidtn
cp = chart.point.new(time, bar_index, close)
cpG1 = chart.point.new(time, bar_index, close + R)
cpR1 = chart.point.new(time, bar_index, close - R)
l := line.new(cp, cp2, xloc.bar_index, extend.none, color.aqua, line.style_solid, 1)
l2 := line.new(cp, cp3, xloc.bar_index, extend.none, color.aqua, line.style_solid, 1)
l3 := line.new(cp, cp4, xloc.bar_index, extend.none, color.red, line.style_solid, 1)
l4 := line.new(cp, cp5, xloc.bar_index, extend.none, color.red, line.style_solid, 1)
l5 := line.new(cp, cp6, xloc.bar_index, extend.none, color.teal, line.style_solid, 1)
l6 := line.new(cp, cp7, xloc.bar_index, extend.none, color.teal, line.style_solid, 1)
l7 := line.new(cp, cp8, xloc.bar_index, extend.none, color.blue, line.style_solid, 1)
l8 := line.new(cp, cp9, xloc.bar_index, extend.none, color.blue, line.style_solid, 1)
l8
By using the past n bar’s velocity, or directional speed, every n * 2 bars. I can use it to scale the close value and get an estimate for how wide the next moves might be.
#8 Linear regression
//----------------------------------------------
//---------------Linear Regression--------------
//----------------------------------------------
lr = showLR ? ta.linreg(close, n, 0) : na
plot(lr, 'Linear Regression', color.blue)
I used TradingView’s built in linear regression to not reinvent the wheel. This is present to see past market strength of weakness from a different perspective.
User input
Users can control a lot about this script. For the strategy based plots you can enter what you want the risk to be in percentages. So the default 0.01 is 1%. You can also control how far forward the line goes.
Look back at where it is needed as well as line width for the Fractal Boxes are controllable. Also users can check on and off what they would like to see on the charts.
No indicator is 100% reliable, do not follow this one blindly. I encourage traders to make their own decisions and not trade solely based on technical indicators. I encourage constructive criticism in the comments below. Thank you.

Salman Indicator: Multi-Purpose Price ActionSalman Indicator: Multi-Purpose Price Action Tool for Pin Bars, Breakouts, and VWAP Anchoring
This indicator provides a comprehensive suite of price action insights, designed for active traders looking to identify key market structures and potential reversals. The script incorporates a Quarterly VWAP for trend bias, marks pin bars for possible reversal points, highlights outside bars for volatility signals, and indicates simple breakouts and pivot-level breaks. Customizable settings allow for flexibility in various trading styles, with default settings optimized for daily charts.
Outside Bars : Represented by an ⤬ symbol on the chart, these indicate bars where the current high is greater than the previous bar’s high, and the low is lower than the previous bar’s low, signaling high volatility and potential market reversals.
Pin Bars : Denoted by a small dot at the top or bottom of a candle’s wick, these are crucial signals of potential reversal areas. Pin bars are identified based on the percentage length of their shadows, with adjustable strictness in settings.
Quarterly VWAP : The light blue line on the chart represents the VWAP (Volume-Weighted Average Price), which is anchored to the Quarterly period by default. The VWAP acts as a directional bias filter, helping you to determine underlying market trends. This period, source, and offset are fully adjustable in the script’s settings.
Simple Breaks : Hollow candles on the chart indicate "simple breaks," defined when the current bar closes above the previous high or below the previous low. This is an effective way to highlight directional momentum in the market.
Bonus Pivot Breaks : The tilde symbol ~ appears when the price closes above or below prior pivot high/low levels, helping traders spot significant breakout or breakdown points relative to recent pivots.
Alerts
Simple Breaks : Alerts you when a breakout occurs beyond the previous bar’s high or low. Pin Bars : Notifies you of potential reversal points as indicated by bullish or bearish pin bars. Outside Bars : Triggers an alert whenever an outside bar is detected, indicating possible volatility changes.
How to Use
VWAP for Trend Bias : Use the Quarterly VWAP line to gauge overall market trend, with settings that allow adjustment to daily, weekly, monthly, or even larger time frames.
Pin Bars for Reversal Potential : Look for the dot markers on candle wicks, where the strictness of the pin bar detection can be adjusted via settings to match your trading preference.
Simple and Pivot Breaks for Momentum : Watch for hollow candles and the tilde symbol ~ as indicators of potential breakout momentum and pivot break levels, respectively.
This script can serve traders on multiple timeframes, from daily to weekly and beyond. The flexible configuration allows for adjustments in VWAP anchoring and pin bar criteria, providing a tailored fit for individual trading strategies.

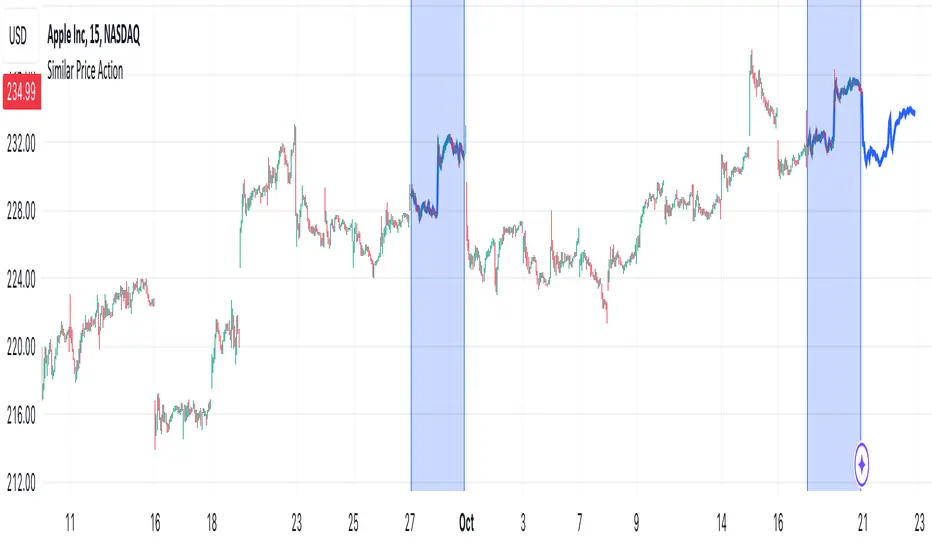
Similar Price ActionDescription:
The indicator tries to find an area of N candles in history that has the most similar price action to the latest N candles. The maximum search distance is limited to 5000 candles. It works by calculating a coefficient for each candle and comparing it with the coefficient of the latest candle, thus searching for two closest values. The indicator highlights the latest N candles, as well as the most similar area found in the past, and also tries to predict future price based on the latest price and price directly after the most similar area that was found in the past.
Inputs:
- Length -> the area we are searching for is comprised of this many candles
- Lookback -> maximum distance in which a similar area can be found
- Function -> the function used to compare latest and past prices
Notes:
- The indicator is intended to work on smaller timeframes where the overall price difference is not very high, but can be used on any
Fibonacci + Support/Resistant + Trendline (Price action)This is opening source code version: Fibonacci + Support/Resistant + Trendline (One of Advanced Price action Analysis).
How it works:
It find entry Long/Short by combining: Fibonacci + Support/Resistant + Trendline
1. Find Impulse wave:
To findind Impulse wave, It uses Pivot High/Low to find Impulse wave. In case find entry Long, If having Pivot High higher Pivot High before, it will draw an Impulse wave.
2. Find entry at Fibonacci levels:
Draw Fibonacci fibonacci retracement from Pivot Low to Pivot High. A Fibonacci retracement forecast is created by taking two extreme points on a chart and dividing the vertical distance by important Fibonacci ratios. 0% is considered to be the start of the retracement, while 100% is a complete reversal to the original price before the move. Horizontal lines are drawn in the chart for these price levels to provide support and resistance levels. Common levels are 23.6%, 38.2%, 50%, and 61.8%
3. Find entry at Support/Resistant Zone:
Support/Resistant Zone drawed from Pivot High before, which price just breaken and return to retest.
4. Find entry at Trendline:
Trendline drawed from Pivot High/Low before, which price just breaken and return to retest.
How do use it:
+ You can customize the thickness of the lines.
+ You can set up an alert when the price touchs important areas.

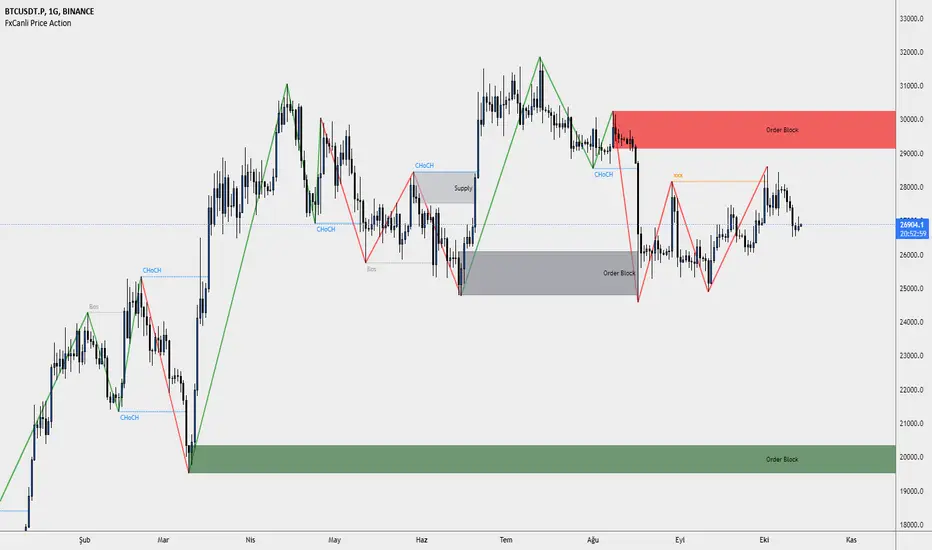
FxCanli Price ActionEN - FxCanli TradingView Price Action indicator can draw and alert at;
Break of Structure (BOS),
Change of Character (CHoCH),
Liquidity,
Order Block,
Power Zone.
TR - FxCanli TradingView Price Action indikatörü grafiklerinizde;
Break of Structure (BOS)
Change of Characte (CHoCH)
Liquidity
Order Block
Power Zone seviyelerini otomatik olarak çizer ve alarm verir.
FEATURES & EXAMPLES / ÖZELLİKLER & ÖRNEKLER
**************************************************************
Market Structure;
EN - You can easly follow market structure, Up Trend with green waves, Down trend with Red waves
TR - Market yapısını kolayca takip edebilirsiniz. Yukarı trendi yeşil dalgalar ile, Aşağı trendi kırmızı dalgalar ile.
Change of Character (CHoCH)
*************************************
EN - Shows trend reversals
TR - Trend dönüşümlerini gösterir
Break of Structure (BOS)
******************************
EN - Shows trend continuations
TR - Devam eden trendleri gösterir
Liquidity
***********
EN - Shows Liquidity levels
TR - Likidite seviyelerini gösterir
Order Block
***************
EN - Shows Order Block levels which is a technical analysis technique that tracks the accumulation of orders (when bullish) and distribution of orders (when bearish) of banks and institutional traders.
TR - Bankaların ve kurumsalların emir birikimini (yükseliş olduğunda) ve emir dağılımını (düşüş olduğunda) Order Block olarak gösterir.
PAL indicator - Price Action LinesThis is the PALindicator - this is where the price action happens, PAL stands for Price Action Lines
----------
What is this indicator showing?
- there are 4 lines to work with
- red and yellow lines represents bearish levels
- blue and green lines represents bullish levels
- you can understand this indicator as dynamic support & resistance lines
- it will show you easy to read support & resistance breakouts
- it's something between pivot points and Fibonacci Retracement lines
----------
How does this indicator work?
- as mentioned before, there are 4 lines, on my opinion the blue and the green lines show you a continuation of a bullish trend
- the yellow and the red lines show you a continuation of a bearish trend
- if your crypto pair, forex pair, stock or any other instrument close above the blue line, its an buy opportunity
- if your crypto pair, forex pair, stock or any other instrument close above the yellow line, its an sell opportunity
----------
Which timeframe you recommend?
- we recommend to use this indicator for daily timeframe
- we also recommend to use this indicator for weekly and monthly timeframe
- in the indicator settings you can change the indicator timeframe from 250 (daily chart) to 52 (weekly chart) and 12 (monthly chart)
- after changing the indicator timeframe you have to change the chart timeframe to daily, weekly or monthly
- it's also possible to use this indicator intraday, but we don't recommend to use it with instruments which you can't trade (24/5 24/7)
send me a message for a free trial

Critical Levels Mixing Price Action, Volatility and VolumeIntroduction
This indicator has the purpose of setting levels, automatically, basing its creation on three aspects of the market:
- price action
- volume
- volatility
Price Action Algorithm
I divided the candle into 3 parts:
- body => abs (close-open)
- lower tail => red candle (close-low) green candle (open-low)
- upper tail => red candle (high-open) green candle (high-close)
- total => high-low
to give the signal the following conditions must be respected
- the body must be smaller than a certain percentage ("MAX CORE SIZE%) and larger than a certain percentage (" MIN CORE SIZE%);
- furthermore, the shorter tail cannot be higher than a certain percentage ("MAXIMUM LENGTH FOR SHORTE TAIL%");
Volume Algorithm
The volume value must be greater than the volume EMA multiplied by a certain value ("Multiplier")
Volatility Algorithm
the True Range of the candle must be greater than the "ATR percentage" of the ATR
Trigger
If all these three conditions are met then and only then will the level be drawn that will include the prices of the longest tail of the candle (high/open or open/low or high/close or close/low).
How to use
Like any level, the situation in which the price is reached does not imply a market reaction, for this reason, the use together with moving averages or oscillators from which to extrapolate the divergences can be a valid tool.
Using this indicator alone you can enter the market by placing a pending order above the high or low of the candle touching the level.
Example:
a bearish candle touches a low level, we place a pending buy order above the high of the candle
a bullish candle touches a level located high, we place a pending sell order below the low of the candle
BULLSEYE BORDERS (Combined Price Action Follower)Developed for Crypto Currency Market! Use for 15 minutes period or more! Under 15 minutes, results are unpredictible.
This script had been orginized with Donchian Lines based on support and resistance levels.
Rules:
If the price is under top line, you will be ready for short position, and over the bottom line, long position.
When the price passes the red and green area you can take action and enter the trade!
Orange area refers the squeezed or floating position, so you can either stop or wait for price action!
If you see boring candles frequently, check out the last high and low levels.
If the price close to the last high, take long position. If not, short position.
Use ALMA , if you want to put and alert on script. It is identical to price line.
Thanks to @millerrh for 'Breakout Trend Follower'. Just used the last low and high features to complete the script. Combined with 'Boring Candles' from ©Prasad Raut, Modified on 20190811 (Updated to %30 full candle)
Trend Tip: You can use the script with Linear Channel so you can also see the trend. (not always)
Nirvana Price ActionYou can set it according to your own needs
The required display can be opened ☑
Do not need to display can be closed ❌
I chose to turn them on by default: inside bars ☑ pin bars ☑ price action bar names ☑ price action bars ☑
Colors can be customized
I wish you a smooth transaction!
[blackcat] L1 Stochastic J Price Action OscillatorLevel: 1
Background
The KDJ oscillator display consists of 3 lines (K, D and J - hence the name of the display) and 2 levels. K and D are the same lines you see when using the stochastic oscillator. The J line in turn represents the deviation of the D value from the K value. The convergence of these lines indicates new trading opportunities. Just like the Stochastic Oscillator, oversold and overbought levels correspond to the times when the trend is likely to reverse.
Function
L1 Stochastic J Price Action Oscillator with Long Strength Indicator use stochastic KDJ signal as input source and it combines with price action algorithm to form a brand-new oscillator which have less noise signal with a long signal strength indicator so as to alleviate inherent KDJ saturation issue.
Key Signal
cond --> buy signal condition from KDJ j value deduction
fastline --> fast line of new oscillator
slowline --> slow line of new oscillator
Pros and Cons
Pros:
1. it takes over KDJ's advantages
2. it can greatly reduce KDJ saturation issue
Cons:
1. no short entry signal is derived.
2. only long signal strength indicator is disclosed
Remarks
An improved version of KDJ with less satration observed.
Readme
In real life, I am a prolific inventor. I have successfully applied for more than 60 international and regional patents in the past 12 years. But in the past two years or so, I have tried to transfer my creativity to the development of trading strategies. Tradingview is the ideal platform for me. I am selecting and contributing some of the hundreds of scripts to publish in Tradingview community. Welcome everyone to interact with me to discuss these interesting pine scripts.
The scripts posted are categorized into 5 levels according to my efforts or manhours put into these works.
Level 1 : interesting script snippets or distinctive improvement from classic indicators or strategy. Level 1 scripts can usually appear in more complex indicators as a function module or element.
Level 2 : composite indicator/strategy. By selecting or combining several independent or dependent functions or sub indicators in proper way, the composite script exhibits a resonance phenomenon which can filter out noise or fake trading signal to enhance trading confidence level.
Level 3 : comprehensive indicator/strategy. They are simple trading systems based on my strategies. They are commonly containing several or all of entry signal, close signal, stop loss, take profit, re-entry, risk management, and position sizing techniques. Even some interesting fundamental and mass psychological aspects are incorporated.
Level 4 : script snippets or functions that do not disclose source code. Interesting element that can reveal market laws and work as raw material for indicators and strategies. If you find Level 1~2 scripts are helpful, Level 4 is a private version that took me far more efforts to develop.
Level 5 : indicator/strategy that do not disclose source code. private version of Level 3 script with my accumulated script processing skills or a large number of custom functions. I had a private function library built in past two years. Level 5 scripts use many of them to achieve private trading strategy.

APW Price ActionThis script uses floor pivots and a VIP level which is very important level from Price action point of view. These levels act as strong support and resistance levels. I Mainly use this for Banknifty:NSE but these can be used across any instrument which is can be traded. This script will be upgraded further with more price action concepts.

Kilted Price Action TraderDescription : Uses all the following indicators as a default pre-set template
1. SMA 200 (longer term for direction/trend)
2. EMA 20 (shorter term for assisting with entry)
3. EMA 50 (medium term for assisting with entry)
FEATURES
- Allows you to switch off showing moving averages and all other chart objects so that you can see price action VERY clearly
- Allows you to show the most significant bearish candle patterns (for shorts) or bullish candle patterns (for longs)
- Allows you to show the most significant bearish or bullish candle patterns relative to the longer term SMA (200 being the default)
- Allows you to show bearish and bullish candle patterns relative to the various EMAs
- Allows you to employ good trade and risk management by SCORING YOUR TRADE and allows you to tick off on some good checklist items in order before taking a trade,
showing the result on the chart as a "score ranking" (HIGH, MEDIUM, LOW) so that you can journal your trade and validate that you took a disciplined trade
SUMMARY
This is a Price Action based indicator that allows you to pickup some good default settings for any market and display the most significant candlestick patterns, with the key differentiators being:
- this indicator will show you the most significant profitable candle patterns and you can select to show bullish or bearish setups, or those relative to the longer direction SMA (shows only bullish candles when price is above SMA and only bearish candle patterns when price is below SMA - for safer trades)
- it allows you to SCORE YOUR TRADE with a pre-set checklist BEFORE taking a trade, which is especially good for any experienced trader so that you are continuing to trade your plan and plan your trade
- The scoring systems helps with journaling your trades so that you can show your trade setups and provide evidence that you followed some basic rules and discipline, assisting you to become a better trader

Histogram - Price Action - Dy CalculatorThis script aims to help users of Price Action robot, for Smarttbot (brazilian site that automates Brazilian market (B3)).
You can use on any symbol.
The script will follow price action principles. It will calculate the absolute value of last candle and compare with actual candle. Colors are:
- Red - If the actual candle absolute value is higher than previous one, and the price is lower than last candle. It would be a short entry.
- Blue - If the actual candle absolute value is higher than previous one, and the price is higher than last candle. It would be a long entry.
- Black - The actual candle absolute value is lower than previous one, so there is no entry.
If there is a candle that is higher than previous one, and both high and low values are outside boundaries of previous one, it will calculate which boundary is bigger and will apply the collor accordingly.
DH: True-Price DOTS for Heikin AshiTrue-Price DOTS for Heikin Ashi (open/close/current)
USE:
Must Set Tradingview Candle Type to Heikin Ashi.
Works on all Timeframes and symbols.
BENEFITS:
Helps keep you aware of the actual price action as you trade and historically by adding subtle DOTS and step-lines over your Heikin Ashi candles. With this indicator, you can benefit from the price averaging and smoothing effects of Heikin Ashi while benefiting from the accuracy of traditional candles and true active price levels. Helps maximize your buy and sell entries and exits.
HOW IT WORKS:
Adds true-price DOTS (showing current-price & close)
Adds STEP-LINE (showing true open) price level to Heikin Ashi candles.
DOTS will move & update on active candle with current price movement (as candle forms) . This is beneficial for accurate entry and exits during candle development period.
Option (on/off) to add current True-Price LINE (blue line) in input settings (recommended) .
NOTE:
You may need to right-click candles and arrange "visual order" so that DOTS are on top layer of chart. Otherwise some DOTS might hide behind candles.
ENJOY!
Dan Hollings
Master Crypto Grid Trader
Host of the "High Leverage Lounge"
Please Explore My Other Indicators, Scripts, Grids and Educational Ideas.
@DanHollings on Tradingview
