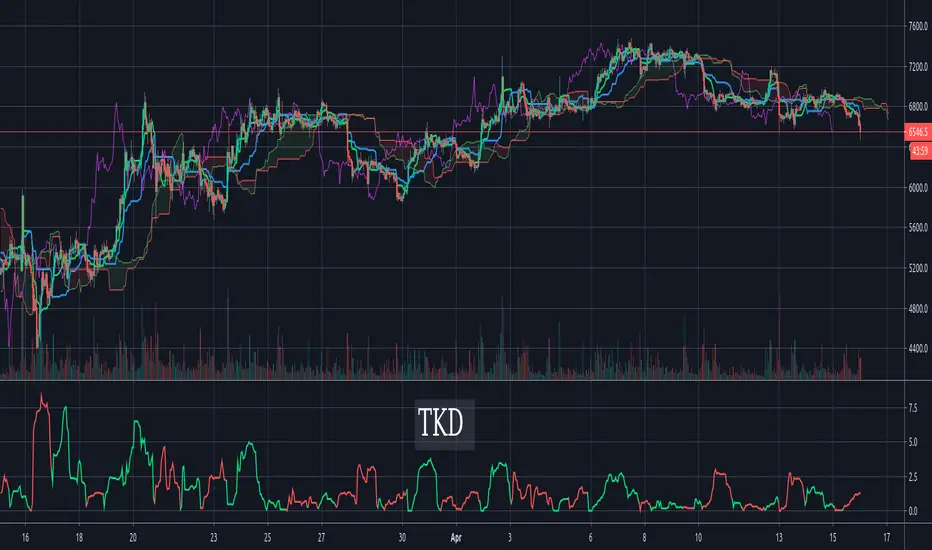
Tenkan-Sen Kijun-Sen Distance (TKD) Oscillator - IchimokuThe TKD is the distance between the Tenkan-Sen and the Kijun-Sen, expressed in percentage of current price. The further apart the tenken-sen and kijun-sen are, the more they want to snap back together. This makes for a decent oscillator. When the Tenkan-Sen is above the Kijun-Sen, the TKD is green. When it is below, the TKD is red. At the crossing points, it turns blue.
For those more familiar with Ichimoku Cloud techniques, one might also think of this indicator as a C-Clamp indicator. Bar coloring is supported and enabled by default. There's also an option to flip/invert the green/red colors in case you want to use it to judge pending cycles rather than current ones.
Wyszukaj w skryptach "oscillator"
Wave Period Oscillator by KIVANC fr3762WPO – Wave Period Oscillator
A Time Cycle Oscillator – Published on IFTA Journal 2018 by Akram El Sherbini (pages 68-77)
(http:www.ftaa.org.hk/Files/2018130101754DGQ1JB2OUG. pdf )
Bullish signals are generated when WPO crosses over 0
Bearish signals are generated when WPO crosses under 0
OverBought level is 2
OverSold level is -2
ExtremeOB level is 2.7
ExtremeOS level is -2.7
As with most oscillators, divergences can be taken advantage of.
via PROREALCODE
Here's the link to a complete list of all my indicators:
tr.tradingview.com
Şimdiye kadar Tradingview'a eklediğim tüm indikatörlerin tam listesi için:
tr.tradingview.com

derivative oscillator cuMinor modification to Everget's implementation of Constance Brown's Derivative Oscillator.
Toggles for DOSC Columns, Line, Circles
Signal line toggle
Color change
Misc. Comments + Source attribution

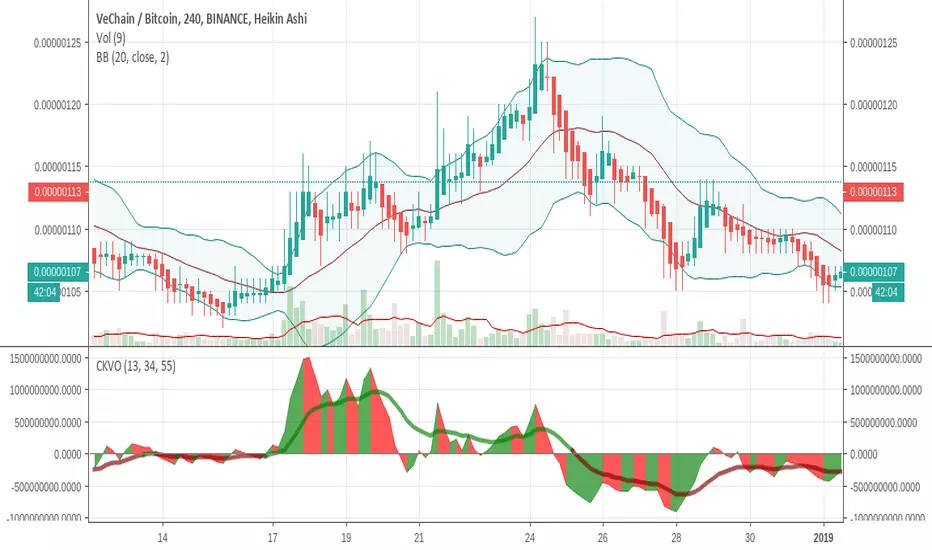
Colored Klinger Volume Oscillator (CKVO)This is a color enhanced version of Klinger Volume Oscillator. I specially designed this to get maximum profit from highly volatile coins. This indicator is based on volume.
xTrigger (the line) shows if trend is bullish or bearish. It is the average of the area. You can clearly see the trend.
xKVO (the area) shows how buy and sell orders change. It rises while buys are increasing against sells, decreases while sells are increasing against buys.
The color or the area provides buy and sell signals. Green: buy. Red: sell. Gray: Undecided.
Of course there are false signals. You should use other indicators to confirm them.
I like to use RSI and Bollinger Bands along with it to eliminate false signals. Also check for double bottom and top, etc.
Its wise to check the general direction of coin using a bigger time frame using Heikin Aishi. For example 1W Heikin Ashi if you are trading on 1D.
In addition to buy signals the most important indication is divergence with the price. Before a trend change 2 kinds of divergences happen
- Trend line moves reverse to the price line
- Are a tops moves revers to the price tops. For example while there is a higher price top, there is a lower area top. Then its time to escape.
Motivation
It is common to suffer from failures while trading highly profitable but volatile coins like NULLS, REP, DLT, LRC, MFT, HOT, OAX, KEY, etc.
- Traders sell too early to ensure a profit. Sell at 10% and it goes 200%
- Traders buy too early. Traders buy and it drops yet another 50%
- Wrong patience. The trader keeps the faith and waits for days for the glorious days. And nothing happens.
I believe with this indicator I am able to solve those problems most of the time.
Accelerator OscillatorThis indicator was originally developed by Bill M. Williams. Also known as Acceleration/Deceleration Oscillator.

Recursive Median Oscillator & Fisher Transforms RibbonThis is a composite indicator made up of:
- modifided (rescaled) version of evergets version of recursive median oscillator.
- 1996anoojpatels Futur modification of Ehlers Fisher Transform Ribbons Indicator
I think Ehlers attempts to minimise latency in indicators are extremely valuable and some of my most use trading tools. Thanks to all the authors whose iterations keep moving these indicators toward perfection. Here is my contribution.

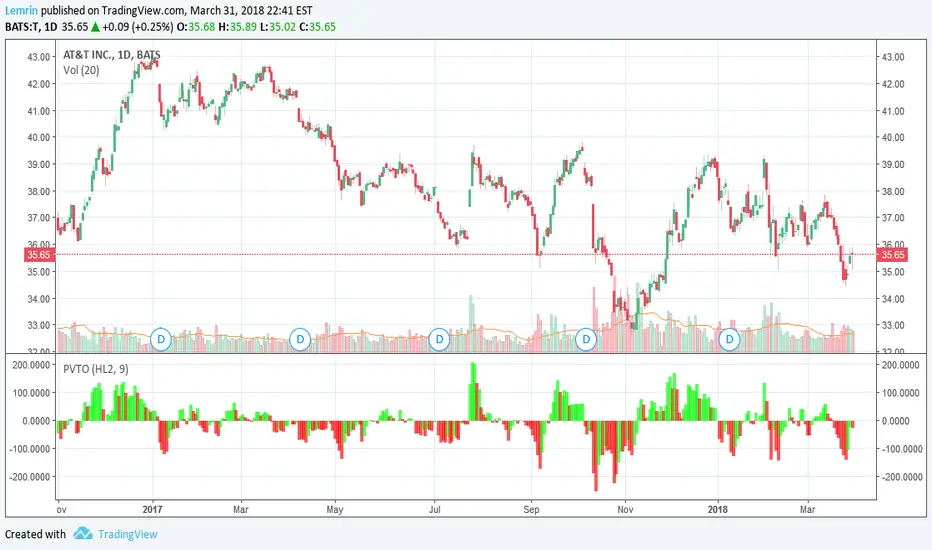
PVT OscillatorThis is the non-accumulating portion of the price-volume trend (PVT)--the amount by which PVT would change each bar--which I have turned into a zero-centered oscillator. The plot is a 9-day EMA of the PVT change, multiplied by 1000 for readability, with lime/red corresponding to whether the actual PVT increased or decreased for that bar.
As always, the length of this moving average is adjustable, as is the source of price(s) to use--open, close, high, low, HL2, HLC3, or OHLC4.
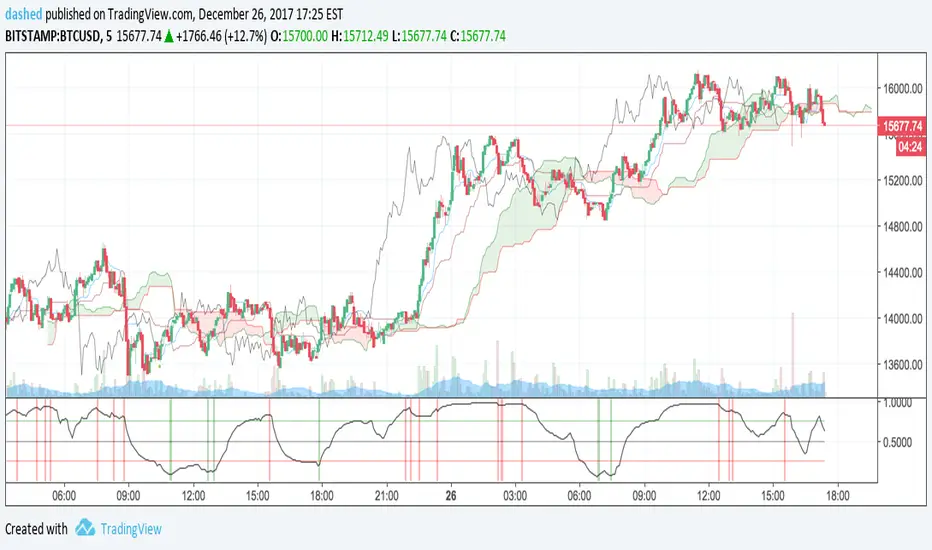
Ichimoku OscillatorIchimoku trading signals mapped to an oscillator.
Primarily to indicate bullish and bearish trends.
Forked from:
Volume Oscillators Focus IndicatorVolume Oscillators Focus Indicator
Short name VolumeFocus
This indicator seeks to show episodes of high and low volumes analyzing these by calculating three lines and create colorings on the basis of where these lines go relative to each other.
The first line is a percent based on the current volume level, for which a 3 period sma is taken.
It is calculated by using the lowest volume in the lookback as zero, the highest as 100 percent
This line is called “current volume level”
The second line is a percent, based on the median volume of the last five periods. This line is called “new normal volume”
The third line is a percent, based on the median volume of the lookback period. This is called “old normal volume”
For the second and third line the lowest “new normal volume” in the lookback is used as zero while the 100 percent level is the same as in the calculation of the first line.
The reasoning for the colors is as follows:
When both current en new normal level are below old normal, the volume is to be considered ‘low’. When volume is low, the background color is gray and the fill color between the old normal and current lines is navy.
When both current and new normal level are above old normal, the volume is to be considered ‘significantly expanded’. When this happens the fill color between current and old normal is orange.
When volume is not low it is considered normal or high and the background color is green.
The lookback is set to 50, it advise to keep it that way.
Use of the indicator.
Volume results from focus of the market on the instrument. When the price seems correct, some buy it, some sell it but most don’t care. Then the volume is low, the background is gray. The navy fill color indicates ‘how low’.
When the price seems off, many will care and start trading. Then volume is high, background is green. When the trading is really heating up the orange fill color appears, showing that the market has high focus on this instrument, perhaps move in a trend.
Of course we don’t know in which way the market tries to ‘correct’ the price, for that purpose I use this indicator together with REVE Cohorts which provide useful markers to explain what the excess volume means.
Eykpunter

SMI Ergodic Indicator + OscillatorThis indicator is one that I came across a while ago. The main way this indicator works is a lot like the True Strength Index except it also adds a signal line. I like to think of it as a faster MACD that gives you a chance to lag a little less behind the MACD. This of course comes with the additional risk of fake-outs being prevalent. The signal line in the indicator allows you to use the EMA in the indicator itself and adds another indicator that it's either going to do a reversal or confirm trend.
In the indicator I created it has the Oversold and Overbought areas highlighted to show the oscillators function as kind of an RSI + MACD indicator. There is also added crossing alerts in the form of circles (or whatever you want to change it to) indicating a cross of the SMI line and the Signal EMA line. This is usually the point where you want to make an entrance or exit point. The Overbought and Oversold zones are adjustable to wherever you as a trader feel comfortable having them be.
I also combined bother the SMI and Signal line with the SMI Oscillator adding a histogram.

Wave Period Oscillator Wave Period Oscillator developed by Akram El Sherbini
Published in article Time Cycle Oscillators in IFTA Journal 2018 (page 66 - 77)
read his article : ifta.org
Entry Long - WPO cross above centerline (Zero Line)
Exit Long - WPO cross below overbought level or cross below centerline(Zero Line)
Entry Short - WPO cross below centerline (Zero Line)
Exit Short - WPO cross above oversold level or cross above centerline(Zero Line)

Chande Momentum OscillatorChande Momentum Oscillator script.
This indicator was developed and described by Tushar S. Chande and Stanley Kroll in their book "The New Technical Trader" (1994, Chapter 5: New Momentum Oscillators).

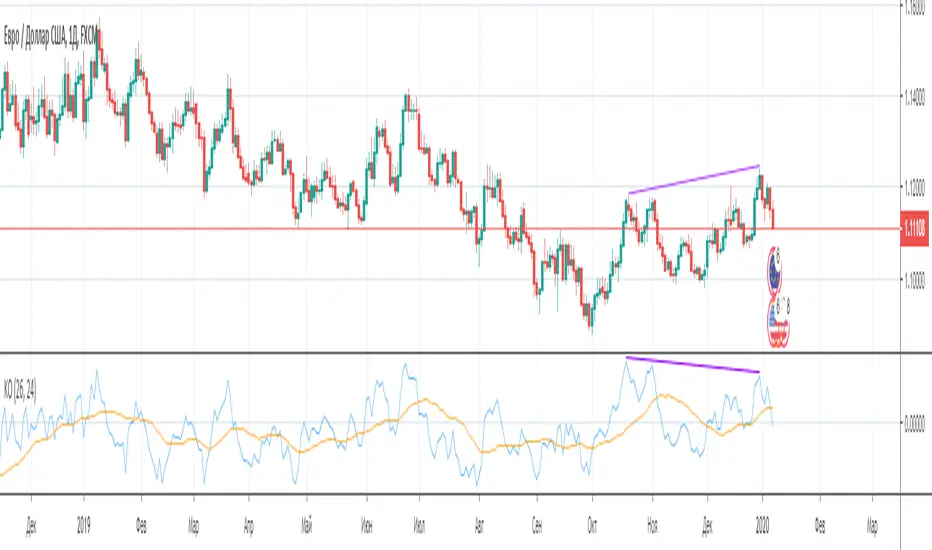
Kijun Oscillator [-W-]Eng.
Kijun is one of the lines of the Ichimoku indicator.
The indicator shows the relative deviation of the price from this line.
This indicator can be used to determine divergences, market phases, and all that other oscillators show. )
Rus .
Kijun - одна из линий индикатора Ишимоку.
Индикатор показывает относительное отклонение цены от этой линии.
По этому индикатору можно определять дивергенции, фазы рынка и всё то, что показывают другие осцилляторы. )
Aurora Flow Oscillator [QuantAlgo]The Aurora Flow Oscillator is an advanced momentum-based technical indicator designed to identify market direction, momentum shifts, and potential reversal zones using adaptive filtering techniques. It visualizes price momentum through a dynamic oscillator that quantifies trend strength and direction, helping traders and investors recognize momentum shifts and trading opportunities across various timeframes and asset class.
🟢 Technical Foundation
The Aurora Flow Oscillator employs a sophisticated mathematical approach with adaptive momentum filtering to analyze market conditions, including:
Price-Based Momentum Calculation: Calculates logarithmic price changes to measure the rate and magnitude of market movement
Adaptive Momentum Filtering: Applies an advanced filtering algorithm to smooth momentum calculations while preserving important signals
Acceleration Analysis: Incorporates momentum acceleration to identify shifts in market direction before they become obvious
Signal Normalization: Automatically scales the oscillator output to a range between -100 and 100 for consistent interpretation across different market conditions
The indicator processes price data through multiple filtering stages, applying mathematical principles including exponential smoothing with adaptive coefficients. This creates an oscillator that dynamically adjusts to market volatility while maintaining responsiveness to genuine trend changes.
🟢 Key Features & Signals
1. Momentum Flow and Extreme Zone Identification
The oscillator presents market momentum through an intuitive visual display that clearly indicates both direction and strength:
Above Zero: Indicates positive momentum and potential bullish conditions
Below Zero: Indicates negative momentum and potential bearish conditions
Slope Direction: The angle and direction of the oscillator provide immediate insight into momentum strength
Zero Line Crossings: Signal potential trend changes and new directional momentum
The indicator also identifies potential overbought and oversold market conditions through extreme zone markings:
Upper Zone (>50): Indicates strong bullish momentum that may be approaching exhaustion
Lower Zone (<-50): Indicates strong bearish momentum that may be approaching exhaustion
Extreme Boundaries (±95): Mark potentially unsustainable momentum levels where reversals become increasingly likely
These zones are displayed with gradient intensity that increases as the oscillator moves toward extremes, helping traders and investors:
→ Identify potential reversal zones
→ Determine appropriate entry and exit points
→ Gauge overall market sentiment strength
2. Customizable Trading Style Presets
The Aurora Flow Oscillator offers pre-configured settings for different trading approaches:
Default (80,150): Balanced configuration suitable for most trading and investing situations.
Scalping (5,80): Highly responsive settings for ultra-short-term trades. Generates frequent signals and catches quick price movements. Best for 1-15min charts when making many trades per day.
Day Trading (8,120): Optimized for intraday movements with faster response than default settings while maintaining reasonable signal quality. Ideal for 5-60min or 4h-12h timeframes.
Swing Trading (10,200): Designed for multi-day positions with stronger noise filtering. Focuses on capturing larger price swings while avoiding minor fluctuations. Works best on 1-4h and daily charts.
Position Trading (14,250): For longer-term position traders/investors seeking significant market trends. Reduces false signals by heavily filtering market noise. Ideal for daily or even weekly charts.
Trend Following (16,300): Maximum smoothing that prioritizes established directional movements over short-term fluctuations. Best used on daily and weekly charts, but can also be used for lower timeframe trading.
Countertrend (7,100): Tuned to detect potential reversals and exhaustion points in trends. More sensitive to momentum shifts than other presets. Effective on 15min-4h charts, as well as daily and weekly charts.
Each preset automatically adjusts internal parameters for optimal performance in the selected trading context, providing flexibility across different market approaches without requiring complex manual configuration.
🟢 Practical Usage Tips
1/ Trend Analysis and Interpretation
→ Direction Assessment: Evaluate the oscillator's position relative to zero to determine underlying momentum bias
→ Momentum Strength: Measure the oscillator's distance from zero within the -100 to +100 range to quantify momentum magnitude
→ Trend Consistency: Monitor the oscillator's path for sustained directional movement without frequent zero-line crossings
→ Reversal Detection: Watch for oscillator divergence from price and deceleration of movement when approaching extreme zones
2/ Signal Generation Strategies
Depending on your trading approach, multiple signal strategies can be employed:
Trend Following Signals:
Enter long positions when the oscillator crosses above zero
Enter short positions when the oscillator crosses below zero
Add to positions on pullbacks while maintaining the overall trend direction
Countertrend Signals:
Look for potential reversals when the oscillator reaches extreme zones (±95)
Enter contrary positions when momentum shows signs of exhaustion
Use oscillator divergence with price as additional confirmation
Momentum Shift Signals:
Enter positions when oscillator changes direction after establishing a trend
Exit positions when oscillator direction reverses against your position
Scale position size based on oscillator strength percentage
3/ Timeframe Optimization
The indicator can be effectively applied across different timeframes with these considerations:
Lower Timeframes (1-15min):
Use Scalping or Day Trading presets
Focus on quick momentum shifts and zero-line crossings
Be cautious of noise in extreme market conditions
Medium Timeframes (30min-4h):
Use Default or Swing Trading presets
Look for established trends and potential reversal zones
Combine with support/resistance analysis for entry/exit precision
Higher Timeframes (Daily+):
Use Position Trading or Trend Following presets
Focus on major trend identification and long-term positioning
Use extreme zones for position management rather than immediate reversals
🟢 Pro Tips
Price Momentum Period:
→ Lower values (5-7) increase sensitivity to minor price fluctuations but capture more market noise
→ Higher values (10-16) emphasize sustained momentum shifts at the cost of delayed response
→ Adjust based on your timeframe (lower for shorter timeframes, higher for longer timeframes)
Oscillator Filter Period:
→ Lower values (80-120) produce more frequent directional changes and earlier response to momentum shifts
→ Higher values (200-300) filter out shorter-term fluctuations to highlight dominant market cycles
→ Match to your typical holding period (shorter holding time = lower filter values)
Multi-Timeframe Analysis:
→ Compare oscillator readings across different timeframes for confluence
→ Look for alignment between higher and lower timeframe signals
→ Use higher timeframe for trend direction, lower for earlier entries
Volatility-Adaptive Trading:
→ Use oscillator strength to adjust position sizing (stronger = larger)
→ Consider reducing exposure when oscillator reaches extreme zones
→ Implement tighter stops during periods of oscillator acceleration
Combination Strategies:
→ Pair with volume indicators for confirmation of momentum shifts
→ Use with support/resistance levels for strategic entry and exit points
→ Combine with volatility indicators for comprehensive market context

VWAP Momentum Oscillator How It Works
Core Calculation Method
The oscillator combines four key market measurements into a single, normalized reading:
1. Price-VWAP Deviation: `(Close - VWAP) / VWAP × 100`
2. VWAP-MA Momentum: `(VWAP - MovingAverage) / MovingAverage × 100`
3. Anchored VWAP Strength: Average of high/low anchor deviations from rolling VWAP
4. Range Position: `(Close - PeriodLow) / (PeriodHigh - PeriodLow) × 100 - 50`
Dynamic Signal Line
The signal line uses an EMA that automatically adjusts its length based on your chart timeframe:
- Futures: Always covers 23 hours of trading (1,380 minutes)
- Stocks: Always covers 6.5 hours of trading (390 minutes)
- Examples: 276 periods on 5-min futures chart, 1,380 periods on 1-min futures chart
Trading Signals
🟢 Buy Signals
- Condition: Main oscillator crosses above signal line while below zero
- Logic: Momentum turning bullish from oversold conditions
- Visual: Green "BUY" label below price action
🔴 Sell Signals
- Condition: Main oscillator crosses below signal line while above zero
- Logic: Momentum turning bearish from overbought conditions
- Visual: Red "SELL" label above price action
⚠️ Extreme Warnings
- Extreme Overbought: Red triangle when oscillator crosses above +4.0
- Extreme Oversold: Green triangle when oscillator crosses below -4.0
- Purpose: Risk management alerts, not entry/exit signals
Oscillator Zones
Interpretation Guide
- Above +2.0: Strong bullish momentum zone (green background)
- 0 to +2.0: Mild bullish territory
- 0 to -2.0: Mild bearish territory
- Below -2.0: Strong bearish momentum zone (red background)
- Above +4.0: Extreme overbought (caution advised)
- Below -4.0: Extreme oversold (potential reversal zone)
Customization Options
Moving Average Settings
- EMA/SMA Toggle: Choose between exponential or simple moving average
- Color Customization: Adjust MA line color and width
Visual Controls
- Bullish/Bearish Colors: Customize momentum zone colors
- Signal Line: Toggle visibility and adjust color
- Line Widths: Control thickness of all plot lines
Anchor Modes
- NY Session Only: Anchors reset at NY market open (9:30 AM ET)
- 24H NY Day: Anchors reset at NY calendar day change (midnight ET)
Best Practices
Timeframe Selection
- Scalping: 1-5 minute charts for quick momentum changes
- Day Trading: 5-15 minute charts for clearer trend signals
- Swing Trading: 1-4 hour charts for major momentum shifts
Signal Confirmation
- Wait for crossovers: Don't trade on oscillator position alone
- Respect extreme levels: Exercise caution above +4 or below -4
- Use with price action: Combine with support/resistance levels
Risk Management
- Extreme zones: Reduce position size when oscillator is extended
- Failed signals: Exit quickly if momentum doesn't follow through
- Market context: Consider overall trend direction and market volatility
Technical Specifications
Calculation Components
- Base Length: 1,380 periods (futures) / 390 periods (stocks)
- Signal Line: Dynamic EMA covering one full trading day
- Smoothing: 3-period SMA on raw oscillator (adjustable)
- Update Frequency: Real-time on every price tick
Performance Notes
- Resource Efficient: Optimized calculations minimize CPU usage
- Memory Friendly: Uses incremental VWAP calculations
- Fast Loading: Minimal historical data requirements
Version History & Development
This oscillator evolved from advanced VWAP overlay strategies, transforming complex multi-line analysis into a single, actionable momentum gauge. The indicator maintains the sophistication of institutional VWAP analysis while providing the clarity needed for retail trading decisions.
Core Philosophy
Traditional VWAP indicators show where price is relative to volume-weighted averages, but they don't quantify momentum or provide clear entry/exit signals. This oscillator solves that problem by normalizing all VWAP relationships into a single, bounded indicator that works consistently across all timeframes and asset classes.
---
Open Source License: This indicator is provided free for the TradingView community. Feel free to modify and enhance according to your trading needs.

MTF Oscillator Stack [BigBeluga]🔵 OVERVIEW
The MTF Oscillator Stack brings powerful multi-timeframe momentum analysis directly into your price chart. You can select one oscillator— RSI , MFI , or Stochastic RSI —and display it across up to 4 different timeframes. Each panel is neatly stacked horizontally above price , offering quick insight into cross-timeframe conditions like trend direction, exhaustion zones, and momentum shifts.
🔵 CONCEPTS
Single Oscillator Mode: Select one oscillator type (RSI, MFI, or Stoch RSI) to analyze across all selected timeframes.
Top-Chart Horizontal Panels: Oscillator plots are aligned horizontally at the top of the chart for seamless top-down reading.
Signal Comparison Arrows: Arrows (🢁 / 🢃) indicate oscillator position relative to its signal line.
Overbought/Oversold Zones: Transparent 30–70 fill zones highlight key reversal areas.
Dynamic Display Logic: Only enabled panels are shown; spacing adjusts based on active timeframes.
Timeframe Tagging: Each oscillator panel is labeled with its corresponding timeframe (e.g., 1H, 2H, 4H).
🔵 FEATURES
Choose one oscillator (RSI, MFI, or Stoch RSI) and apply it across up to 4 timeframes.
Each oscillator panel includes: price-synced plot, signal line, and zone shading.
Scale alignment allows users to place charts at the bottom or top.
Clear arrow signals show whether oscillator is bullish or bearish.
Individual length and signal settings per timeframe.
Toggle for alignment mode: evenly spaced or floating layout.
All panels use a consistent layout for faster decision-making.
🔵 HOW TO USE
Select your preferred oscillator and activate 2–4 key timeframes (e.g., 1H, 4H, D1, W1).
Use signal crossovers as a bullish (🢁) or bearish (🢃) trend cue.
Look for aligned extremes (e.g., all timeframes overbought) to spot momentum exhaustion.
Ideal for momentum confluence strategies and top-down confirmation.
Use horizontal layout to stay focused on price while assessing broader structure.
🔵 CONCLUSION
MTF Oscillator Stack simplifies complex multi-timeframe momentum analysis into one clean, actionable visual. Whether you're tracking RSI, MFI, or Stoch RSI, this tool helps you stay aligned with the broader trend—without ever leaving your main chart.

Overheat Oscillator with DivergenceIndicator Description
The Overheat Oscillator with Divergence is an advanced technical indicator designed for the TradingView platform, assisting traders in identifying potential market reversal points by analyzing price momentum and volume, as well as detecting divergences. The indicator combines trend strength assessment with signal smoothing to provide clear indications of market overheat or oversold conditions. An optional divergence detection feature allows for the identification of discrepancies between price movement and the oscillator's value, which may signal upcoming trend changes.
The indicator is displayed in a separate panel below the price chart and offers visual cues through a color gradient, horizontal reference lines, and a dynamic market sentiment table. Users can customize numerous parameters, such as calculation periods, sentiment thresholds, line colors, and visualization styles, making the indicator a versatile tool for various trading strategies.
How the Indicator Works
The indicator is based on the following key components:
Oscillator Calculations
The indicator analyzes price candles, assigning a score based on their nature. A bullish candle (when the closing price is higher than the opening price) receives a score of +1.0, while a bearish candle (when the closing price is lower than the opening price) receives a score of -1.0. This scoring reflects the strength of price movement over a given period.
The score is modified by a volume multiplier (default: 2.0) if the candle's volume exceeds the volume's simple moving average (SMA, default: calculated over 20 candles). This ensures that candles with higher volume have a greater impact on the oscillator's value, better capturing significant market movements driven by increased trading activity. For example, a bullish candle with high volume may receive a score of +2.0 instead of +1.0, amplifying the bullish signal.
The scores are summed over a specified number of candles (default: 20), normalized to a 0–100 range, and then smoothed using a simple moving average (SMA, default: 5 periods) to reduce noise and improve signal clarity.
Color Gradient
The oscillator's values are visualized using a color gradient that changes based on the oscillator's level:
Green: Market cooldown (values below the Gradient Min threshold).
Yellow: Neutral sentiment (values between Gradient Min and Gradient Yellow).
Orange: Elevated activity (values between Gradient Yellow and Gradient Orange).
Red: Market overheat (values above Gradient Orange).
The color gradient is applied as the background in the oscillator panel, facilitating quick assessment of market sentiment.
Reference Levels
The indicator displays customizable horizontal lines for key thresholds (e.g., Overheat Threshold, Oversold Threshold, Gradient Min, Yellow, Orange, Max). These lines are visible only at the height of the last few oscillator candles, preventing chart clutter and helping users focus on current values.
Users can also define three custom horizontal lines with selectable styles (solid, dotted, dashed) and colors. These lines serve as auxiliary tools, e.g., for marking personal support/resistance levels, but do not affect the oscillator's signals or background colors.
Market Sentiment
The indicator displays sentiment labels in a table located in the top-right corner of the panel, dynamically updating based on the oscillator's value:
Cooled: Values below Gradient Yellow (default: 35).
Neutral: Values between Gradient Yellow and Gradient Orange (default: 60).
Excited: Values between Gradient Orange and Overheat Threshold (default: 70).
Overheated: Values above Overheat Threshold (default: 70).
The Overheat Threshold and Oversold Threshold are critical for displaying the "Overheated" and "Cooled" labels in the sentiment table, enabling users to quickly identify extreme market conditions. The labels update when key thresholds are crossed, and their colors match the oscillator's gradient.
Divergence Detection
The indicator offers optional detection of regular bullish and bearish divergences:
Bullish Divergence: Occurs when the price forms a lower low, but the oscillator forms a higher low, suggesting a weakening downtrend.
Bearish Divergence: Occurs when the price forms a higher high, but the oscillator forms a lower high, suggesting a weakening uptrend.
Divergences are marked on the chart with labels ("Bull" for bullish, "Bear" for bearish) and lines indicating pivot points. They are calculated with a delay equal to the Lookback Right setting (default: 5 candles), meaning signals appear after pivot confirmation in the specified lookback period. The indicator also generates alerts for users when a divergence is detected.
Indicator Settings
Main Settings (SETTINGS)
Period Length: Specifies the number of candles used for oscillator calculations (default: 20).
Volume SMA Period: The period for the volume's simple moving average (default: 20).
Volume Multiplier: Multiplier applied to candle scores when volume exceeds the average (default: 2.0).
SMA Length: The period for smoothing the oscillator with a simple moving average (default: 5).
Thresholds (THRESHOLDS)
Overheat Threshold: Level indicating market overheat (default: 70). This value determines when the sentiment table displays the "Overheated" label, signaling a potential peak in an uptrend.
Oversold Threshold: Level indicating market cooldown (default: 30). This value determines when the sentiment table displays the "Cooled" label, signaling a potential bottom in a downtrend.
Gradient Min (Green): Lower threshold for the green gradient (default: 20).
Gradient Yellow Threshold: Threshold for the yellow gradient (default: 35).
Gradient Orange Threshold: Threshold for the orange gradient (default: 60).
Gradient Max (Red): Upper threshold for the red gradient (default: 70).
Visualization (VISUALIZATION)
Signal Line Color: Color of the oscillator line (default: dark red, RGB(5, 0, 0)).
Show Reference Lines: Enables/disables the display of threshold lines (default: enabled).
Divergence Settings (DIVERGENCE SETTINGS)
Calculate Divergence: Enables/disables divergence detection (default: disabled).
Lookback Right: Number of candles back for pivot analysis (default: 5).
Lookback Left: Number of candles to the left for pivot analysis (default: 5).
Line Style (STYLE)
Custom Line 1, 2, 3 Value: Levels for custom horizontal lines (default: 70, 50, 30).
Custom Line 1, 2, 3 Color: Colors for custom lines (default: black, RGB(0, 0, 0)).
Custom Line 1, 2, 3 Style: Line styles (solid, dotted, dashed; default: dashed, dotted, dashed).
How to Use the Indicator
Adding to the Chart
Add the indicator to your TradingView chart by searching for "Overheat Oscillator with Divergence."
Configure the settings according to your trading strategy.
Signal Interpretation
Overheated: Values above the Overheat Threshold (default: 70) in the sentiment table may indicate a potential uptrend peak.
Cooled: Values below the Oversold Threshold (default: 30) in the sentiment table may suggest a potential downtrend bottom.
Divergences:
Bullish: Look for "Bull" labels on the chart, indicating potential upward reversals (calculated with a Lookback Right delay).
Bearish: Look for "Bear" labels, indicating potential downward reversals (calculated with a Lookback Right delay).
Customization
Experiment with settings such as period length, volume multiplier, or gradient thresholds to tailor the indicator to your trading style (e.g., scalping, medium-term trading).
Usage Examples
Scalping: Set a shorter period (e.g., Period Length = 10, SMA Length = 3) and monitor rapid sentiment changes and divergences on lower timeframes (e.g., 5-minute charts).
Medium-Term Trading: Use default settings or increase Period Length (e.g., 30) and SMA Length (e.g., 7) for more stable signals on hourly or daily charts.
Reversal Detection: Enable divergence detection and observe "Bull" or "Bear" labels in conjunction with overheat/cooled levels in the sentiment table.
Notes
The indicator performs best when used in conjunction with other technical analysis tools, such as support/resistance lines, moving averages, or Fibonacci levels.
Divergences may serve as early signals but do not always guarantee immediate trend reversals—confirmation with other indicators is recommended.
Test different settings on historical data to find the optimal configuration for your chosen market and timeframe.

Volume Flow OscillatorVolume Flow Oscillator
Overview
The Volume Flow Oscillator is an advanced technical analysis tool that measures buying and selling pressure by combining price direction with volume. Unlike traditional volume indicators, this oscillator reveals the force behind price movements, helping traders identify strong trends, potential reversals, and divergences between price and volume.
Reading the Indicator
The oscillator displays seven colored bands that fluctuate around a zero line:
Three bands above zero (yellow) indicate increasing levels of buying pressure
Three bands below zero (red) indicate increasing levels of selling pressure
The central band represents the baseline volume flow
Color intensity changes based on whether values are positive or negative
Trading Signals
The Volume Flow Oscillator provides several valuable trading signals:
Zero-line crossovers: When multiple bands cross from negative to positive, potential bullish shift; opposite for bearish
Divergences: When price makes new highs/lows but oscillator bands fail to confirm, signals potential reversal
Volume climax: Extreme readings where outer bands stretch far from zero often precede reversals
Trend confirmation: Strong expansion of bands in direction of price movement confirms genuine momentum
Support/resistance: During trends, bands may remain largely on one side of zero, showing continued directional pressure
Customization
Adjust these key parameters to optimize the oscillator for your trading style:
Lookback Length: Controls overall sensitivity (shorter = more responsive, longer = smoother)
Multipliers: Adjust sensitivity spread between bands for different market conditions
ALMA Settings: Fine-tune how the indicator weights recent versus historical data
VWMA Toggle: Enable for additional smoothing in volatile markets
Best Practices
For optimal results, use this oscillator in conjunction with price action and other confirmation indicators. The multi-band approach helps distinguish between minor fluctuations and significant volume events that might signal important market turns.

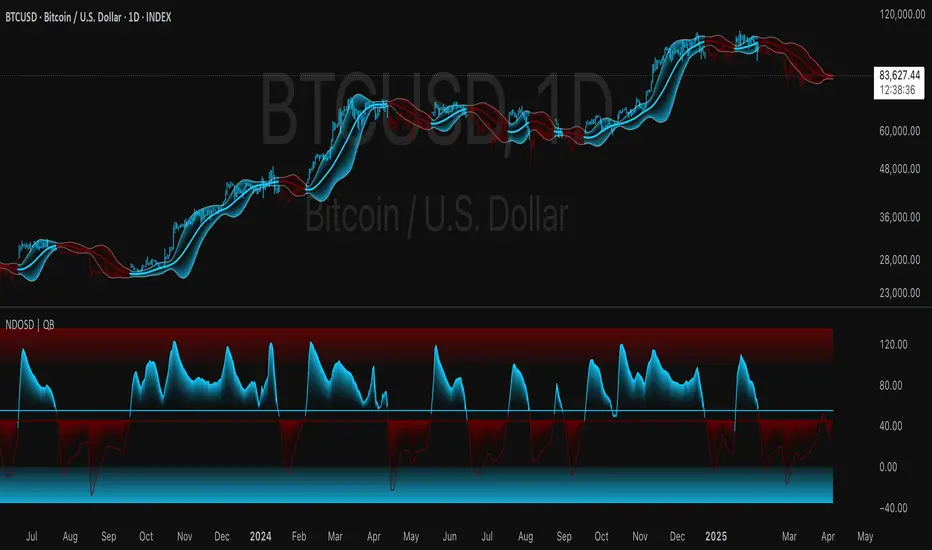
Normalized DEMA Oscillator SD| QuantEdgeB📊 Introducing Normalized DEMA Oscillator SD (NDOSD) by QuantEdgeB
🛠️ Overview
Normalized DEMA Oscillator SD (NDOSD) is a powerful trend and momentum indicator that blends DEMA-based smoothing with a standard deviation-based normalization engine. The result is an oscillator that adapts to volatility, filters noise, and highlights both trend continuations and reversal zones with exceptional clarity.
It normalizes price momentum within an adaptive SD envelope, allowing comparisons across assets and market conditions. Whether you're a trend trader or mean-reverter, NDOSD provides the insight needed for smarter decision-making.
✨ Key Features
🔹 DEMA-Powered Momentum Core
Utilizes a Double EMA (DEMA) for smoother trend detection with reduced lag.
🔹 Normalized SD Bands
Price momentum is standardized using a dynamic 2× standard deviation range—enabling consistent interpretation across assets and timeframes.
🔹 Overbought/Oversold Detection
Includes clear OB/OS zones with shaded thresholds to identify potential reversals or trend exhaustion areas.
🔹 Visual Trend Feedback
Color-coded oscillator zones, candle coloring, and optional signal labels help traders immediately see trend direction and strength.
📐 How It Works
1️⃣ DEMA Calculation
The core of NDOSD is a smoothed price line using a Double EMA, designed to reduce false signals in choppy markets.
2️⃣ Normalization with SD
The DEMA is normalized within a volatility range using a 2x SD calculation, producing a bounded oscillator from 0–100. This transforms the raw signal into a structured format, allowing for OB/OS detection and trend entry clarity.
3️⃣ Signal Generation
• ✅ Long Signal → Oscillator crosses above the long threshold (default: 55) and price holds above the lower SD boundary.
• ❌ Short Signal → Oscillator drops below short threshold (default: 45), often within upper SD boundary context.
4️⃣ OB/OS Thresholds
• Overbought Zone: Above 100 → Caution / Consider profit-taking.
• Oversold Zone: Below 0 → Watch for accumulation setups.
⚙️ Custom Settings
• Calculation Source: Default = close
• DEMA Period: Default = 30
• Base SMA Period: Default = 20
• Long Threshold: Default = 55
• Short Threshold: Default = 45
• Color Mode: Choose from Strategy, Solar, Warm, Cool, Classic, or Magic
• Signal Labels Toggle: Show/hide Long/Short markers on chart
👥 Ideal For
✅ Trend Followers – Identify breakout continuation zones using oscillator thrust and SD structure
✅ Swing Traders – Catch mid-trend entries or mean reversion setups at OB/OS extremes
✅ Quant/Systemic Traders – Normalize signals for algorithmic integration across assets
✅ Multi-Timeframe Analysts – Easily compare trend health using standardized oscillator ranges
📌 Conclusion
Normalized DEMA Oscillator SD is a sleek and adaptive momentum toolkit that helps traders distinguish true momentum from false noise. With its fusion of DEMA smoothing and SD normalization, it works equally well in trending and range-bound conditions.
🔹 Key Takeaways:
1️⃣ Smoother momentum tracking using DEMA
2️⃣ Cross-asset consistency via SD-based normalization
3️⃣ Versatile for both trend confirmation and reversal identification
📌 Disclaimer: Past performance is not indicative of future results. No trading strategy can guarantee success in financial markets.
📌 Strategic Advice: Always backtest, optimize, and align parameters with your trading objectives and risk tolerance before live trading.
Let me know if you want a strategy script or publish-ready layout for TradingView next!
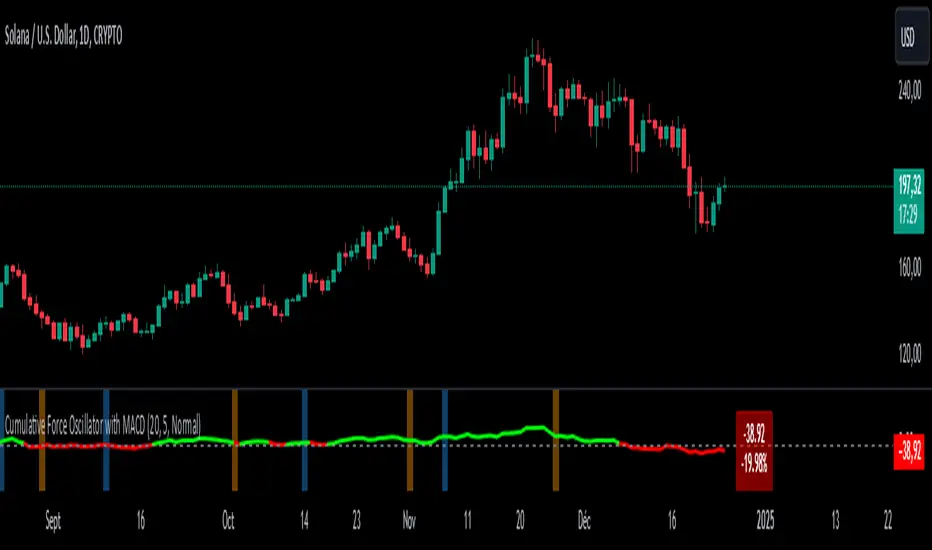
Cumulative Force Oscillator with MACDCumulative Force Oscillator with MACD
The Cumulative Force Oscillator with MACD is an advanced technical indicator designed to provide traders with a unique perspective on market momentum and trend strength. By combining the power of cumulative candle force analysis with MACD crossover signals, this indicator offers a multifaceted approach to market analysis.
Key Features
1. Cumulative Force Calculation**: Measures the net force of price movements over a specified number of candles.
2. MACD Integration**: Incorporates MACD crossover signals for additional trend confirmation.
3. Visual Cues**: Utilizes color-coded oscillator lines and background zones for easy interpretation.
4. **Dynamic Labeling**: Displays real-time force values and percentage changes.
How It Works
Cumulative Force Calculation
The indicator calculates the "force" of each candle by subtracting the open price from the close price. It then sums this force over a user-defined number of candles to create a cumulative force value. This value oscillates above and below zero, indicating bullish or bearish pressure respectively.
MACD Crossover Detection
The indicator uses the standard MACD (12, 26, 9) to detect bullish and bearish crossovers. These crossovers are visually represented by colored background zones, providing an additional layer of trend confirmation.
Visual Representation
- The main oscillator line is plotted in green when above zero (bullish) and red when below zero (bearish).
- Background colors change based on MACD crossovers: light blue for bullish crossovers and light orange for bearish crossovers.
- A dynamic label displays the current cumulative force value and its percentage change from the previous period.
Interpretation
1. Oscillator Line : When the line is above zero, it indicates net bullish pressure; below zero suggests net bearish pressure.
2. Oscillator Momentum : The steepness and direction of the oscillator line indicate the strength and direction of the current market force.
3. MACD Crossovers : Blue background zones suggest potential bullish trends, while orange zones indicate potential bearish trends.
4. Divergences : Look for divergences between the oscillator and price action for potential trend reversal signals.
Customization
Users can customize several aspects of the indicator :
- Number of candles for force calculation
- Label offset and text size
- Color schemes (through code modification)
Conclusion
The Cumulative Force Oscillator with MACD is a versatile tool that combines momentum analysis with trend confirmation signals. By providing a visual representation of cumulative market force alongside MACD crossovers, it offers traders a comprehensive view of market dynamics. This indicator can be particularly useful for identifying potential trend reversals, confirming existing trends, and gauging overall market strength.
Mean Trend OscillatorMean Trend Oscillator
The Mean Trend Oscillator offers an original approach to trend analysis by integrating multiple technical indicators, using statistic to get a probable signal, and dynamically adapting to market volatility.
This tool aggregates signals from four popular indicators—Relative Strength Index (RSI), Simple Moving Average (SMA), Exponential Moving Average (EMA), and Relative Moving Average (RMA)—and adjusts thresholds using the Average True Range (ATR). By using this, we can use Statistics to aggregate or take the average of each indicators signal. Mathematically, Taking an average of these indicators gives us a better probability on entering a trending state.
By consolidating these distinct perspectives, the Mean Trend Oscillator provides a comprehensive view of market direction, helping traders make informed decisions based on a broad, data-driven trend assessment. Traders can use this indicator to enter long spot or leveraged positions. The Mean Trend Oscillator is intended to be use in long term trending markets. Scalping MUST NOT be used with this indicator. (This indicator will give false signals when the Timeframe is too low. The best intended use for high-quality signals are longer timeframes).
The current price of a beginning trend series may tell us something about the next move. Thus, the Mean Trend Oscillator allows us to spot a high probability trending market and potentially exploit this information enter long or shorts strategy. (again, this indicator will give false signals when the Timeframe is too low. The best intended use for high-quality signals are longer timeframes).
Concept and Calculation and Inputs
The Mean Trend Oscillator calculates a “net trend” score as follows:
RSI evaluates market momentum, identifying overbought and oversold conditions, essential for confirming trend direction.
SMA, EMA, and RMA introduce varied smoothing methods to capture short- to medium-term trends, balancing quick price changes with smoothed averages.
ATR-Enhanced Thresholds: ATR is used as a dynamic multiplier, adjusting each indicator’s thresholds to current volatility levels, which helps reduce noise in low-volatility conditions and emphasizes significant signals when volatility spikes.
Length could be used to adjust how quickly each indicator can more or how slower each indicator can be.
Time Coherency for Inputs: Each indicator must be calculated where each signal is relatively around the same area.
For example:
Simply:
SMA, RMA, EMA, and RSI enters long around each intended trend period. Doesn't have to be perfect, but the indicators all enter long around there.
Each indicator contributes a score (+1 for bullish and -1 for bearish), and these scores are averaged to generate the final trend score:
A positive score, shown as a green line, suggests bullish conditions.
A negative score, indicated by a red line, signifies bearish conditions.
Thus, giving us a signal to long or short.
How to Use the Mean Trend Oscillator
This indicator’s output is straightforward and can fit into various trading strategies:
Bullish Signal: A green line shows that the trend is bullish, based on a positive average score across the indicators, signaling a consideration of longing an asset.
Bearish Signal: A red line indicates bearish conditions, with an overall negative trend score, signaling a consideration to shorting an asset.
By aggregating these indicators, the Mean Trend Oscillator helps traders identify strong trends while filtering out minor fluctuations, making it a versatile tool for both short- and long-term analysis. This multi-layered, adaptive approach to trend detection sets it apart from traditional single-indicator trend tools.

Uptrick: Dual Moving Average Volume Oscillator
Title: Uptrick: Dual Moving Average Volume Oscillator (DPVO)
### Overview
The "Uptrick: Dual Moving Average Volume Oscillator" (DPVO) is an advanced trading tool designed to enhance market analysis by integrating volume data with price action. This indicator is specially developed to provide traders with deeper insights into market dynamics, making it easier to spot potential entry and exit points based on volume and price interactions. The DPVO stands out by offering a sophisticated approach to traditional volume analysis, setting it apart from typical volume indicators available on the TradingView platform.
### Unique Features
Unlike traditional indicators that analyze volume and price movements separately, the DPVO combines these two critical elements to offer a comprehensive view of market behavior. By calculating the Volume Impact, which involves the product of the exponential moving averages (EMAs) of volume and the price range (close - open), this indicator highlights significant trading activities that could indicate strong buying or selling pressure. This method allows traders to see not just the volume spikes, but how those spikes relate to price movements, providing a clearer picture of market sentiment.
### Customization and Inputs
The DPVO is highly customizable, catering to various trading styles and strategies:
- **Oscillator Length (`oscLength`)**: Adjusts the period over which the volume and price difference is analyzed, allowing traders to set it according to their trading timeframe.
- **Fast and Slow Moving Averages (`fastMA` and `slowMA`)**: These parameters control the responsiveness of the DPVO. A shorter `fastMA` coupled with a longer `slowMA` can help in identifying trends quicker or smoothing out market noise for more conservative approaches.
- **Signal Smoothing (`signalSmooth`)**: This input helps in reducing signal noise, making the crossover and crossunder points between the DVO and its smoothed signal line clearer and easier to interpret.
### Functionality Details
The DPVO operates through a sequence of calculated steps that integrate volume data with price movement:
1. **Volume Impact Calculation**: This is the foundational step where the product of the EMA of volume and the EMA of price range (close - open) is calculated. This metric highlights trading sessions where significant volume accompanies substantial price movements, suggesting a strong market response.
2. **Dynamic Volume Oscillator (DVO)**: The heart of the indicator, the DVO, is derived by calculating the difference between the fast EMA and the slow EMA of the Volume Impact. This result is then normalized by dividing by the EMA of the volume over the same period to scale the output, making it consistent across various trading environments.
3. **Signal Generation**: The final output is smoothed using a simple moving average of the DVO to filter out market noise. Buy and sell signals are generated based on the crossover and crossunder of the DVO with its smoothed version, providing clear cues for market entry or exit.
### Originality
The DPVO's originality lies in its innovative integration of volume and price movement, a novel approach not typically observed in other volume indicators. By analyzing the product of volume and price change EMAs, the DPVO captures the essence of market dynamics more holistically than traditional tools, which often only reflect volume levels without contextualizing them with price actions. This dual analysis provides traders with a deeper understanding of market forces, enabling them to make more informed decisions based on a combination of volume surges and significant price movements. The DPVO also introduces a unique normalization and smoothing technique that refines the oscillator's output, offering cleaner and more reliable signals that are adaptable to various market conditions and trading styles.
### Practical Application
The DPVO excels in environments where volume plays a crucial role in validating price movements. Traders can utilize the buy and sell signals generated by the DPVO to enhance their decision-making process. The signals are plotted directly on the trading chart, with buy signals appearing below the price bars and sell signals above, ensuring they are prominent and actionable. This setup is particularly useful for day traders and swing traders who rely on timely and accurate signals to maximize their trading opportunities.
### Best Practices
To maximize the effectiveness of the DPVO, traders should consider the following best practices:
- **Market Selection**: Use the DPVO in markets known for strong volume-price correlation such as major forex pairs, popular stocks, and cryptocurrencies.
- **Signal Confirmation**: While the DPVO provides powerful signals, confirming these signals with additional indicators such as RSI or MACD can increase trade reliability.
- **Risk Management**: Always use stop-loss orders to manage risks associated with trading signals. Adjust the position size based on the volatility of the asset to avoid significant losses.
### Practical Example + How to use it
Practical Example1: Day Trading Cryptocurrencies
For a day trader focusing on the highly volatile cryptocurrency market, the DPVO can be an effective tool on a 15-minute chart. Suppose a trader is monitoring Bitcoin (BTC) during a period of high market activity. The DPVO might show an upward crossover of the DVO above its smoothed signal line while also indicating a significant increase in volume. This could signal that strong buying pressure is entering the market, suggesting a potential short-term rally. The trader could enter a long position based on this signal, setting a stop-loss just below the recent support level to manage risk. If the DPVO later shows a crossover in the opposite direction with decreasing volume, it might signal a good exit point, allowing the trader to lock in profits before a potential pullback.
- **Swing Trading Stocks**: For a swing trader looking at stocks, the DPVO could be applied on a daily chart. If the oscillator shows a consistent downward trend along with increasing volume, this could suggest a potential sell-off, providing a sell signal before a significant downturn.
You can look for:
--> Increase in volume - You can use indicators like 24-hour-Volume to have a better visualization
--> Uptrend/Downtrend in the indicator (HH, HL, LL, LH)
--> Confirmation (Buy signal/Sell signal)
--> Correct Price action (Not too steep moves up or down. Stable moves.) (Optional)
--> Confirmation with other indicators (Optional)
Quick image showing you an example of a buy signal on SOLANA:
### Technical Notes
- **Calculation Efficiency**: The DPVO utilizes exponential moving averages (EMAs) in its calculations, which provides a balance between responsiveness and smoothing. EMAs are favored over simple moving averages in this context because they give more weight to recent data, making the indicator more sensitive to recent market changes.
- **Normalization**: The normalization of the DVO by the EMA of the volume ensures that the oscillator remains consistent across different assets and timeframes. This means the indicator can be used on a wide variety of markets without needing significant adjustments, making it a versatile tool for traders.
- **Signal Line Smoothing**: The final signal line is smoothed using a simple moving average (SMA) to reduce noise. The choice of SMA for smoothing, as opposed to EMA, is intentional to provide a more stable signal that is less prone to frequent whipsaws, which can occur in highly volatile markets.
- **Lag and Sensitivity**: Like all moving average-based indicators, the DPVO may introduce a slight lag in signal generation. However, this is offset by the indicator’s ability to filter out market noise, making it a reliable tool for identifying genuine trends and reversals. Adjusting the `fastMA`, `slowMA`, and `signalSmooth` inputs allows traders to fine-tune the sensitivity of the DPVO to match their specific trading strategy and market conditions.
- **Platform Compatibility**: The DPVO is written in Pine Script™ v5, ensuring compatibility with the latest features and functionalities offered by TradingView. This version takes advantage of optimized functions for performance and accuracy in calculations, making it well-suited for real-time analysis.
Conclusion
The "Uptrick: Dual Moving Average Volume Oscillator" is a revolutionary tool that merges volume analysis with price movement to offer traders a more nuanced understanding of market trends and reversals. Its ability to provide clear, actionable signals based on a unique combination of volume and price changes makes it an invaluable addition to any trader's toolkit. Whether you are managing long-term positions or looking for quick trades, the DPVO provides insights that can help refine any trading strategy, making it a standout choice in the crowded field of technical indicators.
Nothing from this indicator or any other Uptrick Indicators is financial advice. Only you are ultimately responsible for your choices.

Kalman Filtered RSI Oscillator [BackQuant]Kalman Filtered RSI Oscillator
The Kalman Filtered RSI Oscillator is BackQuants new free indicator designed for traders seeking an advanced, empirical approach to trend detection and momentum analysis. By integrating the robustness of a Kalman filter with the adaptability of the Relative Strength Index (RSI), this tool offers a sophisticated method to capture market dynamics. This indicator is crafted to provide a clearer, more responsive insight into price trends and momentum shifts, enabling traders to make informed decisions in fast-moving markets.
Core Principles
Kalman Filter Dynamics:
At its core, the Kalman Filtered RSI Oscillator leverages the Kalman filter, renowned for its efficiency in predicting the state of linear dynamic systems amidst uncertainties. By applying it to the RSI calculation, the tool adeptly filters out market noise, offering a smoothed price source that forms the basis for more accurate momentum analysis. The inclusion of customizable parameters like process noise, measurement noise, and filter order allows traders to fine-tune the filter’s sensitivity to market changes, making it a versatile tool for various trading environments.
RSI Adaptation:
The RSI is a widely used momentum oscillator that measures the speed and change of price movements. By integrating the RSI with the Kalman filter, the oscillator not only identifies the prevailing trend but also provides a smoothed representation of momentum. This synergy enhances the indicator's ability to signal potential reversals and trend continuations with a higher degree of reliability.
Advanced Smoothing Techniques:
The indicator further offers an optional smoothing feature for the RSI, employing a selection of moving averages (HMA, THMA, EHMA, SMA, EMA, WMA, TEMA, VWMA) for traders seeking to reduce volatility and refine signal clarity. This advanced smoothing mechanism is pivotal for traders looking to mitigate the effects of short-term price fluctuations on the RSI's accuracy.
Empirical Significance:
Empirically, the Kalman Filtered RSI Oscillator stands out for its dynamic adjustment to market conditions. Unlike static indicators, the Kalman filter continuously updates its estimates based on incoming price data, making it inherently more responsive to new market information. This dynamic adaptation, combined with the RSI's momentum analysis, offers a powerful approach to understanding market trends and momentum with a depth not available in traditional indicators.
Trend Identification and Momentum Analysis:
Traders can use the Kalman Filtered RSI Oscillator to identify strong trends and momentum shifts. The color-coded RSI columns provide immediate visual cues on the market's direction and strength, aiding in quick decision-making.
Optimal for Various Market Conditions:
The flexibility in tuning the Kalman filter parameters makes this indicator suitable for a wide range of assets and market conditions, from volatile to stable markets. Traders can adjust the settings based on empirical testing to find the optimal configuration for their trading strategy.
Complementary to Other Analytical Tools:
While powerful on its own, the Kalman Filtered RSI Oscillator is best used in conjunction with other analytical tools and indicators. Combining it with volume analysis, price action patterns, or other trend-following indicators can provide a comprehensive view of the market, allowing for more nuanced and informed trading decisions.
The Kalman Filtered RSI Oscillator is a groundbreaking tool that marries empirical precision with advanced trend analysis techniques. Its innovative use of the Kalman filter to enhance the RSI's performance offers traders an unparalleled ability to navigate the complexities of modern financial markets. Whether you're a novice looking to refine your trading approach or a seasoned professional seeking advanced analytical tools, the Kalman Filtered RSI Oscillator represents a significant step forward in technical analysis capabilities.
Thus following all of the key points here are some sample backtests on the 1D Chart
Disclaimer: Backtests are based off past results, and are not indicative of the future.
INDEX:BTCUSD
INDEX:ETHUSD
BINANCE:SOLUSD
