GTrader-ICT All In One-Comumnity VersionMeet the **GTrader-ICT All In One **, a comprehensive toolkit designed to integrate key Inner Circle Trader (ICT) concepts directly onto your chart. This powerful overlay indicator consolidates multiple essential tools, streamlining your technical analysis and helping you identify key temporal and price-based events.
📚 References & Inspiration
This indicator stands on the shoulders of giants. With the help of **tradeforopp** and **LuxAlgo**. The concepts and some implementation details were referenced from the following excellent, publicly available scripts:
ICT Killzones: The session drawing and pivot logic is adapted from tradeforopp
ICT Macros: The macro detection and plotting functionality is inspired by the work of Lux Algo , particularly their widely-used indicators covering ICT concepts.
🎯 Core Features
* **ICT Killzones:** Visualize critical trading sessions with customizable boxes. You can easily toggle and style the **Asia**, **London**, and **New York (AM, Lunch, PM)** sessions to focus on the liquidity and volatility that matter most to your strategy.
* Fully customizable session times and colors.
* Timezone support to align sessions with your local or preferred trading time (defaults to `America/New_York`).
* **ICT Macros:** Automatically identify and plot specific, short-duration time windows where institutional algorithms are known to be active (e.g., `09:50-10:10`, `14:50-15:10`, etc.).
* Plots the high/low range of the macro, providing clear levels of interest.
* Utilizes 1-minute data for precision, even when viewing on 3-minute or 5-minute charts.
📚 Optimization over the other original indicators
We add the custom input for macros session, users just need to input the from/to hour: minute format, and they will be converted into session objects in pinescript
The macro draws function is optimized, removing redundant draws, leading to better performance
Add "Distance from Macro Line to Chart" option
Add "Session Drawings Limit" for better performance
⚠️ Notes on TradingView Warnings
You may encounter some warnings from TradingView when using this script. These are generally expected due to the script's advanced, event-driven nature:
1. **Function Call Consistency:** The function 'box.new' should be called on each calculation for consistency, which may appear. This happens because drawing elements (like session boxes) are intentionally created only on the *first bar* of a new session, not on every single bar. This is a necessary design choice for performance and to prevent duplicate drawings.
2. **Potential for Repainting/Slow Load:** The **Macro** feature uses the `request.security_lower_tf()` function to get accurate 1-minute data. This can trigger warnings about performance or slow loading times. This is a known trade-off for achieving the precision required for the feature.
Wyszukaj w skryptach "one一季度财报"

MACD Divergence all in oneMACD Divergence all in one
It can also be named as MACD dual divergence detector pro !
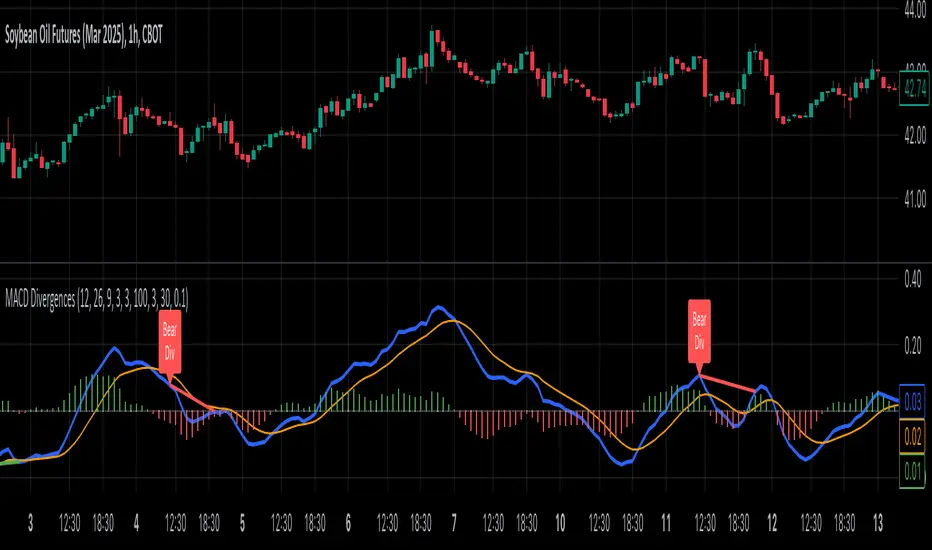
A sophisticated yet user-friendly tool designed to identify both bullish and bearish divergences using the MACD (Moving Average Convergence Divergence) indicator. This advanced script helps traders spot potential trend reversals by detecting hidden momentum shifts in the market, offering a comprehensive solution for divergence trading.
🎯 Key Features:
• Automatic detection of bullish and bearish divergences
• Clear visual signals with color-coded lines (Green for bullish, Red for bearish)
• Smart filtering system to eliminate false signals
• Customizable parameters to match your trading style
• Clean, uncluttered chart presentation
• Optimized performance for real-time analysis
• Easy-to-read labels showing divergence types
• Built-in signal spacing to avoid clustering
📊 How it works:
The indicator uses an advanced algorithm to analyze the relationship between price action and MACD momentum to identify:
Bullish Divergences:
- Price makes higher lows while MACD shows lower lows
- Signals potential trend reversal from bearish to bullish
- Marked with green lines and upward labels
Bearish Divergences:
- Price makes lower highs while MACD shows higher highs
- Signals potential trend reversal from bullish to bearish
- Marked with red lines and downward labels
⚙️ Customizable Settings:
1. MACD Parameters:
- Fast Length (default: 12)
- Slow Length (default: 26)
- Signal Length (default: 9)
2. Divergence Detection:
- Left/Right Pivot Bars
- Divergence Lookback Period
- Minimum/Maximum Divergence Length
- Divergence Strength Filter
3. Visual Settings:
- Clear color coding for easy identification
- Adjustable line thickness
- Customizable label size
💡 Best Practices:
- Most effective on higher timeframes (1H, 4H, Daily)
- Combine with support/resistance levels
- Use with trend lines and price action
- Consider volume confirmation
- Best results during trending markets
- Use appropriate stop-loss levels
🎓 Trading Tips:
1. Look for bullish divergences near support levels
2. Watch for bearish divergences near resistance zones
3. Confirm signals with other technical indicators
4. Consider market context and overall trend
5. Use proper position sizing and risk management
⚠️ Important Notes:
- Past performance doesn't guarantee future results
- Always use proper risk management
- Test settings on historical data first
- Different timeframes may require parameter adjustments
- Not all divergences lead to reversals
Created by: Anmol-max-star
Last Updated: 2025-02-25 16:15:08 UTC
📌 Regular updates and improvements planned!
Disclaimer:
This indicator is for informational purposes only. Always conduct your own analysis and use proper risk management techniques. Trading involves risk of loss, and past performance does not guarantee future results.
🤝 Support:
Feel free to leave comments for:
- Suggestions
- Improvements
- Feature requests
- Bug reports
- General feedback
Your feedback helps make this tool better for everyone!
Happy Trading and May the Trends Be With You! 📈
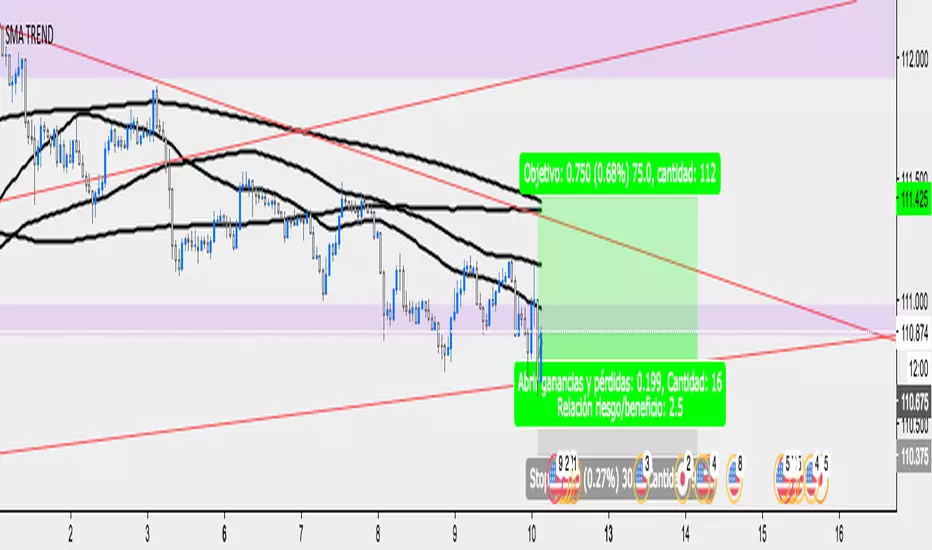
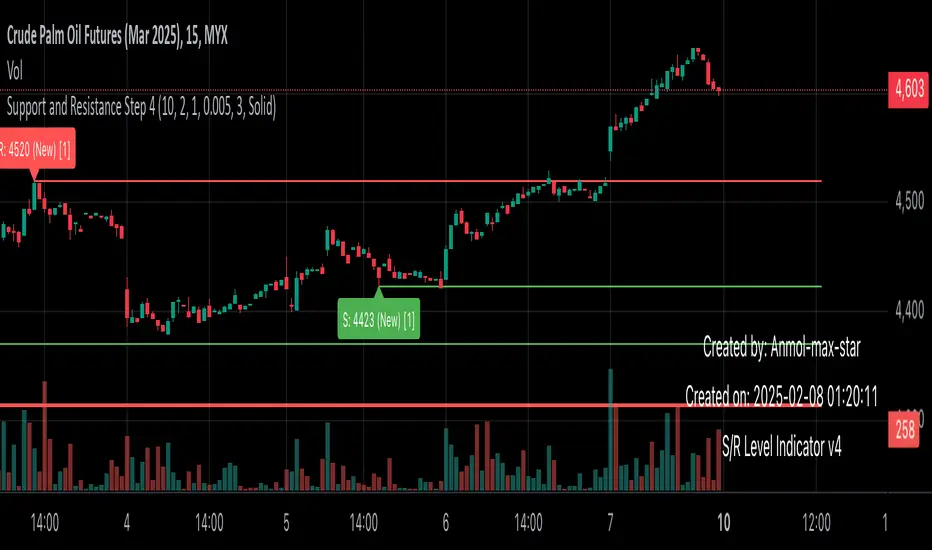
Support and Resistance all in one The Support and Resistance Indicator (v4) is designed to identify and track key price levels in financial markets. Here's how it works:
Core Functionality
Level Detection
Uses pivot points to identify significant price levels
Looks for swing highs (resistance) and swing lows (support)
Requires price action to pivot over a specified period (default 10 bars)
Dynamic Level Management
Maintains separate arrays for support and resistance levels
Limits maximum displayed levels (default 10) to prevent chart clutter
Removes oldest levels when maximum is reached
Ensures new levels are sufficiently distant from existing ones (minimum 1% separation)
Touch Detection System
Monitors price interaction with established levels
Counts when price comes within 0.1% of any level
Updates touch count and strength classification
Categories: "New" (1 touch), "Moderate" (2 touches), "Strong" (3+ touches)
Visual Representation
Draws horizontal lines at each level
Updates line width based on strength (thicker for stronger levels)
Shows labels with price and strength information
Color coding: Red (new/moderate levels), Green (strong levels)
Displays triangles (▼▲) at pivot points
Trading Applications
Support/Resistance Trading
Strong levels (3+ touches) suggest reliable trading zones
More touches indicate higher probability reversal points
Use for stop loss and target placement
Breakout Trading
Monitor breaks of strong levels
Higher touch count suggests more significant breakouts
Watch for false breakouts at weaker levels
Risk Management
Place stops beyond strong levels
Use level strength to adjust position size
Consider multiple timeframe analysis
Best Practices
Use with other indicators for confirmation
Consider market context and trend
Monitor level strength development
Don't rely solely on touch count
Watch for price reaction at levels
Customization Options
Adjust pivot length for different timeframes
Modify minimum distance between levels
Change required touches for "Strong" classification
Toggle strength labels display
Choose line style (Solid/Dashed/Dotted)
This indicator helps identify key price levels where market participants have shown interest, making it valuable for trade planning and risk management
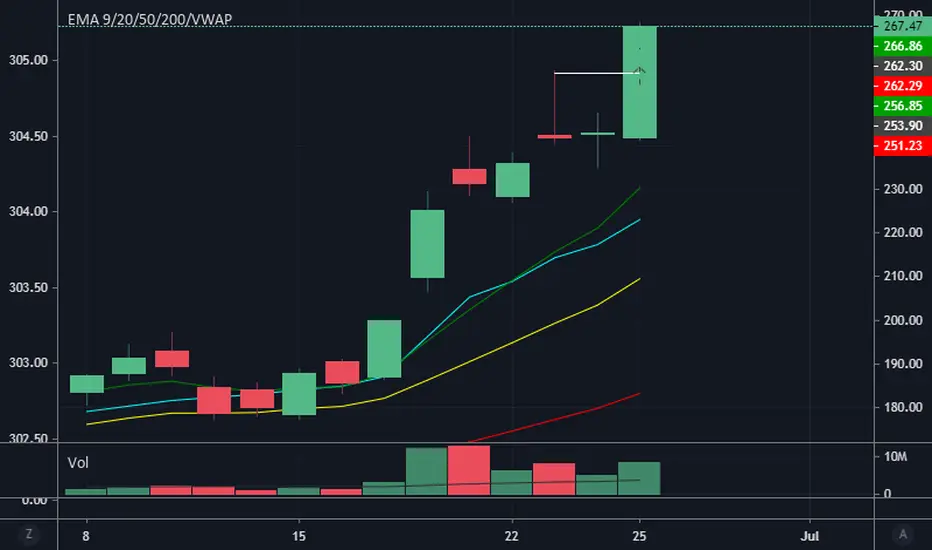
All-In-One Auto Anchored VWAPsA chart isn't trendy without a VWAP (which stands for volume weighted average price).
This indicator allows you to choose 3 different anchored VWAPs, and customize the anchor period from one of many different options, including:
- Daily
- Weekly
- Monthly
- Quarterly
- Yearly
- All Time
- Specific Pivots
- Specific Sessions
You can then choose whether you want to anchor to the open, highest or lowest value within that period.
The indicator will automatically update every time a new anchor point is triggered. Every VWAP has colors and standard deviation bands as an optional setting.
As interest in the script grows I will continue to add new features.
Multiple RSI One Time FrameI was working on something else and decided to release this as a standalone script just in case you needed it. I just took the source for generic RSI indicators and combined them into one indicator to save space.
All-in-One-BTFinancialsI like to share my ALL-IN-ONE script to help you understand trendlines, overbought/sold, unified EMA, Volume trades, Chopiness index and my favourite Fibonacci. It looks a bit messy but you will get used to it.

STD/Clutter Filtered, One-Sided, N-Sinc-Kernel, EFIR Filt [Loxx]STD/Clutter Filtered, One-Sided, N-Sinc-Kernel, EFIR Filt is a normalized Cardinal Sine Filter Kernel Weighted Fir Filter that uses Ehler's FIR filter calculation instead of the general FIR filter calculation. This indicator has Kalman Velocity lag reduction, a standard deviation filter, a clutter filter, and a kernel noise filter. When calculating the Kernels, the both sides are calculated, then smoothed, then sliced to just the Right side of the Kernel weights. Lastly, blackman windowing is used for our purposes here. You can read about blackman windowing here:
Blackman window
Advantages of Blackman Window over Hamming Window Method for designing FIR Filter
The Kernel amplitudes are shown below with their corresponding values in yellow:
This indicator is intended to be used with Heikin-Ashi source inputs, specially HAB Median. You can read about this here:
Moving Average Filters Add-on w/ Expanded Source Types
What is a Finite Impulse Response Filter?
In signal processing, a finite impulse response (FIR) filter is a filter whose impulse response (or response to any finite length input) is of finite duration, because it settles to zero in finite time. This is in contrast to infinite impulse response (IIR) filters, which may have internal feedback and may continue to respond indefinitely (usually decaying).
The impulse response (that is, the output in response to a Kronecker delta input) of an Nth-order discrete-time FIR filter lasts exactly {\displaystyle N+1}N+1 samples (from first nonzero element through last nonzero element) before it then settles to zero.
FIR filters can be discrete-time or continuous-time, and digital or analog.
A FIR filter is (similar to, or) just a weighted moving average filter, where (unlike a typical equally weighted moving average filter) the weights of each delay tap are not constrained to be identical or even of the same sign. By changing various values in the array of weights (the impulse response, or time shifted and sampled version of the same), the frequency response of a FIR filter can be completely changed.
An FIR filter simply CONVOLVES the input time series (price data) with its IMPULSE RESPONSE. The impulse response is just a set of weights (or "coefficients") that multiply each data point. Then you just add up all the products and divide by the sum of the weights and that is it; e.g., for a 10-bar SMA you just add up 10 bars of price data (each multiplied by 1) and divide by 10. For a weighted-MA you add up the product of the price data with triangular-number weights and divide by the total weight.
Ultra Low Lag Moving Average's weights are designed to have MAXIMUM possible smoothing and MINIMUM possible lag compatible with as-flat-as-possible phase response.
Ehlers FIR Filter
Ehlers Filter (EF) was authored, not surprisingly, by John Ehlers. Read all about them here: Ehlers Filters
What is Normalized Cardinal Sine?
The sinc function sinc (x), also called the "sampling function," is a function that arises frequently in signal processing and the theory of Fourier transforms.
In mathematics, the historical unnormalized sinc function is defined for x ≠ 0 by
sinc x = sinx / x
In digital signal processing and information theory, the normalized sinc function is commonly defined for x ≠ 0 by
sinc x = sin(pi * x) / (pi * x)
What is a Clutter Filter?
For our purposes here, this is a filter that compares the slope of the trading filter output to a threshold to determine whether to shift trends. If the slope is up but the slope doesn't exceed the threshold, then the color is gray and this indicates a chop zone. If the slope is down but the slope doesn't exceed the threshold, then the color is gray and this indicates a chop zone. Alternatively if either up or down slope exceeds the threshold then the trend turns green for up and red for down. Fro demonstration purposes, an EMA is used as the moving average. This acts to reduce the noise in the signal.
What is a Dual Element Lag Reducer?
Modifies an array of coefficients to reduce lag by the Lag Reduction Factor uses a generic version of a Kalman velocity component to accomplish this lag reduction is achieved by applying the following to the array:
2 * coeff - coeff
The response time vs noise battle still holds true, high lag reduction means more noise is present in your data! Please note that the beginning coefficients which the modifying matrix cannot be applied to (coef whose indecies are < LagReductionFactor) are simply multiplied by two for additional smoothing .
Included
Bar coloring
Loxx's Expanded Source Types
Signals
Alerts

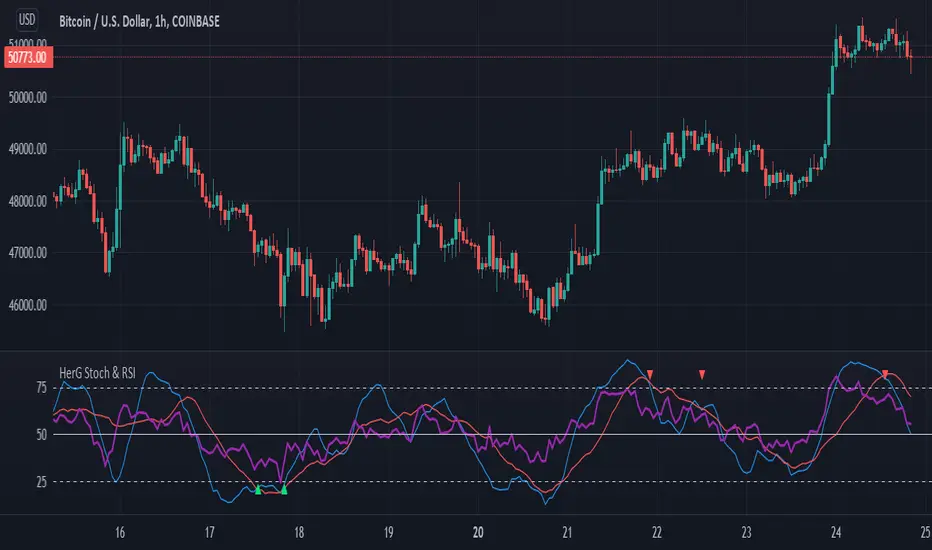
Stochastic and RSI in one indicator with customized alert.Hello Trading Viewers,
I present you Stochastic Oscillator and The Relative Strength Index Indicator inside one indicator, so that it will clear room to view charts.
When Stochastic is over-sold, the fast and slow stochastic underlap along with strong RSI (say above 45) will be a good indicator of buy at low with good risk-to-return of 2x or 3x; therefore I have set a triangle shape indicator within to help you identify or you can simply set an alert as I have coded an customized alert.
Same idea is used when Stochastic is over-bought you will receive an alert when fast & slow stochastic overlaps with RSI falling give a good sell set-up.
There is an option of selecting different timeframes which will further help make the correct decision. Say you are viewing a Daily chart but you want an indicator to present data of 4hrs timeframe, it can be done from the indicator cogwheel option. Default timeframe is "same as charts' ".
Above indicator is universal because settings such as RSI levels and no. of bars to calculate are user defined. You can use it on Crypto, Commodities, Stocks etc.
I suggest you first paper-trade with it and then use it on live account.
Happy trading.
MACD Alert [All MA in one] [Smart Crypto Trade (SCT)]This code is a gift from "Smart Crypto Trade (SCT)" group
MACD indicator contains 3 EMA, I think one of the best usage of MACD is trend detection and divergences.
In our indicator, you can select the type of Moving averages that used in macd.
You can using "MACD" based on several types of moving averages including:
Exponential Moving Average ( EMA )
Volume-Weighted Moving Average ( VWMA )
Simple Moving Average ( SMA )
Weighted Moving Average ( WMA )
Exponentially Weighted Moving Average (RMA) that used in RSI
Smoothed Moving Average ( SMMA )
Arnaud Legoux Moving Average ( ALMA )
Double EMA ( DEMA )
Double SMA (DSMA)
Double WMA (DWMA)
Double RMA (DRMA)
Triple EMA ( TEMA )
Triple SMA (TSMA)
Triple WMA (TWMA)
Triple RMA (TRMA)
Linear regression curve Moving Average ( LSMA )
Variable Index Dynamic Average ( VIDYA )
Fractal Adaptive Moving Average ( FRAMA )
In other words we tried to collect all the most popular MAs in our MACD indicator.
In addition, you can use four types of alert or alarm conditions for detection LONG or SHORT positions and trends. For this, you must set an alert in alert tab and set the condition based on four defaults conditions.
Enjoy

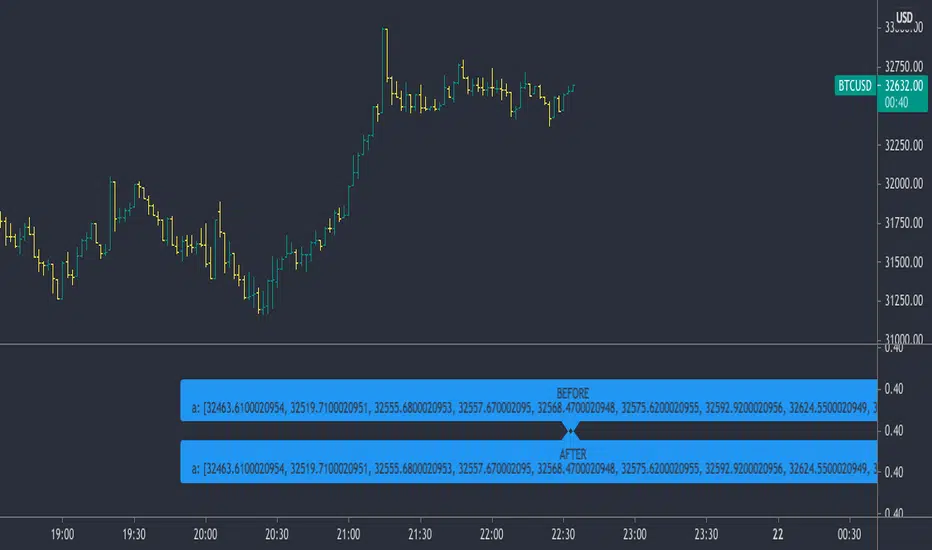
2 Dimensional Array using one floating point entry This is an attempt to create a two dimensional floating point array from the pine single dimension array.
It enables some useful array functions like sorting, when you are trying to keep track of price and location in time or bars and you would like to sort the array.
Other array functions on this array will not work, like average and other statistical functions - they will provide bad results. I would suggest continuing to use a single dimensional array for each element where that kind of array function is required.
I wrote this simply as a mean of using the sort functions when I had to sort price and try to keep the bar location or time in synch.
Other array functions could be written to manipulate this kind of array, leave that to others. The goal here was to avoid using for loops which would be a performance impact on large arrays.
The basic concept is to create one floating point number from two, put that into an array, and then be able to pull the compound value out and parse out the individual components.
I imagine it could also accommodate a 3 or 4 dimensional array with some work, as long as you had some idea of how many digits are consumed by each element. For example you may be interested in storing price, RSI, x_loc values and then be able to sort and parse them out.
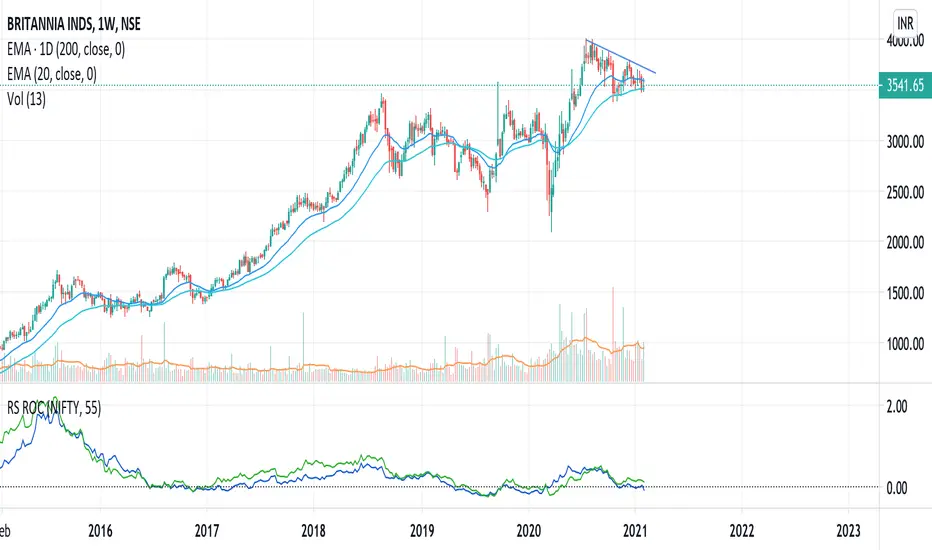
Relative Strength (RS) and Rate of Change (ROC) Combined in oneThis indicator combines Relative Strength and Rate of Change (ROC) in one plot. Change the period and comparative symbol (defaulted to NSE:NIFTY) in settings.
4 EMA + VWAP in one indicator, with adjustable titles and colorsYou can have all of these in one indicator and toggle them on and off, so you won't go over your Tradingview Pro limit. Feel free to take the source code or edit as you like
VI BB RSI CRSI MFI - All In OneThis script simply creates a combo of some indicators I have found to be useful to visualize together.
Its fairly simple to use... buy the red and sell the green. The red and green 'zones' are VI indicator plus and minus using color to identify instead of plotting the lines and creating more mess for us.
The blue line is our BB B%... and the solid lines are the buy and sell thresholds.
The yellow line is our RSI, and the dotted lines are the thresholds.
The orange CRSI line is for intrazone (red or green VI zone) trades.. for instance, buying in the sell zone and then selling again (dead cats) and vice versa.
Lastly the purple MFI plot can be useful in identifying trend reversals.
This is not secret code, its free for everyone to use. If you find that it is too cluttered, you can simply comment out the plot function for that indicator to disable the ones that you find most cluttering.
Feedback is appreciated, along with ideas or suggestions.. cheers and happy trading!

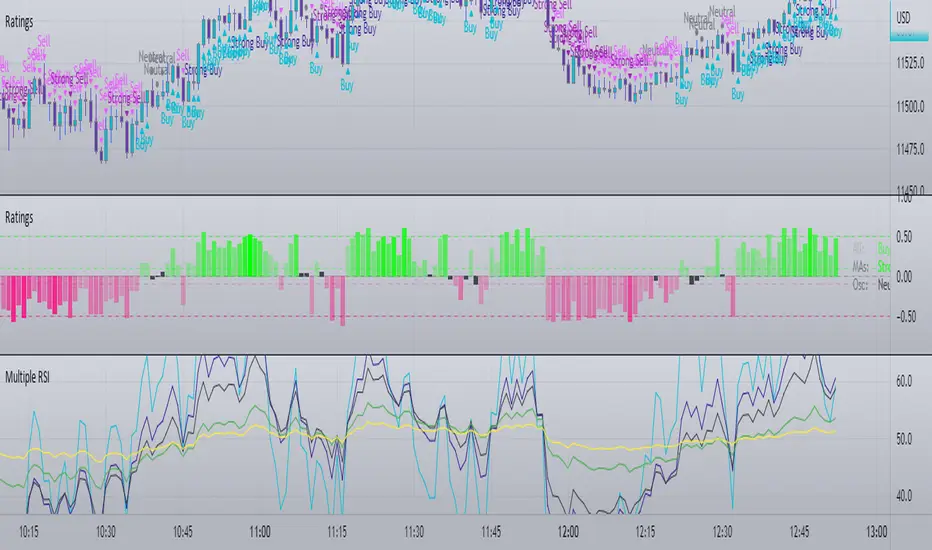
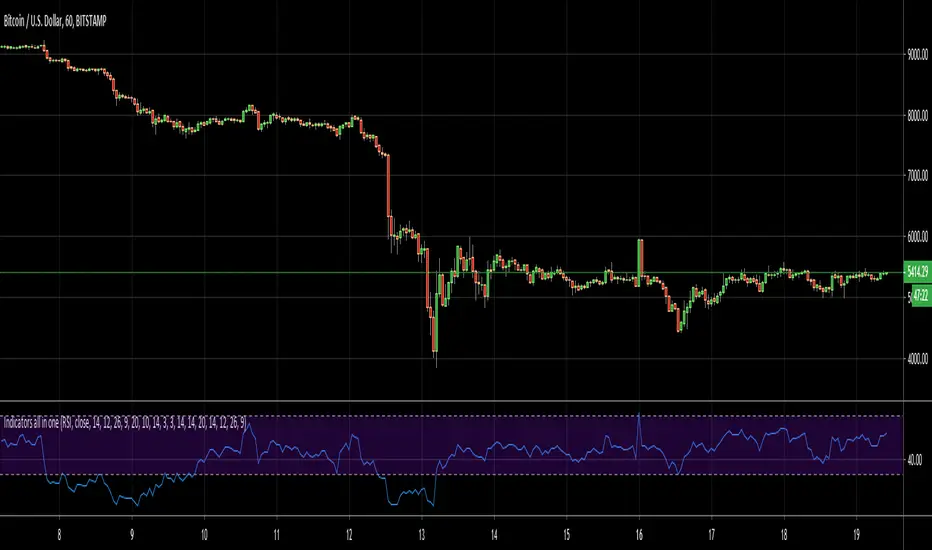
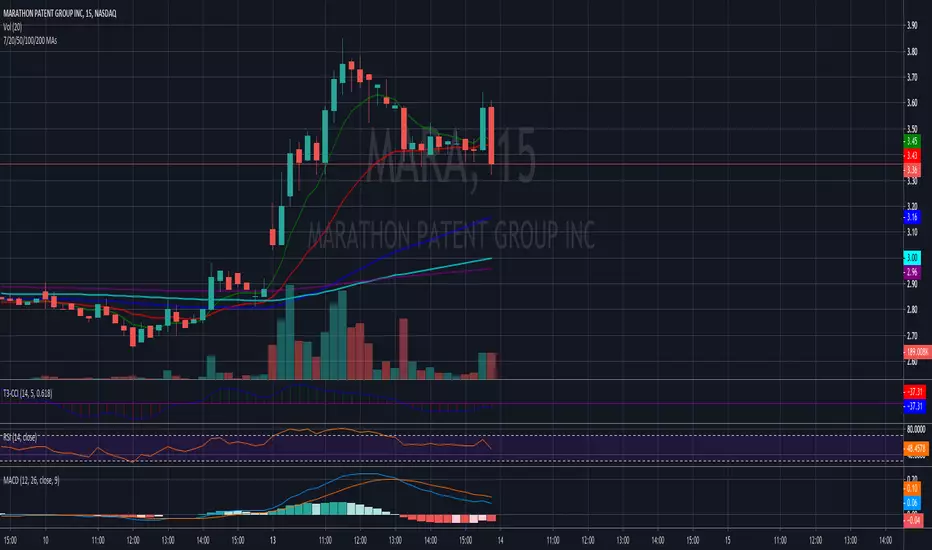
Indicators all in oneHello Everyone . Sometimes we need some indicators and each one needs seperated window. with this tool we can see indicators by choosing it from pull down menu, in the same window.
Currently you can choose RSI, MACD, Commodity Channel Index (CCI), Momentum, Stochastic, Stochastic RSI, Directional Movement Index (DMI), Chaikin Money Flow (CMF), On-Balance Volume (OBV), Average True Range (ATR), Volume Weigthed MACD (VWMACD).
some screen shots:
DMI:
MACD:
Stochastic RSI
Let me know if you need any other indicator in this tool.
Enjoy!
100PipsADay Third screen all in oneThis is 100PipsADay third screen strategy all coded in one script, when condition is met (macd daily historam>0 and W%R oversold) we have buying condition and vice versa.
You must use on 1 hr timeframe in order to have the correct parameters.

Elder's Triple Screen all in oneThis indicator is coded to have all the setting to have the triple screen trading system by Dr . Alexander Elder. You can use different oscillator and can switch between elder force index (for more active traders) and stochastic (for more conservative approach) you just have to check or
uncheck the relative button on the indicator setting, it will switch automatically. The barcolor reflect the underline trend based on a bigger timeframe, 5 time greater than the one you apply the indicator to.

Bundle of various indicators, All-in-oneThis scripts compiles many indicators into one. It comes from many sources and i added all sources i used. If i forgot one, don't hesitate to message me.
This is useful if you need to setup your chart layout fast. The menu makes it easy to configure it.
You can configure and display:
- Various types of moving averages: RMA, SMA , EMA , WMA , VWMA , SMMA , HullMA, LSMA , DEMA , TEMA
- Stochastic RSI crosses from multi-timeframes directly on candle's close (1h, 4h, D, W)
- Bollinger bands with primary and secondary deviation
- SAR
- Color background using difference between Stochastic RSI K and D
- Support and resistance
- Open high low close from higher timeframes (D, W, M)
- Auto fibonacci levels (still a work in progress, i will add logarithmic fibonacci levels too later)
- "Alt season" for crypto users: if BTC dominance cross his SMA , display a pictogram on every chart
Stil working on:
- Auto fibonacci levels: i will add logarithmic fibonacci levels
- Stochastic crosses
- Alt season: use others types of moving averages
If you have any suggestions / improvements, feel free to message me or write it in the comments below.

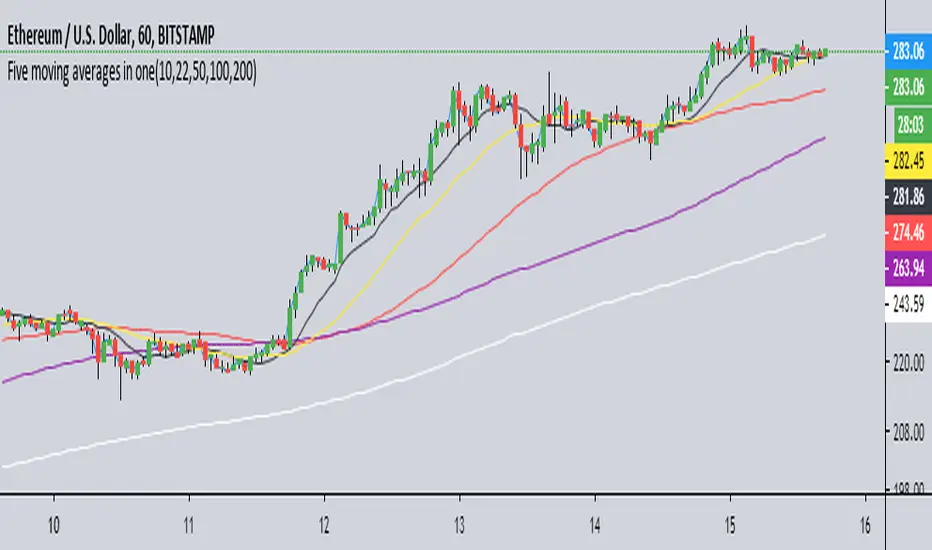
7/20 EMAs 50/100/200 SMAs as One Script.This is one of the scripts I use daily as a full time daytrader. It works well for me to predict MA resistance and support levels and has been very reliable.
RSI ALL IN ONE PLACEThis script combines the RSI, Stochastic RSI, and Stochastic to all be in one place for ease of use.
Nothing really new, just a script to streamline and create a convenient view of normal indicators

All in one Moving Averages SIMPLIFIEDSame as All in one Moving Averages, but HMAs used are 55 & 80 and they are combined in just 1 moving average