Market Structure MTF Trend [Pt]█ Author's Notes
There are numerous market structure indicators in the TradingView library, each offering a unique approach to identifying price action shifts. Market Structure MTF Trend was created with simplicity and flexibility in mind—providing a highly customizable multi-timeframe setup, visually clear trendlines, and straightforward labeling. This combination helps both new and experienced traders easily spot and interpret market structure changes.
█ Overview
Market Structure MTF Trend is a powerful yet user-friendly indicator designed to identify and visualize key turning points in price action. It focuses on two core concepts:
Change of Character (CHoCH): A momentary shift in the market’s behavior, signaling that the current price movement may be losing momentum and could soon reverse.
Break of Structure (BoS): A more definitive event confirming a new price pattern, where the market establishes a fresh trend direction by surpassing previous swing highs or lows.
By combining these signals across up to four different timeframes, even traders unfamiliar with market structure can quickly learn to spot and validate potential trend reversals or continuations.
█ Key Features
Multi-Timeframe Analysis: Monitors CHoCH and BoS events simultaneously on multiple intervals (e.g., 15m, 30m, 60m, 240m), providing a clear, layered understanding of market dynamics.
Straightforward Visual Cues: Labels are placed directly on the chart at swing highs and lows, while colored bars at the bottom give an instant snapshot of whether each timeframe is bullish or bearish.
Configurable Timeframes & Pivot Strength: Easily set up the desired intervals and adjust pivot strength to tune how sensitive the indicator is to minor price fluctuations.
Color-Coded Signals: Different colors help you distinguish between potential early reversals (CHoCH) and confirmed shifts (BoS), ensuring each signal’s importance is immediately clear.
█ Usage & Benefits
Learn Market Structure Basics: For those new to swing highs/lows, CHoCH, and BoS, the script’s on-chart labels and dynamic bar coloring provide a practical, visual way to grasp these concepts.
Spot Reversals Early: CHoCH alerts you to possible shifts in momentum, allowing you to anticipate trend changes before they fully develop.
Confirm Trend Breaks: BoS events confirm that the market has established a new directional bias, reinforcing higher‐probability entry or exit points.
Reduce Noise & Stay Focused: The multi-timeframe setup ensures you won’t overlook larger trends or get lost in smaller fluctuations.
Streamline Decision-Making: Color-coded bars let you gauge overall market sentiment at a glance—ideal for quickly validating trades without juggling multiple charts.
Market Structure MTF Trend is perfect for traders who want to learn or refine their understanding of price action. By integrating multiple timeframes into a single, cohesive interface, this tool highlights both subtle shifts and confirmed breaks in market structure, empowering you to trade with greater insight and confidence.
Wyszukaj w skryptach "mtf"

SSL Channel MTFSSL Channel with MTF support, This eliminates the noise of a basic SSL Channel script which is based on ErwinBeckers SSL Channel. So i have used a Multi Time Frame approach to have a clear confirmation of trend and reduce Noise and False signals unlike basic SSL Channel.
This script can be used to determine.
Support/Resistance
High/Low Breakout
Trend Direction
MA candles for Entry
The high and low sma are plotted as SSL CHANNEL when ever the high and low sma cross each other a direction change is observed.
The direction of SSL channel determines the trend of the price. The length of the channel can be changed as required a low value has a high noise and direction can be determined with low accuracy. Increasing the length of SSL channel has high accuracy trend confirmation.
The MTF SSL Channel uses plot from higher timeframe this helps in using SSL Channel as a Price Action Tool. Price when ever crosses over or below the channel determines a breakout. Price tries to move between the High SMA line and Low SMA Line of the SSL Channel rejection, breakouts can be easily observed on a lower timeframe using SSL Channel Plot from a higher timeframe.
I have used 5min/15min chart with MTF SSL from a 1Hr/4Hr and a length of 5 instead of 10. This helps quick direction changes over a period of 1hr to 4hr. Price is trapped within the High SMA and Low SMA lines of SSL Channel. In addition to SSL High Low and average mid line is plotted to additional reference.
Buy Sell Signals are plotted based on crossover of SMA High and Low.
Candle are Plotted Using a SMA with length of 5. This Candle Plot can be used to make an entry based on direction confirmation of SSL. keep in mind the direction of SSL Plot and the candle must be same. Preferably Entry can made above or below the midline of SSL Channel. The Candle Plot eliminates the Noise of traditional Japanese Candlesticks.
Additionally MACD Crossover and MACD Trend line confirmations can be used to confirm a Buy Sell and Entry signals
Alerts are also plotted accordingly.

Support and Resistance Signals MTF [LuxAlgo]The Support and Resistance Signals MTF indicator aims to identify undoubtedly one of the key concepts of technical analysis Support and Resistance Levels and more importantly, the script aims to capture and highlight major price action movements, such as Breakouts , Tests of the Zones , Retests of the Zones , and Rejections .
The script supports Multi-TimeFrame (MTF) functionality allowing users to analyze and observe the Support and Resistance Levels/Zones and their associated Signals from a higher timeframe perspective.
This script is an extended version of our previously published Support-and-Resistance-Levels-with-Breaks script from 2020.
Identification of key support and resistance levels/zones is an essential ingredient to successful technical analysis.
🔶 USAGE
Support and resistance are key concepts that help traders understand, analyze and act on chart patterns in the financial markets. Support describes a price level where a downtrend pauses due to demand for an asset increasing, while resistance refers to a level where an uptrend reverses as a sell-off happens.
The creation of support and resistance levels comes as a result of an initial imbalance of supply/demand, which forms what we know as a swing high or swing low. This script starts its processing using the swing highs/lows. Swing Highs/Lows are levels that many of the market participants use as a historical reference to place their trading orders (buy, sell, stop loss), as a result, those price levels potentially become and serve as key support and resistance levels.
One of the important features of the script is the signals it provides. The script follows the major price movements and highlights them on the chart.
🔹 Breakouts (non-repaint)
A breakout is a price moving outside a defined support or resistance level, the significance of the breakout can be measured by examining the volume. This script is not filtering them based on volume but provides volume information for the bar where the breakout takes place.
🔹 Retests
Retest is a case where the price action breaches a zone and then revisits the level breached.
🔹 Tests
Test is a case where the price action touches the support or resistance zones.
🔹 Rejections
Rejections are pin bar patterns with high trading volume.
Finally, Multi TimeFrame (MTF) functionality allows users to analyze and observe the Support and Resistance Levels/Zones and their associated Signals from a higher timeframe perspective.
🔶 SETTINGS
The script takes into account user-defined parameters to detect and highlight the zones, levels, and signals.
🔹 Support & Resistance Settings
Detection Timeframe: Set the indicator resolution, the users may examine higher timeframe detection on their chart timeframe.
Detection Length: Swing levels detection length
Check Previous Historical S&R Level: enables the script to check the previous historical levels.
🔹 Signals
Breakouts: Toggles the visibility of the Breakouts, enables customization of the color and the size of the visuals
Tests: Toggles the visibility of the Tests, enables customization of the color and the size of the visuals
Retests: Toggles the visibility of the Retests, enables customization of the color and the size of the visuals
Rejections: Toggles the visibility of the Rejections, enables customization of the color and the size of the visuals
🔹 Others
Sentiment Profile: Toggles the visibility of the Sentiment Profiles
Bullish Nodes: Color option for Bullish Nodes
Bearish Nodes: Color option for Bearish Nodes
🔶 RELATED SCRIPTS
Support-and-Resistance-Levels-with-Breaks
Buyside-Sellside-Liquidity
Liquidity-Levels-Voids

Regression Channel Alternative MTF█ OVERVIEW
This indicator displays 3 timeframes of parallel channel using linear regression calculation to assist manual drawing of chart patterns.
This indicator is not true Multi Timeframe (MTF) but considered as Alternative MTF which calculate 100 bars for Primary MTF, can be refer from provided line helper.
The timeframe scenarios are defined based on Position, Swing and Intraday Trader.
█ INSPIRATIONS
These timeframe scenarios are defined based on Harmonic Trading : Volume Three written by Scott M Carney.
By applying channel on each timeframe, MW or ABCD patterns can be easily identified manually.
This can also be applied on other chart patterns.
█ CREDITS
Scott M Carney, Harmonic Trading : Volume Three (Reaction vs. Reversal)
█ TIMEFRAME EXPLAINED
Higher / Distal : The (next) longer or larger comparative timeframe after primary pattern has been identified.
Primary / Clear : Timeframe that possess the clearest pattern structure.
Lower / Proximate : The (next) shorter timeframe after primary pattern has been identified.
Lowest : Check primary timeframe as main reference.
█ EXAMPLE OF USAGE / EXPLAINATION

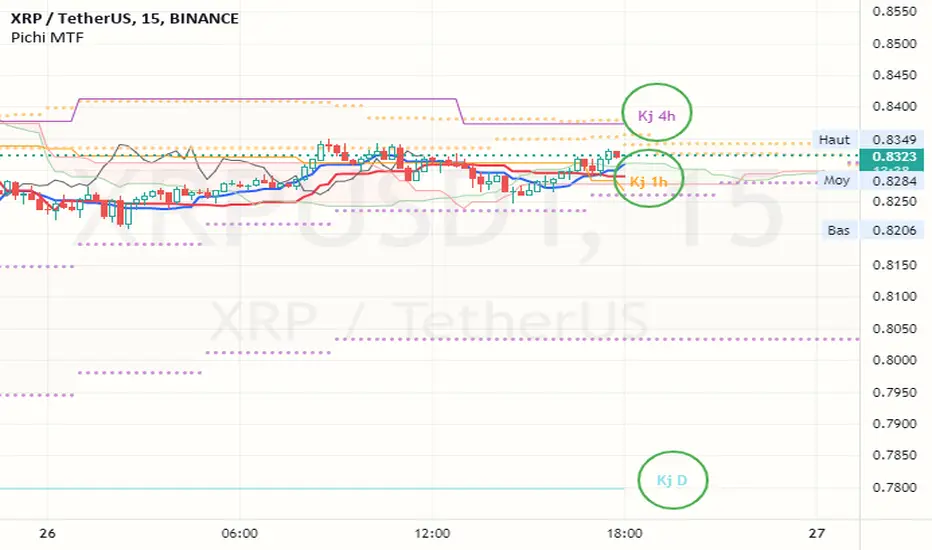
Pax24 MTF IchimokuPax24 Multiple Time Frames and Adaptative Ichimoku Cloud.
(based on the scripts : MTF Selection Framework by PineCoders and MTF ichimoku by anthonyf50)
Possible display :
- four differents Ichimoku, 1 current and 3 from higher UT (depending on your actual UT)
- Tenkan, Kijun, Chikou and Kumo for all
- labels : offset from line, color if you change style and with/without abbreviation
The 3 upper ichimoku you can display depends of your actual Time Frame :
- M1, M3 => M5 M15 H1
- M5 => M15 H1 H4
- M15, M30, M45 => H1 H4 D
- H1, H2, H3 => H4 D W
- H4, H6, H12 => D W M
- D => W M
- W => M
- M => none other
To add the indicator on your graph, go to "Indicators" then search for "Pax24 MTF Ichimoku" and add the script to your favorites.
-------- CONFIGURATION -------
Base : ichimoku numbers
ichimoku and +1 +2 +3 : Show the first ichimoku (actual UT) and 3 others (higher UT)
for each :
Tenkan : Show the Tenkan
Kijun : Show the Kijun
Chikou : Show the Chikou (Lagging span)
Kumo : Show the Kumo
Label : Show the labels
Offset : Label offset
Color : Label color (because you can't change the style of the label in "Style")
Abbreviation : Label abbreviation (Tk = Tenkan)
If you want to best see others UT kumo, change transparency in style for Kumo
There may be slow display since TradingView requires a minimum of candles to make these calculations. Just zoom out and then zoom in to fix the problem (especially for kumo).
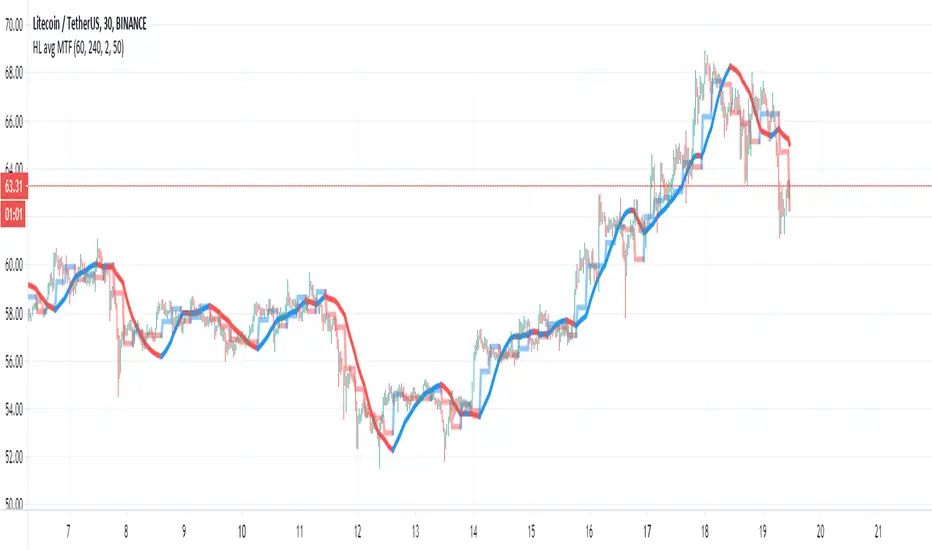
HL avg MTFThis indicator try to find trends more accurate
So first step is to make candle MTF and to find the average of high and low of the MTF candle. I think a ratio of 4/1 is good .
so this seen in the lime /red line
after we take this line and transform it to linear regression type . I use here 50 candle size seen in blue line
if close are above the blue line then we are above the avg of the high and low of the mtf candle .. this indicate a positive trend. if we close is bellow the blue line then it a negative trend and it good time to short it .
also very important is the direction of the blue line as it give us the direction of the trend
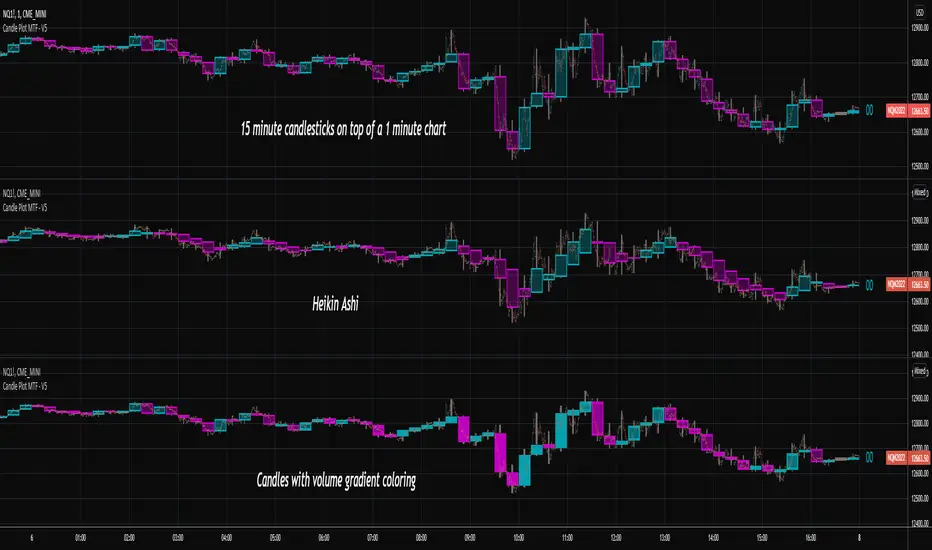
Candlestick Plot MTFPlots the live non-repainting candles for a higher time interval than the chart interval.
Features:
Configuration of the look and feel of the MTF candles.
Live candles update as the price action evolves for the session.
Historical candles can be toggled on/off.
Includes a moving average ribbon that is also MTF, matching the interval chosen.
Please watch this video to understand more:
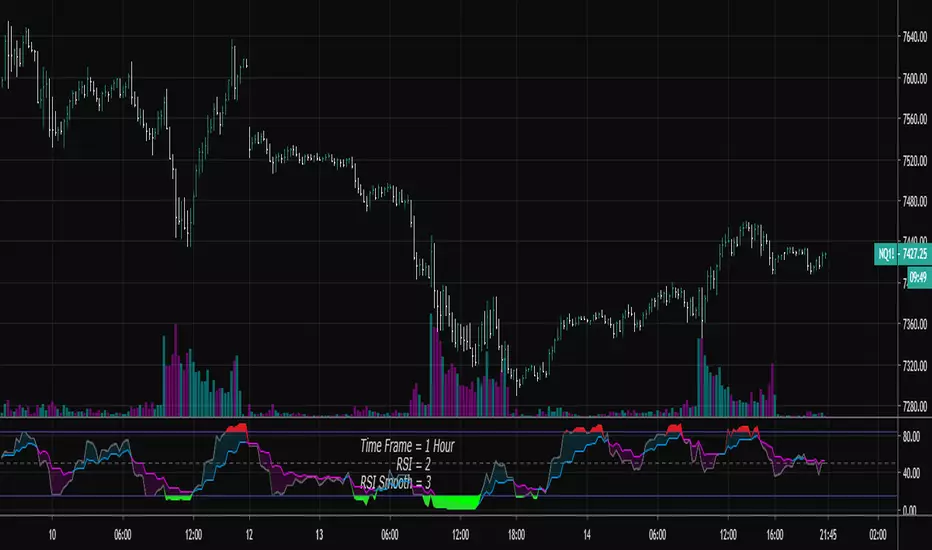
RSI Shaded - MTF
Non-repainting multiple time frame RSI with shading of overbought and oversold levels.
Includes option for simple moving average smooth of the RSI (Larry Connors)
Includes option to plot the EMA of the RSI
Related to RSI Shaded .
For other multiple time frame indicators see:
Adaptive ATR-ADX Trend
Fisher Transform MTF
ADX-DI MTF
Laguerre RSI MTF
[OZ]MTF Ichimoku CloudBased on this script from RicardoSantos:
This script can display Ichimoku cloud , SSA , SSB , Chikou, Kijun and Tenkan from another time frame.
With it you can apply Karen Péloille's MTF Ichimoku Kinko Hyo advanced trading techniques on TradingView.
By default Tenkan is not displayed (fully transparent).
The original script has been enhanced to draw the full cloud beyond the price and to draw the Chikou.

SMA/WMA histogram with MTF and alertsThis histogram is based on the difference between SMA and WMA (I make it as false MACD to create signals)
Since we have the non repainting MTF function we can see the buy and the sell signals at different time frames.
the color of the histo change according to difference so as the color change from dark red to light red be ready to buy and if color change from dark green to light green be ready to sell. The signal based on cross to the 0 .
since you have MTF in build you can change time frame changing int2 to desire min you want
here 60 min MTF on 30 min graph. you can make any variation you want .it flexible model allow you to find the best setting for your purpose

modified DMI with MTF and alertsThis is special indicator based on DMI , I add to time length MTF that is not repainting
you can change the MTF using int2 function
the alerts are based on crossing the 0 (up or down)
I hope you like it
with no MTF

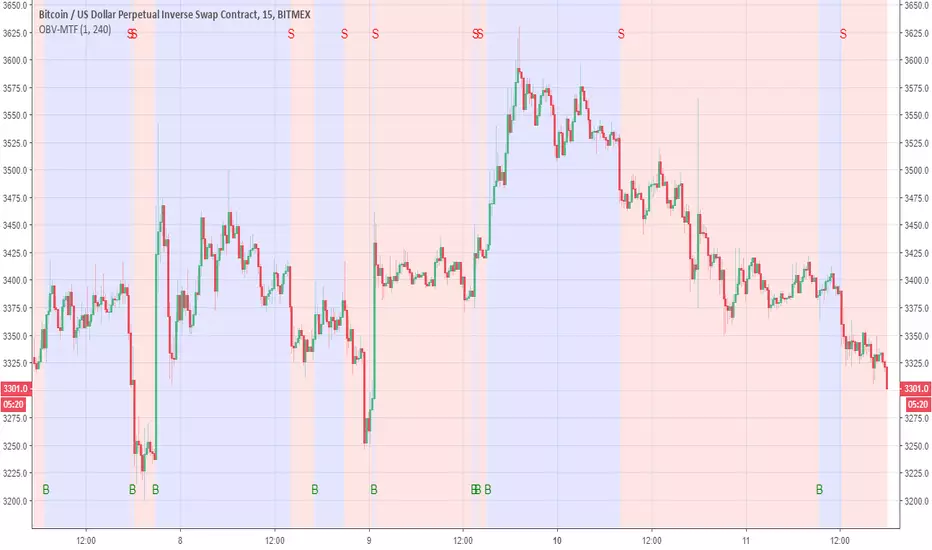
OBV-MTFUsing modified OBV volume equetion and using our modified MTF length (not need to use security so no repaint )
the Buy and Sell reresent in B and S and by the colors of bullish compare to bearish
You change the MTF by changing int2
in this example is set to 240 min MTF over 15 min charts
alerts inside
lsi (study about length and MTF) Here in this example I took lazy bear famous momentum squeeze indicator . the problem that there is lagging in the indicator so the buy and sell will be late . So instead the KC length that the original script had we put
int1=input(30)
int2=input(60)
lengthKC=isintraday and interval >= int1 ? int2/interval * 7 : isintraday and interval < 60 ? 60/interval * 24 * 7 : 7
this allow us to create a time and length related function to indicator and result in better output with no lagging
The second and most important thing is the ability to create indicator with time function as MTF without the security function that create repaint
all you need to do is to change int2 (to the time min of your choice ) and you can create an indicator with MTF function without the security function .And by this hopefully avoid the repainting issue
when you use this indicator change the setting of int1 and int 2 according to time frame that you use
lets say 15 min graph
make the int1 <15 min and the int2 at 15 min. if you want to see it as MTF just increase the int2 to the time set of your choice and play little with int1 to best setting

Automatic MTF PivotsAutomatic MTF Pivots plots horizontal lines at Daily, Weekly, and Monthly Pivots as well as Support and Resistance Levels. In the Input Panel, you can select which levels to be flagged on the chart as well as their colors.
It can be shown on any timeframes with any symbols and provide reliable support and resistance.
Automatic MTF Pivots can be used in isolation or work with any other trading systems. Especially when combined with the AccuTrade System, it can provide solid R/S Levels to further confirm the signals.

Apex Wallet - MTF Trend Monitor: Unified Indicator DashboardOverview The Apex Wallet MTF Trend Meter is a powerful Multi-Timeframe (MTF) dashboard designed to provide a bird's-eye view of market conditions across several time intervals simultaneously. Instead of switching between charts, this tool presents a clean, real-time table directly on your workspace, allowing you to identify high-probability trade setups through timeframe alignment.
Multi-Layered Analysis The dashboard monitors and categorizes technical data into actionable color-coded cells:
Timeframe Master Trend: Tracks the core market direction using EMA filters (adjustable for Scalping, Day, or Swing trading).
Oscillator Confluence: Instant status of Stochastic (STO), RSI, MACD, and TDI.
Andean Oscillator: Specialized tracking for market states including Bullish, Bearish, Consolidating, or Reversing.
Market Volume Delta: Real-time institutional flow tracking with customizable modes (Buy/Sell, Neutral, or Auto).
Key Features:
Fully Customizable Grid: Toggle individual timeframes (from 1m up to 4h) and specific indicators to match your trading strategy.
Smart Adaptive Presets: One-click selection for Scalping, Day-Trading, or Swing-Trading automatically updates all internal indicator periods for optimized performance.
Trend-Filtered Signals: Momentum indicators are filtered by the master trend EMA to ensure signals are displayed only when aligned with the broader market direction.
Compact UI: Designed for efficiency, the dashboard sits discreetly on your chart while providing maximum data density.
How to Use: Identify "Vertical Confluence" where multiple timeframes align with the same color, indicating a high-conviction trend continuation or breakout.

SOFT Speed & Linearity Strategy (MTF) LIVE & BACKTESTSOFT Speed × Linearity Strategy (MTF – LIVE & BACKTEST)
This strategy detects clean impulsive moves by combining real-time price speed with directional quality (linearity).
It is designed for intraday markets such as Gold (XAUUSD), Nasdaq, and Crypto (ETH, BTC), where acceleration quality matters more than raw indicators.
🔹 Core Concepts
1️⃣ Speed ($ per second)
Measures how fast price is moving
Expressed in $/second, not points or ticks
Two execution modes:
LIVE → real-time intra-candle speed using elapsed seconds
BACKTEST → historical approximation using (Close − Open) / candle duration
2️⃣ Linearity Score (1 → 5)
Evaluates movement quality inside the candle:
Net progress vs adverse excursion
Identifies one-way impulses vs noisy back-and-forth moves
Interpretation
1–2 → choppy / rotational
3 → acceptable
4–5 → clean impulse (higher continuation probability)
🔹 Visual Panel
Histogram bars = Speed × Linearity
Color reflects directional quality
Optional info label displays:
Execution mode (LIVE / BACKTEST)
Analysis timeframe
Linearity score
Direction
Speed ($/s)
No drawings are placed on candles.
🔹 Entry Logic
Configurable conditions:
Minimum linearity score
Minimum speed
Direction aligned with candle movement
Long / Short / Both modes
Optional cooldown between signals
⚠️ Speed thresholds are separated for LIVE and BACKTEST to reflect their different nature.
🔹 Exit Modes (Selectable)
A — Symmetric
Exit when entry conditions are no longer valid.
B — Hysteresis (default)
Exit only after controlled degradation:
Linearity falls below a lower threshold
Or speed drops below a lower threshold
C — Momentum
Exit when speed no longer supports the trade direction (speed ≤ 0).
Optional add-ons:
Exit on opposite signal
Exit on speed channel re-entry
🔹 Multi-Timeframe (MTF)
Default analysis timeframe: 15 minutes
Optional lock to chart timeframe
Safety rule for public use:
If chart timeframe < 15m, analysis remains on 15m
Prevents misleading ultra-fast recalculations
🔹 LIVE vs BACKTEST (Important)
LIVE mode uses true intra-candle acceleration
BACKTEST mode uses an approximation to allow reproducible historical testing
Results between LIVE and BACKTEST are not identical by design
This is intentional and clearly separated.
🔹 Alerts
Available alerts:
BUY
SELL
EXIT
Speed channel breakout
ALL events
Compatible with TradingView webhooks.
🔹 Intended Use
This is not a trend indicator.
This is not a prediction tool.
It is a momentum quality detector, useful to:
Validate breakouts
Filter false accelerations
Trade continuation, not anticipation
⚠️ Disclaimer
This script is for educational and research purposes only.
It does not constitute financial advice.
Always test, adapt parameters to your market, and manage risk.

Linear Regression Channel With Pearson's R (Multi Sigma & MTF)This indicator applies multi‑sigma linear regression across multiple institutional time horizons to quantify the line of best fit in equities and index markets. By combining multi‑timeframe presets with statistically derived deviation bands, it highlights trend structure, volatility expansion, and regime transitions with clarity.
What’s New in This Update
The original version of the indicator produced a linear regression channel with multiple deviation bands. However, the statistical values it displayed were not mathematically valid. The value labeled “r” was not Pearson’s correlation coefficient and could not be used to derive R² or any formal regression diagnostics.
This update introduces a fully correct statistical engine based on ordinary least squares (OLS).
NEW STATISTICAL OUTPUTS
• True Pearson’s r
• True R² (coefficient of determination)
• RSS (Residual Sum of Squares)
• TSS (Total Sum of Squares)
These values are mathematically valid, bounded, and directly tied to the regression line.
KEY IMPROVEMENTS
• Correct OLS intercept (removes the erroneous +slope term)
• Proper predicted values using ŷ = b₀ + b₁x
• Correct centering around the actual mean of the data
• Removal of correlation logic from the deviation engine
• Clean separation between statistical computation and volatility computation
• Regression channel visuals remain identical, but the underlying math is now fully accurate
These changes ensure that r and R² reflect true trend strength and model fit, enabling more reliable interpretation of long‑term and short‑term trend regimes.
CORE FEATURES (UNCHANGED)
• Auto‑Multi‑Timeframe presets aligned with institutional trend horizons
• Multi‑Sigma bands (+/‑1σ, +/‑2σ, +/‑3σ) for volatility structure and statistical extremes
• True least‑squares regression recalculated each bar
• Deviation mode toggle (Standard Deviation vs. Max Deviation)
• Full documentation and institutional use‑case examples available on GitHub
More information can be found here:
github.com

Ripster EMA Clouds with MTFCredits & Origins:
This script is a modification of the widely popular EMA Clouds system originally created by @Ripster47. Full credit goes to him for the strategy and original concept. This version simply adds a quality-of-life feature for traders who use multi-timeframe analysis.
What is this Indicator?
The Ripster EMA Clouds system uses overlapping Exponential Moving Averages (EMAs) to visualize trends, momentum, and dynamic support/resistance zones. The "clouds" differ in color to indicate bullish or bearish trends, acting as a visual guide for keeping you on the right side of the trade.
What is New in This Version? (MTF Capability)
The standard version of this indicator calculates EMAs based on your current chart timeframe. If you switch from a 10-minute chart to a 1-minute chart, the clouds change completely.
I have added a "Fixed Timeframe" variable/input that allows you to "lock" the clouds to a specific timeframe, regardless of what chart you are viewing.
Why is this useful? This allows for true Multi-Timeframe (MTF) scalping.
Example: You can set the clouds to look at the 10-minute trend (identifying major support levels) but execute your entries on a 1-minute chart.
The clouds will remain locked to the 10-minute data, giving you the "big picture" view while you trade the micro-movements.
How to Use
Open the indicator settings.
Go to the Inputs tab.
Find the "Fixed Timeframe" option at the top.
Leave Empty (Default): The indicator behaves exactly like the original (adjusts to your chart).
Select a Timeframe (e.g., 10 Minutes): The clouds will lock to the 10-minute EMAs, even if you switch your chart to 1-minute or 5-seconds.
Note on Visuals When viewing Higher Timeframe (HTF) clouds on a Lower Timeframe (LTF) chart, the clouds will appear to have a "stepped" or "ladder-like" appearance. This is normal and accurate. It represents the single EMA value holding constant for that entire higher-timeframe period. This helps you see the true support level rather than a smoothed, repainted line.

VWAP MTF 5-BandVWAP MTF Suite
Overview
The MTF Institutional VWAP Suite is a high-performance, multi-timeframe analysis tool designed for professional traders who require precise structural anchors. Built on the latest Pine Script v6 engine, this indicator allows for the simultaneous tracking of up to five independent VWAPs, each with its own volatility bands and customizable reset logic.
Unlike standard VWAP indicators that are limited to daily sessions, this suite provides institutional "magnets" across multiple horizons, allowing you to visualize where high-volume participants are positioned on a Daily, Weekly, Monthly, or Intraday basis.
Key Features
5 Independent VWAP Engines: Run up to five unique VWAPs concurrently without chart lag.
Multi-Timeframe Anchoring: Choose from hard-coded institutional pivots: Month, Week, Day, 12-Hour, 4-Hour, and 1-Hour.
Institutional Volatility Bands: Each VWAP includes an optional 1-Standard Deviation band calculated using cumulative variance logic for maximum precision.
Advanced UI Controls: Granular toggles for each instance allow you to display only the center line, only the bands, or the full shaded "value area" for any specific timeframe.
Modern Pine v6 Architecture: Utilizes the latest 2026 Pine Script optimizations, including method chaining and global-scope plot execution for a bug-free experience.
How to Use
Identify Value Clusters: When multiple VWAPs (e.g., Daily and Weekly) converge at a single price point, it creates a high-probability "Institutional Pivot" zone.
Mean Reversion: Use the 1-Standard Deviation bands to identify overextended price action. Institutional algorithms often mean-revert toward the VWAP when price reaches the exterior bands in a low-volatility environment.
Trend Confirmation: Use the slope and position of the 4-Hour or Daily VWAP to determine intraday bias. Trading above a rising VWAP confirms a "Long Gamma" or bullish trend.
Settings
Anchor Selection: Defines the starting point of the volume-weighted calculation.
Bands & Fill Toggles: Quickly clean up your chart by hiding the volatility bands or the background shading for specific timeframes.
Visual Customization: Full control over center line colors, global band colors, and label offsets to prevent text overlap on the right-hand scale.
Developer Notes
This script was optimized for the 2026 TradingView environment. It uses a custom variance-tracking function rather than the basic built-in ta.vwap to ensure that standard deviation bands remain mathematically accurate even when crossing multiple sessions or weekend gaps.

Unmitigated MTF High Low Pro - Cave Diving Bookmap Heatmap Plot
Unmitigated MTF High Low Pro - Cave Diving Bookmap Heatmap Plot
---
## 📖 Table of Contents
1. (#what-this-indicator-does)
2. (#core-concepts)
3. (#visual-components)
4. (#the-cave-diving-framework)
5. (#how-to-use-it-for-trading)
6. (#settings--customization)
7. (#best-practices)
8. (#common-scenarios)
---
## What This Indicator Does
The **Unmitigated MTF High Low v2.0** tracks unmitigated (untouch) high and low levels across multiple timeframes, helping you identify key support and resistance zones that the market hasn't revisited yet. Think of it as a sophisticated memory system for price action - it remembers where price has been, and more importantly, where it *hasn't been back to*.
### Why "Unmitigated" Matters
In futures trading, especially on instruments like NQ and ES, the market has a tendency to revisit levels where liquidity was left behind. An "unmitigated" level is one that hasn't been touched since it was formed. These levels often act as magnets for price, and understanding their age and proximity gives you a significant edge in:
- **Entry timing** - Waiting for price to approach tested levels
- **Exit planning** - Taking profits before ancient resistance/support
- **Risk management** - Avoiding entries when approaching multiple old levels
- **Liquidity mapping** - Visualizing where orders likely cluster
---
## Core Concepts
### 1. **Sessions & Age**
The indicator uses **New York trading sessions** (6:00 PM to 5:59 PM NY time) as the primary time measurement. This aligns with how futures markets naturally segment their activity.
**Age Categories:**
- 🟢 **New (0-1 sessions)** - Fresh levels, recently formed
- 🟡 **Medium (2-3 sessions)** - Tested by time, gaining significance
- 🔴 **Old (4-6 sessions)** - Highly significant, survived multiple days
- 🟣 **Ancient (7+ sessions)** - Extreme significance, major support/resistance
The longer a level remains unmitigated, the more significant it becomes. Think of it like compound interest - time adds weight to these zones.
### 2. **Multi-Timeframe Tracking**
You can set the indicator to track high/low levels from any timeframe (default is 15 minutes). This means you're watching for unmitigated 15-minute highs and lows while trading on, say, a 1-minute or 5-minute chart.
**Why this matters:**
- Higher timeframe levels have more weight
- You can see multiple timeframe structure simultaneously
- Helps you avoid fighting larger timeframe momentum
### 3. **Mitigation**
A level becomes "mitigated" (deactivated) when price touches it:
- **High levels** are mitigated when price reaches or exceeds them
- **Low levels** are mitigated when price reaches or goes below them
Once mitigated, the level disappears from view. The indicator only shows you the untouch levels that still matter.
---
## Visual Components
### 📊 The Dashboard Table
Located in the corner of your chart (configurable), the table shows:
```
┌─────────┬───────────┬────────┬─────┬───────┐
│ Level │ Price │ Points │ Age │ % │
├─────────┼───────────┼────────┼─────┼───────┤
│ ↑↑↑↑↑ │ 21,450.25 │ +45.50 │ 8 │ +0.21%│ ← 5th High (Ancient)
│ ↑↑↑↑ │ 21,430.00 │ +25.25 │ 5 │ +0.12%│ ← 4th High (Old)
│ ↑↑↑ │ 21,420.50 │ +15.75 │ 3 │ +0.07%│ ← 3rd High (Medium)
│ ↑↑ │ 21,412.00 │ +7.25 │ 1 │ +0.03%│ ← 2nd High (New)
│ ↑ ⚠️ │ 21,408.25 │ +3.50 │ 0 │ +0.02%│ ← 1st High (Proximity Alert!)
├─────────┼───────────┼────────┼─────┼───────┤
│ 15 mins │ 🟢 │ Δ 8.75 │ 2U │ │ ← Status Row
├─────────┼───────────┼────────┼─────┼───────┤
│ ↓ ⚠️ │ 21,399.50 │ -5.25 │ 0 │ -0.02%│ ← 1st Low (Proximity Alert!)
│ ↓↓ │ 21,395.00 │ -9.75 │ 2 │ -0.05%│ ← 2nd Low (Medium)
│ ↓↓↓ │ 21,385.25 │ -19.50 │ 4 │ -0.09%│ ← 3rd Low (Old)
│ ↓↓↓↓ │ 21,370.00 │ -34.75 │ 6 │ -0.16%│ ← 4th Low (Old)
│ ↓↓↓↓↓ │ 21,350.75 │ -54.00 │ 9 │ -0.25%│ ← 5th Low (Ancient)
├─────────┼───────────┼────────┼─────┼───────┤
│ 📊 15↑ / 12↓ │ ← Statistics (optional)
└─────────┴───────────┴────────┴─────┴───────┘
```
**Reading the Table:**
- **Level Column**: Number of arrows indicates position (1-5), color shows age
- **Price**: The actual price level
- **Points**: Distance from current price (+ for highs, - for lows)
- **Age**: Number of full sessions since creation
- **%**: Percentage distance from current price
- **⚠️**: Proximity alert - price is within threshold distance
- **Status Row**: Shows timeframe, direction (🟢 bullish/🔴 bearish), tunnel width (Δ), and Strat pattern
### 📈 Visual Elements on Chart
**1. Level Lines**
- Horizontal lines showing each unmitigated level
- **Color-coded by age**: Bright colors = new, darker = older, deep purple/teal = ancient
- **Line style**: Customizable (solid, dashed, dotted)
- Automatically turn **yellow** when price gets close (proximity alert)
**2. Price Labels**
- Show the exact price and age: "21,450.25 (8d)"
- Fixed at small size for clean readability
- Positioned with configurable offset from current bar
**3. Bands (Optional)**
- Shaded zones between pairs of unmitigated levels
- Default: Between 1st and 2nd levels (the "tunnel")
- Can switch to 1st-3rd, 2nd-3rd, or disable entirely
- **Upper band** (pink/maroon) - Between unmitigated highs
- **Lower band** (blue/teal) - Between unmitigated lows
- These represent the "no man's land" or consolidation zones
---
## The Cave Diving Framework
This indicator is designed around the **Cave Diving Trading Framework** - a psychological and technical approach that maps cave diving safety protocols to futures trading risk management.
### 🤿 The Core Metaphor
**Cave diving has clear danger zones based on depth and overhead environment. Your trading should too.**
#### Shallow Water (New Levels, 0-1 Sessions)
- **Light**: Bright colors (bright red highs, bright green lows)
- **Psychology**: Fresh territory, recently tested
- **Trading**: Be aware but not overly concerned
- **Cave Diving Parallel**: You can see the surface, easy exit
#### Penetration Depth (Medium Levels, 2-3 Sessions)
- **Light**: Medium intensity colors
- **Psychology**: Building significance, market memory forming
- **Trading**: Start respecting these levels for entries/exits
- **Cave Diving Parallel**: Deeper in, need to track your line back
#### Deep Dive Zone (Old Levels, 4-6 Sessions)
- **Light**: Dark colors (deep maroon, dark blue)
- **Psychology**: Highly tested support/resistance
- **Trading**: Major decision points, plan accordingly
- **Cave Diving Parallel**: Significant overhead, careful navigation required
#### Overhead Environment (Ancient Levels, 7+ Sessions)
- **Light**: Very dark, purple/deep teal
- **Psychology**: Extreme caution required, major liquidity zones
- **Trading**: These are your "turn back" signals - don't fight ancient levels
- **Cave Diving Parallel**: Maximum danger, no room for error
### 🎯 The Proximity Alert System
Just like a cave diver's depth gauge that warns at critical thresholds, the proximity alerts (⚠️) tell you when you're entering a danger zone. When price gets within your configured threshold (default 5 points), the indicator:
- Highlights the level in **yellow** on the chart
- Shows **⚠️** in the table
- Signals: "You're entering a high-significance zone - adjust your position accordingly"
This prevents the trading equivalent of going deeper into a cave without checking your air supply.
---
## How to Use It for Trading
### 🎯 Entry Strategies
**1. The "Bounce Setup" (Mean Reversion)**
- Wait for price to approach an old or ancient unmitigated level
- Look for confluence: multiple levels nearby, bands narrowing
- Enter when price shows rejection (reversal candle patterns)
- **Example**: Price drops to a 6-session-old low, shows bullish engulfing → Long entry
**2. The "Break and Retest" (Trend Following)**
- Wait for price to break through an unmitigated level (mitigates it)
- Enter on the retest of the newly broken level
- **Example**: Price breaks above 4-session-old high → Wait for pullback to that level → Long entry
**3. The "Tunnel Trade" (Range Trading)**
- When bands are active, trade the range between 1st-2nd levels
- Short near upper band resistance, long near lower band support
- Exit at opposite side or when bands break
### 🚨 Risk Management Rules
**The Ancient Level Rule**
> Never fight ancient levels (7+ sessions). If you're long and approaching an ancient high, take profits. If you're short and approaching an ancient low, take profits.
These levels have survived a full trading week without being touched - there's likely significant liquidity and institutional interest there.
**The Proximity Exit Rule**
> When you see ⚠️ proximity alerts on multiple levels above/below your position, tighten stops or scale out.
This is your "overhead environment" warning. You're in dangerous territory.
**The New Level Filter**
> Be cautious taking positions based solely on new levels (0-1 sessions). Wait for them to age or combine with other confluence.
Fresh levels haven't been tested by time. They're like unconfirmed support/resistance.
### 📊 Reading Market Structure
**Bullish Structure (🟢 in status row)**
- Unmitigated lows are aging and holding
- Price respecting the lower band
- Old lows below acting as strong support
- **Bias**: Look for long entries at lower levels
**Bearish Structure (🔴 in status row)**
- Unmitigated highs are aging and holding
- Price respecting the upper band
- Old highs above acting as strong resistance
- **Bias**: Look for short entries at higher levels
**The Tunnel Compression**
- When the Δ (delta) in the status row is small, levels are tight
- This often precedes a breakout
- **Trading**: Wait for breakout direction, then trade the break
### 🔄 Strat Integration
The indicator shows Strat patterns in the status row:
- **1** - Inside bar (consolidation)
- **2U** - Broke high only (bullish)
- **2D** - Broke low only (bearish)
- **3** - Broke both (wide range, volatility)
Use these with the unmitigated levels:
- **2U near old high** → Potential resistance, watch for rejection
- **2D near old low** → Potential support, watch for bounce
- **3 pattern** → High volatility, respect wider stops
---
## Settings & Customization
### 📅 Session & Timeframe Settings
**HL Interval** (Default: 15 minutes)
- The timeframe for high/low calculation
- **Lower (1m, 5m)**: More levels, more noise, good for scalping
- **Higher (30m, 1H, 4H)**: Fewer levels, stronger significance, good for swing trading
- **Recommendation for NQ/ES**: 15m or 30m for day trading, 1H for swing trading
**Session Age Threshold** (Default: 2)
- How many sessions before a level is considered "old"
- Lower = more levels classified as old
- Higher = stricter definition of significance
### 📊 Level Display Options
**Show Level Lines**
- Toggle: Display horizontal lines for each level
- **Turn off** if you prefer a cleaner chart and only want the table
**Show Level Labels**
- Toggle: Display price labels on the chart
- **Turn off** for minimal visual clutter
**Label Offset**
- Distance (in bars) from current price bar to place labels
- Increase if labels overlap with price action
**Level Line Width & Style**
- Customize visual appearance
- **Thin solid**: Minimal distraction
- **Thick dashed**: High visibility
### 🎨 Age-Based Color Coding
Customize colors for each age category (high and low separately):
- **New (0-1 sessions)**: Default bright red/green
- **Medium (2-3 sessions)**: Default medium intensity
- **Old (4+ sessions)**: Default dark red/blue
- **Ancient (7+ sessions)**: Default deep purple/teal
**Color Strategy Tips:**
- Keep ancient levels in highly contrasting colors
- Use opacity (transparency) if you want subtler lines
- Match your chart's color scheme for aesthetic coherence
### 🎯 Band Settings
**Band Mode**
- **1st-2nd** (Default): The primary "tunnel" between most recent levels
- **1st-3rd**: Wider band, more room for price action
- **2nd-3rd**: Band between less immediate levels
- **Disabled**: No bands, lines only
**Band Colors & Borders**
- Customize fill color and border separately
- **Tip**: Keep bands very transparent (90-95% transparency) to avoid obscuring price action
### ⚠️ Proximity Alert Settings
**Enable Proximity Alerts**
- Toggle: Turn on/off the warning system
- When enabled, levels within threshold distance show ⚠️ and turn yellow
**Alert Threshold** (Default: 5.0 points)
- Distance in points to trigger the alert
- **For NQ**: 5-10 points is reasonable
- **For ES**: 2-5 points is reasonable
- **For MES/MNQ**: Scale down proportionally
**Alert Highlight Color**
- The color lines/labels turn when proximity is triggered
- Default: Yellow (high visibility)
### 📋 Table Settings
**Show Table**
- Toggle: Display the dashboard table
**Table Location**
- Top Left, Top Right, Bottom Left, Bottom Right
- Choose based on your chart layout and other indicators
**Text Size**
- Tiny, Small, Normal, Large
- **Recommendation**: Normal for 1080p monitors, Small for 4K
**Show % Distance**
- Toggle: Add percentage distance column to table
- Useful for comparing relative distances across different price ranges
**Show Statistics Row**
- Toggle: Show total count of unmitigated highs/lows
- Format: "📊 15↑ / 12↓" (15 unmitigated highs, 12 unmitigated lows)
- Useful for gauging overall market structure
### ⚡ Performance Settings
**Enable Level Cleanup**
- Automatically remove very old levels to maintain performance
- **Keep on** unless you want unlimited history
**Max Lookback Levels** (Default: 10,000)
- Maximum number of levels to track
- 10,000 ≈ 6+ months of 15-minute bars
- **Increase** if you want more history
- **Decrease** if experiencing performance issues
**Max Boxes Per Band** (Default: 245)
- TradingView limit is 500 total boxes
- With 2 bands, 245 each = 490 total (safe maximum)
---
## Best Practices
### 🎯 Position Management
**1. Scaling In Near Old Levels**
```
Price approaching 5-session-old low:
- First position: 30% size at proximity alert (⚠️)
- Second position: 40% size at exact level
- Third position: 30% size if it shows strong rejection
```
**2. Scaling Out Near Ancient Levels**
```
Holding long position, approaching 8-session-old high:
- Exit 50% at proximity alert (⚠️)
- Exit 30% at exact level
- Trail stop on remaining 20%
```
### 🧠 Trading Psychology Integration
Drawing from principles in *The Mountain Is You*, this indicator helps you:
**1. Recognize Self-Sabotage Patterns**
- **The Premature Entry**: Entering before price reaches your planned level
- **Solution**: Set alerts at unmitigated levels, wait for proximity warnings
- **The Profit-Taking Problem**: Exiting too early from fear
- **Solution**: Identify the next unmitigated level and commit to holding until proximity alert
- **The Loss Holding**: Refusing to exit losing trades
- **Solution**: When price breaks through and mitigates your entry level, it's telling you the structure changed
**2. Building Better Habits**
The color-coded age system trains your brain to:
- Respect levels that have proven themselves over time
- Distinguish between noise (new levels) and structure (old levels)
- Make decisions based on objective data, not fear or greed
**3. Emotional Regulation**
The proximity alerts serve as:
- **Circuit breakers** - Forcing you to re-evaluate before dangerous zones
- **Permission to act** - Giving you objective signals to exit without second-guessing
- **Validation** - Confirming when you're in alignment with market structure
### 📝 Pre-Market Routine
**Daily Setup Checklist:**
1. ✅ Identify the 3 nearest unmitigated highs above current price
2. ✅ Identify the 3 nearest unmitigated lows below current price
3. ✅ Note which are ancient (7+) - these are your "no-go" zones
4. ✅ Check the tunnel width (Δ in status row) - tight or wide?
5. ✅ Set alerts at the 1st high and 1st low for proximity warnings
6. ✅ Plan: "If we go up, I exit at ___. If we go down, I enter at ___."
### 🔄 Timeframe Confluence
**Multi-Timeframe Strategy:**
Run the indicator on **three instances**:
- **15-minute** (short-term structure)
- **1-hour** (intermediate structure)
- **4-hour** (major structure)
**Strong Setup**: When all three timeframes show unmitigated levels converging at the same price zone.
**Example:**
- 15m: Old low at 21,400
- 1H: Ancient low at 21,398
- 4H: Ancient low at 21,395
- **Result**: 21,395-21,400 is a monster support zone
### ⚠️ What This Indicator Doesn't Do
**Not a Crystal Ball**
- It doesn't predict where price will go
- It shows you where price *hasn't been* and how long it's been avoided
- The trading decisions are still yours
**Not an Entry Signal Generator**
- It provides context and structure
- You need to combine it with your entry methodology (price action, indicators, order flow, etc.)
**Not Foolproof**
- Ancient levels get broken
- Proximity alerts can trigger early in strong trends
- The market doesn't "owe" you a reversal at any level
---
## Common Scenarios
### Scenario 1: "Level Cluster Ahead"
**Situation**: You're long at 21,400. The table shows:
- 1st High: 21,425 (2 sessions old)
- 2nd High: 21,428 (3 sessions old)
- 3rd High: 21,435 (6 sessions old)
**Interpretation**: There's a resistance cluster just 25-35 points away. The 6-session-old level is particularly significant.
**Action**:
- Set first profit target at 21,420 (before the cluster)
- Set second target at 21,426 (between 1st and 2nd)
- Trail remaining position, but be ready to exit on rejection at 21,435
**Cave Diving Analogy**: You're approaching an overhead section with limited clearance. Lighten your load (reduce position) before entering.
---
### Scenario 2: "Ancient Level Approaches"
**Situation**: The market is grinding higher. You see ⚠️ appear next to a 9-session-old high at 21,500.
**Interpretation**: This level has survived over a week without being touched. Massive potential liquidity zone.
**Action**:
- If long, this is your absolute exit zone. Take profits before or at level.
- If looking to short, wait for clear rejection (price taps and reverses)
- Don't try to buy the breakout until it clearly breaks and retests
**Cave Diving Analogy**: Your dive computer is beeping - you've reached your planned turn-back depth. No matter how interesting it looks ahead, honor your plan.
---
### Scenario 3: "Mitigated Levels Create New Structure"
**Situation**: Price breaks and mitigates the 1st High. The previous 2nd High becomes the new 1st High.
**Interpretation**: The structure just shifted. What was the 2nd level is now most relevant.
**Action**:
- Watch how price reacts to the newly-mitigated level
- If it holds below (acts as resistance), bearish
- If it reclaims and holds above (acts as support), bullish
- The NEW 1st High is your next target/resistance
**Cave Diving Analogy**: You've passed through a restriction - the cave layout ahead is different now. Update your mental map.
---
### Scenario 4: "Tight Tunnel, Upcoming Breakout"
**Situation**: The Δ in the status row shows 3.25 points (very tight). Bands are converging.
**Interpretation**: Price is consolidating between very close unmitigated levels. Breakout likely.
**Action**:
- Don't try to predict direction
- Set alerts above 1st High and below 1st Low
- When break occurs, trade the retest
- Expect volatility - use wider stops
**Cave Diving Analogy**: You're in a narrow passage. Movement will be sudden and directional once it starts.
---
### Scenario 5: "Imbalanced Structure"
**Situation**: The statistics row shows "📊 22↑ / 7↓"
**Interpretation**: There are many more unmitigated highs than lows. This suggests:
- Price has been declining (hitting lows, leaving highs behind)
- Potential bullish reversal zone (lots of overhead supply mitigated)
- Or continued bearish structure (resistance everywhere above)
**Action**:
- Look at the age of those 22 highs
- If mostly new (0-2 sessions): Just a recent downmove, not significant yet
- If many old/ancient: Strong overhead resistance, be cautious on longs
- Compare to price action: Is price respecting the remaining lows?
**Cave Diving Analogy**: You've swam deeper than your starting point - most of your markers are above you now. Are you planning the ascent or going deeper?
---
## Final Thoughts: The Philosophy
This indicator is built on a simple but powerful principle: **The market has memory, and that memory has weight.**
Every unmitigated level represents:
- Liquidity left behind
- Orders waiting to be filled
- Institutional interest potentially parked
- Psychological significance for participants
The longer a level remains unmitigated, the more "charged" it becomes. When price finally revisits it, something significant usually happens - either a strong reversal or a definitive break.
Your job as a trader isn't to predict which outcome will occur. Your job is to:
1. **Recognize** when you're approaching these charged zones
2. **Respect** them by adjusting position size and risk
3. **React** appropriately based on how price behaves at them
4. **Remember** that ancient levels (like ancient wisdom) deserve extra reverence
The Cave Diving Framework embedded in this indicator serves as a constant reminder: Trading, like cave diving, requires rigorous respect for environmental hazards, meticulous planning, and the discipline to turn back when your limits are reached.
**Every proximity alert is the market asking you**: *"Do you really want to go deeper?"*
Sometimes the answer is yes - when your setup, confluence, and risk management all align.
Often, the answer should be no - and that's the trader avoiding the accident that would have happened to the gambler.
---
### 🎯 Quick Reference Card
**Color System:**
- 🟢 Bright colors = New (0-1 sessions) = Shallow water
- 🟡 Medium colors = Medium (2-3 sessions) = Penetration depth
- 🔴 Dark colors = Old (4-6 sessions) = Deep dive zone
- 🟣 Deep dark colors = Ancient (7+ sessions) = Overhead environment
**Symbols:**
- ↑ ↑↑ ↑↑↑ ↑↑↑↑ ↑↑↑↑↑ = High levels (1st through 5th)
- ↓ ↓↓ ↓↓↓ ↓↓↓↓ ↓↓↓↓↓ = Low levels (1st through 5th)
- ⚠️ = Proximity alert (danger zone)
- 🟢 = Bullish structure
- 🔴 = Bearish structure
- Δ = Tunnel width (distance between 1st high and 1st low)
**Critical Rules:**
1. Never fight ancient levels (7+ sessions)
2. Respect proximity alerts (⚠️)
3. Scale out near old/ancient resistance
4. Wait for confluence when entering
5. Let mitigated levels prove their new role
---
**Remember**: The indicator gives you structure. The trading edge comes from your discipline in respecting that structure.
Trade safe, trade smart, and always know your exit before your entry. 🎯
---
*"You don't become your best self by denying your patterns. You become your best self by recognizing them, understanding them, and choosing differently." - Adapted from The Mountain Is You*
In trading: You don't become profitable by ignoring market structure. You become profitable by recognizing it, understanding it, and choosing your entries accordingly.

Universe_Super MA [MTF & Multi-Type]**Overview**
"Universe_Super MA" is a comprehensive trend analysis tool designed to overcome indicator limits. Instead of adding 4 separate moving averages, this script allows you to monitor 4 distinct Moving Averages within a single indicator slot.
It features full **Multi-Timeframe (MTF)** capabilities, meaning you can view higher timeframe trends (e.g., Daily 200 SMA) while trading on lower timeframes (e.g., 15-minute chart).
**Default Configuration (Institutional Setup)**
The indicator comes pre-loaded with a powerful institutional trend setup:
1. **50 Period (Green):** Short-term trend and dynamic support.
2. **99 Period (Orange):** Medium-term trend filter.
3. **200 Period (Red):** The classic institutional dividing line between Bull and Bear markets.
4. **389 Period (Blue):** A long-term "Deep Trend" baseline used to identify major market cycles and heavy support/resistance levels.
**Key Features**
* **fully Customizable:** You can change the Length, Color, and Width of each line.
* **Multi-Timeframe (MTF):** Select any timeframe for any MA. (e.g., Keep MA1 on the "Chart" timeframe, but lock MA4 to the "Daily" timeframe).
* **6 MA Types:** Choose between SMA, EMA, WMA, HMA (Hull), RMA, and VWMA for each line independently.
* **Clean Interface:** Toggle any line On/Off via settings without removing the indicator.
**Usage & Interpretation**
* **Trend Identification:** The 200 (Red) and 389 (Blue) lines are designed to visualize the long-term market bias. In technical analysis, price action sustaining above these levels is generally considered a bullish context, while price below suggests a bearish context.
* **Crossover Monitoring:** The script facilitates the observation of interactions between short-term and long-term averages (e.g., the 50 crossing the 200), allowing users to easily spot common technical patterns like the "Golden Cross".
* **Dynamic Levels:** The 99 and 200-period lines act as dynamic levels that may align with technical support or resistance zones during market retracements.
**Settings**
* **Timeframe:** Leave empty to use the current chart's timeframe, or select a specific one (e.g., "1D" or "4H").
* **Type:** Select your preferred calculation method (SMA is default).
**Disclaimer**
This tool is for educational purposes and trend visualization only. Always manage your risk.

Optimal Daily MA Suite [MTF]Title: Optimal Daily MA Suite
Description: This is a comprehensive Multi-Timeframe (MTF) analysis suite designed to streamline chart layouts. Instead of loading multiple separate indicators to track various trend lines, this single tool allows traders to overlay higher-timeframe Moving Averages and key support/resistance levels directly onto their intraday charts.
Utility & Workflow: Swing traders and day traders often need to monitor "Big Picture" Daily Moving Averages (like the Daily 200 SMA or Daily 50 EMA) while executing trades on lower timeframes like the 15m or 1H. This tool automates that process, ensuring the major trend context is always visible without cluttering the indicator list.
Key Features:
Multi-Timeframe Engine: By default, all MAs are calculated on the Daily ("D") timeframe, regardless of the chart's current timeframe. This creates a stable "anchor" for trend analysis. The timeframe is fully customizable in the settings (e.g., set to "W" for Weekly analysis).
10 Customizable Slots: Toggle up to 10 different Moving Averages on/off individually.
Flexible Calculation Types: Supports SMA, EMA, WMA, VWMA, RMA (SMMA), and SWMA for every single line.
Trend Cloud Crossovers: Includes two dedicated "Cloud" setups to visualize crossovers (e.g., Golden Cross or Death Cross) with fill shading between the fast and slow lines.
Price Action Crossovers: Optional markers to highlight when the closing price crosses specific MAs.
Contextual Levels: Includes Previous Day High (PDH) and Previous Day Low (PDL) markers for immediate intraday support/resistance context.
How to Use:
Settings: Open the settings menu to select your "Indicator Timeframe" (Default: Daily).
Customization: Enable only the MAs relevant to your strategy (e.g., Enable MA 8 for the 50 SMA and MA 10 for the 200 SMA).
Clouds: Use the "Crossover Set" inputs to define a Bullish/Bearish trend cloud between two moving averages of your choice.
Technical Note: This script uses request.security with lookahead=barmerge.lookahead_off to ensure no repainting of historical data while providing accurate higher-timeframe values on closed bars.
Credits: Standard Moving Average calculations based on TradingView built-in functions.

Unmitigated MTF High Low - Cave Diving Plot
IntroductionThe Unmitigated MTF High Low -
Cave Diving Plot is a multi-timeframe (MTF) indicator designed for NQ and ES futures traders who want to identify high-probability entry and exit zones based on unmitigated price levels. The "Cave Diving" visualization helps you navigate between support (floor) and resistance (ceiling) zones, while the integrated Strat analysis provides directional context.
Who Is This For?
Futures traders (NQ, ES) trading during ETH and RTH sessions
Scalpers and day traders looking for precise entry/exit levels
Traders using The Strat methodology for directional analysis
Anyone seeking confluence between price action and key levels
Core Concepts
1. Unmitigated Level:
An unmitigated level is a price high or low that has been created but not yet tested (touched) by price. These levels act as magnets - price often returns to test them.Key Properties:
Resistance (Highs): Price has created a high but hasn't revisited it
Support (Lows): Price has created a low but hasn't revisited it
Mitigation: When price touches a level, it becomes "mitigated" and loses strength
2. The Cave Diving MetaphorThink of trading as cave diving between two zones:
┌─────────────────────────────────┐
│ CEILING (Upper Band) │ ← 1st & 2nd Unmitigated Highs
│ 🟥 Resistance Zone │
├─────────────────────────────────┤
│ │
│ THE TUNNEL │ ← Price navigates here
│ (Trading Channel) │
│ │
├─────────────────────────────────┤
│ 🟢 Support Zone │
│ FLOOR (Lower Band) │ ← 1st & 2nd Unmitigated Lows
└─────────────────────────────────┘
Trading Concept:
Ceiling: Formed by the 1st and 2nd most recent unmitigated highs
Floor: Formed by the 1st and 2nd most recent unmitigated lows
Tunnel: The space between ceiling and floor where price operates
Cave Diving: Navigating between these zones for entries and exits
3. Session-Based Age TrackingLevels are tracked by session age:
Session: 6:00 PM to 5:00 PM NY time (23-hour window)
Age 0: Created in the current session (today)
Age 1: Created 1 session ago (yesterday)
Age 2+: Older levels (more significant)
Why Age Matters:
Older unmitigated levels are typically stronger magnets
Fresh levels (Age 0) may be weaker and easier to break
Age 2+ levels often provide high-probability reversal zones
Indicator Components
Visual Elements
1. Colored Bands (Cave Zones)Upper Band (Pink/Maroon - 95% transparency)
Space between 1st and 2nd unmitigated highs
Acts as resistance zone
Price often hesitates or reverses here
Lower Band (Teal - 95% transparency)
Space between 1st and 2nd unmitigated lows
Acts as support zone
Price often finds buyers here
2. Information Table Located in your chosen corner (default: Bottom Right), the table displays:
5 most recent unmitigated highs (top section)
Tunnel row (middle separator)
5 most recent unmitigated lows (bottom section)
Reading the TableTable Structure
┌────────┬──────────┬────────┬───────┐
│ Level │ $ │ Points │ Age │
├────────┼──────────┼────────┼───────┤
│ ↑↑↑↑↑ │ 21,450.25│ +45.30 │ 3 │ ← 5th High (oldest)
│ ↑↑↑↑ │ 21,425.50│ +32.75 │ 2 │ ← 4th High
│ ↑↑↑ │ 21,410.00│ +25.00 │ 1 │ ← 3rd High
│ ↑↑ │ 21,400.75│ +18.50 │ 1 │ ← 2nd High
│ ↑ │ 21,395.25│ +12.00 │ 0 │ ← 1st High (newest)
├────────┼──────────┼────────┼───────┤
│ Tunnel │ 🟢 │ Δ 85.50│ 2U │ ← Current State
├────────┼──────────┼────────┼───────┤
│ ↓ │ 21,310.00│ -15.25 │ 0 │ ← 1st Low (newest)
│ ↓↓ │ 21,295.50│ -22.75 │ 1 │ ← 2nd Low
│ ↓↓↓ │ 21,280.25│ -30.00 │ 1 │ ← 3rd Low
│ ↓↓↓↓ │ 21,265.75│ -38.50 │ 2 │ ← 4th Low
│ ↓↓↓↓↓ │ 21,250.00│ -45.00 │ 3 │ ← 5th Low (oldest)
└────────┴──────────┴────────┴───────┘Column
Breakdown
Column 1: Level (Arrows)
Green arrows (↑): Resistance levels above current price
Red arrows (↓): Support levels below current price
Arrow count: Indicates recency (1 arrow = newest, 5 arrows = oldest)
Why This Matters:
More arrows = older level = stronger magnet for price
Column 2: $ (Price)
Exact price of the unmitigated level
Use this for limit orders and stop placement
Column 3: Points (Distance)
Positive (+) for highs: Points above current price
Negative (-) for lows: Points below current price
Helps gauge proximity to key levels
Trading Application:
If you're +2.50 points from resistance, a reversal may be imminent
If you're -45.00 points from support, you're far from the floor
Column 4: Age (Sessions)
Number of full 6pm-5pm sessions the level has survived
Age 0: Created today (current session)
Age 1+: Created in previous sessions
Significance Ladder:
Age 0: Weak, may break easily
Age 1-2: Medium strength
Age 3+: Strong, high-probability reaction zone
Tunnel Row (Critical Information)│ Tunnel │ 🟢 │ Δ 85.50│ 2U │
└─┬─┘ └─┬─┘ └──┬──┘ └─┬─┘
│ │ │ │
Label Direction Range Strat
1. Tunnel Label: Identifies the separator row
2. Direction Indicator (🟢/🔴)
🟢 Green Circle: Current 15m bar closed bullish (above previous close)
🔴 Red Circle: Current 15m bar closed bearish (below previous close)
3. Δ (Delta/Range)
Distance in points between 1st High and 1st Low
Shows the tunnel width (trading range)
Example: Δ 85.50 = 85.50 points between ceiling and floor
Trading Use:
Wide tunnel (>100 points): More room to trade, consider range strategies
Narrow tunnel (<50 points): Tight range, expect breakout
4. Strat Pattern
1: Inside bar (consolidation)
2U: 2 Up (bullish directional bar)
2D: 2 Down (bearish directional bar)
3: Outside bar (expansion/volatility)
Color Coding:
Green: 2U (bullish)
Red: 2D (bearish)
Yellow: 3 (expansion)
Gray: 1 (inside/neutral)
