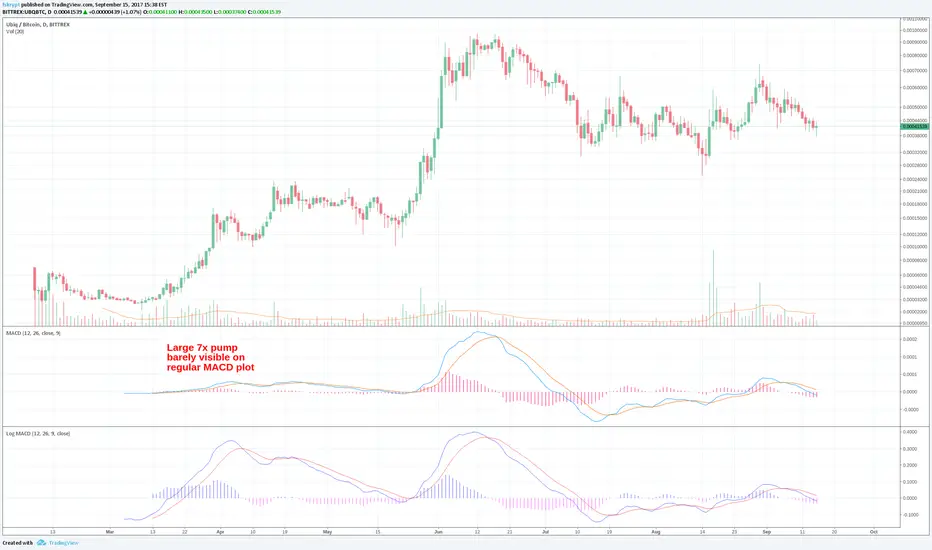
Log-space MACDThis indicator is identical to regular MACD indicator except it is calculated in log space, which is useful for looking at long-term trends.
Wyszukaj w skryptach "macd"
4 Hour MACD (Philip Nel ForexFactory)This is the basic script that shows MACD as described with settings in the thread www.forexfactory.com

Hull MACD with Force Index Backcolorswww.tradingview.com
Like many other indicators this tells the past and it will dutifully follow the future price changes whatever they will be.
This is an upgrade of the "Hull Moving Average Convergence/Divergence" low lag indicator in my scripts. Added Elder Force Index (background colors) to include effects of Volume.
When EFI goes positive the background goes green, when it slopes up (more positive than previous bar) it is darker green. Negative red and slope down darker red.
I find it useful in all time frames but I use mostly hour and day. The direction color combined with price action and macd tell whether the volume supports the price movement and the shading (darker green for increasing up volume and darker red for increasing down volume) tells of the degree of support.
Since when the EFI is positive and dropping, for example, the price can be dropping with opposite for negative.
Dark shading tells where the EFI and possibly the price is headed (at the moment).
Light shading says to check more on other indications for likely direction.
Changed also the histogram color so it stands out of background and added hlines to make relative volatility and peak height easier to see.
Anyway help yourself if any of this code is useful to you, enjoy, happy trading and Keep Smiling!

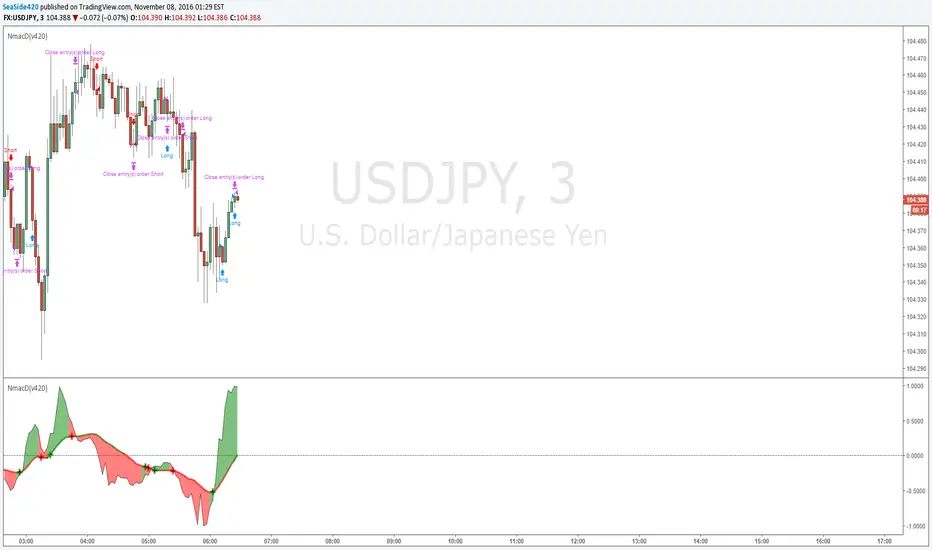
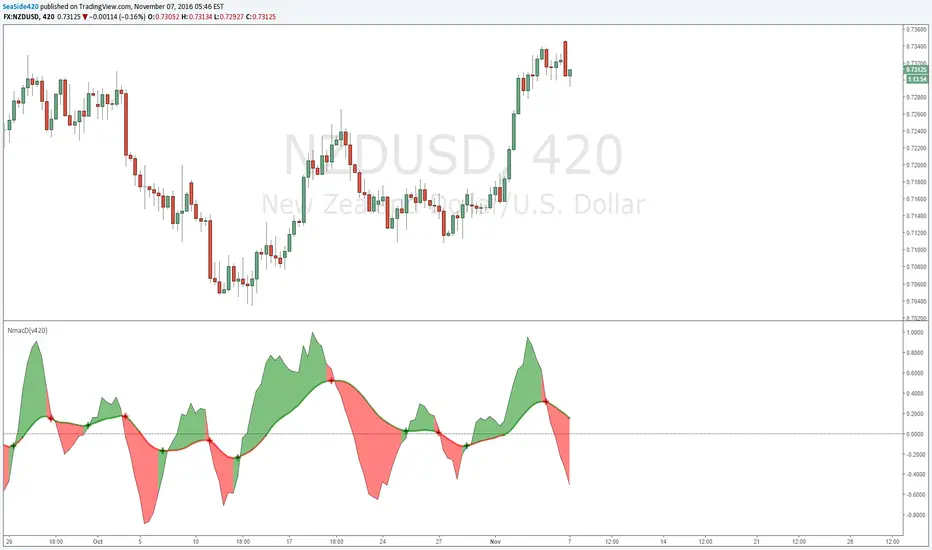
Normalized MACD (v420) strategyNormalized MACD but heavily modified for example hullMA instead of EMA
the strategy
MACD+STOCHASTICA simple strategy that use MACD and STOCHASTIC to give buy/sell signal. Use fractals to put stop loss
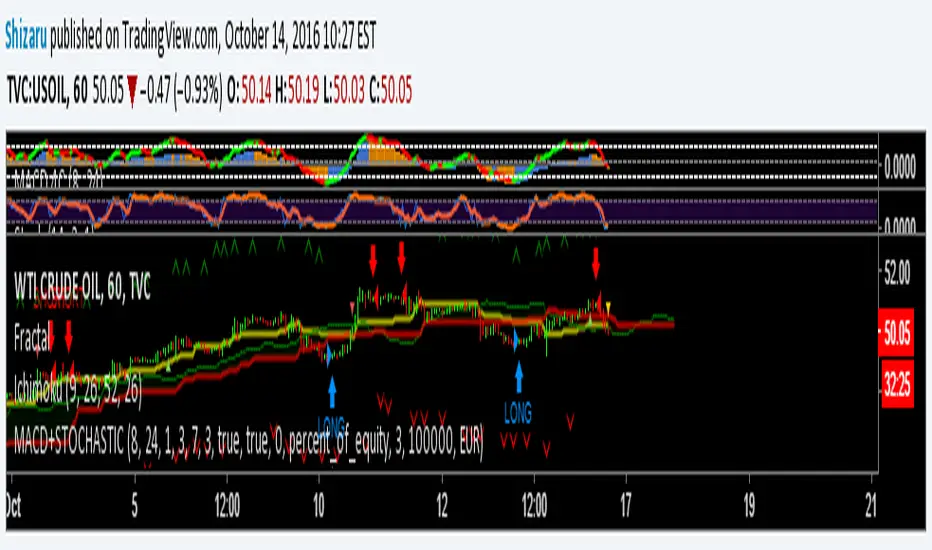
Ichimoku + Daily-Candle_X + HULL-MA_X + MacDIchimoku_cloud + Daily-Candle_cross(DT) + HuLL-MovingAverage_cross + MacD
any timeframe, all indicators settings adjustable for fine tuning to pair/timeframe
Target Point and Stop Loss settings
set SL low to reduce repaint

Multi Timeframe MACDThis will show you the MACD (no Signal Line) of the higher timeframes (up to 4h). Current Timeframe is colored blue, higher timeframes are colored from light gray to darker gray (you can change that).

AK MACD BB INDICATOR V 1.00Here's my version of the MACD _BB . This is a great indicator to capture short term trends.
yellow candles = long
aqua candles = short
This indicator can be much better. I will work on it and publish an improved version (hopefully) soon. In the mean time , go ahead and play around with the code, and please share your findings :)
Cheers
Algo

MacD Custom Indicator-Multiple Time Frame+All Available Options!This MacD Indicator has every feature available. See First Post for Details.


Moving Average Convergence Divergence Zero LagMACD with zero lag. Implementation - double MACD on fast and slow timeframes before MACD on the difference between the two.

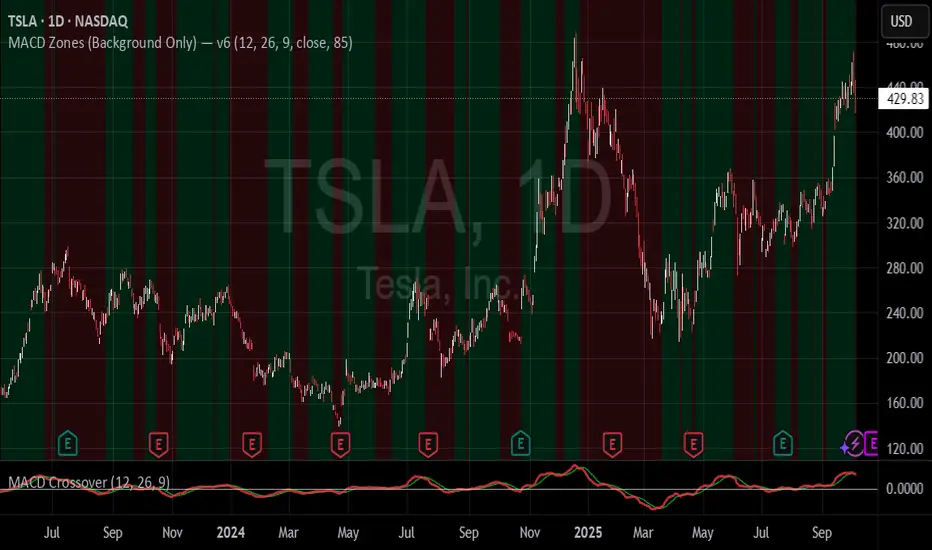
MACD Zones (Background Only)Indicator which shows the convergence and divergence zones directly on the graph by highlighting in red (convergence) and green (divergence).
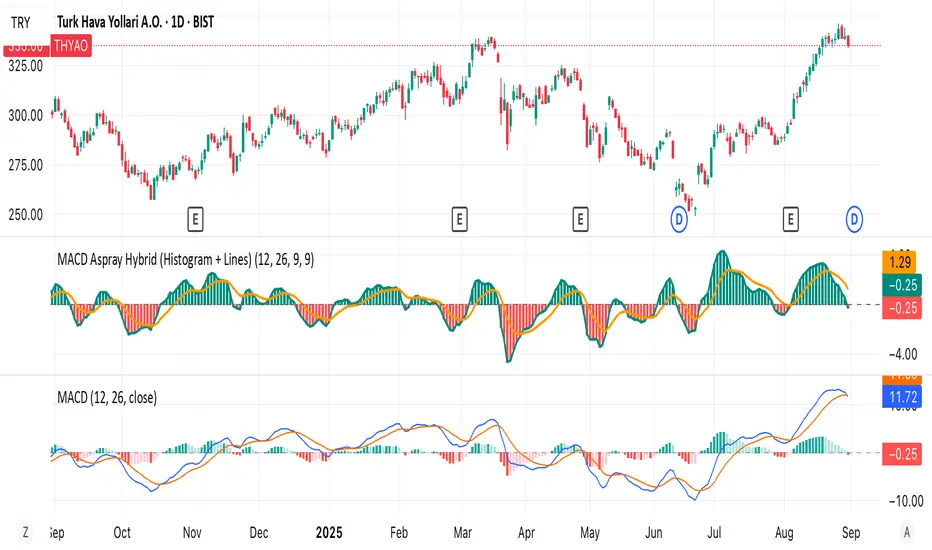
MACD Aspray Hybrid Bars (teal/red) = raw momentum (Aspray Histogram).
Teal line = smooth curve of the histogram (Aspray Line).
Orange line = 9-EMA of that line (new signal).
Zero line for reference.